

Abstract
The pKa values of ionizable groups in proteins report the free energy of site-specific proton binding and provide a direct means of studying pH-dependent stability. We measured histidine pKa values (H3, H22, and H105) in the unfolded (U), intermediate (I), and sulfate-bound folded (F) states of RNase P protein, using an efficient and accurate nuclear magnetic resonance-monitored titration approach that utilizes internal reference compounds and a parametric fitting method. The three histidines in the sulfate-bound folded protein have pKa values depressed by 0.21 ± 0.01, 0.49 ± 0.01, and 1.00 ± 0.01 units, respectively, relative to that of the model compound N-acetyl-L-histidine methylamide. In the unliganded and unfolded protein, the pKa values are depressed relative to that of the model compound by 0.73 ± 0.02, 0.45 ± 0.02, and 0.68 ± 0.02 units, respectively. Above pH 5.5, H22 displays a separate resonance, which we have assigned to I, whose apparent pKa value is depressed by 1.03 ± 0.25 units, which is ~0.5 units more than in either U or F. The depressed pKa values we observe are consistent with repulsive interactions between protonated histidine side chains and the net positive charge of the protein. However, the pKa differences between F and U are small for all three histidines, and they have little ionic strength dependence in F. Taken together, these observations suggest that unfavorable electrostatics alone do not account for the fact that RNase P protein is intrinsically unfolded in the absence of ligand. Multiple factors encoded in the P protein sequence account for its IUP property, which may play an important role in its function.
Electrostatic interactions are an important determinant of biomolecular structure and function and play a central role in modulating stability.1 Ionizable group pKa values provide a sensitive and specific probe of the electrostatic component of the energetics of salt bridges,2 buried charged groups,3 catalytic groups in enzyme active sites,4 and protein conformational equilibria.5 The pH dependence of protein stability is reflected in differences in pKa values of charged groups in the folded and unfolded states. Histidine residues in particular play a critical role in protein folding and function. With pKa values near the physiological pH range, they can act as an acid or base and exist in either neutral or positively charged states. Thus, the protonation state of histidine actively controls charge balance and in many cases is strongly coupled to the stability of a protein.
Addition of a proton to an ionizable group in a protein is equivalent to a ligand binding reaction, where the ligand is a proton. The effect of this binding on protein stability results from thermodynamic coupling of the folding and binding reactions, as depicted in Scheme 1. In this scheme, C1 and C2 represent alternative protein conformations and C1H+ and C2H+ represent their proton-bound forms, respectively. Numerous experimental studies have examined the effect of proton binding on the stability of proteins by measuring pKa values.6–9 To date, most of these NMR investigations have focused on the native state and less on the unfolded state because its low population under physiological conditions makes observation in standard experiments difficult. Denaturing conditions and peptide fragments have been used as a model for the unfolded state and demonstrate that pKa values measured with simple model compounds do not accurately represent the values in the unfolded state.10,11 Tollinger et al. measured both unfolded and folded pKa values for the N-terminal SH3 domain from the drk protein under non-denaturing conditions, taking advantage of the fact that it exists in an approximate 1:1 equilibrium between native and unfolded conformations at neutral pH.12 Here, we take advantage of the intrinsically unfolded (IUP) property of the protein subunit of Bacillus subtilis RNase P holoenzyme (P protein) to measure the histidine pKa values (H3, H22, and H105) of its unfolded (U), partially folded (I), and sulfate-bound folded (F) states. The locations of these groups are shown in Figure 1. The histidine residues are solvent accessible and well distributed on the protein in all three conformational states.
Scheme 1.
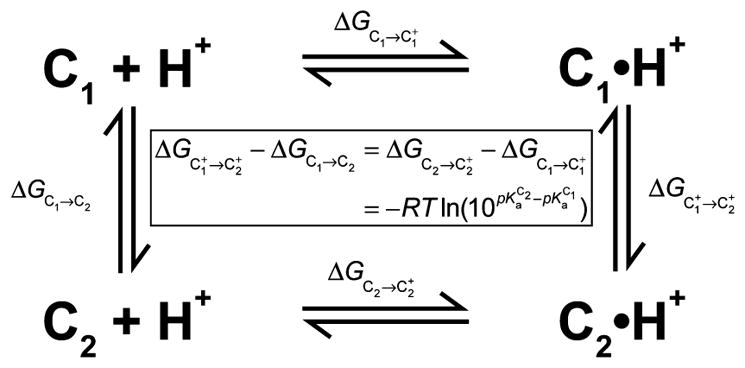
Thermodynamic Cycle for Coupled Proton Binding and Conformational Change
Figure 1.

Electrostatic surface potential of the sulfate-bound folded state of B. subtilis RNase P protein (Protein Data Bank entry 1A6F).35 (A) Front and side views of the electrostatic surface potential of P protein show that this protein is highly basic. Positively and negatively charged surfaces are colored blue and red, respectively. (B) Front and side views of the ribbon model of P protein show the three histidine residues in green (H3, H22, and H105) and a close-up of the sulfate binding site located between the second α-helix and N-terminus. The electrostatic surface potential was calculated using APBS44 and visualized in Chimera.45
Like many other RNA binding proteins, P protein is highly charged. It is comprised of 11 Arg, 19 Lys, 3 His, 4 Asp, and 9 Glu residues. P protein is predominantly unfolded when not bound to its cognate RNA or small molecule anions. Under these low-ionic strength conditions, the populations of U and I are ~85 and 15%, respectively, with no detectable folded protein.13 The tendency to unfold to U or I under these conditions was previously attributed to the large net charge, which would produce more unfavorable electrostatic interactions in the more compact folded state than in the unfolded state.13 Addition of various small anions (e.g., sulfate) or the osmolyte trimethylamine N-oxide (TMAO) induces the protein to fold to its native α–β structure.14 Circular dichroism,14 NMR paramagnetic relaxation enhancement,15 and stopped-flow fluorescence16 experiments along with isothermal titration calorimetry16 established that P protein has two high-affinity anion binding sites. This property provides experimental control of the conformation of P protein, thereby allowing determination of the pKa values of individual conformational states.
Our previous kinetic and equilibrium studies of TMAO-induced folding of P protein as well as NMR experiments demonstrated the presence of a partially folded intermediate in its folding mechanism.13,15 1H–15N HSQC NMR spectra collected as a function of pH showed that increasing pH, from 5.0 to 7.0 in steps of 1 pH unit, shifts the U–I conformational equilibrium toward I in the absence of sulfate and the I–F equilibrium toward F in the presence of sulfate. These effects were attributed to the unfavorable electrostatic interactions in the more compact forms of the protein.13 Stopped-flow studies showed that binding of pyrophosphate to P protein shifts the conformational equilibrium toward I and F by both increasing the folding rate constants and decreasing the unfolding rate constants.16 The order in which binding and conformational change occur depends on ligand concentration.
In the work described here, we applied an accurate and precise NMR titration approach using internal reference compounds to determine the pKa values of the three histidines in RNase P protein in the U, I, and F conformational states. Because proton binding affinities are coupled to conformational change, it is possible to estimate the electrostatic contribution to the conformational energetics from pKa values. We conclude that the effect of electrostatics on the conformational equilibrium, while detectable, is insufficient to fully explain the IUP property of P protein.
MATERIALS AND METHODS
Expression and Purification of P Protein
The F107W version of P protein used in our previous studies was the default background used here.13 The histidine variants of P protein (H3A, H22A, and H105A) were generated in this background. These site-directed mutational plasmids were constructed using the QuikChange procedure (Stratagene). The F107W and histidine variants were overexpressed in Escherichia coli [BL21(DE3) pLysS] cells and purified via method 1 as previously described17 with the following modifications (B. subtilis strain 168; UniProtKB entry P25814). A single colony was inoculated into 50 mL of LB medium containing 50 μg/mL kanamycin and 17 μg/mL chloramphenicol and grown at 37 °C until the OD600 reached 0.8–0.9. The culture was diluted into two 1 L M9 minimal medium cultures containing the same antibiotics and all 20 amino acids. All amino acids were the L-isomer and included18 0.8 mM Ala, 0.4 mM Arg, 0.4 mM Asn, 0.4 mM Asp, 0.1 mM Cys, 0.6 mM Glu, 0.6 mM Gln, 0.8 mM Gly, 0.4 mM Ile, 0.8 mM Leu, 0.4 mM Lys, 0.2 mM Met, 0.4 mM Phe, 0.4 mM Pro, 10.0 mM Ser, 0.4 mM Thr, 0.1 mM Trp, 0.2 mM Tyr, and 0.6 mM Val. For the F107W variant, histidine labeling was effected by substitution of the unlabeled compound in the medium with [ring-2-13C]-L-histidine (40 mg/L). For the histidine mutants, the minimal medium cultures were enriched with 2 g/L [13C]glucose and 1 g/L [15N]ammonium chloride. The culture was incubated at 37 °C until the OD600 reached 0.8–1.0. Expression of P protein was induced by the addition of 0.4 M isopropyl thio-β-D-galactopyranoside (IPTG), and the culture was incubated for an additional 4–5 h at 37 °C. The cells were harvested by centrifugation at 4 °C (7300g for 20 min) and resuspended in 20 mL of lysis buffer [50 mM Tris (pH 8.0), 5 mM EDTA, and 10% glycerol] per liter of culture broth. The cells were then lysed when the cell suspension was passed through a French pressure cell at 17000 psi. The pooled fractions of P protein that eluted from the second CM Sepharose column were concentrated using Thermo Scientific Pierce Protein concentrators, 9K Molecular Weight Cut Off (MWCO), to a volume of ~1 mL. Then, the remaining protein was buffer exchanged into 6 M guanidine hydrochloride and 50 mM Tris (pH 7.5) and concentrated to a volume of ~750 μL. The concentrated sample was loaded onto an S-100 column equilibrated with 6 M guanidine hydrochloride and 50 mM Tris (pH 7.5) to remove ethylenediaminetetraacetic acid (EDTA) bound to the protein. Fractions containing P protein were pooled and stored at −80 °C. The mass spectrum of the [ring-2-13C]-L-histidine-labeled P protein and each histidine variant was determined to ensure that each contained the desired substitution. The protein NMR samples were dialyzed extensively against water and then the desired buffer. Protein purity was assessed by sodium dodecyl sulfate–polyacrylamide gel electrophoresis with Coomassie blue detection. Protein concentrations were determined by method of Edelhoch19 with an extinction coefficient of 11460 M−1 cm−1 at 280 nm.
Determination of pKa Values Using NMR Spectroscopy
All one- and two-dimensional NMR spectra were recorded on an 800 MHz Varian INOVA spectrometer at 25 °C with a triple-resonance probe. The NMR sample used for the pH titration of unliganded P protein contained 500 μM [13Cε1]− histidine ring-labeled F107W P protein, 10 mM L-histidine, 10 mM pyridine, 10% D2O, 1 mM TMSP, and 0.05% sodium azide. The NMR samples used for the assignment of peaks in the unfolded spectra consisted of 300 μM 15N and 13C doubly uniformly labeled F107W H3A, H22A, or H105A P protein, 10 mM L-histidine, 10 mM pyridine, 10% D2O, 1 mM trimethylsilyl propanoic acid (TMSP), and 0.05% sodium azide. The sample used for the pH titration of liganded P protein was the same as that for unliganded P protein but also contained 20 mM sodium sulfate. pH titrations of liganded P protein were performed with no added NaCl and in 0.15, 0.5, and 1.0 M NaCl. All spectra were referenced against the position of the TMSP peak, whose pH dependence was accounted for.20,21 1H–13C HSQC spectra were collected from pH 4.0 to 8.0. Pyridine was present in the sample to ensure that the solution was well buffered throughout the entire pH range and was chosen because it is not an anion and will not induce folding of P protein. NaOH (1 M) was titrated into the NMR tube using a 5.0 μL Hamilton syringe with polyethylene tubing attached to the tip of the needle. Two-dimensional 1H–13C HSQC experiments were conducted with a spectral width in the 1H dimension of 8012 Hz and 2051 complex points and a spectral width of 10056 Hz and 64 complex points in the 13C dimension. Both dimensions were apodized with a shifted squared sine-bell window function and Fourier transformed using the NMRPipe and NMRDraw suite of programs. Zero filling was also used in the 13C dimension (10056 Hz/256 Hz = 39 Hz per point). The spectra were exported as text files and imported into a Mathematica notebook used to fit the multiple histidine resonances to two-dimensional Gaussian distributions to determine their 1Hε1 and 13Cε1 chemical shifts (see the PeakPicking.nb Mathematica notebook included in the Supporting Information). The pKa values of histidines were obtained by fitting plots of protein histidine chemical shifts versus reference L-histidine chemical shifts to eq 5 (see Results) using Mathematica. The pKa values for the reference L-histidine under conditions without added NaCl and in 0.15, 0.5, and 1.0 M NaCl were obtained by fitting plots of the chemical shifts of the 13Cε1 proton resonance versus pH with the following equation using Mathematica
| (1) |
where δA and δHA are the plateau values of the chemical shifts in the basic and acidic pH limits, respectively, δobs is the observed chemical shift, and n is the Hill coefficient.22,23 The uncertainties in the pKa values and Hill coefficients were obtained from error propagation of the standard errors given by the Mathematica NonlinearModelFit function from the fits of the reference compound titrations and the protein versus reference titrations and are reported as 95% confidence limits ± two standard errors.
The change in ionic strength over the course of a titration is very small. For the protein titrations in the absence and presence of sulfate, the changes in ionic strength were calculated to be 0.012 ± 0.01 and 0.011 ± 0.01 M, respectively.
The chemical shifts of L-histidine in the presence and absence of protein when compared at low and high pH are within experimental error and suggest that the internal standard does not interact with the protein. In addition, the sulfate-bound folded state data were fitted using pyridine as the internal standard, and the results are identical to those obtained using L-histidine as the internal standard (shown in Figure S8), which suggests that neither pyridine nor L-histidine interacts with the protein.
The solvent accessibilities of the histidine side chains were calculated using GETAREA.24
Calculation of pH-Dependent Stability
If the pKa values are known for two different conformational states of a protein, then it is possible to estimate the pH-dependent stability of the protein and the following Tanford–Wyman linkage relationship applies:25
| (2) |
where ΔQ is the difference in number of protons bound to the two conformational states that in this case are the intermediate and unfolded states. The integrated form of the equation can be expressed as a summation over the unfolded and intermediate state pKa values, provided that the titration behavior can be described as a set of independently titrating sites.11
| (3) |
where superscripts I and U refer to the intermediate and unfolded states, respectively, i identifies the residue, N is the number of histidines in the protein, R is the gas constant, T is the temperature in kelvin, and are the pKa values for the ith group in the intermediate and unfolded states, respectively, and pHref is the pH at an arbitrarily chosen reference pH, chosen here to be 7.0. To generate the calculated curve, the ΔΔGU→I values were subtracted from the value of 1.0 ± 0.2 kcal/mol obtained from the experimentally measured stability from urea denaturation and TMAO folding experiments at pH 7.0.13 This is why the experimental value and calculated curve agree at pH 7. Over the pH range of 4.0–8.0 covered in this study, histidine is the only group likely to titrate, and thus, one can predict the pH dependence of the U ⇌ I equilibrium if the histidine pKa values for both U and I in the absence of sulfate are known.
Determination of Tautomeric State Populations
Both NMR samples used for the tautomer assignments consisted of 300 μM 13C uniformly labeled F107W P protein, 10 mM L-histidine, 10 mM pyridine, 10% D2O, 1 mM TMSP, and 0.05% sodium azide. The tautomeric state populations of the neutral form of the protein histidines and N-Ac-His-NH-CH3 were determined in the presence and absence of 20 mM NaSO4 by measuring the chemical shifts of the 13Cδ1 nuclei in the His side chains as a function of pH. The spectra were exported as text files and imported into the PeakPicking.nb Mathematica notebook included in the Supporting Information. This notebook was used to fit the multiple histidine resonances to two-dimensional Gaussian distributions to determine the chemical shifts of the observed 13Cδ2 doublets, which were then averaged. These data were fitted to the following equation using the NonlinearModelFit function of Mathematica:
| (4) |
where δHis is the chemical shift of the His 13Cδ1, δAH is the chemical shift of the fully protonated His side chain, pKa is the pKa value of the His, and Fε is the fraction of the His side chain in the Nε2H tautomeric state, as opposed to the alternative Nδ1H state. Equation 4 is based on a change in chemical shift upon deprotonation of −2.1 ppm for the Nε2H tautomer and 7.1 ppm for the Nδ1H tautomer given by Platzer et al.38 Because the titration results indicate Hill coefficients very close to 1, they have been omitted from eq 4.
RESULTS AND DISCUSSION
Measuring pKa Values without a pH Electrode
Although they are relatively straightforward to conduct, conventional NMR-monitored pH titration experiments require multiple samples and a pH measurement before and after acquisition of each spectrum. The titration experiments presented here do not require pH measurement because an internal standard or reference acts as an NMR-detected pH meter. Several compounds have been used in the past for this purpose.26–30 Using this approach, only one sample is needed to generate an entire titration curve, and it is not removed from the NMR tube between points. This procedure conserves protein and allows the use of a higher-concentration NMR sample. The pKa of the reference must be measured separately in the same buffer used for the protein titration and can be obtained by fitting chemical shifts versus pH (as measured by a carefully calibrated pH electrode in an ~30 mL solution) to eq 1 (see Materials and Methods). Once the chemical shifts of the desired residues and reference from the protein titration are determined, the resulting parametric plots can be fit to determine protein pKa values using the following equation:
| (5) |
where δA and δAH are the plateau values of the protein histidine chemical shifts in the basic and acidic pH limits, respectively, δR and δRH are the plateau values of the reference chemical shifts in the basic and acidic pH limits, respectively, δp and δr are the observed chemical shifts of the protein histidine and reference, respectively, nR and nA are the Hill coefficients for the reference and protein histidine, respectively, and pKR and pKA are the dissociation constants for the reference and protein histidines, respectively. (pKR and nR were fixed to the values obtained from the fits of the internal standard shown in Figure S2.) These fits reveal the difference between the pKa of the protein residue and the pKa of the reference ( ). If the two pKa values are the same, a plot of the protein versus reference chemical shifts is a diagonal line with a slope of 1. If the two pKa values are different, there is a deviation from linearity whose curvature (concave or convex) depends on the sign of ΔpKa (see the inset of Figure 2B). It is important to note that the internal standard chosen must have a pKa value that is close (within ±1 pH unit interval) to the pKa value of the protein ionizable group or the parametric curve will be too steep to allow accurate estimation of the pKa. This method differs from the most similar previous method31 in that the chemical shifts of the titrating standard are directly used in a parametric equation (eq 5) to determine the unknown pKa values. Also, all acid–base equilibria must be in the fast exchange regime for the chemical shift equations to hold as written. The equilibria observed here were in fast exchange because neither multiple resonances nor extensive line broadening due to intermediate exchange was observed.
Figure 2.

Titration curves following the proton resonance of pyridine in the absence of 20 mM sodium sulfate. The black lines are the best fitting results using (A) eq 1 and (B) eq 5 along with the previously calculated pKa of internal standard L-histidine of 6.08 ± 0.01 (see Figure S2). The estimated pKa of pyridine was (A) 5.34 ± 0.01 and (B) 5.35 ± 0.04.
One of the advantages of using an internal standard to measure sample pH rather than a pH electrode is that the apparent Hill coefficient of the histidine of interest is not influenced by errors in pH measurement, which can lead to nonunitary Hill coefficients in cases in which there is no neighboring titratable charge. As long as the pKa and n values of the internal standard reference compound are well-known, the Hill coefficient estimated from fits of parametric plots of protein His chemical shift versus internal standard chemical shift to eq 5 should accurately reflect the electrostatic environment of the protein His.
pKa Values of Pyridine Determined from Two Methods Are in Good Agreement
To establish the feasibility of the approach described above, we first measured the pKa values of L-histidine and pyridine in the same buffer used for the P protein titration using one-dimensional (1D) 1H NMR. First, pKa values were obtained in the conventional fashion by making separate samples whose pH was determined by the pH electrode. The pyridine 1H–C3,5 chemical shift for each sample was plotted versus pH and fit to eq 1. In addition, the 1H–C3,5 chemical shift for pyridine was plotted versus the 1Hε1–13Cε1 chemical shift for L-histidine and fit to eq 5. The pKa values determined for pyridine by the two methods are in very good agreement. The pH electrode measurement gave a pyridine pKa value of 5.34 ± 0.01, and our method gave a value of 5.35 ± 0.04 (Figure 2). Therefore, having established that our approach provides accurate pKa values, we next focused on the three histidines in P protein.
P Protein His pKa Values Determined without a pH Electrode
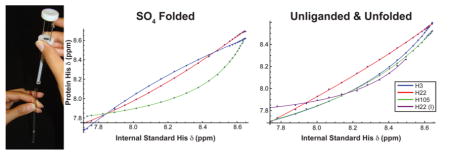
Chemical shifts of the 1Hε1–13Cε1 resonances of P protein histidines were determined by 1H–13C HSQC NMR spectroscopy, over a pH range of 4.0–8.0 using a series of 0.05–0.4 μL increments of NaOH, added via a 5.0 μL positive displacement syringe whose needle was extended with polyethylene tubing long enough to reach below the meniscus of the NMR sample (see Figure S1). Care was taken to ensure that all of injected NaOH solution reached the sample, which was subsequently well mixed by centrifugation. The frequencies of both nuclei (1Hε1 and 13Cε1) were recorded for each protein histidine. The reference L-histidine and the resulting parametric correlations were fit to eq 5 to determine the pKa values of the protein histidines. The absolute pKa values of the protein histidines were determined using a pKa value of the internal standard, L-histidine, measured using 1D 1H NMR (Figure S2). Figure 3 shows the protein histidine 1H chemical shifts versus L-histidine chemical shifts titration curves for sulfate-bound folded (A) and unfolded (B) P protein. For 1Hε1 chemical shifts, if the pKa of the protein histidine is lower than that of L-histidine, the plot will curve below the diagonal line, and if it is greater, it will curve above. The opposite trends are observed with the 13Cε1 plots (Figure S3). A total of 30 and 31 spectra were collected for the pH titrations of sulfate-bound folded and unfolded P protein, respectively. NMR experiments with histidine to alanine substitution mutants were used to assign residue numbers to each of the three histidine resonances in the F and U state spectra of P protein (see Figure S4).
Figure 3.

1Hε1 P protein histidine chemical shift vs 1Hε1 L-histidine (internal standard) chemical shift titration curves for (A) sulfate-bound folded and (B) unfolded P protein.
The pKa Values of H3, H22, and H105 Are Depressed in U and F
Measured pKa values are sensitive probes of the electrostatic environment of a protonatable group. If a protonated histidine side chain is involved in a favorable electrostatic interaction such as a salt bridge, it will be harder to deprotonate and will have a pKa value higher than that of histidines in an uncharged environment. On the other hand, if the histidine side chain is near other positive charges, it will be easier to deprotonate and will have a lower pKa value. Nonspecific Coulombic interactions experienced by the protonated histidines in a polypeptide with a net charge of +17 should be repulsive and result in depressed pKa values. As a model of a histidine side chain in an electrostatically neutral environment, we used N-acetyl-L-histidine methylamide. The pKa values measured for this compound were 6.44 ± 0.02 and 6.52 ± 0.03, in the two buffers used in this study (Figure S5). When compared to the model compound, N-acetyl-L-histidine methylamide, all three histidines have pKa values that are lower in both the U and F states of P protein. The 1Hε1 and 13Cε1 NMR chemical shifts were used to determine the P protein histidine pKa values listed in Table 1 and Table S1, respectively. The Hill coefficients, which reflect deviations from ideal single-site titration and errors in pH, are also listed in Table 1 and S1. These pKa values are similar to those measured in the folded state of another positively charged protein, staphylococcal nuclease (SNase) (pI >10) at low ionic strengths.32 The observed pKa depressions are also in contrast to those of the negatively charged protein RNase T1 (pI 3.5) where all three of its histidine residues have elevated pKa values ranging from 7.2 to 7.8.33
Table 1.
Histidine pKa Values and Hill Coefficients of N-Acetyl-L-histidine Methylamide and Three Histidines in Unfolded, Intermediate, and Sulfate-Bound Folded P Proteina
| Buffer Conditions | ||||||
|---|---|---|---|---|---|---|
| [Na2SO4] | 20 ± 1 mM | 0 | 0 | 20 ± 1 mM | 20 ± 1 mM | 20 ± 1 mM |
| [NaCl] | 0 | 0 | 0 | 0.15 ± 0.01 M | 0.50 ± 0.01 M | 1.00 ± 0.01 M |
| ionic strengthb | 80 ± 1.4 mM | 20 ± 1 mM | 20 ± 1 mM | 0.23 ± 0.01 M | 0.58 ± 0.01 M | 1.08 ± 0.01 M |
| State pKa | ||||||||||||
|---|---|---|---|---|---|---|---|---|---|---|---|---|
| Histidine |
|
|
|
|
|
|
||||||
| N-Ac-His-NH-Mec | 6.52 ± 0.03 | 6.44 ± 0.02 | 6.44 ± 0.02 | – | – | – | ||||||
| His 3 | 6.31 ± 0.01 | 5.71 ± 0.02d | 5.71 ± 0.02d | 6.16 ± 0.02 | 6.25 ± 0.01 | 6.23 ± 0.03 | ||||||
| His 22 | 6.03 ± 0.01 | 5.41 ± 0.25 | 5.99 ± 0.02 | 5.95 ± 0.02 | 6.11 ± 0.03 | 5.99 ± 0.01 | ||||||
| His 105 | 5.52 ± 0.01 | 5.76 ± 0.02d | 5.76 ± 0.02d | 5.46 ± 0.01 | 5.61 ± 0.01 | 5.73 ± 0.02 | ||||||
| State Hill Coefficient | ||||||
|---|---|---|---|---|---|---|
| Histidine | nF | nI | nU | nF | nF | nF |
| N-Ac-His-NH-Mec | 1.09 ± 0.05 | 1.09 ± 0.05 | 1.09 ± 0.05 | – | – | – |
| His 3 | 1.02 ± 0.04 | 1.04 ± 0.05d | 1.04 ± 0.05d | 0.99 ± 0.03 | 0.93 ± 0.02 | 1.03 ± 0.07 |
| His 22 | 1.07 ± 0.03 | 1.09 ± 0.21 | 1.02 ± 0.05 | 1.00 ± 0.03 | 0.95 ± 0.05 | 1.03 ± 0.03 |
| His 105 | 1.01 ± 0.03 | 1.04 ± 0.05d | 1.04 ± 0.05d | 0.98 ± 0.02 | 0.95 ± 0.03 | 0.98 ± 0.05 |
Solutions contained 10 mM L-histidine, 10 mM pyridine in 90% H2O, 10% D2O at 25 °C with either 0 or 20 mM sodium sulfate. The pKa values were obtained by fitting the data to eq 5. The 1Hε1 shifts were used to determine the pKa values. Errors represent 95% confidence limits and were obtained as described in Materials and Methods.
Ionic strengths were calculated including all buffer components.
N-acetyl-L-histidine methylamide.
Values based on the inability to distinguish U and I resonances for these residues.
P protein was examined over a relatively small pH range, 4.0–8.0, corresponding to the expected titration range for histidine, glutamate, and the N-terminus. The average pKa values for glutamate and the N-terminus are 4.2 and 7.7, respectively.34 These values are more than 1 pH unit from any of the pKa values measured for the P protein histidines. For this reason, we conclude that the titration of glutamate residues and the N-terminus does not significantly affect the pKa measurements of the histidines.
Electrostatic Repulsion Is Greater in the More Compact Folded State
H105 titrates with a pKa value that is 0.3 units lower in F than in U, as expected because the positive charge density should be greater in the more compact and less dynamic F state. As seen in Figure 1, H105 is located in the folded structure on the third α-helix, and its surrounding microenvironment is electropositive. H105 is the least solvent-exposed of the three histidine residues in F, which places it in a lower-dielectric environment (Table S2). This amplifies the charge–charge interactions between itself and other charged groups like K109 (6.3 Å away in F) and contributes to its lower pKa value.
P Protein Histidine Side Chains Are Well-Solvated in both U and F
Although the pKa values of the three histidines in P protein are depressed in all states, the depression is not as great as might be expected for such a basic protein. This moderate suppression could be explained by effective electrostatic screening by solvent water, which would minimize electrostatic interactions with other charges on the protein. Two lines of evidence support this conclusion. First, the Hill coefficients we measured for all three histidines in all states are very close to 1, indicating that the cotitration of the other histidines and any carboxylates with elevated pKa values has no effect on the protonation of each His site. Second, the tautomeric states of all three histidines in both U and F are nearly identical to that of N-acetyl-L-histidine methylamide, which presumably interacts with only water to determine its tautomer equilibrium (Figure S9). These results strongly suggest that P protein histidines are surrounded by water molecules whose dipole moments effectively screen the charged form of the side chain from strong electrostatic interactions with the rest of the protein. This effect minimizes the energetic perturbation caused by protonation of the histidines. If such strong screening occurs at other charged residues, electrostatics may play a relatively small role in the low stability of unliganded P protein. This conclusion calls into question the usual assumption that a large net charge predisposes a protein to be intrinsically unfolded.
The H3–SO4 Salt Bridge Contributes Moderately to the Stability of the Sulfate-Folded State
In contrast to that of H105, the pKa of H3 is 0.6 units higher in F than in U, which can be rationalized by examining the crystal structure of P protein shown in Figure 1B.35 H3, along with R9 and R68, coordinates the sulfate ion bound at the anion binding site between the second α-helix and the N-terminus in the folded protein. It is apparent that the pKa of H3 should be increased by the salt bridge it forms with the sulfate ion (3.4 Å away). This region of P protein offers a favorable environment for sulfate association, and the crystal structure of Reiter et al. suggests that its cognate binding partner, P RNA, forms a similar salt bridge with the phosphate backbone of the RNA and the region of the protein where H3 is located.36 H3 likely plays a key role in both of these binding reactions. However, the difference in pKa values between U and F corresponds to an only −0.82 ± 0.02 kcal/mol contribution to the folding free energy due to proton binding at H3 (see Scheme 1). This relatively small contribution to the stability of the protein is insufficient to elevate the pKa of H3 above that of N-acetyl-L-histidine methylamide and is a relatively small fraction of the stability of the sulfate-bound folded protein. In general, solvent-exposed salt bridges seem to play a relatively small role in stabilizing proteins, while buried ion pairs make much larger contributions. The surface salt bridge in ubiquitin between K11 and E34 was estimated to contribute favorably by 0.86 kcal/mol.37 In both P protein and ubiquitin, the stabilization is modest in comparison to that of the buried ion pairs found in chymotrypsin and T4 lysozyme that stabilize those proteins by 3–5 kcal/mol.2,7
The moderate stabilization by the H3–SO4 salt bridge is apparently not enhanced by a hydrogen bond between the H3 side chain and a sulfate oxygen, which would affect the tautomeric state populations if it were present. On the basis of model compounds, deprotonation of histidine to its Nε2H tautomeric form leads to a chemical shift change of approximately −2 ppm (i.e., upfield) for 13Cδ2, whereas the opposite change of approximately 7 ppm results from formation of the Nδ1H tautomer.38 Upfield changes in 13Cδ2 shift observed for H3, H22, and H105 with increasing pH (Figure S9) indicate that the Nε2H tautomer is preferentially adopted in both the unfolded and sulfate-bound folded states. Although the crystal structure of the folded protein shows H3 in the proximity of a bound sulfate,35 the distance between Nδ1 and the closest sulfate oxygen is 2.9 Å, a distance much longer than His N–HO H-bonds observed in proteins.45 Apparently, the P protein histidines are well-solvated by water and therefore adopt the same tautomer preferred by the model compound.
The P Protein H22 Residue Is Influenced by an α-Helix Dipole
Unlike H3, the pKa of H22 remains unchanged and its pKa in F is within uncertainty of its pKa in U. H22 is located on the negatively charged C-terminal end of the first α-helix in P protein that extends from residue 13 to 22. The orientation of H22 with respect to the α-helix [it is flipped out away from the helix (see Figure 1B)] suggests that the histidine residue does not likely form a hydrogen bond with a carbonyl oxygen of the backbone. Thus, the lack of folding-induced depression of the H22 pKa value may be due to a favorable electrostatic interaction with the helix dipole that compensates for the presumed increase in positive charge density. Such helix favorable His+–helix dipole interactions have been previously reported.39,40
Helices 1 and 3 Are Unfolded in I
An extra histidine peak, which we assigned to H22 (see Figures S6 and S7), was observed in the P protein NMR spectra when no ligand was present. The intensity of this peak increases from below the detection limit at pH <5.5 to approximately 20 ± 5% of the H22 U peak at pH 6.5. This observation suggests that the extra peak corresponds to a H22 in the I state because previous studies showed that the population of I increases with pH.15 The two sharp H22 cross-peaks observed in the HSQC spectrum indicate that U and I are in slow exchange relative to the difference in frequency (kex ≪ 250 s−1), which is consistent with a previous measurement of the rate constants of this reaction by stopped-flow fluorescence (kex = kUI + kIU = 2.1 ± 0.3 s−1).13 The relatively large frequency difference between the U and I H22 peaks at most pH values indicates that the residue is found in quite different magnetic environments in the two species. H22 is located at the end of the first α-helix, while H3 and H105 are located on the first and third α-helices, respectively; the absence of extra peaks for residues H3 and H105 suggests that they are in very similar magnetic environments in U and I. This observation suggests that helices 1 and 3 are likely unfolded in I, which is consistent with our previous observations.15 The pKa measurements reveal that the pKa of H22 in the intermediate state is depressed relative to those in both the unfolded and folded states. In contrast to the compensating effects of the helix dipole and charge density of F described above, the absence of helix 1 in I precludes this compensation and the increased intramolecular charge repulsion due to the folded central β-sheet and helix 2 in I is the likely cause of the depressed pKa of H22.
H22 Is the Source of the pH Dependence of the Unliganded U to I Equilibrium
Given the histidine pKa values for both U and I in the absence of sulfate, one can predict the pH dependence of the U ⇌ I equilibrium. Scheme 1 can be used to depict the coupled folding and deprotonation reactions between the U and I states at a particular histidine. U with a protonated histidine is represented as C1H+, protonated I as C2H+, deprotonated U as C1, and deprotonated I as C2. The effect of histidine deprotonation on the free energy of the U ⇌ I equilibrium can be calculated using the equation given in Scheme 111 (see Materials and Methods). Because H3 and H105 have single NMR resonances, we assume that their magnetic environments and therefore electrostatic environments are nearly identical in U and I, which is consistent with our previous studies indicating that these residues are found in the unfolded regions of I. On this basis, we assume that only the deprotonation of H22 perturbs the relative populations of unliganded U and I between pH 4 and 8 and shifts the U ⇌ I equilibrium toward I. The pKa of H22 for the I state is lower than for the U state [corresponding to ΔGU→I − ΔGU+→I+ = −0.86 ± 0.09 kcal/mol (see Scheme 1)] and contributes to the stability profile of the protein by stabilizing I relative to U as the pH increases (Figure 4). This lower pKa value indicates more favorable interactions when H22 is deprotonated in I than in U. The free energy of forming I from U becomes even more positive (unfavorable) at low pH when H22 is protonated, which suggests that H22 is the primary source of the pH dependence of the unliganded U to I equilibrium in the physiological pH range. We can also conclude that lowering the net charge by 3 units does not significantly populate the unliganded F state.
Figure 4.

Calculated free energy of the U → I reaction based on . The point at pH 7 is derived from equilibrium cotitration experiments using both TMAO and urea.13 The curve is calculated using this estimate and the pKa values listed in Table 1 and eq 3 (see Materials and Methods).
The pKa Values of Sulfate-Folded P Protein His Have a Weak Ionic Strength Dependence
The effect of ionic strength was determined by measuring the pKa values of the sulfate-bound folded state in the presence of 0.15, 0.5, and 1.0 M NaCl (Figure 5A–C). The results show that the histidine residues in P protein have a weak ionic strength dependence and shift their pKa values by only 0.1–0.2 units between ionic strengths of 0.08 and 1.08 M (Table 1). P protein has a large net positive charge, and screening by solution anions might be expected to reduce the pKa depression, as in the case of wild-type SNase where three of four histidine residues exhibited increases of approximately 1 full pKa unit when the ionic strength was increased from 0 to 1.5 M.32 The authors of this study concluded that in the case of positively charged SNase, high salt sensitivity arises from screening of long-range Coulombic interactions, which in a highly charged protein can add up to yield substantial effects. The lack of a strong ionic strength dependence of histidine pKa values in P protein, whose net charge is similar to that of SNase, is therefore surprising. A likely explanation for the weak ionic strength dependence of P protein is the association of sulfate ions with many different sites on the protein surface in addition to the high-affinity specific binding sites observed in the crystal structure.16 The apparent affinities of sulfate and chloride at the high-affinity sites differ by a factor of 100,14 meaning that 20 mM sulfate can be displaced from these sites by only 2 M chloride. If this ratio of sulfate and chloride affinities applies to the nonspecific sites also, then the effect of adding chloride would be minimal at concentrations below 2 M. By this scenario, divalent sulfate interacts weakly but favorably with most or all of the positively charged groups in P protein, including protonated histidines. In support of this interpretation, previous studies have determined the pKa values of the histidine side chain of model compounds, myoglobin, and lysozyme and observed increases of 0.3–0.4 units between 0.02 and 1.5 M NaCl.41 Kao et al. attributed these changes to favorable interactions between the charged form of the imidazole moiety and solution counteranions at high salt concentrations rather than screening of unfavorable electrostatic interactions. We interpret the weak ionic strength dependence of P protein histidine pKa values in a similar way: favorable interactions between the divalent sulfate ion and the positive surface of P protein effectively eliminate inter-residue electrostatic interactions. Similar interactions in the cell may play the same role, thus suggesting that unfavorable electrostatics may have little or nothing to do with the low stability of P protein and its intrinsically unfolded property.
Figure 5.

1Hε1 P protein histidine chemical shift vs 1Hε1 L-histidine chemical shift titration curves for the sulfate-folded state in the presence of (A) 0.15, (B) 0.5, and (C) 1.0 M NaCl. The gaps are from peaks that could not be resolved because they overlapped with another peak.
In conclusion, our data show that the conformational equilibrium between the unfolded and partially folded intermediate states of P protein is favored by the deprotonation of H22. The magnitude of this stabilization is energetically equivalent to the effect of deprotonation of all three histidines on the U to F equilibrium, although the origins of these two stabilizations are probably different. In contrast to another highly basic protein, SNase, the ionic strength does not have a significant effect on the histidine pKa values of folded P protein in the presence of 20 mM Na2SO4, perhaps because of nonspecific association of sulfate with positively charged side chains. This result implies that pairwise electrostatic interactions in folded P protein are weak and, furthermore, suggests that in general, electrostatic forces do not play a large role in the energetics of this protein.
In addition, it is interesting to note that the intramolecular charge repulsion in U appears to be only somewhat relieved by polypeptide expansion and flexibility because all of the histidine pKa values are still depressed in comparison to those of model compounds. In contrast to this result, previous studies of the unfolded state measured pKa values of negatively charged groups that were ~0.3 units lower than those of model compounds, suggesting that the net Coulombic interactions in the U state are generally stabilizing.11,42,43 It is unlikely that the depression of His pKa values in P protein can be explained in terms of local interactions with other positively charged residues nearby in the amino acid sequence. Of the three histidines, only H22 has neighboring basic groups, and it has the least depressed pKa in U. It is possible that these low pKa values are governed by solvation effects in addition to a high net charge. Coulomb’s law [U = Σ(kq1q2)/(εr12)] reveals that the energy of interaction between an ionizable group and another charge on a protein can be influenced by the charge of either group, the distance between them, and the local dielectric constant of the medium in which they reside. The presence of the unfolded polypeptide chain could reduce the solvent accessibility of the histidine side chains, thereby reducing the polarizability of the environment around the histidines. This partial desolvation would reduce the dielectric constant, which would decrease the histidine pKa values. In future studies, we plan to obtain more quantitative estimates of the effect of the dielectric constant on histidine pKa values by employing our method to measure the pKa values of histidine in model compounds and polypeptides as a function of solvent dielectric constant.
Supplementary Material
Acknowledgments
Funding
Supported by National Institutes of Health Grants RO1GM061367 and T32GM008487; and the Dean of the Duke University School of Medicine.
We thank Drs. Ronald Venters and Anthony Ribiero for technical assistance with the NMR experiments.
ABBREVIATIONS
- F
sulfate-bound state of P protein
- HSQC
heteronuclear single-quantum coherence
- I
intermediate state of P protein
- IUP
intrinsically unfolded protein
- NMR
nuclear magnetic resonance
- P protein
protein subunit of B. subtilis ribonuclease P
- P RNA
RNA subunit of B. subtilis ribonuclease P
- pI
isoelectric point
- RNase P
ribonuclease P
- RNase T1
ribonuclease T1
- SH3
Src homology 3
- SNase
staphylococcal nuclease
- TMAO
trimethylamine N-oxide
- U
unfolded state of P protein
Footnotes
Notes
The authors declare no competing financial interest.
The Supporting Information is available free of charge on the ACS Publications website at DOI: 10.1021/acs.biochem.5b00138.
Figures S1–S9 and Tables S1–S3 (PDF)
Mathematica notebook (ZIP)
References
- 1.Honig B, Nicholls A. Classical Electrostatics in Biology and Chemistry. Science. 1995;268:1144–1149. doi: 10.1126/science.7761829. [DOI] [PubMed] [Google Scholar]
- 2.Fersht AR. Conformational equilibria and the salt bridge in chymotrypsin. Cold Spring Harbor Symp Quant Biol. 1972;36:71–73. doi: 10.1101/sqb.1972.036.01.012. [DOI] [PubMed] [Google Scholar]
- 3.Plesniak LA, Connelly GP, McIntosh LP, Wakarchuk WW. Characterization of a buried neutral histidine residue in Bacillus circulans xylanase: NMR assignments, pH titration, and hydrogen exchange. Protein Sci. 1996;5:2319–2328. doi: 10.1002/pro.5560051118. [DOI] [PMC free article] [PubMed] [Google Scholar]
- 4.Montero-Morán GM, Lara-González S, Álvarez-Añorve LI, Plumbridge JA, Calcagno ML. On the Multiple Functional Roles of the Active Site Histidine in Catalysis and Allosteric Regulation of Escherichia coli Glucosamine 6-Phosphate Deaminase†. Biochemistry. 2001;40:10187–10196. doi: 10.1021/bi0105835. [DOI] [PubMed] [Google Scholar]
- 5.Perutz MF, Gronenborn AM, Clore GM, Fogg JH, Shih DTb. The pKa values of two histidine residues in human haemoglobin, the Bohr effect, and the dipole moments of α-helices. J Mol Biol. 1985;183:491–498. doi: 10.1016/0022-2836(85)90016-6. [DOI] [PubMed] [Google Scholar]
- 6.Markley JL. Observation of histidine residues in proteins by nuclear magnetic resonance spectroscopy. Acc Chem Res. 1975;8:70–80. [Google Scholar]
- 7.Anderson DE, Becktel WJ, Dahlquist FW. pH-Induced denaturation of proteins: a single salt bridge contributes 3–5 kcal/mol to the free energy of folding of T4 lysozyme. Biochemistry. 1990;29:2403–2408. doi: 10.1021/bi00461a025. [DOI] [PubMed] [Google Scholar]
- 8.Sato S, Raleigh DP. pH-dependent Stability and Folding Kinetics of a Protein with an Unusual α–β Topology: The C-terminal Domain of the Ribosomal Protein L9. J Mol Biol. 2002;318:571–582. doi: 10.1016/S0022-2836(02)00015-3. [DOI] [PubMed] [Google Scholar]
- 9.Hansen AL, Kay LE. Measurement of histidine pKa values and tautomer populations in invisible protein states. Proc Natl Acad Sci U S A. 2014;111:E1705–E1712. doi: 10.1073/pnas.1400577111. [DOI] [PMC free article] [PubMed] [Google Scholar]
- 10.Roxby R, Tanford C. Hydrogen ion titration curve of lysozyme in 6 M guanidine hydrochloride. Biochemistry. 1971;10:3348–3352. doi: 10.1021/bi00794a005. [DOI] [PubMed] [Google Scholar]
- 11.Kuhlman B, Luisi DL, Young P, Raleigh DP. pKa Values and the pH Dependent Stability of the N-Terminal Domain of L9 as Probes of Electrostatic Interactions in the Denatured State. Differentiation between Local and Nonlocal Interactions†. Biochemistry. 1999;38:4896–4903. doi: 10.1021/bi982931h. [DOI] [PubMed] [Google Scholar]
- 12.Tollinger M, Forman-Kay JD, Kay LE. Measurement of Side-Chain Carboxyl pKa Values of Glutamate and Aspartate Residues in an Unfolded Protein by Multinuclear NMR Spectroscopy. J Am Chem Soc. 2002;124:5714–5717. doi: 10.1021/ja020066p. [DOI] [PubMed] [Google Scholar]
- 13.Chang YC, Oas TG. Osmolyte-Induced Folding of an Intrinsically Disordered Protein: Folding Mechanism in the Absence of Ligand. Biochemistry. 2010;49:5086–5096. doi: 10.1021/bi100222h. [DOI] [PMC free article] [PubMed] [Google Scholar]
- 14.Henkels CH, Kurz JC, Fierke CA, Oas TG. Linked Folding and Anion Binding of the Bacillus subtilis Ribonuclease P Protein†. Biochemistry. 2001;40:2777–2789. doi: 10.1021/bi002078y. [DOI] [PubMed] [Google Scholar]
- 15.Chang YC, Franch WR, Oas TG. Probing the Folding Intermediate of Bacillus subtilis RNase P Protein by Nuclear Magnetic Resonance. Biochemistry. 2010;49:9428–9437. doi: 10.1021/bi100287y. [DOI] [PMC free article] [PubMed] [Google Scholar]
- 16.Daniels KG, Tonthat NK, McClure DR, Chang YC, Liu X, Schumacher MA, Fierke CA, Schmidler SC, Oas TG. Ligand Concentration Regulates the Pathways of Coupled Protein Folding and Binding. J Am Chem Soc. 2014;136:822–825. doi: 10.1021/ja4086726. [DOI] [PMC free article] [PubMed] [Google Scholar]
- 17.Niranjanakumari S, Kurz JC, Fierke CA. Expression, purification and characterization of the recombinant ribonuclease P protein component from Bacillus subtilis. Nucleic Acids Res. 1998;26:3090–3096. doi: 10.1093/nar/26.13.3090. [DOI] [PMC free article] [PubMed] [Google Scholar]
- 18.Wanner BL, KR, Neidhardt FC. Physiological Regulation of a Decontrolled lac Operon. J Bacteriol. 1977;130:212–222. doi: 10.1128/jb.130.1.212-222.1977. [DOI] [PMC free article] [PubMed] [Google Scholar]
- 19.Edelhoch H. Spectroscopic determination of tryptophan and tyrosine in proteins. Biochemistry. 1967;6:1948–1954. doi: 10.1021/bi00859a010. [DOI] [PubMed] [Google Scholar]
- 20.DeMarco A. pH dependence of internal references. J Magn Reson. 1977;26:527–528. [Google Scholar]
- 21.Wishart DS, Bigam CG, Yao J, Abildgaard F, Dyson HJ, Oldfield E, Markley JL, Sykes BD. 1H, 13C and 15N chemical shift referencing in biomolecular NMR. J Biomol NMR. 1995;6:135–140. doi: 10.1007/BF00211777. [DOI] [PubMed] [Google Scholar]
- 22.Lindman S, Linse S, Mulder FAA, André I. Electrostatic Contributions to Residue-Specific Protonation Equilibria and Proton Binding Capacitance for a Small Protein†. Biochemistry. 2006;45:13993–14002. doi: 10.1021/bi061555v. [DOI] [PubMed] [Google Scholar]
- 23.Roux-Fromy M. On the Hill plot of NMR data for titration of protein residues. Biophys Struct Mech. 1982;8:289–306. doi: 10.1007/BF00537207. [DOI] [PubMed] [Google Scholar]
- 24.Fraczkiewicz R, Braun W. Exact and efficient analytical calculation of the accessible surface areas and their gradients for macromolecules. J Comput Chem. 1998;19:319–333. [Google Scholar]
- 25.Tanford C. Protein denaturation. C Theoretical models for the mechanism of denaturation. Adv Protein Chem. 1970;24:1–95. [PubMed] [Google Scholar]
- 26.Baryshnikova O, Williams T, Sykes B. Internal pH indicators for biomolecular NMR. J Biomol NMR. 2008;41:5–7. doi: 10.1007/s10858-008-9234-6. [DOI] [PubMed] [Google Scholar]
- 27.Szakács Z, Hägele G, Tyka R. 1H/31P NMR pH indicator series to eliminate the glass electrode in NMR spectroscopic pKa determinations. Anal Chim Acta. 2004;522:247–258. [Google Scholar]
- 28.Valcour A, Woodworth RC. Internal proton magnetic resonance probes for pH titration of proteins. J Magn Reson (1969–1992) 1986;66:536–541. [Google Scholar]
- 29.Tynkkynen T, Tiainen M, Soininen P, Laatikainen R. From proton nuclear magnetic resonance spectra to pH. Assessment of 1H NMR pH indicator compound set for deuterium oxide solutions. Anal Chim Acta. 2009;648:105–112. doi: 10.1016/j.aca.2009.06.047. [DOI] [PubMed] [Google Scholar]
- 30.Ackerman JJ, Soto GE, Spees WM, Zhu Z, Evelhoch JL. The NMR chemical shift pH measurement revisited: Analysis of error and modeling of a pH dependent reference. Magn Reson Med. 1996;36:674–683. doi: 10.1002/mrm.1910360505. [DOI] [PubMed] [Google Scholar]
- 31.Perrin CL, Fabian MA. Multicomponent NMR Titration for Simultaneous Measurement of Relative pKas. Anal Chem. 1996;68:2127–2134. doi: 10.1021/ac960117z. [DOI] [PubMed] [Google Scholar]
- 32.Lee KK, Fitch CA, Lecomte JTJ, García-Moreno EB. Electrostatic Effects in Highly Charged Proteins: Salt Sensitivity of pKa Values of Histidines in Staphylococcal Nuclease†. Biochemistry. 2002;41:5656–5667. doi: 10.1021/bi0119417. [DOI] [PubMed] [Google Scholar]
- 33.McNutt M, Mullins LS, Raushel FM, Pace CN. Contribution of histidine residues to the conformational stability of ribonuclease T1 and mutant Glu-58 to Ala. Biochemistry. 1990;29:7572–7576. doi: 10.1021/bi00485a005. [DOI] [PubMed] [Google Scholar]
- 34.Pace CN, Grimsley GR, Scholtz JM. Protein Ionizable Groups: pK Values and Their Contribution to Protein Stability and Solubility. J Biol Chem. 2009;284:13285–13289. doi: 10.1074/jbc.R800080200. [DOI] [PMC free article] [PubMed] [Google Scholar]
- 35.Stams T, Niranjanakumari S, Fierke CA, Christianson DW. Ribonuclease P Protein Structure: Evolutionary Origins in the Translational Apparatus. Science. 1998;280:752–755. doi: 10.1126/science.280.5364.752. [DOI] [PubMed] [Google Scholar]
- 36.Reiter NJ, Osterman A, Torres-Larios A, Swinger KK, Pan T, Mondragon A. Structure of a bacterial ribonuclease P holoenzyme in complex with tRNA. Nature. 2010;468:784–789. doi: 10.1038/nature09516. [DOI] [PMC free article] [PubMed] [Google Scholar]
- 37.Makhatadze GI, Loladze VV, Ermolenko DN, Chen X, Thomas ST. Contribution of Surface Salt Bridges to Protein Stability: Guidelines for Protein Engineering. J Mol Biol. 2003;327:1135–1148. doi: 10.1016/s0022-2836(03)00233-x. [DOI] [PubMed] [Google Scholar]
- 38.Platzer G, Okon M, McIntosh L. pH-dependent random coil 1H, 13C, and 15N chemical shifts of the ionizable amino acids: a guide for protein pKa measurements. J Biomol NMR. 2014;60:109–129. doi: 10.1007/s10858-014-9862-y. [DOI] [PubMed] [Google Scholar]
- 39.Sali D, Bycroft M, Fersht AR. Stabilization of protein structure by interaction of α-helix dipole with a charged side chain. Nature. 1988;335:740–743. doi: 10.1038/335740a0. [DOI] [PubMed] [Google Scholar]
- 40.Lodi PJ, Knowles JR. Direct evidence for the exploitation of an α-helix in the catalytic mechanism of triosephosphate isomerase. Biochemistry. 1993;32:4338–4343. doi: 10.1021/bi00067a024. [DOI] [PubMed] [Google Scholar]
- 41.Kao YH, Fitch CA, Bhattacharya S, Sarkisian CJ, Lecomte JT, García-Moreno EB. Salt effects on ionization equilibria of histidines in myoglobin. Biophys J. 2000;79:1637–1654. doi: 10.1016/S0006-3495(00)76414-9. [DOI] [PMC free article] [PubMed] [Google Scholar]
- 42.Tan YJ, Oliveberg M, Davis B, Fersht AR. Perturbed pKa values in the Denatured States of Proteins. J Mol Biol. 1995;254:980–992. doi: 10.1006/jmbi.1995.0670. [DOI] [PubMed] [Google Scholar]
- 43.Oliveberg M, Arcus VL, Fersht AR. pKa Values of Carboxyl Groups in the Native and Denatured States of Barnase: The pKa Values of the Denatured State Are on Average 0.4 Units Lower Than Those of Model Compounds. Biochemistry. 1995;34:9424–9433. doi: 10.1021/bi00029a018. [DOI] [PubMed] [Google Scholar]
- 44.Baker NA, Sept D, Joseph S, Holst MJ, McCammon JA. Electrostatics of nanosystems: Application to microtubules and the ribosome. Proc Natl Acad Sci U S A. 2001;98:10037–10041. doi: 10.1073/pnas.181342398. [DOI] [PMC free article] [PubMed] [Google Scholar]
- 45.Pettersen EF, Goddard TD, Huang CC, Couch GS, Greenblatt DM, Meng EC, Ferrin TE. UCSF Chimera—A visualization system for exploratory research and analysis. J Comput Chem. 2004;25:1605–1612. doi: 10.1002/jcc.20084. [DOI] [PubMed] [Google Scholar]
Associated Data
This section collects any data citations, data availability statements, or supplementary materials included in this article.