Abstract
Background
Several clinical trials and meta-analyses have shown the advantageous effects of statins in populations with different levels of cardiovascular disease (CVD) risk. Considering the increasing cardiovascular risk among the Iranian population, the cost-effectiveness of the use of simvastatin 10 mg, as an Over-The-Counter (OTC) drug, for the primary prevention of myocardial infarction (MI) was evaluated in this modeling study, from the payer's perspective. The target population is a hypothetical cohort of 45-year CVD healthy men with an average (15 %) 10-year CVD risk.
Methods
A semi-Markov model with a life-long time horizon was developed to evaluate the Cost-Utility-Analysis (CUA) and Cost-Effectiveness-Analysis (CEA) of the use of OTC simvastatin 10 mg compared to no-drug therapy. Two measures of benefits were used in the model; Quality-Adjusted-Life-Years (QALYs) for the CUA and Life-Years-Gained (LYG) for the CEA. To examine the robustness of the results, one-way sensitivity analysis and probabilistic sensitivity analysis were applied to the model.
Results
For the base-case scenario with a discount rate of 0 % the estimated ICERs were 1113 USD/QALY and 935USD/LYG per patient (using governmental tariffs).
No threshold has been determined in Iran for the cost-effectiveness of health-related interventions. However, according to the recommendation of WHO, this intervention can be considered highly cost-effective as its ICER is far less than the reported GDP per capita for Iran by World bank in 2013 ($4763).
Conclusions
This modeling study showed that the use of an OTC low dose statin (simvastatin 10 mg) for the primary prevention of myocardial infarction (MI) in 45-year men with a 10-year CVD risk of 15 % could be considered highly cost-effective in Iran, as it meets the WHO threshold of the annual GDP per capita ($4763).
Keywords: Cost-effectiveness, Cost-utility, myocardial infarction, Markov model, Primary prevention, Simvastatin, Over-the-counter
Background
Chronic non-communicable diseases (NCDs) are universally recognized as the major causes of death and disability [1]. In 2008 around 48 % of NCD-related deaths were reported to be due to cardiovascular diseases (CVDs). It is predicted that by 2020, CVDs will be responsible for three-quarters of all deaths in countries with low- and middle-income [2].
Cardiovascular diseases are the most preventable causes of death in both developed and developing countries. The majority of CVD conditions with modifiable risk factors such as hypertension, dyslipidemia, obesity and diabetes are preventable or controllable [3]. Several clinical trials and meta-analyses have shown the advantageous effects of statins for the primary prevention of CVDs among populations with different levels of CVD risk [4]. Statins are a class of pharmaceuticals used to lower LDL-cholesterol levels by inhibiting of the enzyme HMG-COA reductase [5]. Statins, independent of their lipid-lowering effect, may also improve endothelial function, inhibit inflammatory responses, stabilize atherosclerotic plaques and show vasculo-protective actions [6]. The indication for the use of statins also have been suggested for patients with even low normal LDL cholesterol levels in hopes of favorably altering the incidence of CVDs [7, 8].
To decrease the risk of a first major CVD event in people who are at moderate risk, the UK medicines and healthcare products regulatory agency reclassified simvastatin 10 mg (Zocor Heart-Pro) as an over the counter(OTC) medicine in 2004. The target population includes men aged 55 or more, men aged 45 to 54 years with one or more risk factor, and women aged 55 or more with one or more risk factor [9].
With respect to the increasing prevalence of CVDs among the Iranian population and its accrued costs, the cost-effectiveness and cost-utility of the use of 10 mg simvastatin among 45-year Iranian men with an average (15 %) 10-year CVD risk from the perspective of payer were estimated in this study [10].
Methods
The population of this study includes a hypothetical cohort of CVD-healthy men aged 45 with a 10-year CVD risk of 15 %.
For chronic disease with recurrent events like as CVD, particularly when the risk of the disease progression persists indefinitely, Markov modeling is generally the preferred choice. Markov models with the transition probabilities which change with respect to time are named semi-Markov models [11].
A semi-Markov model was developed to evaluate the cost-effectiveness and cost-utility of the use of OTC simvastatin10mg (a low dose statin) for the primary prevention of myocardial infarction (MI) compared to no drug-therapy.
The main measured consequences were LYG for the CEA and QALY for the CUA.
Life-years-gained is a measure of the benefits from use of an intervention in terms of increased average life expectancy or delay of death in the population when compared with the alternative intervention [12].
Quality-adjusted-life-year is used to illustrate the outcomes of health care programs through adjusting the life years gained by an estimate of utility generally measured using a preference based method [13]. QALYs gained with treatment therefore incorporate benefits in both quantity and quality of life.
The choice of cycle length depends upon the interventions of interest as well as the type of disease [14]. For models with life-long time horizon and relatively rare events the cycle length can be one year [15]. Majority of modeling studies on CVD adopted a cycle length of one year [16]. The current model assumes Markov cycles of one year and consists of 5 different health states including: healthy, non-fatal MI (first year), post-MI, fatal-MI and death due to any reason other than MI (to prevent double counting). As in the following years after an acute (first year) MI, both the treatment costs and the probability of a recurrent MI are different from the first year; separated health states for this were considered in the model (Fig. 1).
Fig. 1.
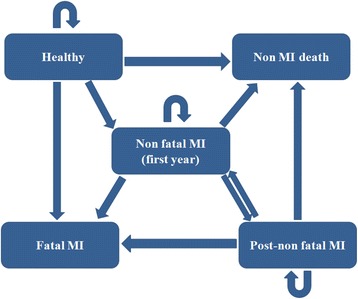
The Markov model diagram
In this model, each individual starts as a CVD-healthy person. A healthy person might develop a non-fatal MI, die from a fatal MI, or die for any reason other than MI. Otherwise he would be transferred to the next cycle as a healthy person. If a patient develops a non-fatal MI, the patient might experience a new non-fatal MI, die due to a fatal MI or die for other reasons. If none of these happened, the patient would be transferred to the next cycle with a history of MI (post-MI) with the probabilities and costs related to this health state (which are different from the first-year MI). Possible transitions from post-MI to other health states are similar to those of non-fatal MI.
Once patients experience an MI event, they would receive a POM (Prescription-Only-Medicine) statin (atorvastatin 10 mg) in both intervention and no-intervention groups for life time.
The time horizon of an economic evaluation should be long enough to be able to capture both the major costs and the major future outcomes of treatment including the benefits, potential side effects, morbidity and mortality. Therefore in many cases a patient’s life time is the preferred time horizon for the study [14, 17].
Like as many economic evaluation studies on CVD, this model would be continued until 100 year of age (when most of the cohort have died) or death [16]. However, due to the nature of Markov models, some proportion of the cohort remain alive, regardless of how high the applied mortality rates are [18].
For the base-case, a moderate 10-year total CVD risk of 15 % was taken into account. As the CVD risk rises with age, an annual increase of 0.03 % in CVD risk was considered in the model [16]. The proportions of fatal and non-fatal MI events among total CVD events were sourced from the Isfahan Cohort Study (ICS) [19]. Different scenarios were evaluated in this modeling study. For consistency with national studies, a second scenario was evaluated in which the probabilities of fatal and non-fatal MI, independent of base-line CVD risk, were sourced from the ICS population.
As people aged 70 or more could be considered at high risk of CVD, in a third scenario, a POM statin (atorvastatin 10 mg) was prescribed from 70 years of age for the primary prevention, in both intervention and no-intervention groups [20].
Three different scenarios of discounting were also considered in this study including: no discounting (0 %), a discount rate of 3 % for both costs and effects (following recommendations of the WHO-CHOICE) [21] and a discount rate of 7.2 % for costs and 3 % for effects, according to a domestic study [22].
Input parameters, including transition probabilities, relative risks related to treatment with statins and the related sources of data are illustrated in Tables 1 and 2.
Table 1.
Relative risks for the use of statins
| The RRa for the use of simvastatin 10 mg | |
| healthy to non-fatal MI | 0.752 |
| healthy to fatal MI | 0.813 |
| The RRb for the use of atorvastatin 10 mg | |
| healthy to non-fatal MI | 0.656 |
| healthy to fatal MI | 0.740 |
aRR = Relative risk, bdata sourced from reference 16
Table 2.
The transition probabilities applied in the model
| TP/age | 45-49 | 50-54 | 55-59 | 60-64 | 65-69 | 70-74 | 75-79 | 80-84 | 85-100 | Reference |
|---|---|---|---|---|---|---|---|---|---|---|
| MI To MI | 0.1280 | 0.1280 | 0.1152 | 0.1152 | 0.1019 | 0.1019 | 0.0874 | 0.0874 | 0.0711 | [16] |
| MI To FMI | 0.0224 | 0.0348 | 0.0348 | 0.0700 | 0.0700 | 0.1054 | 0.1054 | 0.1270 | 0.1270 | [34–37] |
| Post-MI To MI | 0.0162 | 0.0162 | 0.0179 | 0.0179 | 0.0185 | 0.0185 | 0.0178 | 0.0178 | 0.0160 | [16] |
| Post-MI To FMI | 0.0052 | 0.0052 | 0.0092 | 0.0092 | 0.0152 | 0.0152 | 0.0235 | 0.0235 | 0.0340 | [16, 38] |
| Non MI death | 0.0028 | 0.0043 | 0.0056 | 0.0084 | 0.0131 | 0.0213 | 0.0426 | 0.0705 | 0.1143 | [39, 40] |
| Healthy To MI (ICS) | 0.0031 | 0.0031 | 0.0044 | 0.0044 | 0.0094 | 0.0094 | 0.0061 | 0.0061 | 0.0061 | [19] |
| Healthy To FMI (ICS) | 0.0015 | 0.0015 | 0.0050 | 0.0050 | 0.0082 | 0.0082 | 0.0080 | 0.0080 | 0.0080 | [19] |
TP = transition probability, MI = non-fatal myocardial infarction in first year, FMI = fatal myocardial infarction, Post-MI = subsequent years of non-fatal myocardial infarction, ICS = Isfahan Cohort Study
To calculate QALYs, a utility weights of 0.76 for MI [16] and 0.88 for post-MI [23] were applied to the model. To account for diminishing in health with age, age-related utility weights were also applied to the model. These utility weights were taken from the Ward et al. study on statins in 2007 [16].
This study was conducted from the payer's perspective. Direct costs including drug acquisition costs, laboratory tests, para-clinical examinations, physician's visits and hospitalization costs were taken into account. Considering the selected perspective, indirect costs were not investigated in this study. The costs were expressed in USD, considering an exchange rate of 26,912 Iranian Rials for each USD. The applied exchange rate was the monthly average (from 22.11.2014 to 22.12.2014) reported by the central bank of Iran [24].
To estimate the unit costs of treatment, we sought expert clinical advice from the cardiologists of Isfahan University of Medical Sciences teaching hospitals (Alzahra hospital and Chamran hospital). The treatment tariffs were sourced from the last published tariff books by the Iranian Ministry of Health and Medical Education. Also, in different scenarios, two separated series of tariffs for private and governmental sections were taken into account [25]. The acquisition cost of each OTC simvastatin 10 mg tablet (1,100 Rials = 0.041 USD) sourced from the Food and Drug Organization [26].
For those who received POM statin (atorvastatin 10 mg) for the primary prevention from 70 years of age, 4 annual general practitioner visits and two sets of liver function enzyme tests (SGOT and SGPT) were taken into account.
Table 3 shows the treatment costs used in the model.
Table 3.
The treatment costs for the first year and following years of MI. The costs in this table were obtained from references 32 & 33
| Governmental | Private | |||||||||
|---|---|---|---|---|---|---|---|---|---|---|
| MI (first year) | Post- MI | MI (first year) | Post-MI | |||||||
| Cost ($) | Number of cost units | Total costs ($) | Number of cost units | Total costs ($) | Cost ($) | Number of cost units | Total costs ($) | Number of cost units | Total costs ($) | |
| CCU hospitalization fee (per day) | 77.59 | 2 | 155.17 | - | - | 230.75 | 2 | 461.50 | - | - |
| General care units hospitalization fee (per day) | 60.87 | 2 | 121.73 | - | - | 180.59 | 2 | 361.18 | - | - |
| Consultant visit fee | 3.72 | 7 | 26.01 | 2 | 7.43 | 9.66 | 7 | 67.63 | 2 | 19.32 |
| General practitioner visit fee | 2.97 | 3 | 8.92 | 4 | 11.89 | 6.13 | 3 | 18.39 | 4 | 24.52 |
| -Para-clinical examinations: | ||||||||||
| Electrocardiogram | 3.27 | 9 | 29.43 | 2 | 6.54 | 7.43 | 9 | 66.88 | 2 | 14.86 |
| Echocardiography | 35.97 | 1 | 35.97 | - | - | 81.75 | 1 | 81.75 | - | - |
| Exercise tolerance test | 18.64 | 1 | 18.64 | - | - | 42.36 | 1 | 42.36 | - | - |
| -Medical laboratory tests: | ||||||||||
| Lab. patient admission fee | 0.45 | 3 | 1.34 | 2 | 0.89 | 0.97 | 3 | 2.90 | 2 | 1.93 |
| Lab. service fee | 0.00 | 3 | 0.00 | 2 | 0.00 | 0.74 | 3 | 2.23 | 2 | 1.49 |
| CBC Dif. | 0.74 | 3 | 2.23 | 2 | 1.49 | 2.01 | 3 | 6.02 | 2 | 4.01 |
| BUN | 0.41 | 3 | 1.23 | 2 | 0.82 | 0.89 | 3 | 2.68 | 2 | 1.78 |
| Cr | 0.52 | 3 | 1.56 | 2 | 1.04 | 1.08 | 3 | 3.23 | 2 | 2.16 |
| Na | 0.59 | 3 | 1.78 | 2 | 1.19 | 1.30 | 3 | 3.90 | 2 | 2.60 |
| K | 0.59 | 3 | 1.78 | 2 | 1.19 | 1.30 | 3 | 3.90 | 2 | 2.60 |
| BS | 0.45 | 3 | 1.34 | 2 | 0.89 | 0.97 | 3 | 2.90 | 2 | 1.93 |
| TG | 0.71 | 3 | 2.12 | 2 | 1.41 | 1.56 | 3 | 4.68 | 2 | 3.12 |
| Cholesterol | 0.52 | 3 | 1.56 | 2 | 1.04 | 1.11 | 3 | 3.34 | 2 | 2.23 |
| PT INR | 0.93 | 1 | 0.93 | - | - | 1.82 | 1 | 1.82 | ||
| PTT | 0.93 | 1 | 0.93 | - | - | 1.82 | 1 | 1.82 | - | - |
| Troponin | 2.45 | 2 | 4.90 | - | - | 8.62 | 2 | 17.24 | - | - |
| LDH | 1.86 | 1 | 1.86 | - | - | 4.35 | 1 | 4.35 | - | - |
| CPK | 2.49 | 1 | 2.49 | - | - | 5.39 | 1 | 5.39 | - | - |
| SGOT | 0.63 | 3 | 1.90 | 2 | 1.26 | 1.45 | 3 | 4.35 | 2 | 2.90 |
| SGPT | 0.63 | 3 | 1.90 | 2 | 1.26 | 1.45 | 3 | 4.35 | 2 | 2.90 |
| ESR | 0.26 | 1 | 0.26 | - | - | 0.56 | 1 | 0.56 | - | - |
| -Pharmaceuticals: | ||||||||||
| ASA 80 | 0.01 | 365 | 3.66 | 365 | 3.66 | 0.01 | 365 | 3.66 | 365 | 3.66 |
| Clopidogrel | 0.29 | 365 | 105.79 | - | - | 0.29 | 365 | 105.79 | - | - |
| Metoprolol | 0.01 | 365 | 4.61 | 365 | 4.61 | 0.01 | 365 | 4.61 | 365 | 4.61 |
| Enoxaparin | 3.72 | 1 | 3.72 | - | - | 3.72 | 1 | 3.72 | - | - |
| Atorvastatin10 | 0.03 | 365 | 11.94 | 365 | 11.94 | 0.03 | 365 | 11.94 | 365 | 11.94 |
| Ranitidine | 0.02 | 30 | 0.60 | - | - | 0.02 | 30 | 0.60 | - | - |
| Oxazepam | 0.01 | 4 | 0.04 | - | - | 0.01 | 4 | 0.04 | - | - |
| Captopril | 0.01 | 4 | 0.05 | - | - | 0.01 | 4 | 0.05 | - | - |
| Streptokinase | 9.29 | 1 | 9.29 | - | - | 9.29 | 1 | 9.29 | - | - |
| Drug dispensing fee | 0.20 | 6 | 1.18 | 6 | 1.18 | 0.59 | 6 | 3.57 | 6 | 3.57 |
| Total | 566.85 | 59.74 | 1318.62 | 112.14 | ||||||
We examined the effect of changing several different parameters in one-way (univariate) sensitivity analyses, for the base-case scenario. Results from the one-way sensitivity analyses are presented as Tornado charts.
Also parameter uncertainty was dealt with by probabilistic sensitivity analysis for the base-case scenario, using Monte Carlo simulation with 10,000 iterations for each evaluation. For each iteration, a value of each input variable was selected randomly from its distribution (lognormal distribution for relative risks and costs and beta distribution for transition probabilities) [27]. The parameters that we varied in the probabilistic sensitivity analysis (PSA) included relative risks of the use of statins for myocardial infarction (±10 %), secondary MI transition probabilities (±10 %), OTC statin tablet cost (±25 %), total MI and post-MI treatment costs (±20 %). Results from the PSA are presented as scatter plots of incremental cost-effectiveness ratios for QALY and LYG.
Results
Different scenarios were evaluated in this study including the base-case, ICS scenario, in which the primary transition probabilities were sourced from the ICS study, and a scenario in which patients in both groups received a POM statin for the primary prevention from 70 years of age. Also three different discount rates and two types of tariffs (governmental and private) were examined for each scenario. Table 4 shows the obtained results for these scenarios.
Table 4.
Final results of different scenarios
| Cost (USD/Patient) | Effect (Per Patient) | Incremental results (Per Patient) | |||||||||||
|---|---|---|---|---|---|---|---|---|---|---|---|---|---|
| Governmental tariffs | Private tariffs | QALY | LYG | Inc-Cost/QALY | Inc-Cost/LYG | ||||||||
| Discount rate | Scenario | No-drug therapy | OTC statin | No-drug therapy | OTC statin | No-drug therapy | OTC statin | No-drug therapy | OTC statin | Governmental tariffs | Private tariffs | Governmental tariffs | Private tariffs |
| 0 % | Base-case | 214.70 | 652.05 | 445.21 | 830.02 | 26.37 | 26.77 | 33.82 | 34.29 | 1113.40 | 979.65 | 935.12 | 822.79 |
| ICS | 261.18 | 676.05 | 543.45 | 896.28 | 25.84 | 26.31 | 33.13 | 33.69 | 884.99 | 752.65 | 736.79 | 626.62 | |
| POM statin from 70 | 463.59 | 768.23 | 835.25 | 1107.22 | 26.50 | 26.80 | 33.98 | 34.34 | 1001.43 | 894.04 | 863.83 | 771.19 | |
| 3 % | Base-case | 110.71 | 384.95 | 231.85 | 477.97 | 16.56 | 16.74 | 20.71 | 20.91 | 1567.74 | 1407.00 | 1374.03 | 1233.16 |
| ICS | 128.68 | 394.62 | 270.32 | 504.34 | 16.37 | 16.57 | 20.46 | 20.70 | 1309.20 | 1152.07 | 1131.89 | 996.04 | |
| POM statin from 70 | 204.12 | 428.42 | 378.37 | 581.72 | 16.60 | 16.75 | 20.76 | 20.93 | 1526.75 | 1384.16 | 1369.28 | 1241.40 | |
| 7.2 % for costs & 3 % for effects | Base-case | 54.91 | 227.23 | 116.64 | 274.35 | 16.56 | 16.74 | 20.71 | 20.91 | 985.12 | 901.62 | 863.40 | 790.21 |
| ICS | 59.31 | 229.65 | 126.25 | 281.06 | 16.37 | 16.57 | 20.46 | 20.70 | 838.56 | 762.14 | 724.99 | 658.92 | |
| POM statin from 70 | 81.14 | 239.40 | 157.83 | 303.41 | 16.60 | 16.75 | 20.76 | 20.93 | 1077.21 | 990.87 | 966.11 | 888.68 | |
Figures 2, 3, 4 and 5 illustrate the Tornado charts for the one-way sensitivity analyses. The evaluated data and the examined range for each of them are shown in the charts. The Tornado charts show that the incremental-cost-effectiveness-ratios (ICERs) most affected by the relative risk of the use of statin and the cost of the OTC statin tablets.
Fig. 2.
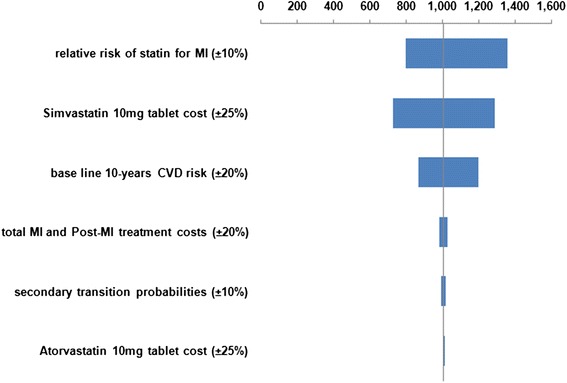
Tornado chart for Incremental cost/QALY per patient (governmental tariffs)
Fig. 3.
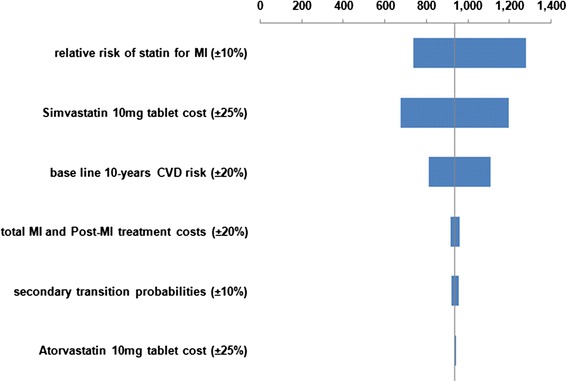
Tornado chart for Incremental cost/LYG per patient (governmental tariffs)
Fig. 4.
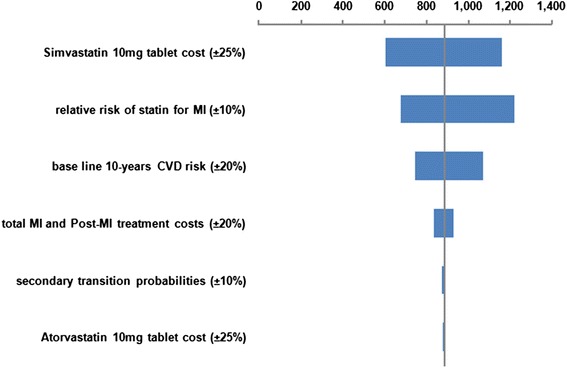
Tornado chart for Incremental cost/QALY per patient (private tariffs)
Fig. 5.
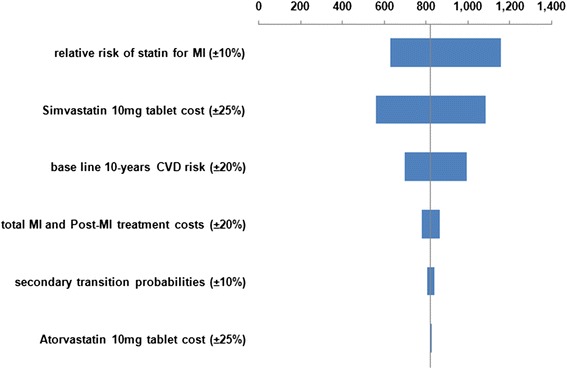
Tornado chart for Incremental cost/LYG per patient (private tariffs)
Figures 6 and 7 for the probabilistic sensitivity analysis show that the use of OTC simvastatin 10 mg, compared with no-drug therapy for the primary prevention in 45-year men with a CVD 10-risk of 15 %, resulted in higher costs and more LYG and QALYs gained in all of the simulations. According to the probabilistic sensitivity analysis, estimated incremental cost per QALY gained and incremental cost per LYG are $1138 (95 % confidence interval [CI]: $797-$1595) and $960 (95 % confidence interval [CI]: $663-$1363), respectively. In addition, all the points comparing OTC simvastatin 10 mg with no-drug therapy for the primary prevention fell below the recommended threshold of WHO of GDP per capita (the reported GDP per capita by World bank for Iran in 2013 ($4763)) which means the intervention is highly cost-effective [28].
Fig. 6.
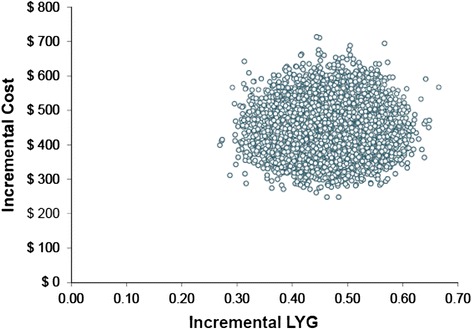
PSA Scatter plot of Incremental cost/LYG ratio (governmental tariffs)
Fig. 7.
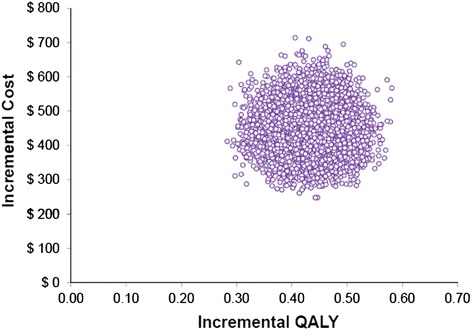
PSA Scatter plot of Incremental cost/QALY ratio (governmental tariffs)
A cost-effectiveness acceptability curve (CEAC) illustrates the probability that an intervention is more cost-effective compared with the alternative intervention(s) over a range of ceiling values (λ), representing the willingness to pay (WTP) for an additional unit of effectiveness (such as $/QALY) [29, 30].
Figure 8 shows the CEAC for the base-case scenario, based on the QALY values for OTC statin therapy when compared to no-drug therapy.
Fig. 8.
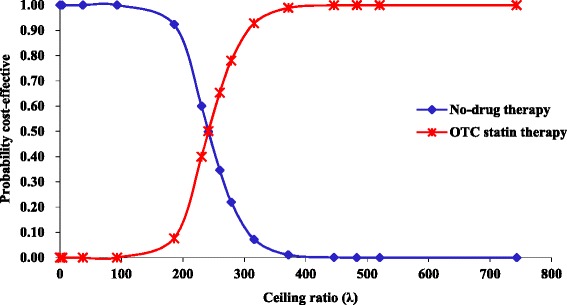
CEAC for the base-case scenario (governmental tariffs)
This figure represents the traditional ‘textbook’ case of a CEAC in which OTC statin therapy is both more costly and more effective than no-drug therapy. As none of the pairs represent cost-saving the CEAC cuts the Y-axis at zero. Also as the whole density involves health gains the CEAC asymptotes to 1 [31].
A cross-over in acceptability between treatments is seen at a WTP of $240/QALY. This shows that the probability of no-drug therapy being more cost-effective than OTC statin therapy for the primary prevention of CVD is higher only if the WTP is less than this amount.
Discussion
There is extensive literature regarding the usefulness of the use of statins for the primary prevention of CVD. Considering the increasing risk of MI in the Iranian population, for the first time, we evaluated the cost-utility and cost-effectiveness of the use of an OTC low dose statin (simvastatin 10 mg) for the primary prevention of MI, among middle aged Iranian men with an average 10-year CVD risk.
We found that for the base-case scenario, simvastatin 10 mg had a cost-utility of $1113 per additional QALY ($979 with private tariffs) and a cost-effectiveness of $935 per additional LYG ($823 with private tariffs) for the primary prevention of MI in 45-year-old men with a 15 % 10-year CVD risk.
Although the total cost for health service is higher in private sector, the difference between intervention and no-intervention groups in private sector is less than the same difference in public sector.
The performed scenario analyses produced incremental costs of no more than $1568 per additional outcome per patient.
The results of PSA and one-way sensitivity analyses showed the robustness of our results.
We did not find any other study for the cost-effectiveness of the use of OTC statins in Iran. The results of our study is consistent with a previously published modeling study estimated an incremental QALYs of 0.06 (with a discount rate of 5 %) for the use of simvastatin 10 mg for primary prevention in a male patient with 15 % 10-year CVD risk. This study differs from ours in discounting rate, considered health states and treatment pathways [32].
No threshold has been determined in Iran for the cost-effectiveness of health-related interventions. However, considering the 2013 reported GDP per capita for Iran by World Bank ($4763) [28], the estimated ICERs of this study show that the evaluated intervention can be considered highly cost-effective according to WHO recommendations [33].
This analysis has several limitations. We adopted a payer's perspective and considered only direct medical costs due to limited data on indirect costs, as well as the existence of differences among patients in their socioeconomic status and health insurance coverage. We did not model cardiovascular events other than MI and patients with cardiovascular risk factors such as hypertension or diabetes. Although we discounted the results in different scenarios, the effect of inflation was not taken into account. We also did not have male-specific data on costs. Due to the limitation of access to imported branded statins, only domestic generic statin costs were considered in the model. However, our model's use of probabilities varying with age, made it more realistic, although much more complex. We also attempted to deal with uncertainties by performing one-way and probabilistic sensitivity analyses and performing different scenarios.
As a final point, we believe that our modeling study has important implications for decision-makers in health practice and policy, particularly in Iran.
Acknowledgement
The authors would like to thank Dr. Alireza Khosravi and Dr. Kian Heshmat for their expert opinions in estimating the treatment costs of this modeling study.
Footnotes
Competing interests
The authors declare that they have no competing interests.
Authors’ contributions
MA made design of the study and the model, supervised whole study, contributed in acquisition and reviewing of data and interpretation of the results, revised the paper critically for important intellectual content, AH contributed in performing the model, acquisition and analysis of data, and drafting the article. All authors approved final version for submission.
References
- 1.Thavendiranathan P, Bagai A, Brookhart MA, Choudhry NK. Primary prevention of cardiovascular diseases with statin therapy: a meta-analysis of randomized controlled trials. Arch Intern Med. 2006;166(21):2307–13. doi: 10.1001/archinte.166.21.2307. [DOI] [PubMed] [Google Scholar]
- 2.Alwan A. Global status report on non-communicable diseases 2010. Geneva: World Health Organization (WHO); 2011. [Google Scholar]
- 3.Awad A, Al-Nafisi H. Public knowledge of cardiovascular disease and its risk factors in Kuwait: a cross-sectional survey. BMC public health. 2014;14(1):1131. doi: 10.1186/1471-2458-14-1131. [DOI] [PMC free article] [PubMed] [Google Scholar]
- 4.Reiner Ž. Statins in the primary prevention of cardiovascular disease. Nat Rev Cardiol. 2013;10(8):453–64. doi: 10.1038/nrcardio.2013.80. [DOI] [PubMed] [Google Scholar]
- 5.Pichandi S, Pasupathi P, Rao YY, Farook J, Ambika A, Ponnusha BS. The role of statin drugs in combating cardiovascular diseases–A review. Int J Cur Sci Res. 2011;1(2):47–56. [Google Scholar]
- 6.Mason JC. Statins and their role in vascular protection. Clin Sci. 2003;105(3):251–66. doi: 10.1042/CS20030148. [DOI] [PubMed] [Google Scholar]
- 7.Karalis DG. Intensive lowering of low-density lipoprotein cholesterol levels for primary prevention of coronary artery disease. Mayo Clin Proc. 2009;84(4):345–352. doi: 10.1016/S0025-6196(11)60544-2. [DOI] [PMC free article] [PubMed] [Google Scholar]
- 8.Michos ED, Blumenthal RS. Prevalence of low low-density lipoprotein cholesterol with elevated high sensitivity C-reactive protein in the US implications of the JUPITER (Justification for the Use of Statins in Primary Prevention: An Intervention Trial Evaluating Rosuvastatin) study. J Am Coll Cardiol. 2009;53(11):931–5. doi: 10.1016/j.jacc.2008.12.010. [DOI] [PubMed] [Google Scholar]
- 9.Nash DB, Nash SA. Reclassification of simvastatin to over-the-counter status in the United Kingdom: a primary prevention strategy. Am J Cardiol. 2004;94(9):35–9. doi: 10.1016/j.amjcard.2004.07.053. [DOI] [PubMed] [Google Scholar]
- 10.Aghaeishahsavari M, Noroozianavval M, Veisi P, Parizad R, Samadikhah J. Cardiovascular disease risk factors in patients with confirmed cardiovascular disease. Saudi Med J. 2006;27(9):1358–61. [PubMed] [Google Scholar]
- 11.Cooper K, Brailsford S, Davies R. Choice of modelling technique for evaluating health care interventions. J Oper Res Soc. 2007;58(2):168–76. [Google Scholar]
- 12.Preedy VR, Watson RR. Handbook of disease burdens and quality of life measures. New York: Springer; 2010. [Google Scholar]
- 13.Berger ML, Bingefors K, Hedblom EC, Pashos C, Torrance GW. Health Care Cost, Quality and Outcomes, International Society for Pharmacoeconomics and Outcomes. New Jersey: Research Press; 2003. [Google Scholar]
- 14.Drummond M, Sculpher M, Torrance G, O’Brien B, Stoddart G. Economic evaluation using decision analytic modelling. Methods for the economic evaluation of health care programmes. 3. New York: Oxford University Press; 2005. [Google Scholar]
- 15.Sonnenberg FA, Beck JR. Markov models in medical decision making a practical guide. Med Decis Making. 1993;13(4):322–38. doi: 10.1177/0272989X9301300409. [DOI] [PubMed] [Google Scholar]
- 16.Ward S, Jones ML, Pandor A, Holmes M, Ara R, Ryan A, Yeo W, Payne N. A systematic review and economic evaluation of statins for the prevention of coronary events. HTA. 2007; 11(14). http://dx.doi.org/10.3310/hta11140. [DOI] [PubMed]
- 17.Evans C, Tavakoli M, Crawford B. Use of quality adjusted life years and life years gained as benchmarks in economic evaluations: a critical appraisal. Health Care Manag Sci. 2004;7(1):43–9. doi: 10.1023/B:HCMS.0000005397.93173.bb. [DOI] [PubMed] [Google Scholar]
- 18.National Collaborating Centre for Chronic Conditions . Hypertension: management in adults in primary care: pharmacological update. London: Royal College of Physicians; 2006. [PubMed] [Google Scholar]
- 19.NizalSarrafzadegan M, Sadeghi M, ShahramOveisgharan M, Marshall T. Incidence of cardiovascular diseases in an Iranian population: the Isfahan Cohort Study. Arch IranMed. 2013;16(3):138. [PubMed] [Google Scholar]
- 20.Greving J, Visseren F, de Wit G, Algra A. Statin treatment for primary prevention of vascular disease: whom to treat? Cost-effectiveness analysis. BMJ. 2011; doi:10.1136/bmj.d1672. [DOI] [PubMed]
- 21.Edejer TT-T, Baltussen R, Adam T, Hutubessy R, Acharya A, Evans DB, Murray CJL. Making choice in health: WHO Guide to Cost-Effectiveness Analysis. Geneva: World Health Organization (WHO); 2003. [Google Scholar]
- 22.Abdoli G. Estimation of social discount rate for Iran. Eco Res Rev. 2009;10:135–156. [Google Scholar]
- 23.Smith SM, Campbell JD. Cost-effectiveness of renin-guided treatment of hypertension. Am J Hypertens. 2013;26(11):1303–10. [DOI] [PubMed]
- 24.The Central Bank of Iran (CBI). Exchange Rates. 2015. http://www.cbi.ir/ExRates/rates_fa.aspx. Accessed 3 Jan 2015.
- 25.Ministry of Health and Medical Education. Tariff Book of Health Services. 2014. http://rvu.behdasht.gov.ir/index.aspx?fkeyid=&siteid=431&pageid=54142. Accessed 18 Oct 2014.
- 26.Isfahan University of Medical Sciences; Food and Drug Organization; Drugs price list. 2014. http://fdo.mui.ac.ir/index.php?option=com_content&view=category&layout=blog&id=245&Itemid=666. Accessed 17 Oct 2014.
- 27.Briggs A. Probabilistic analysis of cost-effectiveness models: statistical representation of parameter uncertainty. Value Health. 2005;8(1):1–2. doi: 10.1111/j.1524-4733.2005.08101.x. [DOI] [PubMed] [Google Scholar]
- 28.The World Bank; GDP per capita. 2014. http://data.worldbank.org/indicator/NY.GDP.PCAP.CD?display=default. Accessed 21 Jan 2015.
- 29.Claxton K, Sculpher M, McCabe C, Briggs A, Akehurst R, Buxton M, Brazier J, O'Hagan T. Probabilistic sensitivity analysis for NICE technology assessment: not an optional extra. Health econ. 2005;14(4):339–47. doi: 10.1002/hec.985. [DOI] [PubMed] [Google Scholar]
- 30.Briggs AH, Gray AM. Methods in health service research: Handling uncertainty in economic evaluations of healthcare interventions. BMJ. 1999;319(7210):635. doi: 10.1136/bmj.319.7210.635. [DOI] [PMC free article] [PubMed] [Google Scholar]
- 31.Fenwick E, O'Brien BJ, Briggs A. Cost-effectiveness acceptability curves–facts, fallacies and frequently asked questions. Health Econ. 2004;13(5):405–15. doi: 10.1002/hec.903. [DOI] [PubMed] [Google Scholar]
- 32.Ribeiro RA, Duncan BB, Ziegelmann PK, Stella SF, Costa Vieira JL, Restelatto LF, Polanczyk CA. Cost-Effectiveness of High, Moderate and Low-Dose Statins in the Prevention of Vascular Events in the Brazilian Public Health System. Arq Bras Cardiol. 2014. doi:10.5935/abc.20140173 [DOI] [PMC free article] [PubMed]
- 33.Marseille E., Larson B., Kazi D.S., Kahn J.G., Rosen S. Thresholds for the cost-effectiveness of interventions: alternative approaches. Bull World Health Organ. 2015;93:118–124. doi:2471/BLT.14.138206. [DOI] [PMC free article] [PubMed]
- 34.Hafshejani AM, Sarrafzadegan N, Attar Moghaddam HRB, Hosseini S, AsadiLari M. Predictive factors of survival in patients with an acute myocardial infarction among genders in Iran. J Isfahan Med Sch. 2012;30(209):1611–21.
- 35.Farkhani EM, Baneshi MR, Zolala F. Survival rate and its related factors in patients with acute myocardial infarction. Med J Mashhad Univ Med Sci. 2014;57(4):636–46.
- 36.Ghafarian SH, Javan AR, Hatamipoor E, Mousavizadeh A, Ghaedi H, Jabarinejad A, et al. Survival rate and its related factors in patients with acute myocardial infarction. ArmaghanDanesh. 2006;11(1):93–104.
- 37.Amani F, Hajizadeh E, Hoseinian F. Survival rate in MI patients. Koomesh. 2008;9(2):131–8.
- 38.Soltanian AR, Mahjub H, Goudarzi S, Nabi-Pour I, Jamali M. 5 Years Survival Rate in Patients with Myocardial Infarction in Bushehr. Sci Hamadan Univ Med Sci. 2009;16(3):33–7.
- 39.Statistical center of Iran, Selected Findings of the 2011 National Population and Housing Census. http://www.amar.org.ir/Portals/1/Iran/census-2.pdf(2012). Accessed 22 May 2014.
- 40.Ministry of Interior; National organization for civil registration; Statistical year book 1390. http://www.sabteahval.ir (2011). Accessed 23 May 2014.


