Abstract
Perceptual learning is classically thought to be highly specific to the trained stimuli's retinal locations. However, recent research using a novel double-training paradigm has found dramatic transfer of perceptual learning to untrained locations. These results challenged existing models of perceptual learning and provoked intense debate in the field. Recently, Hung and Seitz (2014) showed that previously reported results could be reconciled by considering the details of the training procedure, in particular, whether it involves prolonged training at threshold using a single staircase procedure or multiple staircases. Here, we examine a hierarchical neural network model of the visual pathway, built upon previously proposed integrated reweighting models of perceptual learning, to understand how retinotopic transfer depends on the training procedure adopted. We propose that the transfer and specificity of learning between retinal locations can be explained by considering the task-difficulty and confidence during training. In our model, difficult tasks lead to higher learning of weights from early visual cortex to the decision unit, and thus to specificity, while easy tasks lead to higher learning of weights from later stages of the visual hierarchy and thus to more transfer. To model interindividual difference in task-difficulty, we relate task-difficulty to the confidence of subjects. We show that our confidence-based reweighting model can account for the results of Hung and Seitz (2014) and makes testable predictions.
Keywords: perceptual learning, transfer of learning, double training, integrated reweighting theory, task difficulty, reverse hierarchy theory
Introduction
Visual perceptual learning has long been believed to be highly specific to the trained retinal locations. This property of perceptual learning was thought to be the signature of plasticity in the early visual pathway, where neurons have small receptive fields and very specific feature preferences (Karni & Sagi, 1991; Schoups, Vogels, Qian, & Orban, 2001). However, the conditions under which perceptual learning is specific to the trained conditions have been the subject of recent debate. The experiments of Xiao et al. (2008) showed that transfer to untrained retinal locations is unlocked by adopting a different training procedure. By using a double-training paradigm employing feature training with a contrast discrimination task at one retinal location and location training with an orientation discrimination task at a second retinal location, they found complete transfer of feature learning to the second location. Recent experiments by Hung and Seitz (2014) investigated the factors that lead to transfer or specificity between retinal locations, and while they replicated the results of Xiao et al. (2008), they also found consistently across multiple experiments that an important factor was the precision of stimuli used during training. They observed that prolonged training at threshold (as resulting from the use of a single staircase) led to the preservation of retinotopic specificity in Vernier discrimination task even after double-training. Training with more suprathreshold stimuli (due to multiple short staircases), however, led to a significant transfer of learning between retinal locations (replicating results of Xiao et al. [2008]). Using an orientation discrimination task, they further found that the use of multiple staircase and single staircase training led to location transfer and specificity of learning respectively, even in the absence of double training. Hung and Seitz (2014) suggested that the distribution of learning across the neural system depends upon the fine details of the training procedure and that differences across studies can be reconciled by examining such experimental differences.
While Hung and Seitz (2014) showed empirically that transfer in perceptual learning can vary based upon simply changing between single and multiple staircases during training, such findings can be better understood within the context of a computational model where such manipulations can be more systematically investigated and mechanisms involved can be identified. A large number of models of perceptual learning have been constructed with the aim to understand mechanisms of perceptual learning and provide a good basis for conducting such an examination. Most models are based upon a reweighting mechanism where learning is accomplished by changing weights of readout from sensory representations to decision units. Weiss, Edelman, and Fahle (1993) built a biologically plausible hyper basis function network reweighting model, which used nonmodifiable stable basis function as sensory representation neurons, and showed that basic perceptual learning can be accomplished by changing the weights connecting these representation units to the decision unit. Sotiropoulos, Seitz, and Seriès (2011) followed up this model by constructing an enhanced reweighting model that could explain a wider range of results of transfer and interference in perceptual learning. Dosher and Lu (1998) showed that learning of orientation discrimination in noise could be accomplished by a stimulus-enhancing mechanism that excludes the environmental noise from sensory representations. This model can account for the results of several psychophysics experiments showing disruption (Petrov, Dosher, & Lu, 2005; Seitz et al., 2005), specificity and transfer of learning across tasks (Webb, Roach, & McGraw, 2007), and has been a mainstay in the field of perceptual learning due to its explanatory power. Recently, a new instantiation of the reweighting model was proposed by Dosher, Jeter, Liu, and Lu (2013) to account for transfer to new retinal locations. This model, called the integrated reweighting theory (IRT), is a multi-level learning system in which location transfer is mediated through location-independent representations. Stimulus feature transfer is determined by similarity of representations at both location-specific and location-independent levels.
Here, we examine a version of the IRT model to understand how retinotopic transfer depends on the training procedure adopted. We present a hierarchical neural network implementing the IRT using a Vernier discrimination task and an orientation discrimination task, similar to the experiments of Hung and Seitz (2014). We propose that the transfer and specificity of learning between retinal locations in multiple staircase and single staircase conditions respectively can be explained by considering the task-difficulty during training. The idea is that difficult tasks would lead to higher learning of weights from early visual cortex to the decision unit, and thus to specificity, while easy tasks would lead to higher learning of weights from later stages of the visual hierarchy and thus to more transfer. However, task-difficulty is relative and how it is perceived varies between subjects. To model this interindividual difference in task-difficulty, we relate task-difficulty to the confidence of subjects. This confidence-based integrated reweighting model of perceptual learning accounts well for the experimental findings of Hung and Seitz (2014).
General Methods
Model architecture
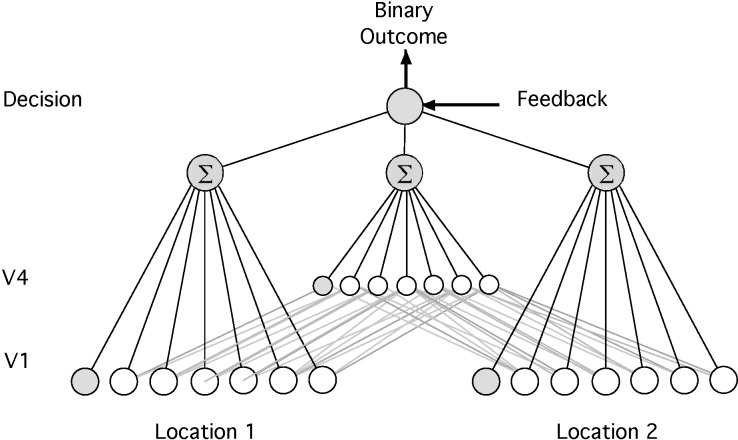
The model is a feed-forward neural network with a hierarchical architecture (Figure 1). It consists of four core components: two input components (referred to as V1 layer), one intermediate component (referred to as V4 layer), and one decision unit. Each V1 component represents a group of orientation-selective neurons possibly located in V1 or early in the visual pathway. The units in the V1 layer represent sets of neurons in two distinct retinal locations in different quadrants (but not necessarily in a different meridian) in the visual field, referred to as “Loc-1” and “Loc-2,” respectively. These V1 units generate the location-dependent representations of the input stimulus. The stimulus is presented to the network through activation of the V1 layer that corresponds to the stimulus location in that trial (Loc-1 or Loc-2). In addition to orientation-selective units, the V1 layer contains noise units corresponding to the presence of peripheral neurons whose activity is not related to the task but influences the final decision.
Figure 1.
Architecture of the model. The model contains an input layer that represents location-specific V1–like units and a middle layer that represents location-invariant V4–like units in the visual system. These two layers feed their output to a decision unit that integrates these responses to give a binary decision. The gray units in V1 and V4 layer “noise” units.
The units in the V4 layer receive inputs from both V1 components. As a result, they provide a location-independent representation of the inputs. More precisely, each unit in V4 layer receives its input from three different V1 units in each location. This results in the V4 units having broader tuning in orientation. The decision unit represents high-level decision-making areas in the brain and receives location-specific and location-independent representations from V1 and V4 layers, respectively. The decision unit determines the output of the network for the task by integrating the weighted inputs it receives from both V1 and V4 layers. Plasticity of the connections between the location-independent representations in V4 and the decision unit is responsible for transfer to occur between retinal locations.
V1 layer
The units in V1 layer are modelled as in Sotiropoulos et al. (2011). The orientation-selective units in each V1 component model simple cells characterized by elongated receptive fields, which are maximally triggered in the presence of a particular orientation. The additional noise units model the neighboring neurons whose activity is independent of the input presented. They yield additional decisional noise and their activity is drawn from scaled values of standard normal distribution to have values similar to that of their orientation-selective counterparts.
The response r of each orientation-selective unit is mathematically described by:
 |
where ξ introduces multiplicative noise in the final response and is drawn from the standard normal distribution. The mean firing rate r̂ of the oriented filter as a result of the projection of a particular input stimulus is given by:
 |
where rmax is the maximum possible firing rate, q is the total value derived from the receptive field function in response to the stimulus, q0 is the threshold indicating the minimum value of q that enables the neuron to fire and g is a gain parameter. [.]+ is the rectification operator that sets negative values of firing rate to zero, to ensure positive firing rate values. The value q derived from the receptive field function in response to the stimulus is given by:
 |
where I(x,y) is the intensity of the stimulus at the point (x,y), ε is a value drawn from standard normal distribution introducing noise in the output of the units and the mathematical description G(x,y) of the function of a receptive field is given by a Gabor function:
 |
where the parameters σx and σy define the width of 2D Gaussian envelope along the x and y axes, respectively; and f and ϕ determine the spatial frequency and phase of the sinusoidal component, respectively. The receptive fields are modeled as Gabor functions with parameters specified in Table 1. The orientation preferences of different orientation-selective units are obtained by standard rotation of coordinates for the implementation of respective receptive fields:
 |
θ is the angle of preferred orientation.
Each V1 component consists of units with 13 different preferred orientations equally spaced in the interval [−90°, 90°]. For each preferred orientation there are seven units with different values of spatial phase, resulting in 91 orientation selective units. Different values of spatial phase account for the model's accuracy while simulating spatial jittering to facilitate position invariant judgements. There are 59 additional noise units and thus each V1 component contains 150 units.
V4 layer
The V4 layer consists of 150 units, and each unit receives input from three different V1 units with adjacent orientation preferences and same-phase preference from both V1 components. This ensures that the V4 units have broader tuning curves than their V1 counterparts. For example, the V4 unit with an orientation preference for 00 receives input from the V1 units with orientation preference −150, 00, and 150 in each V1 locations. There are 77 orientation-selective V4 units and 73 additional noise units. The relatively greater number of noise units in the V4 layer simulates a lower signal-to-noise ratio compared to V1 layer, consistent with biological data (Ahissar & Hochstein, 2004). The noisy units are modeled similar to those in the V1 layer. Each non-noisy unit  receives the mean input from the three V1 units it is connected to.
  is given by:
 |
where  is the response of the V1 units to which it is connected. The index j varies such that each V4 unit receives input from three V1 units of neighboring orientations.
The response of each V4 unit is given by:
 |
where ξ introduces multiplicative noise in the final response and is drawn from the standard normal distribution. The V4 layer is responsible for enabling transfer of learning between retinal locations.
Decision unit
The output of the model simulates the response to a 2AFC experimental procedure and as such involves comparing a test to a reference stimulus. In the Vernier discrimination task, the stimulus contains two Gabor patches misaligned by an offset value specified for each trial. In the model, these Gabor patches are presented asynchronously with one Gabor patch acting as a reference stimulus and the other one as test stimulus (see the section titled “Perceptual task and stimuli”). For the orientation discrimination task, the reference stimulus is the Gabor patch with reference orientation and the test stimulus is the Gabor patch with an offset from the reference orientation specified for the trial (see the section titled “Model simulations”). Mathematically, the decision unit pools the activity from V1 and V4 and implements the comparison between the test and reference stimulus as follows:
 |
where f(.) is log-sigmoid function given by:
 |
 (
( ) and
) and  (
( ) are the weighted responses of V1 component and V4 component for test (reference) stimulus respectively, given by:
 |
 is the response of the ith Vk component (k = 1 or 4) and
  is the corresponding connection weight.
Using a log-sigmoid function restricts the value of O in the interval [0, 1], not necessarily a binary value. However, in a 2AFC task the network is required to give a binary output, i.e., 0 or 1. To achieve this, when O is greater than 0.5, the response is counted as 1 and when O is less than 0.5 the response is counted as 0. This binarized value is used to assess whether the network responses count as correct or incorrect in the material that follows.
Modeling confidence
Confidence is modeled as a linear function of output for a given trial. It is given by:
 |
For higher values of stimulus offset, the network's output O (Equation 8) given by the log-sigmoid function takes a value closer to 0 or 1 and for trials at threshold it takes a value closer to 0.5. As a result, the confidence (C) takes values closer to 1 for high values of stimulus offset (easy trials) and values closer to 0 for trials at threshold (difficult trials).
Learning for connections from V1 & V4 to decision unit
The network is trained in an online fashion, with feedback after every trial. The connections between the V1/V4 components and the decision unit are updated using the delta rule algorithm (Widrow & Hoff, 1960) and are initialized with values drawn from a uniform distribution in [−1, 1]. The delta rule algorithm minimizes the difference between the desired output (provided as a feedback) and the actual response of the network after each trial. According to the confidence-based learning mechanism we propose here, weights connecting V4 layer to the decision unit learn more on easy trials and weights connecting V1 layer to the decision unit learn more on trials at the threshold. The weights are updated after each trial and the weight update is mathematically given below:
For weights connecting V1 layer to the decision unit:
 |
For weights connecting V4 layer to the decision unit:
 |
where  is the learning rate of connections joining the Vk component to the decision unit (k = 1, 4). C is the confidence calculated for the given trial, given by Equation 11. The output of the network O is a function of connection weights from Vk to the decision unit (Equations 8 and 10). Hence O′ is the derivative of output of the network with respect to the corresponding connection weights. Since the output is a log-sigmoid function (Equation 9), this derivative is given by:
 |
Y is the desired binary output provided as a feedback after each trial .  is the response of the ith unit in the Vk component (k = 1, 4), which for the 2AFC task is given by:
 |
where  (
( ) is the response of the Vk node (k = 1, 4) node to the test (reference) stimulus.
To prevent the weights from increasing without bounds as a result of the update of weights in Equations 12 and 13, multiplicative normalization is implemented for each weight update. In addition to biological fidelity, this also imparts a competition between the weights during training. The weights after tth trial are thus given by:
 |
 is given by Equations 12 and 13 above.
As mentioned previously, the weights between V1/V4 layers to decision unit are randomly initiated. To simulate different subjects, we used different seeds to generate random initial weights for these conditions.
Perceptual task and stimuli
The experimental procedure adopted by Hung and Seitz (2014) is simulated using the model described above. In their experiments, a Vernier discrimination task was used. The Vernier stimulus consists of a pair of identical Gabor patches with constant contrast. In the vertical configuration, subjects had to indicate whether the lower Gabor was to the left or to the right of the upper Gabor. In the horizontal configuration, similarly, the subjects had to indicate whether the right Gabor was higher or lower than the left Gabor. The offset between the Gabor patches was varied using a staircase procedure. Participants were trained and tested at two visual field locations (Loc1 and Loc2), with the orientations of the Vernier stimuli at the two locations being perpendicular to each other (horizontal and vertical, respectively). To investigate transfer or specificity of learning, Hung and Seitz (2014) used two training procedures—multiple staircases and single staircases. In the multiple staircase condition, when the subject exceeded a fixed number of trials or reversals, the staircase is reset and this procedure is repeated a fixed number of times each day, resulting in a higher number of “easy” trials during training. In the single staircase condition, performed with a different group of subjects, training consisted of a single staircase with the stopping criteria being a fixed number of trials or a fixed number of reversals (greater than that for the multiple staircase procedure). In this case, the number of trials at threshold (“difficult” trials) during training is comparatively higher than in the multiple staircase condition. In the model, the Gabor patches are simulated similar to the receptive fields in the V1 units with zero phase and with centers separated by 40 arcmin. The Gabors are misaligned by an offset value specified for each trial (see Figure 2 for an example stimulus).
Figure 2.
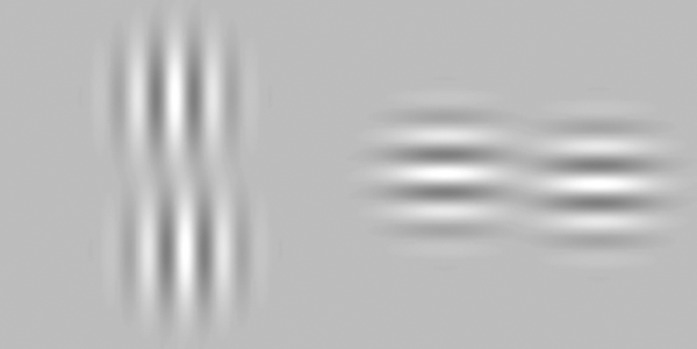
Example stimulus for Vernier discrimination task. Left-Vernier stimulus presented at location-1. Right-Vernier stimulus presented at location-2.
Training and testing
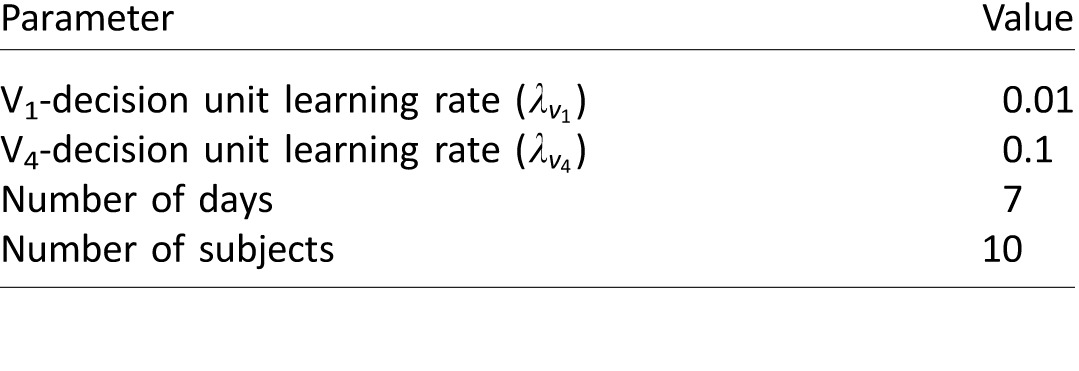
In this section, we present the methods we used to simulate the experiments of Hung and Seitz (2014). The parameters describing the experimental procedure were chosen to be as similar to the original experiments as possible. The model's learning rates were obtained by a grid search to obtain qualitative fits of the simulated results with the experimental results of Hung and Seitz (2014). All parameters are listed in Tables 2 and 3.
Consistent with the reverse hierarchy model of Ahissar and Hochstein (2004), the confidence-dependent learning rate of the weights makes it so that weights from V4 to the decision unit update at a faster rate with easy trials (high confidence). Conversely, the weights from V1 to the decision unit update faster when training with difficult trials (low confidence). This results in higher V4-decision unit weight optimization in the multiple staircase training method and higher V1-decision unit weight optimization in the single staircase training method.
We used a sequential double training procedure similar to the experiments, training, and testing of the network as similarly as possible to the experimental settings. The network is tested for orientation-1 (horizontal) at location-1 and orientation-1 at location-2 in the first session. A session in our simulations corresponds to a day in the experimental study. The first test session is followed by training the network for five sessions with orientation-1 at location-1 (Ori1-Loc1). In each training session, the end of a staircase is determined by a stopping criterion: In the single (multiple) staircase procedure, a staircase stops after 80 (10) reversals or 400 (50) trials, whichever condition is satisfied first. This way it was ensured that each session has a maximum of 400 trials, irrespective of the training procedure. The testing sessions are the same irrespective of the training condition. The testing sessions have one staircase with 50 trials. A mid-training testing session is performed to test any extent of transfer to the untrained location-2 (Ori1-Loc2). The network is then trained with orientation-2 (vertical) at location-2 (Ori2-Loc2) for five sessions. A post-training testing session is performed to assess the final transfer/specificity of learning between retinal locations. We used adaptive staircases procedure with three-down-one-up staircase rule during training as well as testing. During each trial the network is presented with Vernier discrimination task in which the lower (right) Gabor is to the right (above) or left (below) with respect to the upper (left) Gabor by a given offset value in the vertical (horizontal) configuration. A correct response is ‘1’ if the lower (right) Gabor is to the left (below) of the upper (left) Gabor and ‘0’ otherwise. Left/right or below/above offsets are chosen with equal probabilities.
Human subjects perform above chance for easy perceptual tasks, even before any training. On the other hand, an untrained network has a performance that is at chance irrespective of the stimulus offset. This is because no prior information is encoded into the network and the weights of the network from the V1/V4 layer to the decision unit are initialized randomly. To address this discrepancy in the baseline performance, Sotiropoulos et al. (2011) used a probabilistic mechanism that sets the response of the network to the desired output with a probability p that depends on the easiness (offset) of the task, irrespective of the training received. In principle, this probability p can be estimated from the baseline performance in real subjects. Here we simply set the probability p to follow a linear function taking the value 0.5 (chance) for the smallest offset and 0.8 for the largest offset. The exact shape of the probability function does not affect the results of our simulations.
Results
Hung and Seitz (2014) performed a 13-day study with 11 subjects. The subjects were sequentially trained on two different orientations of the Vernier stimuli, each at a different retinal location. In the first stage of double training (days 2 to 6), subjects were trained with orientation-1 at location-1 [Ori1-Loc1], and in the second stage (days 8 to 12) of double training, they were trained with orthogonal orientation at a diagonal location [Ori2-Loc2]. On days 1, 7, and 13, the subjects received pre-, mid-, and post-training testing sessions respectively. In the single staircase condition, sequential double training did not lead to improvement of performance for orientation-1 at location-2 [Ori1-Loc2] after training location-2 with orientation-2. However, when the training is performed with multiple staircases, improvement in performance was observed for orientation-1 at location-2. Furthermore, Hung and Seitz (2014) found that there were two different subgroups of subjects: One showed no transfer (specificity group) while the other showed transfer in midtesting session (transfer group).
Model simulations
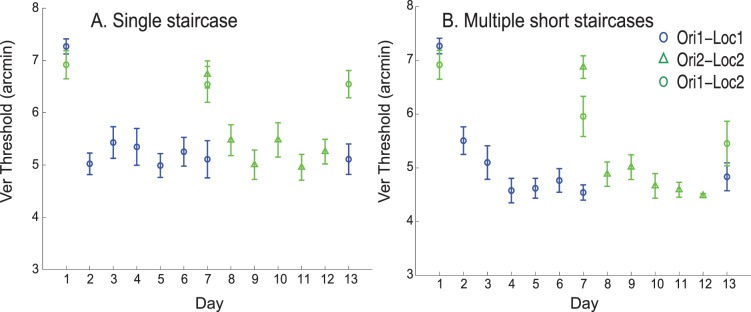
The result of simulations adopting the single staircase training procedure is shown in Figure 3A. Training the network with a single staircase resulted in minimal transfer of learning between retinal locations both at mid-training and post-training testing sessions. This is because using a single staircase corresponds to training the network with many trials at threshold (difficult trials). As explained earlier, training with a single staircase results in higher reliance of the location-dependent V1 units to the decision unit weights. Figure 3A is highly comparable to the behavioral results (e.g., figure 4D in Hung & Seitz, 2014) in the single staircase condition.
Figure 3.
Simulation results showing transfer of learning between retinal locations by training the network with multiple short staircases and specificity of learning by training the network with single staircase in Vernier discrimination task. (A) results after the training the network with single staircase and (B) results after training the network with multiple short staircases. Error bars represent standard error across different runs of simulations.
The result of simulations by training the network with multiple short staircases is shown in Figure 3B. Using multiple short staircases during training resulted in substantial transfer of learning between retinal locations at post-training testing session (day 13). In multiple short staircases there are many easy trials (larger offsets) during training, and this results in the relatively higher reliance on the location-independent V4–decision unit weights during the course of training. This enables transfer of learning between retinal locations. The simulation results in Figure 3B are highly comparable to the behavioral results (e.g., figure 4B in Hung & Seitz, 2014).
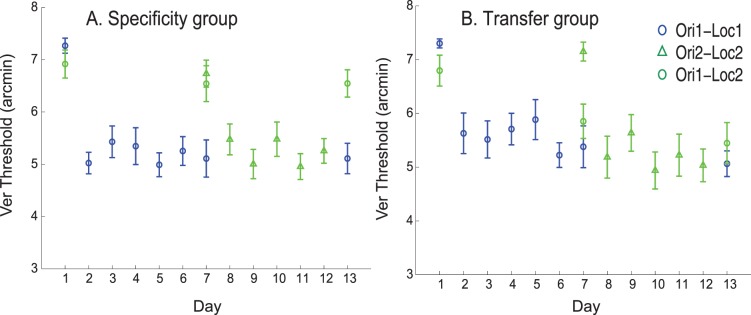
The experimental results of training with a single staircase (Hung & Seitz, 2014) showed two different subgroups: a “Specificity” group including six subjects and a “Transfer” group, including five subjects. The results shown in Figure 4A can account for the specificity group in the behavioral results (e.g., figure 5A in Hung & Seitz, 2014). For the Transfer group, we observed that transfer between retinal locations is dependent on the relative contribution of V1 units and V4 units in the final decision. Thus we modeled the transfer group by increasing the contribution of V4 units and decreasing the contribution of V1 units in Equation 8, which in this case reads:
 |
Figure 4.
Simulation results showing specificity group and transfer group by varying the weighting of V4 layer in the final decision in Vernier discrimination task. Panel A shows specificity group and Panel B shows transfer group. Error bars represent standard error across different runs of simulations.
We used k = 1.6. The simulation results are shown in Figure 4. In the transfer group, substantial transfer is observed between pre-training and mid-training testing sessions. No significant additional transfer is observed between mid-training and post-training testing sessions again matching the behavioral results (e.g., figure 5C in Hung & Seitz, 2014).
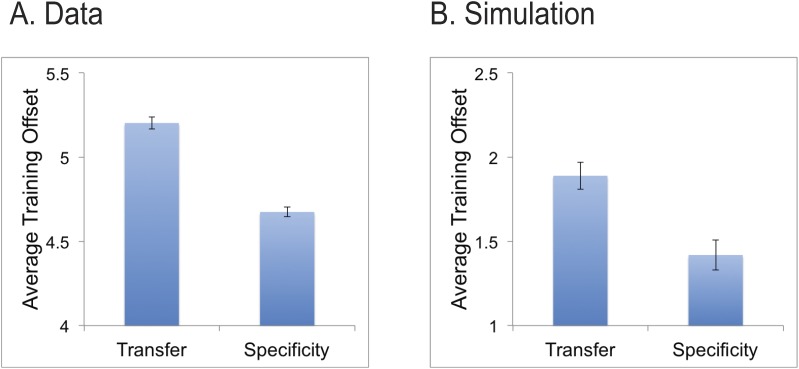
An interesting prediction from the model is that the greater reliance on V4 (which has broader tuning and lower signal-to-noise ratio) in the Transfer group will result in lower performance for small offsets and thus, on average and as a result of the staircase procedure, larger offsets during training. As a test of this prediction, we reanalyzed the behavioral data during training from the Hung and Seitz (2014) data set and found that this was indeed the case. As can be seen in Figure 5A, the Transfer group on average had larger offset (5.2 ± 0.035 arcmin) compared to the Specificity group (4.7 ± 0.029 arcmin), this difference was highly significant (p < 0.0001, unpaired t test). The model showed the same pattern of results, although the model did attain lower thresholds during training than the human subjects (Figure 5B). Overall, this data shows further support for the hypothesis that greater precision of training stimuli leads to greater specificity of learning (Jeter, Dosher, Petrov, & Lu, 2009).
Figure 5.
Average offsets during training for Specificity and Transfer groups. (A) data reanalyzed from Hung and Seitz (2014) and (B) simulation results. Error bars reflect standard error.
Simulations for Orientation discrimination task with single training
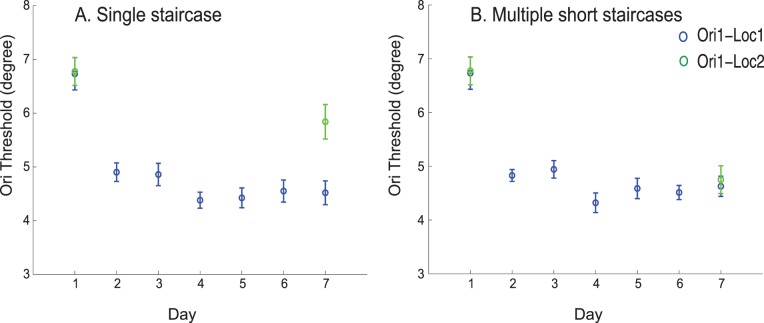
Hung and Seitz (2014) hypothesized that location specificity in a peripheral orientation discrimination task can also be accounted for by prolonged training at threshold. They conducted a seven-day study with two different groups of subjects: One group of eight subjects was trained with multiple short staircases and the second group of nine subjects was trained with a single staircase. Training for the orientation discrimination task was performed at a single retinal location (loc-1) on days 2 to 6 and transfer of learning was tested at two untrained diagonal locations (loc-2) on days 1 and 7. The group trained with multiple staircases showed greater transfer of learning to the untrained location than the group trained with a single staircase, although both groups showed some transfer. Hung and Seitz (2014) suggested that the reason transfer is observed in single staircase training might be related to the inclusion of a pretest, as this was shown to promote transfer in earlier studies of peripheral orientation discrimination (Zhang, Xiao, Klein, Levi, & Yu, 2010). We simulated these experiments with our model. Similar to the experimental procedure, we used an orientation discrimination task to train the network. The stimulus used is an orientated Gabor patch (with identical parameters as that of Vernier task) with an orientation of 45°.
We simulated the procedures of the peripheral orientation training study from Hung and Seitz (2014) with parameters specified in Table 3 with training and testing procedures conducted as similarly as possible to the behavioral study. During each trial, a reference stimulus with 45° orientation was presented followed by a test stimulus tilted either clockwise or anti-clockwise compared to the reference stimulus. A correct network response is to give the response ‘1’ if the test stimulus is oriented clockwise and the response ‘0’ if the test stimulus is oriented anti-clockwise compared to the reference stimulus (the clockwise and anticlockwise orientation offsets are chosen with equal probabilities). Adaptive three-down-one-up staircases were used during training as well as testing.
Model simulations mirrored behavioral results. Training the network with a single staircase showed less transfer of learning between retinal locations (Figure 6A) than training the network with multiple short staircases even in the absence of double training (Figure 6B). Thus, our model can account for the experimental observations of Hung and Seitz (2014) and for transfer of learning between retinal locations when training with multiple short staircases, even in the absence of double training.
Figure 6.
Simulation results showing transfer of learning between retinal locations by training the network with multiple short staircases and specificity of learning by training the network with single staircase in orientation discrimination task. (A) results after training the network with single staircase and (B) with multiple short staircases. Error bars represent standard error across different runs of simulations.
Discussion
Here we showed that a two-layer feed-forward, confidence-based integrated reweighting model can account for the experiments of Hung and Seitz (2014). The model displays a substantial transfer of learning between retinal locations after training with multiple short staircases and greater specificity after training with long staircases. Furthermore, individual differences observed while training with single staircase with double training method could be explained by relative differences in the contribution of the V1 and V4 stages of the model to the decision-making process.
This model builds on earlier work addressing how perceptual learning can be distributed across the visual hierarchy. For example, the reverse hierarchy theory of Ahissar and Hochstein (2004) suggests that the level at which learning occurs is related to the difficulty of the task, with the most learning occurring in the highest level area that can properly represent the stimuli to solve the task. Thus easier tasks were learned at higher levels, and showed more transfer, than did harder tasks. Jeter et al. (2009) expanded upon this work addressing how the precision of the stimuli involved, and not task difficulty per se, were the critical aspects determining transfer, and that learning in fact transferred to low precision tasks but not to high precision tasks. Later modeling work by Dosher et al. (2013) showed that a hierarchical IRT model, including both location variant and location invariant representations, could account for a wide variety of perceptual learning results. This IRT model suggested a framework to account for the double training results that we explored in the present work, where the precision of the training stimuli impacts the distribution of learning across the location-specific versus location-invariant representations, thus explaining different transfer results found in Hung and Seitz (2014).
To explain individual subject differences in initial transfer (even without double training), we varied the weighting in the model between the V1 and V4 representations to the decision unit. This allowed us to model the Transfer versus the Specificity groups (Figure 4). The Transfer group was modeled by assuming a greater contribution of location-independent representations (V4 layer) in the final decision process. Since the V4 units have broader tuning and lower signal-to-noise ratio, higher thresholds were observed in the model during training for the Transfer group compared to the Specificity group. This model prediction was tested and found to be true in a novel analysis of the experimental data of Hung and Seitz (2014) where the transfer group indeed showed less precise stimuli during training.
We further simulated another experiment of Hung and Seitz (2014) showing that a peripheral orientation discrimination task results in a greater transfer of learning between retinal locations by training with multiple short staircases than with prolonged training at threshold even in the absence of double- training. While it is the case that both our model simulations and the behavioral results of Hung and Seitz (2014) do show significant transfer of peripheral orientation training, the extent of this transfer is greater when multiple staircases are employed. This is again because the less precise stimuli produce greater learning of the readout from the V4 than the V1 representations in the model.
A key aspect of the model was the confidence mechanism motivated by Ahissar and Hochstein (2004). The implementation of confidence in the current model is based on the amplitude of the response output of the network. A future direction is to base confidence upon the reliability of the output from each of the V1 and V4 layers and have the most reliable layer contributing most to learning. In essence, this would be implemented by splitting Equation 8 into components for each layer (OV1 and OV4) and by deriving a confidence score for each independently (CV1 and CV4). The key for any such mechanism to work is that at greater precision V1 provides a more reliable answer (because of tighter tuning and lower noise) and that at less precision V4 provides a more reliable answer. Also, an interesting future direction would be to conduct a series of experiments that measure subjects' confidence about their decision at the end of each trial. If subjective confidence is directly related to how the decision structures in the model weight their inputs and determine learning, then quantifying subjects' confidence and using this instead of abstract linear relationship that we adopted in this paper could provide a better account of individual subject differences in learning.
An important consideration in evaluating this model is that while the mechanisms of plasticity are conceptualized within a readout framework, there is an inherent ambiguity in the relationship between model and brain mechanisms. For example, changes in readout weights cannot be simply dissociated from changes in response strength of cells in visual representation areas. Likewise, changes in top-down connections (not explicitly modeled here) are also consistent with the observed effects raising the possibility of attention changes as an alternative explanation to representation changes and readout changes. Attention has long been considered a key gating factor in determining what is learned in perceptual learning (Ahissar & Hochstein, 1993; Schoups et al., 2001; Seitz & Watanabe, 2005; Shiu & Pashler, 1992), and also as the system that may change through learning (Byers & Serences, 2012; Xiao et al., 2008; Zhang, Cong, Song, & Yu, 2013). While the extent to which representation changes contribute to learning, readout, decision processes, or attention processes cannot be truly dissociated within the context of the present model, an important topic for future computational and experimental works will be to clarify the roles of these different systems in perceptual learning.
While there has been substantial controversy in recent literature regarding the specificity of perceptual learning, we suggest that different results can be reconciled through an analysis of how training and testing parameters differ across studies and through understanding of individual subject differences. Our model results show that, as suggested by Hung and Seitz (2014), transfer or specificity can depend upon the precision of stimuli used during training (and how this varies between multiple and single staircase procedures). There are numerous other methodological details that also differ across labs and studies that likely impact what subjects learn. These can be simulated in models, such as the one put forth here, so that their impact can be better understood.
Supplementary Material
Acknowledgments
We thank Grigorios Sotiropoulos, Nataly Chiridou, Duje Tadin, Cong Yu, Barbara Dosher, and Zhong-Lin Lu for useful discussions regarding the work. Research was supported by NIH (1R01EY023582).
Commercial relationships: none.
Corresponding authors: Aaron R Seitz; Peggy Seriès.
Email: aseitz@ucr.edu; pseries@inf.ed.ac.uk.
Address: Psychology Department, University of California at Riverside, Riverside, CA, USA; Informatics, University of Edinburgh, Edinburgh, Scotland, UK.
Appendix
Table 1.
Simulation parameters for units in model V1. The parameters σx, σy, and f are identical to stimulus parameters used in the experiments of Hung and Seitz (2014). Parameters rmax, q0, and g are taken such that the oriented units produced realistic values of firing rates across the range of stimuli presented.
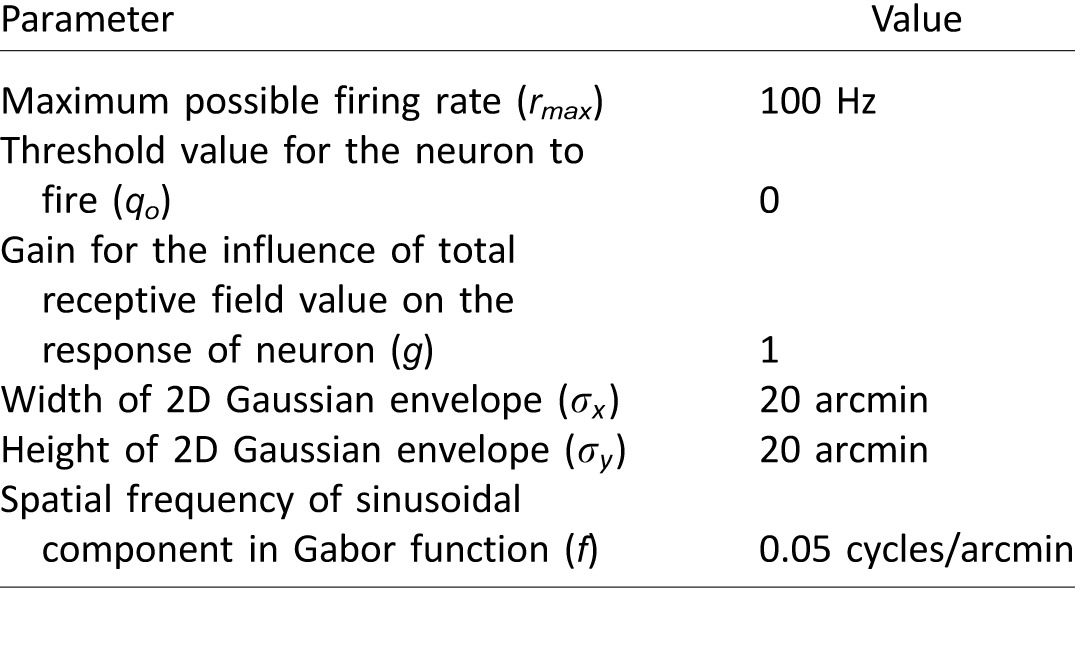
Table 2.
Simulation parameters for Vernier discrimination task. Learning rates are obtained by a grid search to achieve qualitative fits of the experimental results of Hung and Seitz (2014). Experimental simulation parameters are identical to those of the experimental procedure of Hung and Seitz (2014).
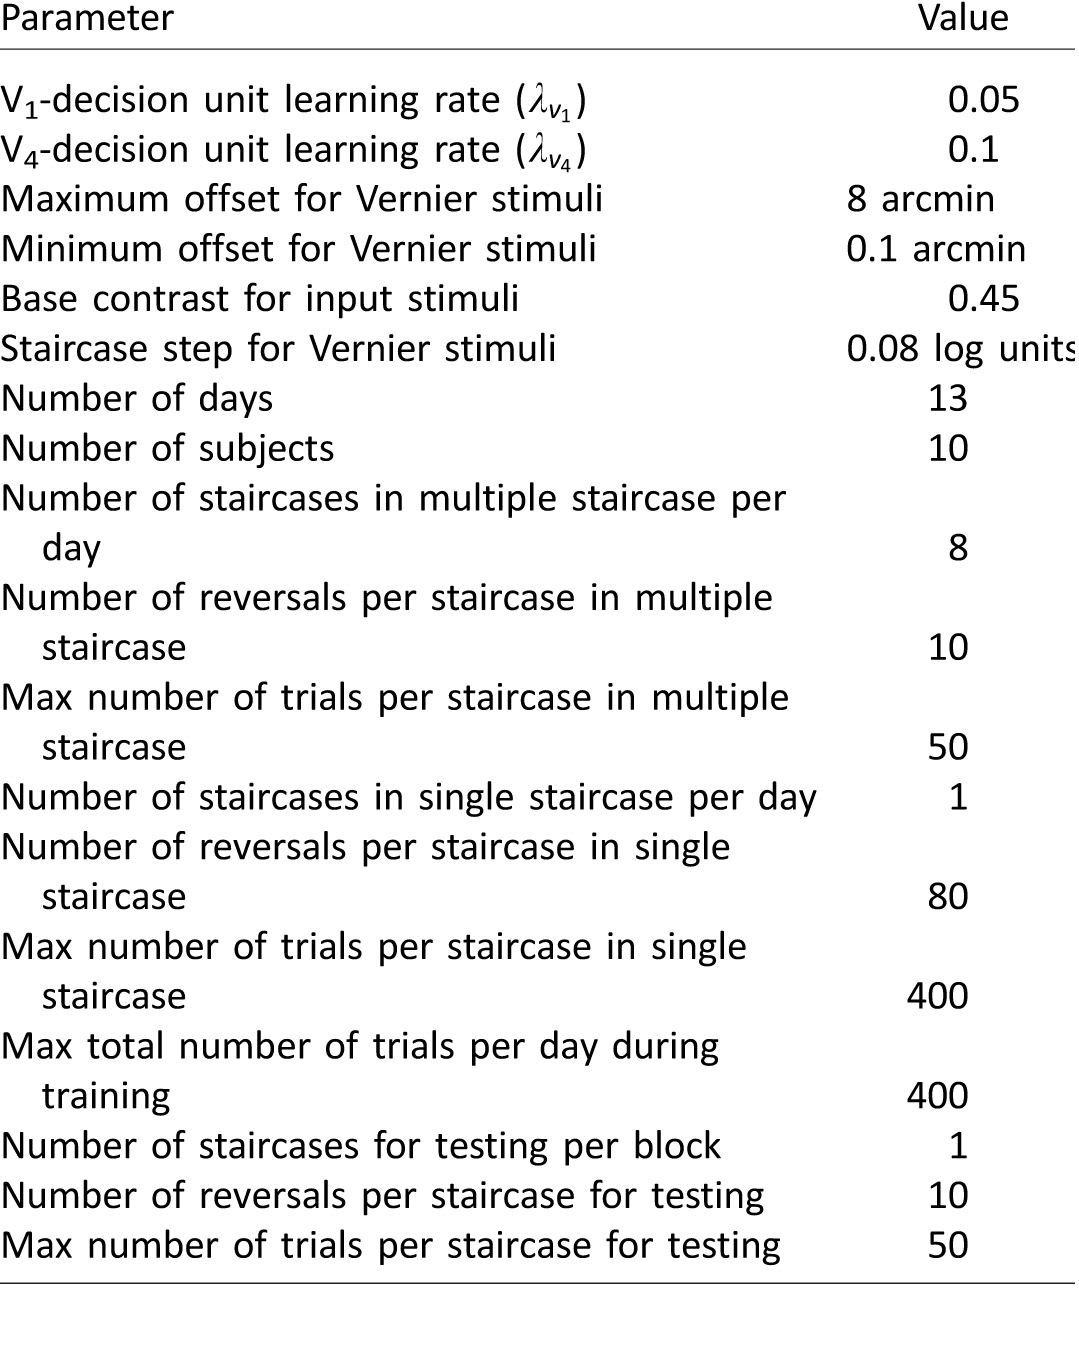
Table 3.
Simulation parameters for orientation discrimination task. Learning rates are obtained by a grid search to achieve qualitative fits of the experimental results of Hung and Seitz (2014). Experimental simulation parameters are identical to those of the experimental procedure of Hung and Seitz (2014). Other parameters of training procedure are identical to those of Table 2.
Contributor Information
Bharath Chandra Talluri, Email: bharathchandra.talluri@gmail.com.
Shao-Chin Hung, Email: shung004@ucr.edu.
Aaron R. Seitz, aseitz@ucr.edu, http://www.faculty.ucr.edu/~aseitz/.
Peggy Seriès, pseries@inf.ed.ac.uk, http://homepages.inf.ed.ac.uk/pseries/.
References
- Ahissar M.,, Hochstein S. (1993). Attentional control of early perceptual learning. Proceedings of the National Academy of Sciences, USA, 90 (12), 5718–5722. [DOI] [PMC free article] [PubMed] [Google Scholar]
- Ahissar M.,, Hochstein S. (2004). The reverse hierarchy theory of visual perceptual learning. Trends in Cognitive Sciences, 8 (10), 457–464. [DOI] [PubMed] [Google Scholar]
- Byers A.,, Serences J. T. (2012). Exploring the relationship between perceptual learning and top-down attentional control. Vision Research, 74, 30–39. [DOI] [PMC free article] [PubMed] [Google Scholar]
- Dosher B. A.,, Jeter P.,, Liu J.,, Lu Z.-L. (2013). An integrated reweighting theory of perceptual learning. Proceedings of the National Academy of Sciences, USA, 110 (33), 13678–13683. [DOI] [PMC free article] [PubMed] [Google Scholar]
- Dosher B. A.,, Lu Z.-L. (1998). Perceptual learning reflects external noise filtering and internal noise reduction through channel reweighting. Proceedings of the National Academy of Sciences, USA, 95 (23), 13988–13993. [DOI] [PMC free article] [PubMed] [Google Scholar]
- Hung S.-C.,, Seitz A. R. (2014). Prolonged training at threshold promotes robust retinotopic specificity in perceptual learning. The Journal of Neuroscience, 34 (25), 8423–8431. [DOI] [PMC free article] [PubMed] [Google Scholar]
- Jeter P. E.,, Dosher B. A.,, Petrov A.,, Lu Z. L. (2009). Task precision at transfer determines specificity of perceptual learning. Journal of Vision, 9 (3): 17, 1–13, doi:10.1167/9.3.1. [PubMed] [Article] [DOI] [PMC free article] [PubMed] [Google Scholar]
- Karni A.,, Sagi D. (1991). Where practice makes perfect in texture discrimination: Evidence for primary visual cortex plasticity. Proceedings of the National Academy of Sciences, USA, 88 (11), 4966–4970. [DOI] [PMC free article] [PubMed] [Google Scholar]
- Petrov A. A.,, Dosher B. A.,, Lu Z.-L. (2005). The dynamics of perceptual learning: An incremental reweighting model. Psychological Review, 112 (4), 715. [DOI] [PubMed] [Google Scholar]
- Schoups A.,, Vogels R.,, Qian N.,, Orban G. (2001). Practising orientation identification improves orientation coding in V1 neurons. Nature, 412, 549–552. [DOI] [PubMed] [Google Scholar]
- Seitz A. R.,, Yamagishi N.,, Werner B.,, Goda N.,, Kawato M.,, Watanabe T. (2005). Task-specific disruption of perceptual learning. Proceedings of the National Academy of Sciences, USA, 102 (41), 14895–14900. [DOI] [PMC free article] [PubMed] [Google Scholar]
- Seitz A.,, Watanabe T. (2005). A unified model for perceptual learning. Trends in Cognitive Sciences, 9 (7), 329–334. [DOI] [PubMed] [Google Scholar]
- Shiu L. P.,, Pashler H. (1992). Improvement in line orientation discrimination is retinally local but dependent on cognitive set. Perception & Psychophysics, 52 (5), 582–588. [DOI] [PubMed] [Google Scholar]
- Sotiropoulos G.,, Seitz A. R.,, Seriès P. (2011). Perceptual learning in visual hyperacuity: A reweighting model. Vision Research, 51 (6), 585–599. [DOI] [PubMed] [Google Scholar]
- Webb B. S.,, Roach N. W.,, McGraw P. V. (2007). Perceptual learning in the absence of task or stimulus specificity. PLoS One, 2 (12), 1323. [DOI] [PMC free article] [PubMed] [Google Scholar]
- Weiss Y.,, Edelman S.,, Fahle M. (1993). Models of perceptual learning in vernier hyperacuity. Neural Computation, 5 (5), 695–718. [Google Scholar]
- Widrow B.,, Hoff M. E. (1960). Adaptive switching circuits. Institute of Radio Engineers, Western Electronic Show and Conventions, Convention Record, 4, 96–104. [Google Scholar]
- Xiao L. Q.,, Zhang J.-Y.,, Wang R.,, Klein S. A.,, Levi D. M.,, Yu C. (2008). Complete transfer of perceptual learning across retinal locations enabled by double training. Current Biology, 18 (24), 1922–1926. [DOI] [PMC free article] [PubMed] [Google Scholar]
- Zhang G. L.,, Cong L.-J.,, Song Y.,, Yu C. (2013). ERP P1-N1 changes associated with Vernier perceptual learning and its location specificity and transfer. Journal of Vision, 13 (4): 17, 1–13, doi:10.1167/13.4.19. [PubMed] [Article] [DOI] [PubMed] [Google Scholar]
- Zhang T.,, Xiao L.-Q.,, Klein S. A.,, Levi D. M.,, Yu C. (2010). Decoupling location specificity from perceptual learning of orientation discrimination. Vision Research, 50, 368–374. [DOI] [PubMed] [Google Scholar]
Associated Data
This section collects any data citations, data availability statements, or supplementary materials included in this article.


