

Background: Angiotensin receptor (AT1R) blockers are critical therapeutics used to treat cardiovascular disease.
Results: We solved the AT1R-olmesartan structure and identified specific interactions for olmesartan derivatives with different functions.
Conclusion: Our results identified residues critical for the binding of different ligands and allosteric modulation by sodium ion.
Significance: Our results provide new insights into the structural basis for ligand recognition and functional selectivity at AT1R.
Keywords: angiotensin, crystal structure, G protein-coupled receptor (GPCR), hypertension, protein-drug interaction, biased ligands, sodium ion
Abstract
Angiotensin II type 1 receptor (AT1R) is the primary blood pressure regulator. AT1R blockers (ARBs) have been widely used in clinical settings as anti-hypertensive drugs and share a similar chemical scaffold, although even minor variations can lead to distinct therapeutic efficacies toward cardiovascular etiologies. The structural basis for AT1R modulation by different peptide and non-peptide ligands has remained elusive. Here, we report the crystal structure of the human AT1R in complex with an inverse agonist olmesartan (BenicarTM), a highly potent anti-hypertensive drug. Olmesartan is anchored to the receptor primarily by the residues Tyr-351.39, Trp-842.60, and Arg-167ECL2, similar to the antagonist ZD7155, corroborating a common binding mode of different ARBs. Using docking simulations and site-directed mutagenesis, we identified specific interactions between AT1R and different ARBs, including olmesartan derivatives with inverse agonist, neutral antagonist, or agonist activities. We further observed that the mutation N1113.35A in the putative sodium-binding site affects binding of the endogenous peptide agonist angiotensin II but not the β-arrestin-biased peptide TRV120027.
Introduction
Angiotensin II (AngII)5 type 1 receptor (AT1R) is a G protein-coupled receptor (GPCR), mainly found in heart, brain, liver, and kidneys, regulating normal blood pressure, as well as fluid and electrolyte homeostasis (1, 2). Overstimulation of AT1R leads to diseases such as hypertension, cardiovascular hypertrophy, and fibrosis, whereas blocking the activity of AT1R lowers blood pressure (3, 4). Considering the critical roles of AT1R in cardiovascular pathophysiology, AT1R blockers (ARBs) have been developed and clinically used for the treatment of hypertension, diabetic nephropathy, cardiac hypertrophy, arrhythmia, and renal failure (5–8). ARBs share similar structural motifs and include widely used anti-hypertensive drugs, such as losartan, candesartan, valsartan, irbesartan, telmisartan, eprosartan, olmesartan, and azilsartan (5, 6, 9, 10). Although most ARBs are considered to be neutral AT1R antagonists, olmesartan, for example, is an established inverse agonist toward inositol phosphate (IP) production (11).
In addition to anti-hypertensive activity, some ARBs also show variable efficacies toward protection against organ damage in diabetic nephropathy, cardiac hypertrophy, arrhythmia, and renal failure (5). Multiple studies suggest that such additional tissue-protective benefits from treatment with ARBs may be mediated by AT1R β-arrestin signaling, although the structural basis for differential activation of this mechanism by ARBs is unknown (8, 10). AngII analogs, such as TRV120027, lacking G protein agonism but activating β-arrestin signaling, protect the heart and vasculature in a pathological setting better than common ARBs (2, 8, 9), suggesting the need for a better understanding of the mechanisms for functional selectivity of different AT1R ligands.
Recently, we determined the room temperature crystal structure of AT1R in complex with its antagonist ZD7155 using serial femtosecond crystallography at an x-ray free-electron laser (12). Here, we further elucidated the function of a representative inverse agonist by solving the crystal structure of olmesartan-bound AT1R using conventional x-ray cryo-crystallography at a synchrotron source. Comparison of the two AT1R structures revealed similar conformations of the receptor and conserved molecular recognition modes for antagonist and inverse agonist toward AT1R. Molecular docking simulations and site-directed mutagenesis led to identification of residues in AT1R that differentially interact with ARBs, as well as olmesartan derivatives in which specific modifications altered pharmacological properties from inverse agonism to neutral antagonism and partial agonism. Our results thus revealed a paradigm for pharmacological modulation of functional selectivity that might be generally applicable to other ARBs interacting with AT1R. Furthermore, mutagenesis of the conserved residues in the putative sodium-binding pocket suggested their involvement in AT1R regulation by the β-arrestin biased peptide ligand TRV120027.
Experimental Procedures
Protein Engineering for Structural Studies
DNA encoding the human AT1R was optimized for expression in insect cells and synthesized by GenScript. The construct used for the AT1R-olmesartan structure has truncations of residues 1, 7–16, and 316–359. The apocytochrome b562 RIL from Escherichia coli with mutations M7W, H102I, and R106L (BRIL (13)) was fused to the N terminus of AT1R. The BRIL-AT1R chimera sequence was subcloned into pFastBac1 vector (Invitrogen), with N-terminal hemagglutinin (HA) signal sequence, a FLAG tag, a His10 tag, and a tobacco etch virus protease cleavage site.
Protein Expression and Purification
The BRIL-AT1R protein was expressed in Spodoptera frugiperda (Sf9) insect cells using the Bac-to-Bac baculovirus expression system (Invitrogen). Cells expressing the BRIL-AT1R protein were lysed by repeated washing and centrifuging with the hypotonic buffer (10 mm HEPES, pH 7.5, 10 mm MgCl2, 20 mm KCl) and the high osmotic buffer (10 mm HEPES, pH 7.5, 1.0 m NaCl, 10 mm MgCl2, 20 mm KCl), adding the EDTA-free complete protease inhibitor mixture tablets (Roche Applied Science). The washed membranes were suspended in the hypotonic buffer with 100 μm olmesartan (Sigma). After a 1-h incubation at 4 °C, the membranes were then solubilized in 50 mm HEPES, pH 7.5, 500 mm NaCl, 1% (w/v) n-dodecyl-β-d-maltopyranoside (DDM, Anatrace), 0.2% (w/v) cholesterol hemisuccinate (CHS, Sigma), and 20% (v/v) glycerol, for 4 h. The supernatant containing the solubilized BRIL-AT1R protein was isolated by high speed centrifugation and then bound to TALON IMAC resin (Clontech) overnight. The resin was washed with 10 column volumes of washing buffer I (50 mm HEPES, pH 7.5, 500 mm NaCl, 10% (v/v) glycerol, 0.1% (w/v) DDM, 0.02% (w/v) CHS, 20 mm imidazole, and 20 μm olmesartan) and 10 column volumes of washing buffer II (50 mm HEPES, pH 7.5, 500 mm NaCl, 10% (v/v) glycerol, 0.05% (w/v) DDM, 0.01% (w/v) CHS, 50 mm imidazole, and 20 μm olmesartan). The BRIL-AT1R protein was eluted by 3 column volumes of eluting buffer (50 mm HEPES, pH 7.5, 500 mm NaCl, 10% (v/v) glycerol, 0.02% (w/v) DDM, 0.004% (w/v) CHS, 300 mm imidazole, and 100 μm olmesartan). The BRIL-AT1R protein was then treated overnight with His-tagged tobacco etch virus protease and peptide:N-glycosidase F to cleave the tags and glycosylation sites and concentrated to 30 mg/ml with a 100-kDa cutoff concentrator (Vivaspin) for crystallization. The protein yield and monodispersity were tested by analytical size exclusion chromatography.
Lipidic Cubic Phase Crystallization
The BRIL-AT1R protein was reconstituted in lipidic cubic phase (LCP) by mixing the protein with monoolein supplemented with 10% cholesterol using a lipid syringe mixer (14). Crystallization trials were performed by an NT8-LCP robot (Formulatrix) in 96-well glass sandwich plates (Marienfeld) using 40 nl of protein-loaded LCP and 800 nl of precipitant solution per well. Plates were stored at 20 °C and imaged using a Rock Imager 1000 (Formulatrix). The crystals grew in the condition of 100 mm sodium citrate, pH 5.0, 400 mm KH2PO4, 25% (v/v) PEG400, and 6% (v/v) DMSO. The crystals were harvested using micromounts (MiTeGen) directly from LCP and flash-frozen in liquid nitrogen for diffraction data collection.
Diffraction Data Collection and Structural Determination
Crystallographic data collection was performed at 23ID-D beamline (GM/CA) of the Advanced Photon Source at Argonne National Laboratory. An unattenuated 10-μm minibeam with a wavelength of 1.0330 Å was used at 1 s exposure and 1.0° oscillation. Diffraction data were collected using a Pilatus3 6M detector from four non-overlapping spots on a single cryo-cooled at 100K crystal of 70 × 70 × 15 μm3 in size and then integrated and scaled using XDS (15). The molecular replacement solution was obtained by Phaser (16) in a CCP4 suite (17) using separate AT1R and BRIL molecules from the AT1R-ZD7155 structure (Protein Data Bank code 4YAY) as search models. The resulting BRIL-AT1R chimera model was refined by cycling between Refmac5 (18) and manual adjustments in Coot (19). Because of the merohedral twinned data in the P32 space group, twinning refinement with twin law (h,k,l and k,h,−l) determined by phenix.xtriage (20) and Refmac5 was used. The presence of twinning did not impede structure solution by molecular replacement. The overall model has a good stereochemistry with no Ramachandran outliers (94.3% in favored and 5.7% in allowed regions) as determined by MolProbity (21). The crystallographic data collection and refinement statistics are shown in Table 1.
TABLE 1.
Crystallographic data collection and refinement statistics
One crystal was used for the data set. Highest resolution shell is shown in parentheses.
| AT1R-olmesartan | |
|---|---|
| Data collection | |
| Space group | P32 |
| Cell dimensions | |
| a, b, c (Å) | 41.20, 41.20, 251.16 |
| α, β, γ (°) | 90, 90, 120 |
| Resolution (Å) | 35.68–2.80 (2.87–2.80) |
| Rmerge | 0.054 (0.758) |
| I/σI | 11.1 (1.2) |
| Completeness (%) | 94.0 (85.3) |
| Redundancy | 2.4 (2.1) |
| Refinement | |
| Resolution (Å) | 35.68–2.80 |
| No. of reflections | 10,472 (555) |
| Rwork/Rfree | 0.194/0.235 |
| No. of atoms | 2951 |
| Receptor/BRIL | 2918 |
| Ligand | 33 |
| B factors (Å2) | |
| Receptor | 86.2 |
| BRIL | 89.2 |
| Ligand | 78.9 |
| Root mean square deviations | |
| Bond lengths (Å) | 0.009 |
| Bond angles (°) | 1.13 |
Docking of Olmesartan Derivatives into the AT1R Ligand-binding Pocket
Olmesartan derivatives were docked into the AT1R crystal structure using the energy-based docking protocol implemented in ICM molecular modeling software suite (Molsoft, LLC). The initial receptor docking model was generated by adding missing side chains and hydrogen atoms and by optimizing their conformations, followed by generation of soft potential maps of the receptor in a large box (30 × 30 × 30 Å3) covering the extracellular half of the receptor. Molecular models of compounds were generated from two-dimensional representations, and their three-dimensional geometry was optimized using MMFF-94 force field (22). Molecular docking employed biased probability Monte Carlo optimization of the ligand internal coordinates in the grid potentials of the receptor (23). To ensure convergence of the docking procedure, at least five independent docking runs were performed for each ligand starting from a random conformation; Monte Carlo sampling and optimization were performed at “thoroughness” parameter set to 30. The objective energy function included the ligand internal strain and a weighted sum of the grid map values in ligand atom centers. Up to 30 alternative complex conformations of the ligand-receptor complex were generated and rescored using the ICM binding score function (24, 25) calculated as shown in Equation 1,
 |
where EvW, Eel, Ehb, Ehp, and Esf are van der Waals, electrostatic, hydrogen bonding, non-polar, and polar atom solvation energy differences between bound and unbound states; Eint is the ligand internal strain; ΔSTor is the ligand conformational entropy loss upon binding; T = 300 K, and α1,2,3,4 are all ligand- and receptor-independent constants. The results of individual docking runs for each ligand were considered consistent if at least three of the five docking runs produced similar ligand conformations (root mean square deviation of <2.0 Å) and Binding Score <−20.0 kJ/mol. All calculations were performed using 32-core AMD Opteron 2.3 GHz work station running Linux CentOS 6, taking about 10 min/ligand. The unbiased docking procedure did not use distance restraints or any other a priori derived information for the ligand-receptor interactions.
Construction of AT1R Mutants and Cell Transfection
Complementary DNA (cDNA) encoding the human AT1R with N-terminal HA-tag (HA-AT1R) was originally cloned into the expression vector pMT3 at the EcoRI and NotI sites. The single mutants were constructed by a PCR-based site-directed mutagenesis strategy as described previously (26). COS1 cells were grown in Dulbecco's modified Eagle's medium (DMEM) (Invitrogen) supplemented with 10% fetal bovine serum (FBS, Thermo Fisher Scientific) and 100 IU of penicillin/streptomycin (Sigma). Cells were seeded onto poly-d-lysine-treated cell culture plates at a density of 3 × 10⁶ cells per 10-cm diameter plate. After overnight culture, the cells were transiently transfected with wild-type or mutant AT1R DNA using FuGENE 6 transfection reagent (Roche Applied Science) according to the manufacturer's instructions.
Membrane Preparation for Binding Assays
Ligand binding was analyzed using total membranes prepared from COS1 transiently expressing wild-type HA-AT1R and BRIL-AT1R constructs. Transfected/infected cells were harvested in osmotic lysis buffer (25 mm Tris-HCl, pH 7.5, and 5 mm EDTA, pH 8.0) with protease inhibitor mixture (Sigma) homogenized by a dounce homogenizer. The homogenate was incubated by rotating for 10 min at 4 °C and centrifuged for 5 min at 200 × g. The supernatant was then centrifuged at 37,000 × g for 30 min at 4 °C. The precipitate containing the total membranes was suspended in membrane binding buffer (140 mm NaCl, 5.4 mm KCl, 1 mm EDTA, 0.006% bovine serum albumin (BSA), 25 mm HEPES, pH 7.4). Protein concentration was determined by the Bio-Rad Protein Assay. For both saturation and competition binding assays, 10 μg of homogeneous cell membrane was used per well as described above.
125I-AngII Binding Assays
Saturation binding assays were performed under equilibrium conditions with 125I-AngII (gift from Dr. Robert Speth, University of Mississippi) concentrations ranging between 0.125 and 12 nm (specific activity, 2176 Ci/mmol) as triplicates in 96-well plates for 1 h at room temperature as described previously (27). Nonspecific binding was measured in the presence of 10−5 m 125I-AngII (Bachem). The cells were harvested by filtering the binding mixture through Whatman GF/C glass fiber filters (102 × 256 mm), which were extensively washed with washing buffer (20 mm sodium phosphate, 100 mm NaCl, 10 mm MgCl2, 1 mm EGTA, pH 7.2). The bound ligand fraction was determined as the counts/min using a scintillation counter (MicroBeta2 Plate Counter, PerkinElmer Life Sciences). The binding kinetics were analyzed by the nonlinear curve-fitting program LigandR. The means ± S.E. for the Kd and Bmax values were calculated.
[3H]Olmesartan Binding Assays
Saturation binding assays were performed under equilibrium conditions, with [3H]olmesartan (American Radiolabeled Chemicals) concentrations ranging between 0.125 and 12 nm (specific activity, 16 Ci/mmol) as duplicates in 96-well plates for 1 h at room temperature. Nonspecific binding was measured in the presence of 10−5 m olmesartan (gift from Daichi-Sankyo Co., Japan). The cells were harvested by filtering the binding mixture through Whatman GF/C glass fiber filters (102 × 256 mm), which were extensively washed with washing buffer (20 mm sodium phosphate, 100 mm NaCl, 10 mm MgCl2, 1 mm EGTA, pH 7.2). The filter membranes were soaked in 5 ml of Ecoscint A scintillation fluid (National Diagnostics) and incubated for 1 h at room temperature. The bound ligand fraction was determined as the disintegrations/min using a Beckman LS 6000 Liquid Scintillation Counter (Global Medical Instrumentation). The binding kinetics were analyzed by nonlinear curve fitting. The means ± S.E. for the Kd and Bmax values were calculated.
Competition Binding Assays
Competition binding assays were performed under equilibrium conditions, with 2 nm radioligand and concentrations of the competing ligand ranging between 0.04 and 1000 nm. The binding kinetics were analyzed by the nonlinear curve-fitting program GraphPad Prism 5. The means ± S.E. for the IC50 values were calculated. Olmesartan derivatives were gifts from Daichi-Sankyo Co., Japan. Losartan was a gift from Merck, and candesartan was a gift from Astra Zeneca. Telmisartan and eprosartan were purchased from Santa Cruz Biotechnology, and valsartan was purchased from Toronto Research Chemicals.
Fluorescent Imaging Plate Reader (FLIPR®)-based Intracellular Calcium Levels in Cells
Calcium levels were measured using FLIPR® calcium 5 assay kit (Molecular Devices). A day before the calcium experiments, HA-AT1R- and BRIL-AT1R-transfected cells were seeded at a density of 100,000 cells/well in 100 μl of medium onto a 96-well clear bottom black cell culture plate that was pre-coated with poly-l-lysine. The plate was maintained in a cell culture incubator set at 37 °C for 26–28 h. On the day of the experiment, cells were initially serum-starved for 2 h by replacing the medium with 80 μl of serum-free DMEM. Following serum starvation, 100 μl of calcium-sensitive dye along with 2× (2.5 mm final concentration) probenecid (Life Technologies, Inc.) was added to the cells. During this step, for antagonist dose-response curves, 20 μl of desired concentrations of antagonist from a 10× stock prepared in D-PBS (1.47 mm KH2PO4, 138 mm NaCl, 2.67 mm KCl, 8.1 mm Na2HPO4, pH 7.3) were added to the cells. For all other wells 20 μl of D-PBS was added. The cells were maintained for 30 min in the cell culture incubator set at 37 °C and another 30 min at room temperature. During the incubation, ligands at 5× the desired final concentration in D-PBS were prepared in a U-bottom 96-well plate. Both the cells and ligand containing 96-well plates were loaded on to a Flexstation 3 instrument (Molecular Devices). The instrument was programmed in FLEX mode to add ligands (50 μl at 5× concentration) to the cells and to monitor the fluorescence before and after adding the ligands. During measurements of agonist dose response, AngII was added at various concentrations. 100 nm AngII was added for antagonist dose-response curves wherein the cells were already pre-treated with the desired concentrations of antagonist during the calcium dye loading step.
IP Formation Studies
COS1 cells (cultured in 60-mm Petri dishes), 24 h after transfection, were labeled for 24 h with [3H]myoinositol (1.5 mCi/Petri dish), 22 Ci/mmol specific activity (Amersham Biosciences), at 37 °C in DMEM containing 10% bovine calf serum. The labeled cells were washed with serum-free medium three times and incubated with DMEM containing 10 mm LiCl for 20 min; specified ligands (1 μm final concentration) were added, and incubation was continued for another 60 min at 37 °C. At the end of incubation, the medium was removed, and total soluble IP was extracted from the cells by the perchloric acid extraction method. The amount of [3H]IP in the perchloric acid extract was counted.
ELISA-based Estimation of Wild Type and Mutated AT1R in Cells
24 h after transfection, cells were split into 12-well plates at a density of 500,000 cells per well. After an additional 24 h, cells were washed twice with Hanks' balanced salt solution (HBSS: 0.44 mm KH2PO4, 0.34 mm Na2HPO4, 137 mm NaCl, 5.36 mm KCl, 1.26 mm CaCl2, 0.81 mm MgSO4, 0.5 mm MgCl2, 4.17 mm NaHCO3, 5.55 mm d-glucose, pH 7.3) with 1% BSA, and HA-hAT1R was labeled with anti-HA antibody (1 μg/ml, Sigma) in HBSS, 1% BSA for 1 h at 4 °C. The cells were then washed twice with HBSS, 1% BSA, and cells were fixed with 4% paraformaldehyde in HBSS for 15 min. All steps prior to cell fixing were carried out on ice to prevent endocytosis of AT1R during processing of the samples. The cells were washed twice with HBSS, 0.5% BSA and then incubated for another 1 h at room temperature in HBSS, 0.5% BSA supplemented with horseradish peroxidase-conjugated anti-mouse IgG (1:1000, Sigma) secondary antibody. The cells were washed twice with HBSS, 0.5% BSA. Finally, the cells were incubated with 400 μl per well of o-phenylenediamine dihydrochloride substrate (0.4 mg/ml) prepared in 0.05 m phosphate/citrate buffer, pH 5.0, containing 0.03% sodium perborate (Sigma) for 10 min in the dark at room temperature. The reaction was stopped with 100 μl per well of 3 n HCl, and the absorbance was read at 492 nm using an ELISA plate reader (Molecular Devices). For detection of total protein, 0.1% Triton X-100 was included in all the buffers to promote permeabilization of the cell membrane, and the cells were fixed with 4% paraformaldehyde before adding the primary antibody. Control experiments were performed with mock-transfected cells and wild type-transfected cells to which the primary antibody was not added.
Statistical Analysis
Results are presented as mean ± S.E. Changes in specific binding of radiolabeled ligands and cell surface expression of AT1R constructs were normalized to those measured with the wild-type AT1R control (100%). IC50 values in binding assays were determined by non-linear regression analysis using the Prism software (GraphPad Software).
Results
Comparison of the Two AT1R Structures
Our extensive efforts on AT1R stabilization and crystallization in LCP resulted in two different types of crystals. The first engineered AT1R construct with N-terminally fused BRIL in complex with its antagonist ZD7155 yielded a high density of microcrystals with an average size of 10 × 2 × 2 μm3. In our previous studies, we applied a recently developed method of serial femtosecond crystallography using LCP as a crystal growth and carrier matrix (LCP-SFX) to deliver microcrystals to the intersection with an x-ray free-electron laser beam (14, 28–30) and solved a room temperature structure of the antagonist-bound AT1R (12). A different AT1R construct with a 4-residue shorter C terminus was studied by the ligand binding and calcium signaling assays to determine its functional and pharmacological properties compared with the wild-type AT1R (Fig. 1). The [3H]olmesartan binding affinities for HA-AT1R and BRIL-AT1R are similar (Fig. 1A), although the displacements of the bound [3H]olmesartan by AngII and [Sar1,Ile8]AngII are more than 10-fold less efficient for BRIL-AT1R compared with HA-AT1R (Fig. 1B). However, the calcium-signaling activation by the bound AngII for HA-AT1R and BRIL-AT1R showed similar EC50 values (Fig. 1C). This finding suggests that N-terminal BRIL insertion may sterically hinder the entrance of larger peptide ligands (such as AngII) into the ligand binding pocket of AT1R. This observation is consistent with our previous results that mutations on extracellular loop 2 of AT1R (such as F182ECL2A) affected the peptide ligand ([Sar1,Ile8]AngII) binding, whereas F182ECL2A substitution did not affect the non-peptide ligand (candesartan) binding (12). This construct in complex with an inverse agonist olmesartan was crystallized in a different space group (P32 for the AT1R-olmesartan complex versus C2 for AT1R-ZD7155) and produced larger crystals with a maximum size of 70 × 70 × 15 μm3, allowing us to use conventional synchrotron radiation to determine the olmesartan-bound AT1R structure in a cryo-cooled state (Table 1).
FIGURE 1.

Comparisons of the ligand binding and functional activities between the wild-type (HA-AT1R) and crystallized construct (BRIL-AT1R). A, binding of olmesartan to the wild-type HA-AT1R and crystallized BRIL-AT1R. Binding studies were performed using isolated membranes from transiently transfected COS1 cells. Saturation binding curves were measured using [3H]olmesartan, and the corresponding Kd and Bmax values were obtained by non-linear curve fitting. B, displacement of [3H]olmesartan with the agonist AngII and the antagonist [Sar1,Ile8]AngII in the wild-type HA-AT1R and the crystallized BRIL-AT1R. Binding studies were performed using isolated membranes from transiently transfected COS1 cells. Competition binding curves for peptide agonist AngII and peptide antagonist [Sar1,Ile8]AngII were generated, and the corresponding IC50 values were calculated. The IC50 values for AngII to inhibit olmesartan binding were 1.8 ± 0.2 and 18.4 ± 2.3 nm for HA-AT1R and BRIL-AT1R, respectively. The IC50 values for [Sar1,Ile8]AngII to inhibit olmesartan binding were 1.2 ± 0.1 and 25.5 ± 4.9 nm for HA-AT1R and BRIL-AT1R, respectively. C, intracellular calcium responses of wild-type HA-AT1R and BRIL-AT1R. AngII and olmesartan dose-response curves for HA-AT1R and BRIL-AT1R are shown. For the antagonist dose response, cells were treated with 0–10 μm concentrations of olmesartan followed by stimulation with 100 nm AngII. The EC50 values for AngII dose response were 10.2 ± 3.2 and 11.9 ± 3.1 nm for HA-AT1R and BRIL-AT1R, respectively. The IC50 values for olmesartan to inhibit AngII response were between 23.9 ± 8.0 and 4.4 ± 0.4 nm for HA-AT1R and BRIL-AT1R, respectively. All results above are presented as mean ± S.E. and represent three experiments performed in triplicate.
The two AT1R structures exhibit similar conformations of the seven-transmembrane bundle of the receptor (root mean square deviation of Cα = 0.85 Å in 92% of the structure) and orientation of the N-terminal BRIL fusion protein, despite different crystal packing (Fig. 2, A and B). No electron density for helix VIII was observed in the AT1R-olmesartan structure compared with a 13-residue long helix VIII in the AT1R-ZD7155 structure. Apparently, helix VIII was destabilized by the 4-residue truncation at the C terminus applied in this construct; however, lack of a stable helix VIII did not noticeably impact conformations of the other parts of receptor.
FIGURE 2.

Crystal structure of AT1R-olmesartan. A and B, crystal packing comparison of the two AT1R structures bound to the inverse agonist olmesartan (this work) and the antagonist ZD7155 (Protein Data Bank code 4YAY). Crystal packing views perpendicularly (left) and parallel (right) to the membrane are shown for the two N-terminal BRIL-fused AT1R structures bound to different ligands, with AT1R shown as green ribbons and BRIL shown as cyan ribbons. C, interactions between AT1R and olmesartan were determined by crystal structure. D, three SNP variations, A1634.60T, T2827.33M, and C2897.40W, located in close proximity to the AT1R orthosteric binding pocket may differentially affect efficacies of specific ARBs in individuals carrying these SNPs via changes in direct or indirect interactions with the pocket.
Olmesartan-binding Mode
The AT1R-olmesartan crystal structure solved in this study confirmed our previous olmesartan docking simulations based on the AT1R-ZD7155 structure (12), with root mean square deviation = 1.1 Å between the predicted and experimentally derived ligand poses. The olmesartan-binding pocket is composed of residues from all seven transmembrane helices, as well as from two extracellular loops ECL1 and ECL2 (Fig. 2C). Conformations of the pocket residues in the two structures are very close, with the largest variations being a rotamer change in Ile-2887.39 (superscript indicates residue number as per the Ballesteros-Weinstein, 1995, nomenclature (31)), as well as ∼1 Å shifts of Tyr-351.39 in helix I and residues Gly-1965.39 to Leu-2015.44 in helix V toward the ligand pocket. These changes slightly decreased the pocket size, probably reflecting the smaller linear size of olmesartan as compared with ZD7155. Three residues, Tyr-351.39, Trp-842.60, and Arg-167ECL2, were found to be critical for olmesartan binding, similar to our findings for AT1R-ZD7155 interactions. Arg-167ECL2 formed extensive networks of hydrogen bonds and salt bridges with the acidic tetrazole ring and the carboxyl group on the imidazole moiety of olmesartan in the AT1R-olmesartan complex. Mutations of Arg-167ECL2 to alanine and glutamine abolished both the AngII and olmesartan binding to AT1R (Table 2). The Arg-167ECL2 to lysine mutant did not impact AngII binding but reduced binding affinity of olmesartan, suggesting that the lysine side chain in this position does not fully substitute for the arginine side chain that forms a salt bridge and hydrogen bond network with both ends of olmesartan. Notably, such positioning of Arg-167ECL2 in AT1R is not conserved in other GPCRs, which may be the key for the unique binding specificity of ARBs to AT1R and their absence of cross-activity to other GPCRs. Tyr-351.39 and Trp-842.60 formed additional hydrogen bond and π-π interactions, both with the imidazole moiety of olmesartan (Fig. 2). Mutation of Tyr-351.39 to alanine abolished both AngII and olmesartan binding, although larger hydrophobic isoleucine and phenylalanine substitutions retained the binding of olmesartan but not of AngII (Table 2). In alanine- and isoleucine-substituted mutants for Trp-842.60, binding of both AngII and olmesartan was abolished, but olmesartan binding was preserved by the phenylalanine mutant (Table 2).
TABLE 2.
Binding of AngII and olmesartan to various AT1R mutants
| Mutation | Location | Kd (AngII) | ΔKd (fold change) | Kd (olmesartan) | ΔKd (fold change) | Total expression |
|---|---|---|---|---|---|---|
| nm | nm | % | ||||
| WT | 7.6 ± 1.5 | 1.0 ± 0.3 | 6.9 ± 1.5 | 1.0 ± 0.3 | 100a | |
| Y35A | 1.39 | NB | ND | >100 | ND | 110 ± 6.6 |
| Y35F | 1.39 | NB | ND | 7.0 ± 0.3 | 1.0 ± 0.2 | 101 ± 1.8 |
| Y35K | 1.39 | NB | ND | NB | ND | 99 ± 4.5 |
| Y35I | 1.39 | NB | ND | 8.6 ± 1.9 | 1.2 ± 0.4 | 113 ± 4.2 |
| F77A | 2.53 | 11.3 ± 0.3 | 1.4 ± 0.3 | 7.2 ± 0.9 | 1.0 ± 0.3 | 101 ± 7.2 |
| W84A | 2.60 | NB | ND | NB | ND | 116 ± 2.8 |
| W84F | 2.60 | NB | ND | 8.5 ± 1.1 | 1.2 ± 0.3 | 109 ± 8.6 |
| W84I | 2.60 | NB | ND | NB | ND | 102 ± 0.2 |
| Y87A | 2.63 | 9.0 ± 0.4 | 1.2 ± 0.2 | 5.4 ± 0.7 | 0.8 ± 0.2 | 106 ± 3.4 |
| T88A | 2.64 | 12.8 ± 0.1 | 1.7 ± 0.3 | 12.8 ± 3.2 | 1.9 ± 0.6 | 106 ± 3.2 |
| Y92A | ECL1 | NB | ND | 2.8 ± 0.3 | 0.4 ± 0.1 | 114 ± 5.9 |
| S105A | 3.29 | 6.7 ± 0.9 | 0.9 ± 0.2 | 4.8 ± 0.6 | 0.7 ± 0.2 | 109 ± 4.9 |
| V108A | 3.32 | 10.7 ± 0.8 | 1.4 ± 0.3 | 13.3 ± 2.9 | 1.9 ± 0.6 | 113 ± 7.6 |
| S109A | 3.33 | 7.4 ± 0.3 | 1.0 ± 0.2 | 6.3 ± 0.9 | 1.0 ± 0.2 | 112 ± 3.6 |
| L112A | 3.36 | 15.3 ± 0.6 | 2.0 ± 0.4 | 5.7 ± 0.8 | 0.8 ± 0.2 | 103 ± 8.9 |
| A163G | 4.60 | 7.6 ± 0.7 | 1.0 ± 0.2 | 8.3 ± 0.7 | 1.2 ± 0.2 | 109 ± 0.1 |
| R167A | ECL2 | NB | ND | >100 | ND | 95 ± 6.7 |
| R167K | ECL2 | 7.7 ± 0.3 | 1.0 ± 0.2 | 27.6 ± 1.5 | 4.0 ± 0.9 | 128 ± 1.0 |
| R167Q | ECL2 | NB | ND | >100 | ND | 102 ± 7.7 |
| F182A | ECL2 | NB | ND | 8.9 ± 1.3 | 1.3 ± 0.3 | 116 ± 8.4 |
| F182Y | ECL2 | 9.6 ± 1.4 | 1.3 ± 0.3 | 8.7 ± 0.8 | 1.3 ± 0.3 | 133 ± 10.2 |
| F182I | ECL2 | 7.8 ± 0.3 | 1.0 ± 0.2 | 11.8 ± 0.9 | 1.7 ± 0.4 | 105 ± 7.1 |
| K199A | 5.42 | NB | ND | 11.3 ± 1.7 | 1.6 ± 0.4 | 85 ± 3.1 |
| K199Q | 5.42 | NB | ND | NB | ND | 123 ± 5.4 |
| K199R | 5.42 | 8.4 ± 0.1 | 1.1 ± 0.2 | 3.4 ± 1.0 | 0.5 ± 0.2 | 113 ± 1.7 |
| N200A | 5.43 | 11.9 ± 2.1 | 1.6 ± 0.4 | 8.5 ± 0.4 | 1.2 ± 0.3 | 92 ± 2.9 |
| W253A | 6.48 | 10.5 ± 2.3 | 1.4 ± 0.4 | 7.2 ± 1.5 | 1.0 ± 0.3 | 106 ± 3.9 |
| H256A | 6.51 | 5.8 ± 1.3 | 0.8 ± 0.2 | 2.7 ± 0.6 | 0.4 ± 0.1 | 106 ± 1.2 |
| Q257A | 6.52 | 11.9 ± 1.2 | 1.6 ± 0.4 | 17.7 ± 1.3 | 2.5 ± 0.6 | 113 ± 4.6 |
| D281A | 7.32 | 3.5 ± 1.1 | 0.5 ± 0.2 | 5.8 ± 0.6 | 0.8 ± 0.2 | 98 ± 9.4 |
| M284A | 7.35 | 3.5 ± 0.2 | 0.4 ± 0.1 | 7.5 ± 1.3 | 1.1 ± 0.3 | 100 ± 5.6 |
| P285A | 7.36 | 9.6 ± 0.9 | 1.3 ± 0.3 | 4.5 ± 0.1 | 0.7 ± 0.1 | 99 ± 6.1 |
| I288A | 7.39 | NB | ND | 9.8 ± 0.1 | 1.4 ± 0.3 | 100 ± 3.3 |
| I288F | 7.39 | 16.9 ± 0.8 | 2.2 ± 0.5 | 4.6 ± 1.5 | 0.7 ± 0.3 | 116 ± 5.5 |
| Y292A | 7.43 | 4.9 ± 0.2 | 0.6 ± 0.1 | 2.1 ± 0.1 | 0.3 ± 0.1 | 86 ± 4.2 |
a The ELISA reading arbitrary units for HA-AT1R in COS1 total membrane prepared from transient transfections was set as 100%. The Bmax for HA-AT1R was 48.9 ± 6.9 pmol/mg (n = 4). Results are presented as means ± S.E. and represent three experiments performed in triplicate. NB means no binding. ND means not determined.
Previously, we suggested that Lys-1995.42 at the extracellular side of helix V may form salt bridges or water-mediated interactions with the acidic moieties of ARBs (12). However, no apparent electron density for the Lys-1995.42 side chain was present in the previous AT1R-ZD7155 structure, likely due to conformational heterogeneity of this residue at room temperature. In the current cryo-cooled structure of AT1R-olmesartan, clear electron density was observed for Lys-1995.42, revealing its more stable conformation; however, no direct interaction of this residue with the ligand was observed. In accord with these structural findings, we found little effect of the K1995.42A mutation on olmesartan binding (Table 2). At the same time, Lys-1995.42 played an important role for AngII binding, as the K1995.42A mutant completely abolished AngII binding. Overall, in both structures the residues forming the AT1R ligand-binding pocket were in similar conformations while interacting with two different types of ligands, inverse agonist and antagonist. Similar binding poses of ligands observed in the two crystal structures support a conserved binding mode for most other ARBs in AT1R, as predicted based on the AT1R-ZD7155 structure. The difference in functional effects between antagonists and inverse agonists is likely due to the different stabilizing effects of these ligands on different receptor conformations.
Molecular Recognition of Different ARBs
In our previous docking simulations, most ARBs were predicted to be engaged in three critical interactions with Arg-167ECL2, Trp-842.60, and Tyr-351.39 in the AT1R ligand-binding pocket (12). Here, we used [3H]olmesartan as the radioligand and performed competition displacement assays with various AT1R mutants to validate the docking results (Table 3). The analysis for candesartan, telmisartan, and valsartan showed that their binding modes are similar to olmesartan (Table 3). Losartan affinity decreased significantly more than other biphenyl-tetrazole ARBs in the Trp-842.60Phe mutation. Docking results for losartan suggested that Arg-167ECL2 does not make optimal interactions with the substituted imidazole ring moiety; consequently, the ring stacking with Trp-842.60 plays an even more important role in losartan binding. Eprosartan lacks the tetrazole group and one of the two benzene rings in the common scaffold present in most ARBs. Docking simulations indicated a less optimal geometry for salt bridges between eprosartan carboxyl groups and Arg-167ECL2, which is probably compensated for by improved interactions with Tyr-351.39 and Trp-842.60. Indeed, both W842.60F and Y351.39F mutants dramatically reduced eprosartan binding to AT1R (ΔKi = 301 ± 190 and 8.2 ± 2.9, respectively; Table 3). In addition, eprosartan's alkyl tail that is attached to the imidazole moiety was predicted to extend into the hydrophobic sub-pocket on the bottom of the AT1R ligand-binding pocket, consisting of Ile-2887.39 and Tyr-2927.43. The Ile-2887.39 was predicted to form additional interactions with the thiophene group of eprosartan. Alanine substitution of Ile-2887.39 and Tyr-2927.43 significantly decreased eprosartan binding affinities (ΔKi = 32.5 ± 7.9 and 13.4 ± 3.1, respectively; Table 3). Telmisartan is another ARB with a unique chemical structure; it has two consecutive benzimidazole moieties that were predicted to make additional π-π contacts with Tyr-92ECL1. Mutation of Tyr92ECL1 to alanine, although mostly neutral for other ARBs tested, significantly lowered affinity for telmisartan (ΔKi = 6.5 ± 2.0; Table 3). Furthermore, the I2887.39A mutation had another discriminating effect on telmisartan binding (ΔKi = 11.2 ± 1.7; Table 3), albeit via a different set of contacts compared with eprosartan.
TABLE 3.
Competition displacement of [3H]olmesartan binding to various AT1R mutants by different ARBs
Results are presented as means ± S.E. and represent three experiments performed in triplicate.
| Mutation | Location | Losartan |
Candesartan |
Eprosartan |
Telmisartan |
Valsartan |
|||||
|---|---|---|---|---|---|---|---|---|---|---|---|
| Ki | ΔKi | Ki | ΔKi | Ki | ΔKi | Ki | ΔKi | Ki | ΔKi | ||
| WT | 21.1 ± 4.1 | 1.0 ± 0.3 | 2.1 ± 0.5 | 1.0 ± 0.3 | 4.7 ± 1.1 | 1.0 ± 0.3 | 23.8 ± 2.3 | 1.0 ± 0.1 | 3.7 ± 1.7 | 1.0 ± 0.6 | |
| Y35F | 1.39 | 91 ± 49 | 4.3 ± 2.5 | 3.1 ± 0.5 | 1.5 ± 0.4 | 1420 ± 830 | 301 ± 190 | 49.8 ± 3.1 | 2.1 ± 0.2 | 3.7 ± 1.4 | 1.0 ± 0.6 |
| W84F | 2.60 | 652 ± 260 | 31 ± 14 | 2.1 ± 0.1 | 1.0 ± 0.2 | 38 ± 11 | 8.2 ± 2.9 | 112 ± 60 | 4.7 ± 2.6 | 5.7 ± 3.9 | 1.5 ± 1.3 |
| Y92A | ECL1 | 44.7 ± 7.8 | 2.1 ± 0.6 | 1.4 ± 0.1 | 0.7 ± 0.2 | 4.7 ± 0.7 | 1.0 ± 0.3 | 156 ± 45 | 6.5 ± 2.0 | 7.8 ± 6.2 | 2.1 ± 1.9 |
| R167K | ECL2 | 84.6 ± 7.0 | 4.0 ± 0.9 | 9.7 ± 3.2 | 4.6 ± 1.9 | 4.00 ± 0.04 | 0.9 ± 0.2 | 9.4 ± 0.9 | 0.4 ± 0.1 | 2.9 ± 0.4 | 0.8 ± 0.4 |
| F182A | ECL2 | 11.1 ± 0.1 | 0.5 ± 0.1 | 3.1 ± 0.2 | 1.4 ± 0.4 | 10.3 ± 5.5 | 2.2 ± 1.3 | 14.0 ± 0.3 | 0.6 ± 0.1 | 3.4 ± 0.9 | 0.9 ± 0.5 |
| K199A | 5.42 | 16.6 ± 6.0 | 0.8 ± 0.3 | 1.7 ± 0.5 | 0.8 ± 0.3 | 3.4 ± 0.3 | 0.7 ± 0.2 | 35 ± 17 | 1.5 ± 0.7 | 15.2 ± 4.2 | 4.1 ± 2.2 |
| M284A | 7.35 | 14.2 ± 3.2 | 0.7 ± 0.2 | 1.0 ± 0.3 | 0.5 ± 0.2 | 3.00 ± 0.03 | 0.6 ± 0.1 | 15.7 ± 4.7 | 0.7 ± 0.2 | 5.8 ± 0.7 | 1.5 ± 0.7 |
| P285A | 7.36 | 1.5 ± 1.5 | 0.10 ± 0.02 | 1.6 ± 0.5 | 0.8 ± 0.3 | 18.7 ± 5.9 | 4.0 ± 1.5 | 15.6 ± 0.7 | 0.7 ± 0.1 | 2.8 ± 1.0 | 0.8 ± 0.4 |
| I288A | 7.39 | 30 ± 19 | 1.4 ± 0.9 | 3.2 ± 0.5 | 1.5 ± 0.4 | 153 ± 15 | 32.5 ± 7.9 | 268 ± 30 | 11.2 ± 1.7 | 5.4 ± 2.5 | 1.5 ± 0.9 |
| Y292A | 7.43 | 111 ± 21 | 5.2 ± 1.4 | 3.2 ± 1.1 | 1.5 ± 0.6 | 62.9 ± 3.5 | 13.4 ± 3.1 | 41.9 ± 4.2 | 1.8 ± 0.2 | 16.1 ± 0.8 | 4.4 ± 2.0 |
Together, the docking results and mutagenesis data for different ARBs reveal a molecular recognition paradigm for ARBs binding to AT1R. The phenyl-acidic scaffold employs three critical AT1R residues Arg-167ECL2, Trp-842.60, and Tyr-351.39; however, the relative binding energy contributions of each residue may vary for different variants and derivatives of the scaffold. Furthermore, the derivative moieties extend interaction of specific ARBs to additional sub-pockets of AT1R, consequently allowing for some wobbling of the ARB core structure in the main ligand binding pocket. Analysis of these sub-pockets suggests that some of the known naturally occurring mis-sense variations in AT1R, such as L481.52V, A1634.60T, L2225.65V, A2446.39S, T2827.33M, and C2897.40W, which were reported as single nucleotide polymorphisms (SNPs) in the AGTR1 gene, may influence ARBs binding and efficacies in humans. Thus, three of these SNP variations, A1634.60T, T2827.33M, and C2897.40W located in close proximity to the AT1R orthosteric binding pocket may differentially affect efficacies of specific ARBs in individuals carrying these SNPs via changes in direct or indirect interactions with the pocket (Fig. 2D).
Functional Selectivity of Olmesartan Derivatives
Previous studies suggested that small modifications of ligands could alter their pharmacological properties, despite their similar binding modes (32–34). Olmesartan is an inverse agonist for IP production (11). In recent work with rodent AT1R (33), it was observed that compound R781253, in which the biphenyl-tetrazole scaffold of olmesartan was modified with an additional 4-hydroxybenzyl group, retained inverse agonist properties similar to olmesartan. Exchange of the carboxyl group on the imidazole end of olmesartan by a non-acidic carbamoyl group in R239470 was found to produce a neutral antagonist. Surprisingly, combination of these two modifications resulted in a weak partial agonist R794847; however, the structural basis of this phenomenon remained unknown.
The pharmacological properties of olmesartan derivatives reported for rodent AT1R were confirmed in this work for the human AT1R (Fig. 3). Extensive co-crystallization trials of AT1R with these three ligands were however unsuccessful. Therefore, to address the structural basis for functional selectivity of olmesartan derivatives, we performed docking simulations of R781253, R239470, and R794847 binding using the AT1R-olmesartan structure (Fig. 3 and Table 4). Docking results suggested that all these ligands bind in similar orientations. The additional 4-hydroxybenzyl groups of R781253 and R794847 were predicted to extend to a sub-pocket on the bottom of the AT1R ligand-binding pocket consisting of Leu-1123.36, Lys-1995.42, Asn-2005.43, Trp-2536.48, His-2566.51, Gln-2576.52, and Thr-2606.55 (Fig. 3). Some of the interactions of the 4-hydroxybenzyl moieties in this pocket are likely to be suboptimal as they reduced the binding affinities of R781253 and R794847, as compared with olmesartan (ΔKi2 = 3.4 ± 0.3 and 6.2 ± 0.6; Table 5). Accordingly, mutations of these residues to alanine resulted in mixed effects on R781253 and R794847 binding affinities (Table 5). Mutating two of the sub-pocket residues, Trp-2536.48 and Thr-2606.55, however, had strong and unique effects on the 4-hydroxybenzyl-derivatized compounds, supporting their contributions to ligand binding. Although a conserved Trp-2536.48, known as the “toggle switch,” has been implicated in activation of many GPCRs (35), previous mutagenesis studies in AT1R have also associated Lys-1995.42, His-2566.51, Gln-2576.52, and Thr-2606.55 as a cluster that regulates the ligand-dependent activity state of AT1R (2, 5, 7). Therefore, interactions of 4-hydroxybenzyl moieties in this sub-pocket, whether optimal or not, are likely to affect functional properties of R781253 and R794847. On the imidazole end of the biphenyl-tetrazole scaffolds, the carbamoyl groups of R239470 and R794847 substituted the carboxyl groups of olmesartan and R781253. As a result, the carbamoyl moieties of R239470 and R794847 cannot make a salt bridge to Arg-167ECL2, but instead they can form additional hydrogen bond interactions with Tyr-872.63 and Tyr-92ECL1 (Fig. 3). Especially for the agonist R794847, the Y872.63A mutant showed a dramatically decreased binding affinity compared with the wild-type AT1R (ΔKi1 = 15.8 ± 2.9; Table 5). This rearrangement of interactions from Arg-167ECL2 to Tyr-872.63 is likely to be responsible for reduced inverse agonism activity by R239470. Moreover, combination of the carboxyl replacement with 4-hydroxybenzene group in R794847, apparently makes a synergistic contribution to the shift toward the agonistic activity of this derivative.
FIGURE 3.

Olmesartan derivatives with different interactions and functions toward AT1R. A, IP signaling assays identified that olmesartan and R781253 are inverse agonists; R239470 is a neutral antagonist, and R794847 is a weak partial agonist of the human AT1R. Statistical analysis was performed by unpaired two-tailed t test, in which p values less than 0.05 were considered statistically significant. Olmesartan, p = 0.037; R781253, p = 0.042; R794847, p = 0.048, and AngII, p = 0.024. Results are presented as means ± S.E. and represent three experiments performed in triplicate. B, docking simulations showed conserved binding modes of olmesartan (cyan), R239470 (blue), R781253 (green), and R794847 (red) in the AT1R ligand-binding pocket. C, schematic representations for interactions of olmesartan and its derivatives with AT1R are shown with hydrogen bonds/salt bridges as red dashed lines. B and C, three critical residues for binding of all four ligands are highlighted in red; the residues discriminating ligand binding are labeled in green (for R239470 and R794847) and cyan (for R781253 and R794847).
TABLE 4.
Interactions of olmesartan and its derivatives with AT1R determined by docking simulations
Numbers show the contact area (Å2) of the residue surface participating in the ligand interactions; the cells are colored according to the contact area, from blue (no direct contact) to red (maximum contact area).
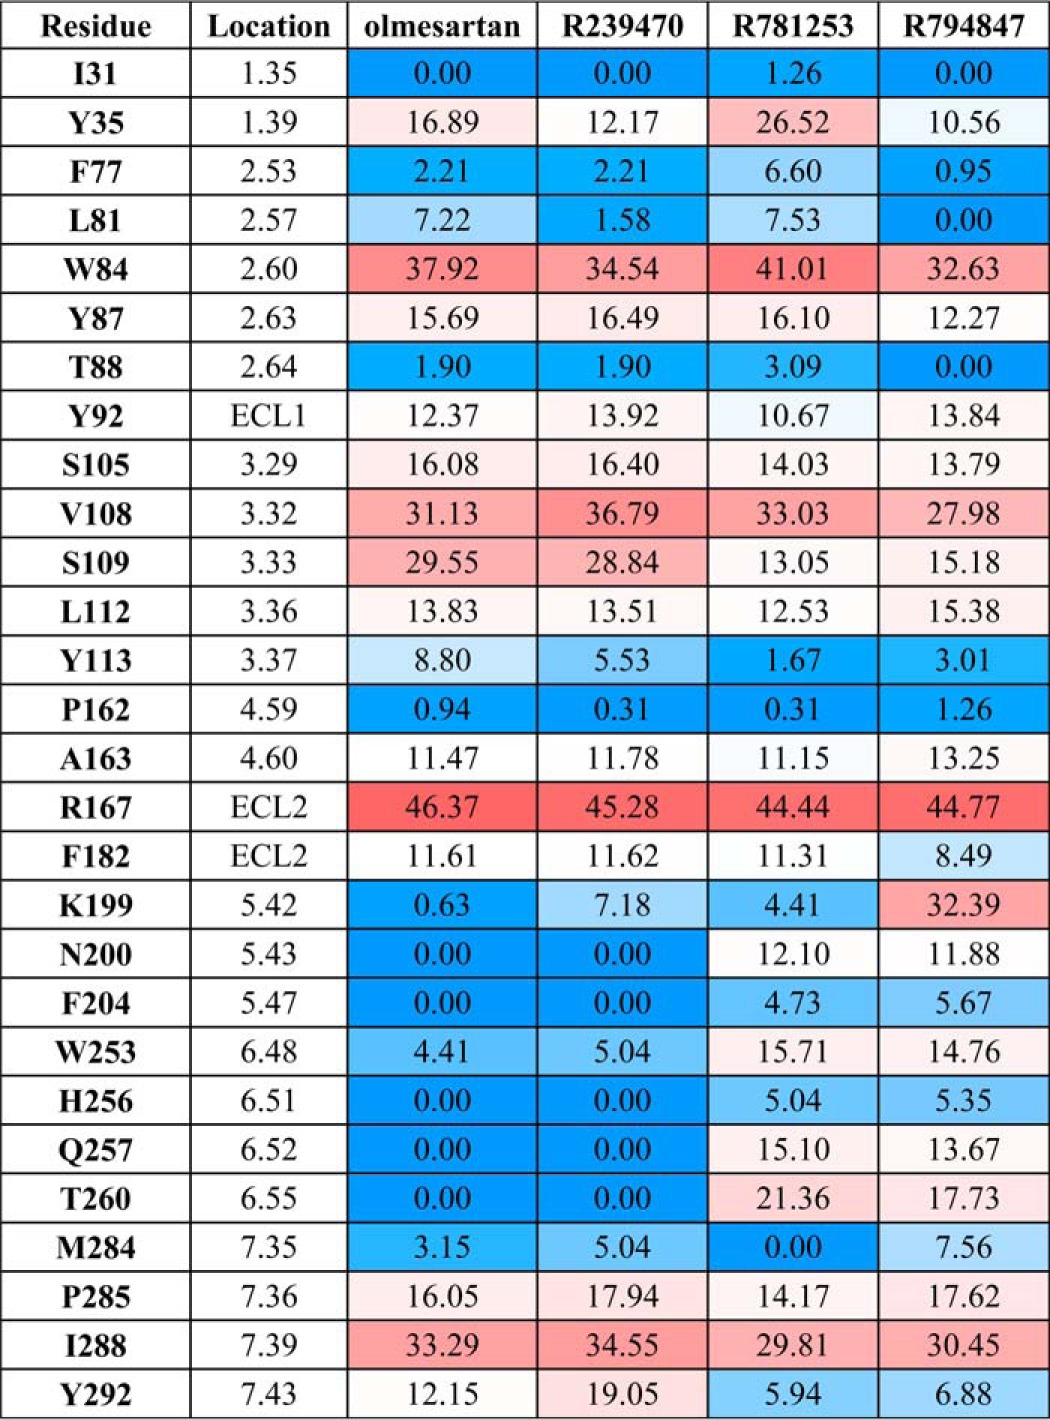
TABLE 5.
Competition displacement of [3H]olmesartan binding to various AT1R mutants by olmesartan and its derivatives
ΔKi1refers to the WT response for each ligand, to evaluate the effects of each mutation. ΔKi2 refers to each derivative of olmesartan, to evaluate the effects of modifications on ligand. Results are presented as means ± S.E. and represent three experiments performed in triplicate.
| Mutation | Location | Olmesartan |
R239470 |
R781253 |
R794847 |
||||||||
|---|---|---|---|---|---|---|---|---|---|---|---|---|---|
| Ki | ΔKi1 | ΔKi2 | ΔKi | ΔKi1 | ΔKi2 | Ki | ΔKi1 | ΔKi2 | Ki | ΔKi1 | ΔKi2 | ||
| WT | 5.3 ± 0.8 | 1.0 ± 0.2 | 1.0 ± 0.2 | 3.4 ± 0.28 | 1.0 ± 0.1 | 0.6 ± 0.1 | 18.2 ± 1.3 | 1.0 ± 0.1 | 3.4 ± 0.3 | 32.8 ± 2.14 | 1.0 ± 0.1 | 6.2 ± 0.6 | |
| Y87A | 2.63 | 5.9 ± 0.8 | 1.1 ± 0.2 | 1.1 ± 0.2 | 29.2 ± 4.1 | 8.6 ± 1.4 | 4.9 ± 0.8 | 32.7 ± 5.0 | 1.8 ± 0.3 | 5.5 ± 0.9 | 518.0 ± 88.0 | 15.8 ± 2.9 | 87.8 ± 15.9 |
| T88A | 2.64 | 10.2 ± 2.2 | 1.9 ± 0.5 | 1.9 ± 0.5 | 14.7 ± 3.1 | 4.3 ± 1.0 | 1.4 ± 0.3 | 9.7 ± 1.1 | 0.5 ± 0.1 | 1.0 ± 0.1 | 11.4 ± 1.9 | 0.3 ± 0.1 | 1.1 ± 0.2 |
| Y92A | ECL1 | 3.8 ± 0.5 | 0.7 ± 0.1 | 0.7 ± 0.1 | 16.7 ± 3.2 | 4.9 ± 1.0 | 4.3 ± 0.9 | 19.3 ± 1.4 | 1.1 ± 0.1 | 5.1 ± 0.5 | 10.9 ± 1.4 | 0.3 ± 0.1 | 2.9 ± 0.4 |
| V108A | 3.32 | 15.3 ± 2.7 | 2.9 ± 0.7 | 2.9 ± 0.7 | 14.6 ± 2.1 | 4.3 ± 0.7 | 1.0 ± 0.2 | 9.1 ± 1.8 | 0.5 ± 0.1 | 0.6 ± 0.1 | 12.33 ± 1.96 | 0.4 ± 0.1 | 0.8 ± 0.1 |
| L112A | 3.36 | 12.1 ± 2.2 | 2.3 ± 0.5 | 2.3 ± 0.5 | 19.2 ± 4.1 | 5.6 ± 1.3 | 1.6 ± 0.4 | 62.7 ± 5.0 | 3.4 ± 0.4 | 5.2 ± 0.6 | 411.0 ± 89.0 | 12.5 ± 2.8 | 34.0 ± 7.7 |
| P162A | 4.59 | 10.6 ± 1.3 | 2.0 ± 0.4 | 2.0 ± 0.4 | 5.6 ± 1.3 | 1.6 ± 0.4 | 1.6 ± 0.4 | 11.9 ± 3.1 | 0.7 ± 0.2 | 0.7 ± 0.2 | 39.9 ± 3.7 | 1.2 ± 0.1 | 1.2 ± 0.1 |
| A163G | 4.60 | 8.0 ± 1.7 | 1.5 ± 0.4 | 1.5 ± 0.4 | 8.3 ± 1.1 | 2.4 ± 0.4 | 2.4 ± 0.4 | 54.7 ± 4.1 | 3.0 ± 0.3 | 3.0 ± 0.3 | 82 ± 6.1 | 2.5 ± 0.2 | 2.5 ± 0.2 |
| K199A | 5.42 | 14.1 ± 1.5 | 2.7 ± 0.5 | 2.7 ± 0.5 | 12.9 ± 2.1 | 3.8 ± 0.7 | 0.9 ± 0.2 | 46.4 ± 4.8 | 2.5 ± 0.3 | 3.3 ± 0.4 | 94.8 ± 8.1 | 2.9 ± 0.3 | 6.7 ± 0.7 |
| N200A | 5.43 | 6.1 ± 1.0 | 1.2 ± 0.2 | 1.2 ± 0.2 | 5.6 ± 0.7 | 1.6 ± 0.3 | 0.9 ± 0.1 | 16.4 ± 2.1 | 0.9 ± 0.1 | 2.6 ± 0.4 | 28.1 ± 3.1 | 0.9 ± 0.1 | 4.6 ± 0.6 |
| W253A | 6.48 | 10.3 ± 0.7 | 1.9 ± 0.3 | 1.9 ± 0.3 | 4.9 ± 1.0 | 1.4 ± 0.3 | 0.5 ± 0.1 | 73.6 ± 5.1 | 4.0 ± 0.4 | 7.1 ± 0.7 | 146.4 ± 15 | 4.5 ± 0.5 | 14.2 ± 1.7 |
| H256A | 6.51 | 2.1 ± 1.0 | 0.4 ± 0.2 | 0.4 ± 0.2 | 6.7 ± 1.1 | 2.0 ± 0.4 | 3.2 ± 0.6 | 47.6 ± 3.2 | 2.6 ± 0.3 | 22.7 ± 2.2 | 15.7 ± 2.9 | 0.5 ± 0.1 | 7.5 ± 1.5 |
| Q257A | 6.52 | 15.6 ± 2.0 | 2.9 ± 0.6 | 2.9 ± 0.6 | 18.0 ± 2.0 | 5.3 ± 0.8 | 1.2 ± 0.2 | 72.2 ± 5.4 | 4.0 ± 0.4 | 4.6 ± 0.5 | 146.5 ± 15.1 | 4.5 ± 0.5 | 9.4 ± 1.1 |
| T260A | 6.55 | 5.7 ± 0.8 | 1.1 ± 0.2 | 1.1 ± 0.2 | 4.8 ± 0.9 | 1.4 ± 0.3 | 0.8 ± 0.2 | 63.5 ± 6.1 | 3.5 ± 0.4 | 11.1 ± 1.3 | 126.3 ± 22.0 | 3.9 ± 0.7 | 22.2 ± 4.1 |
| P285A | 7.36 | 3.7 ± 0.3 | 0.7 ± 0.1 | 0.7 ± 0.1 | 2.7 ± 2.3 | 0.8 ± 0.7 | 0.7 ± 0.6 | 16.4 ± 2.3 | 0.9 ± 0.1 | 4.4 ± 0.7 | 22.2 ± 3.0 | 0.7 ± 0.1 | 6.0 ± 0.9 |
Allosteric Modulation of Peptide Ligands Binding by Sodium Pocket Residues
Particular interest in the functional selectivity mechanism of AT1R ligands is a potential connection between the ligand-binding residues, like the toggle switch Trp-2536.48, and other functionally important features, like the sodium ion-binding site (Fig. 4). The sodium site was previously discovered in high resolution structures of A2A-adenosine (36) and δ-opioid receptors (δ-OR). It is highly conserved in many other class A GPCRs, explaining allosteric sodium effects observed for many of these receptors (37). Reported allosteric effects of sodium in AT1R are however varied (38). Although sodium was shown to potentiate AngII binding in the adrenal gland (25), the effects of sodium on ligand binding and signaling were observed only in constitutively activated mutants of AT1R but not in the wild type (39, 40). Although no electron density for a sodium ion was determined in our structure at this resolution, structural superimposition with δ-OR (12) shows that 15 out of 16 residues in the putative sodium pocket of AT1R are conserved and located in similar positions as in δ-OR, except for Asn-2957.46 in AT1R (Ser7.46 in δ-OR) (41), suggesting that sodium may play somewhat similar roles in AT1R dynamics and functional selectivity of ligands compared with δ-OR.
FIGURE 4.

Allosteric modulation of AngII and TRV120027 binding by sodium ion in sodium-binding pocket mutants. A, structure of AT1R with docked R794847 ligand shows that the toggle switch Trp-2536.48 belongs to the sodium-binding pocket and interacts with the 4-hydroxybenzyl pharmacophore of R794847. B–D, competition binding assays were performed under equilibrium conditions, with 2 nm [3H]olmesartan and concentrations of AngII or TRV120027 ranging between 0.04 and 1000 nm. The binding buffer used in the sodium containing (+Na+) experiments (red lines) was 140 mm NaCl, 5.4 mm KCl, 1 mm EDTA, 0.006% BSA, 25 mm HEPES, pH 7.4. The binding buffer used in the sodium deficient (−Na+) experiments (blue lines) was 140 mm N-methyl d-glucamine, 5.4 mm KCl, 1 mm EDTA, 0.006% BSA, 25 mm HEPES, pH 7.4. Statistical analysis was performed by unpaired two-tailed t test, in which p values less than 0.05 (asterisks) were considered statistically significant. N111A, p = 0.004. Results are presented as mean ± S.E. and represent three experiments performed in triplicate.
To assess the potential connections between the sodium ion and ligand binding pockets in AT1R, we examined the ability of sodium ions to modulate receptor affinity for the full agonist AngII and β-arrestin biased agonist TRV120027 by determining the IC50 values in the presence or absence of sodium ions using different sodium-binding site mutants. The only dramatic shift among the sodium-coordinating mutants was observed for N1113.35A, which showed ∼300-fold higher affinity for AngII in the absence of sodium ions, as compared with a physiological concentration of Na+, although this effect was absent for TRV120027 (Fig. 4). It was previously reported that the N1113.35A mutant induces constitutive activation of G protein-dependent signaling in AT1R, and it favors binding of agonists over antagonists in 150 mm Na+ (42). Meanwhile, a sodium ion was implicated in the allosteric stabilization of an inactive conformation in many class A GPCRs (37). Therefore, a combination of the N1113.35A mutation effect with the absence of a sodium ion and its corresponding allosteric modulation may result in a dramatically increased AngII binding affinity. However, further studies are needed to fully understand the mechanism for the allosteric modulation of AT1R by sodium ion.
Discussion
Our results provided new insights into the structural basis for AT1R modulation by different types of orthosteric ligands and by an allosteric sodium ion. First, we demonstrated that common scaffolds shared by ARBs utilize similar molecular recognition sites on AT1R. Remarkably, three residues, Arg-167ECL2, Trp-842.60, and Tyr-351.39, were found to be critical for binding of most ARBs, as they form extensive interaction networks with the ligands. However, binding of some ARBs involved additional specific interactions with extended sub-pockets of AT1R. Second, modifications of the common biphenyl-tetrazole scaffold in olmesartan-derived ligands endowed different functional selectivity with a range of pharmacological properties from inverse to partial agonism. We observed that the sub-pocket, including Trp-2536.48 from the WXP motif served as a determinant of the functional selectivity in this set of AT1R ligands. Interactions of the 4-hydroxybenzyl group with Leu-1123.36, Lys-1995.42, Asn-2005.43, Trp-2536.48, His-2566.51, Gln-2576.52, and Thr-2606.55 identified a cluster of residues that may regulate AT1R coupling to IP signaling. It was shown previously that Leu-1123.36, located next to Asn-1113.35, when mutated to glycine induced a robust constitutive activation of AT1R (2, 43). Thus, the observed interactions of the 4-hydroxybenzyl group with the sub-pocket, including Leu-1123.36 and Trp-2536.48, suggested a potential pharmacophore that could be mimicked in the future design of small molecule AT1R agonists. These results allowed us to establish the rational basis for different functional properties of olmesartan analogs. Structural determination of AT1R uncovered that the putative sodium anchoring residues are mostly conserved between AT1R and δ-OR. Notably, Asp-742.50, Asn-1113.35, and Asn-2957.46 in the sodium ion-binding pocket were found in previous studies to be responsible for intramolecular hydrogen bonding that regulates constitutive activation of AT1R. It was shown that the D742.50A mutation abolishes G protein signaling, although N1113.35A and N2957.46A mutations constitutively activate G protein-dependent signaling in AT1R (43). Here, we show that allosteric modulation by a sodium ion in the N1113.35A mutant affects binding of AngII but not TRV120027, suggesting different mechanisms for AT1R modulation by its natural ligand and β-arrestin-biased ligand.
Author Contributions
H. Z. designed, purified, characterized, and crystallized the proteins, collected and processed diffraction data, determined the structure, analyzed the data, and wrote the paper. H. U. performed mutagenesis, signaling, and ligand binding studies, and wrote the paper. R. D. participated in mutagenesis, membrane production, signaling, and ELISA analysis. G. W. H. solved and refined the structure. N. P. performed docking studies. V. K. analyzed the structure, supervised docking studies, and wrote the paper. S. S. K. conceived the project, supervised mutagenesis and functional studies, and wrote the paper. V. C. supervised crystallization and crystallographic data collection, processed diffraction data, analyzed the data, and wrote the paper. R. C. S. conceived and supervised the project and wrote the paper.
Acknowledgments
We thank J. Velasquez for help with molecular biology, M. Chu for help with baculovirus expression, and A. Walker for assistance with manuscript preparation. We thank Dr. Shin-ichiro (Fukuoka University School of Medicine, Fukuoka, Japan) for help and Daiichi Sankyo Co., Ltd., Tokyo, Japan for generous supply of olmesartan and its derivatives. This research used resources of the Advanced Photon Source, a United States Department of Energy Office of Science User Facility operated for the Department of Energy Office of Science by Argonne National Laboratory under Contract DE-AC02–06CH11357. Parts of this research were carried out at the General Medical Sciences and NCI Structural Biology Facility at the Advanced Photon Source (GM/CA@APS), Argonne National Laboratory. GM/CA@APS has been funded in whole or in part by Grant ACB-12002 from NCI and Grant AGM-12006 from NIGMS.
This work was supported by National Institutes of Health Grants U54 GM094618 (to V. K., V. C., and R. C. S.) and R01 HL57470 and R01 HL115964 (to S. S. K.) and by Grant T32 HL007914 (to H. U.). The authors declare that they have no conflicts of interest with the contents of this article.
This article was selected as a Paper of the Week.
The atomic coordinates and structure factors (code 4ZUD) have been deposited in the Protein Data Bank (http://wwpdb.org/).
- AngII
- angiotensin II
- AT1R
- angiotensin II type 1 receptor
- ARB
- AT1R blocker
- GPCR
- G protein-coupled receptor
- IP
- inositol phosphate
- DDM
- n-dodecyl-β-d-maltopyranoside
- CHS
- cholesterol hemisuccinate
- LCP
- lipidic cubic phase
- HBSS
- Hanks' balanced salt solution
- δ-OR
- δ-opioid receptor
- SNP
- single nucleotide polymorphism.
References
- 1.Zaman M. A., Oparil S., and Calhoun D. A. (2002) Drugs targeting the renin-angiotensin-aldosterone system. Nat. Rev. Drug Discov. 1, 621–636 [DOI] [PubMed] [Google Scholar]
- 2.Balakumar P., and Jagadeesh G. (2014) Structural determinants for binding, activation, and functional selectivity of the angiotensin AT1 receptor. J. Mol. Endocrinol. 53, R71–R92 [DOI] [PubMed] [Google Scholar]
- 3.de Gasparo M., Catt K. J., Inagami T., Wright J. W., and Unger T. (2000) International union of pharmacology. XXIII. The angiotensin II receptors. Pharmacol. Rev. 52, 415–472 [PubMed] [Google Scholar]
- 4.Oliveira L., Costa-Neto C. M., Nakaie C. R., Schreier S., Shimuta S. I., and Paiva A. C. (2007) The angiotensin II AT1 receptor structure-activity correlations in the light of rhodopsin structure. Physiol. Rev. 87, 565–592 [DOI] [PubMed] [Google Scholar]
- 5.Burnier M., and Brunner H. R. (2000) Angiotensin II receptor antagonists. Lancet 355, 637–645 [DOI] [PubMed] [Google Scholar]
- 6.Imaizumi S., Miura S., Yahiro E., Uehara Y., Komuro I., and Saku K. (2013) Class- and molecule-specific differential effects of angiotensin II type 1 receptor blockers. Curr. Pharm. Des. 19, 3002–3008 [DOI] [PubMed] [Google Scholar]
- 7.Miura S., Zhang J., Matsuo Y., Saku K., and Karnik S. S. (2004) Activation of extracellular signal-activated kinase by angiotensin II-induced Gq-independent epidermal growth factor receptor transactivation. Hypertens. Res. 27, 765–770 [DOI] [PubMed] [Google Scholar]
- 8.Kim J., Ahn S., Ren X. R., Whalen E. J., Reiter E., Wei H., and Lefkowitz R. J. (2005) Functional antagonism of different G protein-coupled receptor kinases for β-arrestin-mediated angiotensin II receptor signaling. Proc. Natl. Acad. Sci. U.S.A. 102, 1442–1447 [DOI] [PMC free article] [PubMed] [Google Scholar]
- 9.Miura S., Nakao N., Hanzawa H., Matsuo Y., Saku K., and Karnik S. S. (2013) Reassessment of the unique mode of binding between angiotensin II type 1 receptor and their blockers. PLoS ONE 8, e79914. [DOI] [PMC free article] [PubMed] [Google Scholar]
- 10.Miura S., Okabe A., Matsuo Y., Karnik S. S., and Saku K. (2013) Unique binding behavior of the recently approved angiotensin II receptor blocker azilsartan compared with that of candesartan. Hypertens. Res. 36, 134–139 [DOI] [PMC free article] [PubMed] [Google Scholar]
- 11.Miura S., Fujino M., Hanzawa H., Kiya Y., Imaizumi S., Matsuo Y., Tomita S., Uehara Y., Karnik S. S., Yanagisawa H., Koike H., Komuro I., and Saku K. (2006) Molecular mechanism underlying inverse agonist of angiotensin II type 1 receptor. J. Biol. Chem. 281, 19288–19295 [DOI] [PubMed] [Google Scholar]
- 12.Zhang H., Unal H., Gati C., Han G. W., Liu W., Zatsepin N. A., James D., Wang D., Nelson G., Weierstall U., Sawaya M. R., Xu Q., Messerschmidt M., Williams G. J., Boutet S., Yefanov O. M., White T. A., Wang C., Ishchenko A., Tirupula K. C., Desnoyer R., Coe J., Conrad C. E., Fromme P., Stevens R. C., Katritch V., Karnik S. S., and Cherezov V. (2015) Structure of the angiotensin receptor revealed by serial femtosecond crystallography. Cell 161, 833–844 [DOI] [PMC free article] [PubMed] [Google Scholar]
- 13.Chun E., Thompson A. A., Liu W., Roth C. B., Griffith M. T., Katritch V., Kunken J., Xu F., Cherezov V., Hanson M. A., and Stevens R. C. (2012) Fusion partner toolchest for the stabilization and crystallization of G protein-coupled receptors. Structure 20, 967–976 [DOI] [PMC free article] [PubMed] [Google Scholar]
- 14.Caffrey M., and Cherezov V. (2009) Crystallizing membrane proteins using lipidic mesophases. Nat. Protoc. 4, 706–731 [DOI] [PMC free article] [PubMed] [Google Scholar]
- 15.Kabsch W. (2010) XDS. Acta Crystallogr. D Biol. Crystallogr. 66, 125–132 [DOI] [PMC free article] [PubMed] [Google Scholar]
- 16.McCoy A. J., Grosse-Kunstleve R. W., Adams P. D., Winn M. D., Storoni L. C., and Read R. J. (2007) Phaser crystallographic software. J. Appl. Crystallogr. 40, 658–674 [DOI] [PMC free article] [PubMed] [Google Scholar]
- 17.Winn M. D., Ballard C. C., Cowtan K. D., Dodson E. J., Emsley P., Evans P. R., Keegan R. M., Krissinel E. B., Leslie A. G., McCoy A., McNicholas S. J., Murshudov G. N., Pannu N. S., Potterton E. A., Powell H. R., Read R. J., Vagin A., and Wilson K. S. (2011) Overview of the CCP4 suite and current developments. Acta Crystallogr. D Biol. Crystallogr. 67, 235–242 [DOI] [PMC free article] [PubMed] [Google Scholar]
- 18.Murshudov G. N., Vagin A. A., and Dodson E. J. (1997) Refinement of macromolecular structures by the maximum-likelihood method. Acta Crystallogr. D Biol. Crystallogr. 53, 240–255 [DOI] [PubMed] [Google Scholar]
- 19.Emsley P., Lohkamp B., Scott W. G., and Cowtan K. (2010) Features and development of Coot. Acta Crystallogr. D Biol. Crystallogr. 66, 486–501 [DOI] [PMC free article] [PubMed] [Google Scholar]
- 20.Adams P. D., Afonine P. V., Bunkoczi G., Chen V. B., Davis I. W., Echols N., Headd J. J., Hung L. W., Kapral G. J., Grosse-Kunstleve R. W., McCoy A. J., Moriarty N. W., Oeffner R., Read R. J., Richardson D. C., Richardson J. S., Terwilliger T. C., and Zwart P. H. (2010) PHENIX: a comprehensive Python-based system for macromolecular structure solution. Acta Crystallogr. D Biol. Crystallogr. 66, 213–221 [DOI] [PMC free article] [PubMed] [Google Scholar]
- 21.Chen V. B., Arendall W. B. 3rd, Headd J. J., Keedy D. A., Immormino R. M., Kapral G. J., Murray L. W., Richardson J. S., and Richardson D. C. (2010) MolProbity: all-atom structure validation for macromolecular crystallography. Acta Crystallogr. D Biol. Crystallogr. 66, 12–21 [DOI] [PMC free article] [PubMed] [Google Scholar]
- 22.Halgren T. A. (1996) Merck molecular force field. I. Basis, form, scope, parameterization, and performance of MMFF94. J. Comp. Chem. 17, 490–519 [Google Scholar]
- 23.Totrov M., and Abagyan R. (1997) Flexible protein-ligand docking by global energy optimization in internal coordinates. Proteins Suppl. 1, 215–220 [DOI] [PubMed] [Google Scholar]
- 24.Bursulaya B. D., Totrov M., Abagyan R., and Brooks C. L. 3rd (2003) Comparative study of several algorithms for flexible ligand docking. J. Comput. Aided Mol. Des. 17, 755–763 [DOI] [PubMed] [Google Scholar]
- 25.Schapira M., Totrov M., and Abagyan R. (1999) Prediction of the binding energy for small molecules, peptides and proteins. J. Mol. Recognit. 12, 177–190 [DOI] [PubMed] [Google Scholar]
- 26.Unal H., Jagannathan R., Bhat M. B., and Karnik S. S. (2010) Ligand-specific conformation of extracellular loop-2 in the angiotensin II type 1 receptor. J. Biol. Chem. 285, 16341–16350 [DOI] [PMC free article] [PubMed] [Google Scholar]
- 27.Unal H., Jagannathan R., Bhatnagar A., Tirupula K., Desnoyer R., and Karnik S. S. (2013) Long range effect of mutations on specific conformational changes in the extracellular loop 2 of angiotensin II type 1 receptor. J. Biol. Chem. 288, 540–551 [DOI] [PMC free article] [PubMed] [Google Scholar]
- 28.Liu W., Ishchenko A., and Cherezov V. (2014) Preparation of microcrystals in lipidic cubic phase for serial femtosecond crystallography. Nat. Protoc. 9, 2123–2134 [DOI] [PMC free article] [PubMed] [Google Scholar]
- 29.Liu W., Wacker D., Gati C., Han G. W., James D., Wang D., Nelson G., Weierstall U., Katritch V., Barty A., Zatsepin N. A., Li D., Messerschmidt M., Boutet S., Williams G. J., Koglin J. E., Seibert M. M., Wang C., Shah S. T., Basu S., Fromme R., Kupitz C., Rendek K. N., Grotjohann I., Fromme P., Kirian R. A., Beyerlein K. R., White T. A., Chapman H. N., Caffrey M., Spence J. C., Stevens R. C., and Cherezov V. (2013) Serial femtosecond crystallography of G protein-coupled receptors. Science 342, 1521–1524 [DOI] [PMC free article] [PubMed] [Google Scholar]
- 30.Weierstall U., James D., Wang C., White T. A., Wang D., Liu W., Spence J. C., Bruce Doak R., Nelson G., Fromme P., Fromme R., Grotjohann I., Kupitz C., Zatsepin N. A., Liu H., Basu S., Wacker D., Han G. W., Katritch V., Boutet S., Messerschmidt M., Williams G. J., Koglin J. E., Marvin Seibert M., Klinker M., Gati C., Shoeman R. L., Barty A., Chapman H. N., Kirian R. A., Beyerlein K. R., Stevens R. C., Li D., Shah S. T., Howe N., Caffrey M., and Cherezov V. (2014) Lipidic cubic phase injector facilitates membrane protein serial femtosecond crystallography. Nat. Commun. 5, 3309. [DOI] [PMC free article] [PubMed] [Google Scholar]
- 31.Ballesteros J. A., and Weinstein H. (1995) in Methods in Neurosciences (Stuart C. S., ed.) pp. 366–428, Academic Press, Orlando [Google Scholar]
- 32.Wacker D., Fenalti G., Brown M. A., Katritch V., Abagyan R., Cherezov V., and Stevens R. C. (2010) Conserved binding mode of human β2 adrenergic receptor inverse agonists and antagonist revealed by x-ray crystallography. J. Am. Chem. Soc. 132, 11443–11445 [DOI] [PMC free article] [PubMed] [Google Scholar]
- 33.Miura S., Kiya Y., Hanzawa H., Nakao N., Fujino M., Imaizumi S., Matsuo Y., Yanagisawa H., Koike H., Komuro I., Karnik S. S., and Saku K. (2012) Small molecules with similar structures exhibit agonist, neutral antagonist or inverse agonist activity toward angiotensin II type 1 receptor. PLoS ONE 7, e37974. [DOI] [PMC free article] [PubMed] [Google Scholar]
- 34.Perlman S., Schambye H. T., Rivero R. A., Greenlee W. J., Hjorth S. A., and Schwartz T. W. (1995) Non-peptide angiotensin agonist. Functional and molecular interaction with the AT1 receptor. J. Biol. Chem. 270, 1493–1496 [DOI] [PubMed] [Google Scholar]
- 35.Katritch V., Cherezov V., and Stevens R. C. (2013) Structure-function of the G protein-coupled receptor superfamily. Annu. Rev. Pharmacol. Toxicol. 53, 531–556 [DOI] [PMC free article] [PubMed] [Google Scholar]
- 36.Liu W., Chun E., Thompson A. A., Chubukov P., Xu F., Katritch V., Han G. W., Roth C. B., Heitman L. H., IJzerman A. P., Cherezov V., and Stevens R. C. (2012) Structural basis for allosteric regulation of GPCRs by sodium ions. Science 337, 232–236 [DOI] [PMC free article] [PubMed] [Google Scholar]
- 37.Katritch V., Fenalti G., Abola E. E., Roth B. L., Cherezov V., and Stevens R. C. (2014) Allosteric sodium in class A GPCR signaling. Trends Biochem. Sci. 39, 233–244 [DOI] [PMC free article] [PubMed] [Google Scholar]
- 38.Bihoreau C., Monnot C., Davies E., Teutsch B., Bernstein K. E., Corvol P., and Clauser E. (1993) Mutation of Asp-74 of the rat angiotensin II receptor confers changes in antagonist affinities and abolishes G-protein coupling. Proc. Natl. Acad. Sci. U.S.A. 90, 5133–5137 [DOI] [PMC free article] [PubMed] [Google Scholar]
- 39.Feng Y. H., Zhou L., Qiu R., and Zeng R. (2005) Single mutations at Asn295 and Leu305 in the cytoplasmic half of transmembrane α-helix domain 7 of the AT1 receptor induce promiscuous agonist specificity for angiotensin II fragments: a pseudo-constitutive activity. Mol. Pharmacol. 68, 347–355 [DOI] [PubMed] [Google Scholar]
- 40.Parnot C., Bardin S., Miserey-Lenkei S., Guedin D., Corvol P., and Clauser E. (2000) Systematic identification of mutations that constitutively activate the angiotensin II type 1A receptor by screening a randomly mutated cDNA library with an original pharmacological bioassay. Proc. Natl. Acad. Sci. U.S.A. 97, 7615–7620 [DOI] [PMC free article] [PubMed] [Google Scholar]
- 41.Fenalti G., Giguere P. M., Katritch V., Huang X. P., Thompson A. A., Cherezov V., Roth B. L., and Stevens R. C. (2014) Molecular control of δ-opioid receptor signalling. Nature 506, 191–196 [DOI] [PMC free article] [PubMed] [Google Scholar]
- 42.Feng Y. H., Miura S., Husain A., and Karnik S. S. (1998) Mechanism of constitutive activation of the AT1 receptor: influence of the size of the agonist switch binding residue Asn(111). Biochemistry 37, 15791–15798 [DOI] [PMC free article] [PubMed] [Google Scholar]
- 43.Unal H., and Karnik S. S. (2014) Constitutive activity in the angiotensin II type 1 receptor: discovery and applications. Adv. Pharmacol. 70, 155–174 [DOI] [PMC free article] [PubMed] [Google Scholar]