

Abstract
We report advances in quantitative fluorescent speckle microscopy to generate simultaneous maps of cytoskeleton flow and rates of net assembly and disassembly in living cells. We apply this tool to analyze the filamentous actin (F-actin) dynamics at the front of migrating cells. F-actin turnover and flow are both known to be factors of cell locomotion. However, how they are orchestrated to produce directed cell movements is poorly understood. Our approach to data analysis allows us to examine their interdependence. Our maps confirm the previously described organization of flow into a lamellipodium and a lamellum, both exhibiting retrograde flow; and a convergence zone, where lamellum retrograde flow meets with slow anterograde flow of cortical F-actin at the ventral side of the cell body. The turnover maps show the well known actin polymerization at the leading edge, but also indicate that ≈90% of the polymer disassembles at the lamellipodium–lamellum junction. Strong depolymerization is also found in the convergence zone, where meshwork contraction is prominent. To determine whether contraction and depolymerization are coupled events, we have treated cells with calyculin A, which is known to promote myosin activity. Stimulated contraction was accompanied by accelerated retrograde flow and increased depolymerization throughout the lamellum, whereas disassembly at the lamellipodium–lamellum junction remained unaffected. There appear to be two distinct depolymerization mechanisms, of which one depends directly on meshwork contraction.
Cell migration involves the assembly of a meshwork of filamentous actin (F-actin) at the cell edge facing the direction of movement (1–3), which is balanced by depolymerization in other places (4). In many cells, this continuous turnover of the meshwork is accompanied by retrograde flow away from the leading edge (5). It is likely that turnover and flow are coregulatory mechanisms of cell protrusion and hence the trajectory of motion. However, how the molecular effectors of actin dynamics are orchestrated to produce directed movement at the cellular level is poorly understood.
It is fairly obvious to hypothesize that turnover and flow should be interdependent parameters of F-actin dynamics. First, theoretical (6) and experimental studies (7) have indicated that actin polymerization can generate the forces required for protrusion of the cell plasma membrane. Conversely, these forces may be responsible for the pushing of the meshwork toward the cell center, implying a relationship between retrograde flow speed and the rate of polymerization at the leading edge. Second, the maps of retrograde flow we (8, 9) and others (10) have published exhibit noncoherent F-actin movement with zones of convergence. Using ratio imaging of labeled F-actin and a fluorescent volume marker suggested that convergence zones are not accompanied by a significant increase of F-actin density (11). Thus, depolymerization may be coupled to meshwork contraction.
To test these hypotheses, we have advanced our analysis of fluorescent speckle microscopy (FSM) movies of F-actin dynamics. In FSM, the stochastic integration of a very low fraction of fluorescently labeled monomers together with unlabeled monomers into polymer lattices results in a speckled appearance of the polymer under the fluorescence microscope (12). When FSM is applied to the visualization of the F-actin cytoskeleton, thousands of flickering speckles appear, move and disappear, each one representing the diffraction-limited image of 3–8 fluorophores clustered in a temporally stable patch of several filaments forming the F-actin meshwork (13). Speckle movement and changes in intensity hence report the displacement of the meshwork patch and the local association and dissociation of monomer to and from it. Recently, computer vision techniques have enabled us to automatically track the speckles to generate trajectory and velocity maps of cytoskeletal flow in living cells (9). In the present report, we supplement flow recovery with an equation expressing the conservation of local speckle field intensity in absence of polymer turnover. Deviations from this equation provide robust measurements of meshwork assembly or disassembly. For the first time, to our knowledge, we can thus obtain complete maps of both the flow and turnover of F-actin across the field of view of the microscope. We use this method to analyze the dynamics of the F-actin machinery on the ventral surface of newt lung epithelial cells migrating at the border of an epithelial monolayer. These cells polarize and establish characteristic motile machinery facing the boundary of the monolayer, but are restrained by contacts to other cells in the monolayer, and thus stay largely stationary.
Materials and Methods
FSM of Migrating Newt Lung Epithelial Cells. Primary cultures of newt (Taricha granulosa) lung epithelial cells were established and microinjected with 0.5 mg/ml X-rhodamine actin as described (14). For FSM, cells were mounted in growth media containing 30 μl/ml Oxyrase (Oxyrase, Mansfield, OH) and filmed on a spinning-disk confocal microscope system (15), by using 568-nm illumination. The microscope was controlled by metamorph software (Universal Imaging, Downington, PA). Image sequences were collected in a single focal plane at 10-s intervals. In experiments with drug application, cells were imaged before and after perfusion of 1 μM jasplakinolide (jasp) or 20 nM calyculin A (CA) in media containing 30 μl/ml Oxyrase.
Image Analysis. Raw image sequences were transferred from metamorph to our own package for FSM analysis. The program has been developed under matlab (Mathworks, Nattick, MA), with some modules written in c++. Algorithms for speckle detection and tracking are described in refs. 9 and 16. The reconstruction of turnover maps in deformable F-actin meshworks is addressed in Results and Discussion.
Results and Discussion
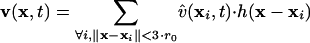
Reconstruction of Retrograde Flow by Using Single-Particle Tracking. Fig. 1A Inset displays the first frame of a time-lapse FSM sequence showing the leading edge of a migrating newt lung epithelial cell. When animating the frame series (compare Movie 1, which is published as supporting information on the PNAS web site), the speckle pattern detectably moves, indicating retrograde flow. We have implemented single-particle tracking methods to follow the movement of each speckle (9). The method is tuned to cope with the weak speckle signal, the high particle density, and the random appearance and disappearance of speckles. To find speckle correspondences under these ambiguous conditions, we have adopted graph algorithms (17) that globally select the most likely match between speckles from the many possible link configurations. Although the majority of correspondences returned by this scheme represent true segments of speckle trajectories, the algorithm generates 5–10% wrong links and breaks continuous trajectories into subtrajectories because some links are missed (9). Nevertheless, the data are sufficient to reconstruct high-resolution maps of speckle flow (Fig. 1A). To calculate the maps, we construct regular grids and convolute the raw speckle links x̂(xi, t) with an isotropic, normalized Gaussian kernel to obtain the velocity v(x, t)inanygrid point x:
 |
[1] |
with
 |
Fig. 1.

Analysis of F-actin dynamics at the protruding front of a migrating newt lung epithelial cell. (A) Vector map of F-actin flow as obtained by single-particle tracking of speckles. The map is interpolated on a grid of 670 nm side length by using data from five consecutive frames (50 s). (Scale bar, 5 μm.) (Inset) Raw FSM image data. The box indicates the position where meshwork dynamics is analyzed in detail in Fig. 2. (B) Map of the flow speed. (Inset) Profiles at three different locations. (C) Map of net meshwork turnover normalized to a scale of -1... 1. Negative values indicate disassembly and positive values indicate assembly. Dashed lines depict zones analyzed numerically in Table 1. See text for further explanations of labels and arrows. (D) Contour map (white, disassembly; black, assembly) of net turnover rates overlaid to a color representation of div(v(x, t)).
Hence, the velocity in x is defined by the weighted average of all links whose source coordinates xj fall inside a circle with center coordinates x and a radius 3·r0·r0 defines the 1/e-correlation length of the convolution kernel. For all maps shown, r0 has been set to 1.6 μm, expressed in the object domain. This choice depends on the mechanical properties of the F-actin meshwork and has in our case been adjusted to the persistence length of an actin filament (18). In Fig. 1A, we have additionally applied time filtering over five frames (i.e., 50 s), assuming that temporal changes of the flow structure are small during this period. Besides attenuation of tracking errors, the application of Eq. 1 is justified by the perturbation of speckle trajectories associated with thermal fluctuations of the meshwork, local meshwork contractions, and image noise. Raw speckle displacements are only in a statistical sense related to the underlying polymer flow, of which the trend has to be extracted by averaging.
Speckle Flow Is Organized in Four Zones. Fig. 1A reconstitutes the general pattern of retrograde flow described for migrating cells by other imaging methods (8, 19, 20). However, FSM provides a level of detail that indicates organization of the meshwork in four kinematically distinct zones. Retrograde flow starts immediately behind the cell edge at a speed of 0.5–0.8 μm/min (see also Fig. 1B) and turns into an area of slower flow (0.3–0.5 μm/min). A band of maximum speed decrease follows the leading edge at a distance of ≈3 μm. As described for fibroblasts (21), and in previous FSM studies of newt lung epithelial cells (11, 22), it separates two parts of the actin cytoskeleton, referred to as the lamellipodium (Lp) and lamellum (L). The bottom of the map indicates slow (0–0.2 μm/min) anterograde flow (A). We infer that in the “convergence zone” between L and A, there is an area of meshwork contraction, pulling the actin cytoskeleton from both sides (C). Here, F-actin either moves parallel to the leading edge or comes to a complete halt. This finding agrees with the alignment of filaments in bundles found by electron microscopy at the junction between the lamellipodium and cell body of fish epidermal keratocytes (23). Another peculiar structure in the convergence zone is an area of isotropic contraction, which yields a pole in the flow field (P).
Superimposed on the general organization are many small variations in flow speed and direction. Interestingly, the highest variation occurs along the leading edge, accompanied by similarly variable speed gradients at the junction to the lamellum (compare Fig. 1B Inset).
Mapping F-actin Turnover by Combining Speckle Flow and Intensity Data. In FSM of F-actin, detectable speckles are exclusively associated with fluorescent actin monomers bound to the polymer meshwork, whereas diffusible monomers (G-actin) does not contribute to speckles in the image (13, 24). This concept was nicely demonstrated by Watanabe and Mitchison (25), who showed that diffusible GFP expressed at very low levels in cells produced an even distribution of fluorescence in high-resolution images, whereas a similar expression level of GFP-actin, which is competent for incorporation into the meshwork, produced a speckled fluorescence image. The authors concluded that F-actin turnover can thus be measured by analysis of the number of speckle appearances and disappearances, signaling polymerization and depolymerization directly. This simple model, however, holds only for single-fluorophore speckles, generating relatively sparse information (13, 24). In ref. 16, we proposed a more general model for mapping F-actin turnover, based on dense fields of multifluorophore speckles. As with single-fluorophore speckles, this approach relies on the analysis of appearance and disappearance events, which requires a complete trajectory for every speckle in a movie. Therefore, the use of the method has been limited to spatially stationary F-actin meshworks, where speckle tracking is easy.
In the following, we still depend on the property of FSM that the signal stems from meshwork-bound fluorophores exclusively, but we relax the requirement for complete speckle trajectories. This procedure allows us to compute maps of net assembly and disassembly also in a spatially nonstationary meshwork. To explain the algorithm, we first assume that the meshwork is not deformable. Under these conditions, temporal changes in the intensity of the speckle pattern reflect the number of fluorophores added to, minus the number of fluorophores removed from the meshwork. Exchange of labeled versus unlabeled monomers is a binomial stochastic process of mean f and variance f·(1 - f), with f denoting the labeling ratio. Hence, the average change in speckle pattern intensity I(x, t) relates to the net change in meshwork density by
 |
[2] |
where ρ(x, t) describes the density of F-actin as a function of space and time, and α determines the conversion between the number density of fluorophores and fluorescent signal. For averaging, we apply a Gaussian low-pass filter of radius r0 to the intensity raw data. The factor α depends on the excitation intensity, the quantum yield of the dye, and the sensitivity of the camera. Whereas these parameters could be calibrated experimentally, there is currently no robust method available to estimate f in live-cell FSM images. Therefore, we confine our analysis to a relative scale that is proportional to the number of monomers locally exchanged. To simplify the notation, we define σ(x, t) = α·f·∂ρ(x, t)/dt as the net turnover rate of F-actin. Positive rates refer to net assembly, negative values to net disassembly. For visualization purposes, we further normalize σ(x, t) to the range -1... 1. Note that Eq. 2 holds even when unbound monomers generate a significant, but stationary background signal.
Besides fluorophore association and dissociation, changes in intensity can arise from meshwork deformation. When assuming conservation of mass, i.e., now meshwork turnover is temporarily neglected, a description of the meshwork as a mechanical continuum determines flow-induced changes in density (26):
 |
[3] |
 denotes the spatial density gradient and
  the divergence of the flow. The first term on the right side of Eq. 3 accounts for changes in meshwork density because, with the movement, meshwork pieces of variable density pass through x. The second term describes density changes due to meshwork compression or expansion. With compression, the term div(v(x, t)) is negative. Because ρ(x, t) is always positive, the density will thus increase (∂ρT(x, t)/dt > 0). The opposite applies to meshwork expansion. Addition of Eq. 3 to the right side of Eq. 2 yields the total intensity change due to turnover and transport. With elementary algebraic manipulations, we obtain
 |
[4] |
σ(x, t) is the only unknown in Eq. 4. I(x, t) and its time-derivative ∂I(x, t)/dt are directly measured in the low-pass-filtered FSM time-lapse series, whereas v(x, t) and div(v(x, t)) are available after flow field reconstruction. Before calculation of σ(x, t) the intensity field I(x, t) is normalized to an equal mean for all time points to remove global signal flicker due to focus shift and dye bleaching.
Turnover Maps Reveal the Same Spatial Organization as Flow Maps. Fig. 1C displays the net turnover derived from the flow field in Fig. 1A. In agreement with previous studies (11, 25, 27), strong polymerization activity is found at the leading edge (Le). Significant polymerization is also present in the lamellum (L; arrows), which may be comparable to what has been referred to as basal polymerization in the lamellipodium of Xenopus fibroblasts (25). However, the spatial organizations of lamellipodium and lamellum turnover differ significantly. Whereas the lamellum consists of random patches of assembly and disassembly, the lamellipodium comprises of a band of dominant polymerization next to a band of strong depolymerization. Integration of σ(x, t) over the lamellum yields a mean net turnover per pixel close to zero (Table 1). The lamellipodium has only a slightly higher mean rate; however, when integrating only the polymerizing band (Le; Fig. 1C), we obtain a mean rate five times higher than the average. Accounting for the area fraction of the leading edge, we conclude that ≈91.5% of the F-actin assembled in the leading edge is again disassembled toward the lamellipodium–lamellum junction.
Table 1. Net F-actin turnover integrated over different areas of interest.
| Integration zone | Area, μm2/no. of data points | Mean net turnover 20-50 s, AU per data point | Mean net turnover 0-320 s, AU per data point per frame |
|---|---|---|---|
| Leading edge (Le) | 65.5/146 | 0.417 | 0.418 |
| Lamellipodium (Lp) | 163.4/364 | 0.085 | 0.092 |
| Lamellum (L) | 328.6/732 | 0.051 | 0.076 |
| Convergence zone (C) | 115.8/258 | -0.163 | -0.068 |
| Pole (P) | 34.1/76 | -0.139 | -0.082 |
| Cell body (zone of anterograde flow; A) | 124.3/277 | -0.036 | -0.013 |
For a definition of the areas, see Fig. 1A. AU, arbitrary units.
Strong disassembly is also found in the zones C and P, identified above as possible areas of motor-induced contraction, whereas turnover in the cell body (A) resembles the one in the lamellum.
Colocalization of Depolymerization and Flow Convergence. At the junction of lamellipodium and lamellum, as well as in the convergence zone and pole, the flow map Fig. 1A indicates significant convergence and hence a negative term I(x, t)div(v(x, t)) in Eq. 4. To investigate whether flow convergence is the main source of depolymerization in these areas (Fig. 1C), we have generated a map of div(v(x, t)) with contour overlays of the net turnover rate (Fig. 1D). Remarkably, the values of div(v(x, t)) at the lamellipodium–lamellum junction are similar to the ones calculated throughout the lamellum. We conclude that depolymerization in this region is unrelated to meshwork compression and must be promoted mainly by biochemical effectors (28). In stark contrast, in the convergence zone and pole, peaks of depolymerization colocalize with strong negative values of div(v(x, t)), rendering I(x, t)div(v(x, t)) the predominant term in Eq. 4. There are at least three possible explanations for this coupling of meshwork compression and disassembly: (i) Compression could cause breakage of filaments (29) accompanied by increased density of free, depolymerizing filament pointed ends. (ii) The same biochemical effectors as proposed to stimulate depolymerization at the lamellipodium–lamellum junction could be up-regulated in these zones, followed by local reduction of meshwork stiffness, and thus lower mechanical resistance to contraction. As a result, meshwork flow converges to locations with strong depolymerization. (iii) Another class of biochemical effectors of depolymerization could be concentrated in these zones, stimulated by signaling pathways similar to those promoting myosin activity.
Organization of Flow and Turnover Is Time-Persistent over Minutes. We have computed animated flow and turnover maps over 5 min in steps of 30 s (compare Movies 2 and 3, which are published as supporting information on the PNAS web site). They indicate that the organization of flow into four zones is persistent, which is in agreement with the overall steady state of the position of the cell edge. In detail, however, the flow speed varies significantly, mainly in the lamellum. Also, the velocity gradient at the lamellipodium–lamellum junction varies over time, suggesting that the flow in this area is not only spatially (Fig. 1B) but also temporally transient. However, at the same time, strong depolymerization continues over all frames. This result supports the previous conclusion that in this zone, depolymerization and flow are independent parameters. The persistence of lamellipodium turnover is further reflected by the data in Table 1, in the last column. The mean net turnover rates per pixel per frame averaged over 5 min for lamellipodium and the leading edge do not significantly deviate from the ones calculated over only 30 s.
Short-term increases in lamellum flow are consistently accompanied by acceleration of anterograde flow beyond the convergence zone. This finding supports the notion that these two parts of the flow field are coupled by motor-driven contraction. Similar observations are made for the pole, whose position seems fairly stable, yet the magnitudes of the converging flow vectors vary in the range from 0 to 1 μm/min over a short period. Flow variations in the convergence zone and the pole are in concert with variations in depolymerization. Fig. 2 shows a detail of the polar region, where an increase of anterograde flow is accompanied by increased disassembly (black arrow), as is the acceleration of a sideways flow into the pole at the border of the field of view (white arrow). The mean net rates in Table 1 underline that turnover in the convergence zone and pole is the least persistent, reflecting its dependence on time-modulated contraction. All of these findings provide additional evidence for the coupling of contraction and depolymerization in the lamellum.
Fig. 2.

Coupling of F-actin transport and turnover over 40 s in a subregion of the meshwork indicated in Fig. 1A. See text for a discussion of the dynamics.
Validation of Turnover Maps by Synthetic FSM Data and by Perfusion of Cells with the Filament Stabilizing Cytotoxin Jasp. We verified the validity of our turnover maps on synthetic data, and on FSM movies where cells were treated by jasp. Jasp is known to stabilize actin filaments, preventing their disassembly in vitro (30) and in vivo (4). We anticipated that during jasp perfusion, turnover maps would exhibit lower depolymerization at the lamellipodium–lamellum junction. This expectation is confirmed by Fig. 3 A and B. Application of jasp does not only eliminate the depolymerization band at the lamellipodium–lamellum border but decreases F-actin disassembly throughout the entire lamellum. Interestingly, stabilization of filaments appears to reduce polymerization at the leading edge and in the lamellum, suggesting that the recycling of monomers dissociating from filaments is in these cells rate-limiting for the assembly of new filaments. This conclusion has been drawn previously in chick fibroblasts from their reduced migration (4) and is now supported by direct measurements of the polymerization rate.
Fig. 3.

Validation of the algorithm used to reconstruct maps of F-actin turnover from FSM time-lapse series. Turnover before (A) and after (B) perfusion of the cell with jasp, a cytotoxin known to stabilize actin filaments and thus decrease the rate of disassembly. Reduced depolymerization slows the assembly process, suggesting that the recycling of dissociated monomers is in these cells rate limiting for meshwork polymerization. (C) Centripetal flow reconstructed from the synthetic FSM movies (Movies 4–7, which are published as supporting information on the PNAS web site). (D–G) Maps of turnover reconstructed under different kinetic conditions. See text and supporting information for further explanation.
For quantitative performance tests against calibrated control data, we simulated FSM images of a meshwork with poleward flow of constant speed (compare Movies 4–7). Fig. 3C displays the flow field reconstructed from tracking synthetic speckles. Except for a circular area with a radius of ≈1 μm around the pole, both the flow direction and magnitude are reconstructed with an error <5%. Close to the pole, the flow magnitude is underestimated as a consequence of the convolution of the raw speckle tracks with a Gaussian low-pass filter (Eq. 1). This display illustrates the current resolution limit of F-actin flow reconstruction. To test the capacity of the software in detecting turnover, we constructed four representative patterns of meshwork assembly and disassembly in presence of centripetal flow. Fig. 3D displays the map reconstructed for a meshwork with no net turnover. Despite the flow-induced, rapid growth of fluorophore density in the pole area (compare Movie 4), Eq. 4 is able to refer the resulting intensity increase to meshwork compression and correctly reports an almost flat zero turnover field. In Fig. 3E, we processed data simulating meshwork depolymerization at rates that maintain a constant meshwork density in presence of poleward flow. Consequently, disassembly increases toward the pole, as reconstructed by our algorithm. Fig. 3 F and G present maps of meshworks with steady-state net polymerization and depolymerization, respectively. The rate magnitude is equal for both data sets, as correctly revealed by our program. Quantitative evaluation of the fluctuations of the maps caused by the stochastic nature of monomer exchange with a pool of labeled and unlabeled units indicated to us that the reconstruction of relative turnover rates could be accomplished with an error of <10% in all cases.
CA Increases Flow and Depolymerization in the Lamellum and Eliminates Flow and Turnover Gradients at the Lamellipodium–Lamellum Junction. We exploited the possibility to simultaneously map flow and turnover to further examine the putative coupling of contraction and meshwork disassembly in cells treated with CA (22). CA is a type I phosphatase inhibitor known to inhibit myosin light-chain phosphatase and thus promote contractility (31, 32). Fig. 4 displays selected time points of the analyzed FSM sequence. In contrast to Fig. 1, only the lamellipodium and lamellum fall inside the field of view. Fig. 4A confirms a velocity gradient between the lamellipodium and lamellum; in this particular cell, it is more pronounced than with the one in Fig. 1B. Fig. 4B displays the evolution of lamellum flow speed over 50 min (3,000 s) in a randomly selected region of interest (see ROI, Fig. 4A; compare Movies 8–10). After applying two doses of 20 nM CA, the flow speed (red line) increases. Little change of speed is measured between the first and the second drug application, whereas the applications are promptly followed by depolymerization bursts (blue line). With both bursts, the lamellum returns to net turnover rates close to zero after 250–450 s. Obviously, these data provide additional evidence for a mechanistic link between contraction and depolymerization, although the response of flow to myosin activation seems slower than the one of turnover. One interpretation of this behavior would be that CA stimulates contraction immediately, but in random directions. No change of flow would thus be measurable at the scale of the whole lamellum. However, coupled depolymerization could induce ultrastructural changes in the meshwork, which reorganize the contraction machinery to exert parallel forces observable as delayed flow acceleration. Another possible reason for the delay in velocity increase is that depolymerization causes the meshwork to become more compliant to force application. Therefore, it could take some time until the meshwork is again under tension so that activation of contraction yields acceleration of flow. Alternatively, CA could act to inhibit an additional phosphatase that results in phosphorylation and activation of a depolymerization factor.
Fig. 4.

Analysis of F-actin dynamics at the front of a cell treated with CA. (A) Flow map at the first time point (0 s) before CA perfusion. (B) Evolution of flow speed (red) and net turnover rates (blue) over 3,000 s. Time points of twofold drug application are indicated by arrows. The regions of interest used for the calculation of averaged flow speed and net turnover rates are indicated in A by a ROI polygon and a dashed, white line, respectively. (C) Selected frames of the analyzed time series. Animated maps are provided as Movies 8–10, which are published as supporting information on the PNAS web site. The image in Lower Left was acquired right before the first application of CA; the image in Lower Center was acquired 100 s afterward. The image in Lower Right is the last in the movie and indicates the elimination of flow and turnover gradients at the lamellipodium–lamellum junction.
Fig. 4C illustrates these findings with spatially resolved maps in three time points. Animated maps are provided as supporting information. The flow maps (Upper) before (700 s) and after (800 s) CA perfusion change little, but the turnover maps (Lower) exhibit increased depolymerization in the lamellum at 800 s. On this time scale, CA perfusion does not seem to affect turnover in the lamellipodium, whereas it does slow down retrograde flow. This tendency is continued throughout the sequence and culminates in the disappearance of the velocity gradient at the lamellipodium–lamellum junction ≈2,000 s after the first CA treatment (Fig. 4C, 3,000 s). The turnover map for this time point indicates preserved leading edge polymerization, but no lamellipodium depolymerization. We do not have a conclusive explanation for the CA-induced breakdown of gradients in flow and turnover at the lamellipodium–lamellum junction. One possibility is that activated lamellum contraction disrupts binding of the F-actin meshwork to substrate adhesion sites present in this zone at a high density. This process could induce a reorganization of the meshwork ultrastructure so that the lamellipodium and lamellum merge in a more homogeneous cytoskeleton.
Conclusion
We report our analysis of time-lapse FSM for the spatial and temporal mapping of cytoskeleton flow and turnover. To demonstrate our method, we focus this paper on validation experiments using synthetic FSM movies and live cell data where F-actin turnover was altered by drugs with well characterized effects; and on the question whether F-actin flow and turnover at the ventral surface of migrating cells are coupled. Both flow and turnover have been identified as important promoters of cell locomotion, but their interdependence is poorly understood. We found a strong F-actin polymerization at the leading edge and two major zones of depolymerization. F-actin depolymerization at the lamellipodium–lamellum junction disassembles ≈90% of the meshwork generated at the leading edge. By comparing the organization of flow with the rates of depolymerization, we conclude that depolymerization in this area is independent of contraction. In contrast, in the convergence zone, depolymerization is coupled to contraction. We support this notion with experiments in which contraction is manipulated with CA. Depolymerization in the lamellum immediately increased after drug perfusion; however, turnover in the lamellipodium was almost unaffected. These findings hint at the existence of two separate mechanisms of depolymerization for which the molecular players have yet to be identified.
It is, however, not within the scope of this paper to identify these mechanisms, but rather to show that quantitative analysis of FSM data provides unprecedented capacity to analyze cytoskeleton dynamics. It will now be important to use FSM as the readout of perturbation studies, to rigorously address these and other questions concerning the molecular basis of cell migration.
Acknowledgments
This work was supported by Swiss National Science Foundation Grant 21-59452.99 (to G.D.) and Human Frontiers in Science Program Grant RG 5/2002 (to C.M.W.-S. and G.D.).
This paper was submitted directly (Track II) to the PNAS office.
Abbreviations: FSM, fluorescent speckle microscopy, F-actin, filamentous actin; jasp, jasplakinolide; CA, calyculin A.
References
- 1.Mitchison, T. J. & Cramer, L. P. (1996) Cell 84, 371-379. [DOI] [PubMed] [Google Scholar]
- 2.Borisy, G. G. & Svitkina, T. M. (2000) Curr. Opin. Cell Biol. 12, 104-112. [DOI] [PubMed] [Google Scholar]
- 3.Small, J. V., Stradal, T., Vignal, E. & Rottner, K. (2002) Trends Cell Biol. 12, 112-120. [DOI] [PubMed] [Google Scholar]
- 4.Cramer, L. P. (1999) Curr. Biol. 9, 1095-1105. [DOI] [PubMed] [Google Scholar]
- 5.Cramer, L. P. (1997) Front Biosci. 2, 260-270. [DOI] [PubMed] [Google Scholar]
- 6.Mogilner, A. & Oster, G. (1996) Biophys. J. 71, 3030-3045. [DOI] [PMC free article] [PubMed] [Google Scholar]
- 7.Loisel, T. P., Boujemaa, R., Pantaloni, D. & Carlier, M. F. (1999) Nature 401, 613-616. [DOI] [PubMed] [Google Scholar]
- 8.Danuser, G. & Oldenbourg, R. (2000) Biophys. J. 79, 191-201. [DOI] [PMC free article] [PubMed] [Google Scholar]
- 9.Vallotton, P., Ponti, A., Waterman-Storer, C. M., Salmon, E. D. & Danuser, G. (2003) Biophys. J. 85, 1289-1306. [DOI] [PMC free article] [PubMed] [Google Scholar]
- 10.Caspi, A., Yeger, O., Grosheva, I., Bershadsky, A. D. & Elbaum, M. (2001) Biophys. J. 81, 1990-2000. [DOI] [PMC free article] [PubMed] [Google Scholar]
- 11.Salmon, W. C., Adams, M. C. & Waterman-Storer, C. M. (2002) J. Cell Biol. 158, 31-37. [DOI] [PMC free article] [PubMed] [Google Scholar]
- 12.Waterman-Storer, C. M. & Salmon, E. D. (1998) Biophys. J. 75, 2059-2069. [DOI] [PMC free article] [PubMed] [Google Scholar]
- 13.Danuser, G. & Waterman-Storer, C. M. (2003) J. Microsc. 211, 191-207. [DOI] [PubMed] [Google Scholar]
- 14.Waterman-Storer, C. M. & Salmon, E. D. (1997) J. Cell Biol. 139, 417-434. [DOI] [PMC free article] [PubMed] [Google Scholar]
- 15.Adams, M. C., Salmon, W. C., Gupton, S. L., Cohan, C. S., Wittmann, T., Prigozhina, N. & Waterman-Storer, C. M. (2003) Methods 29, 29-41. [DOI] [PubMed] [Google Scholar]
- 16.Ponti, A., Vallotton, P., Salmon, W. C., Waterman-Storer, C. M. & Danuser, G. (2003) Biophys. J. 84, 3336-3352. [DOI] [PMC free article] [PubMed] [Google Scholar]
- 17.Sedgewick, R. (2002) Algorithms in C++, Graph Algorithms (Addison-Wesley, Boston).
- 18.Gittes, F., Mickey, B., Nettleton, J. & Howard, J. (1993) J. Cell Biol. 120, 923-934. [DOI] [PMC free article] [PubMed] [Google Scholar]
- 19.Lin, C. H. & Forscher, P. (1995) Neuron 14, 763-771. [DOI] [PubMed] [Google Scholar]
- 20.Wang, Y. (1985) J. Cell Biol. 101, 597-602. [DOI] [PMC free article] [PubMed] [Google Scholar]
- 21.Abraham, V. C., Krishnamurthi, V., Taylor, D. L. & Lanni, F. (1999) Biophys. J. 77, 1721-1732. [DOI] [PMC free article] [PubMed] [Google Scholar]
- 22.Gupton, S. L., Salmon, W. C. & Waterman-Storer, C. M. (2002) Curr. Biol. 12, 1891-1899. [DOI] [PubMed] [Google Scholar]
- 23.Svitkina, T. M., Verkhovsky, A. B., McQuade, K. M. & Borisy, G. G. (1997) J. Cell Biol. 139, 397-415. [DOI] [PMC free article] [PubMed] [Google Scholar]
- 24.Waterman-Storer, C. M. & Danuser, G. (2002) Curr. Biol. 12, R633-R640. [DOI] [PubMed] [Google Scholar]
- 25.Watanabe, N. & Mitchison, T. J. (2002) Science 295, 1083-1086. [DOI] [PubMed] [Google Scholar]
- 26.Evans, E. (1993) Biophys. J. 64, 1306-1322. [DOI] [PMC free article] [PubMed] [Google Scholar]
- 27.Symons, M. H. & Mitchison, T. J. (1991) J. Cell Biol. 114, 503-513. [DOI] [PMC free article] [PubMed] [Google Scholar]
- 28.Pollard, T. D., Blanchoin, L. & Mullins, R. D. (2000) Annu. Rev. Biophys. Biomol. Struct. 29, 545-576. [DOI] [PubMed] [Google Scholar]
- 29.Higuchi, H., Serizawa, K. & Sasaki, N. (2003) in 43rd Annual Meeting of the ASCB (Am. Soc. Cell Biol., San Francisco), p. 39a.
- 30.Bubb, M. R., Senderowicz, A. M., Sausville, E. A., Duncan, K. L. & Korn, E. D. (1994) J. Biol. Chem. 269, 14869-14871. [PubMed] [Google Scholar]
- 31.Ishihara, H., Martin, B. L., Brautigan, D. L., Karaki, H., Ozaki, H., Kato, Y., Fusetani, N., Watabe, S., Hashimoto, K. & Uemura, D. (1989) Biochem. Biophys. Res. Commun. 159, 871-879. [DOI] [PubMed] [Google Scholar]
- 32.Venema, R. C., Raynor, R. L., Noland, T. A. & Kuo, J. F. (1993) Biochem. J. 294, 401-406. [DOI] [PMC free article] [PubMed] [Google Scholar]