

Abstract
Protein-RNA networks are ubiquitous and central in biological control. We present an approach, termed “RNA Tagging,” that identifies protein-RNA interactions in vivo by analyzing purified cellular RNA, without protein purification or crosslinking. An RNA-binding protein of interest is fused to an enzyme that adds uridines to the end of RNA. RNA targets bound by the chimeric protein in vivo are covalently marked with uridines and subsequently identified from extracted RNA using high-throughput sequencing. We used this approach to identify hundreds of RNAs bound by a Saccharomyces cerevisiae PUF protein, Puf3p. The method revealed that while RNA-binding proteins productively bind specific RNAs to control their function, they also “sample” RNAs without exerting a regulatory effect. We exploited the method to uncover hundreds of new and likely regulated targets for a protein without canonical RNA-binding domains, Bfr1p. The RNA Tagging approach is well-suited to detect and analyze protein-RNA networks in vivo.
INTRODUCTION
Proteins bind to and regulate RNAs, governing RNA processing, transport, translation, and decay. A single protein can bind and control hundreds of RNAs, while a single RNA molecule may be bound by many proteins. These protein-RNA networks are essential, and their misregulation can lead to defects in cell function and human disease. Global mapping of protein-RNA interactions across the proteome and transcriptome is thus a central goal.
Over the last decade, powerful RNA immunoprecipitation-based approaches have made it possible to identify RNAs bound by a specific protein1. In RNA immunoprecipitation (RIP), RNA-binding proteins are immunopurified from cell lysates, and associated RNAs are identified by microarray or deep sequencing2,3. UV-crosslinking prior to immunoprecipitation (CLIP) covalently links interacting proteins and RNAs, which facilitates their purification4–7. CLIP also employs a partial RNase digestion of bound RNA to determine global binding sites for particular proteins5–7.
Despite their utility and strength, RIP and CLIP approaches have limitations. Protein-RNA complexes must be purified from cell lysates using antibodies directed to endogenous or epitope-tagged proteins. RIP, which requires native conditions, is susceptible to non-physiological interactions in vitro8–10. In CLIP, UV-crosslinking is relatively inefficient or requires nucleotide analogs to enhance efficiency6,11,12. CLIP also requires numerous enzymatic steps. Moreover, since transient interactions are permanently captured by crosslinking, biologically meaningful interactions are difficult to distinguish from those that are not10.
We sought a method to identify global protein-RNA interactions in vivo, in which interactions were unambiguous and must have occurred inside the cell. The approach we report here, termed “RNA Tagging”, does so and is independent of protein purification, crosslinking, or radioactive-labeling steps. We use the approach to identify RNAs bound by two Saccharomyces cerevisiae proteins, Puf3p and Bfr1p.
RESULTS
The RNA Tagging approach
To detect and probe protein-RNA interactions in vivo, we developed a new approach, termed “RNA Tagging”. The key principle of the method is that binding of a protein to an RNA in vivo leaves a covalent mark on the RNA, which is subsequently detected in vitro. In its simplest application, an RNA-binding protein (RBP) is fused to the Caenorhabditis elegans poly(U) polymerase, PUP-2 (Fig. 1a). This enzyme lacks RNA-binding domains and therefore does not uridylate RNA efficiently on its own, unlike other proteins in the family13,14. As a result, the chimeric protein covalently “tags” only the RNAs to which the RBP binds. Tagged RNAs, bearing varied numbers of uridines (the “U-tag”), are identified from the pool of total RNA using targeted or high-throughput sequencing assays, facilitated by a reverse-transcription step that is selective for uridylated RNAs (Fig.1b).
Figure 1.

The RNA Tagging approach. a) Strategy. RBP, RNA-binding protein. PUP, poly(U) polymerase. b) Schematic of targeted RT-PCR and transcriptome-wide RNA Tagging assays. RNAs are tailed with a combination of guanosines (G) and inosines (I) (purple). The U-select primer contained the Illumina 3′ adapter sequence (brown), nine cytosines (purple) that base pair with the G/I tail, and three adenosines (red) that select for uridines at the 3′ end of the mRNA. c) Computational identification of Tagged RNAs. A-tails refers to the poly(A) tail and U-tails refers to 3′ terminal uridines, which were often in the U-tag. d) Nature of the data. The cartoon depicts Tagged RNAs aligned to a representative gene. ORF, open reading frame. e) Plot of the mean U-tag length detected by high-throughput sequencing of synthetic DNA libraries that contained U-tags of 0, 2, 4, 6, 8, 10, and 12 nucleotides. At least 50,000 reads were detected for each library (>1 million total reads). The R2 value (R2 = 0.99, n = 7) was determined by linear regression analysis, and error bars represent standard deviation.
Targeted detection of RNA Tagging
We first implemented RNA Tagging in S. cerevisiae and focused on the PUF protein, Puf3p. This protein recognizes a well-defined sequence in hundreds of mRNA targets important for mitochondrial functions15–21. To create the RNA Tagging chimera, termed “PUF3-PUP”, we inserted the pup-2 open reading frame downstream of PUF3 at its native locus in the S. cerevisiae genome.
We initially examined tagging of two known targets of Puf3p: HSP10 and COX17 mRNA15,17. We grew strains that expressed wild-type or a mutant PUF3-PUP chimera with a catalytically inactive PUP to mid-log phase and lysed cells under denaturing conditions. We next performed parallel RT-PCR assays on HSP10 and COX17 mRNA (Supplementary Fig. 1a). PUF3-PUP deposited U-tags on both mRNAs (Supplementary Fig. 1b,c). A primer selective for uridylated RNAs (U-select primer) yielded prominent PCR products only in cells that expressed the wild-type chimeric protein. As controls, a primer selective for polyadenylated RNAs detected the mRNAs in all samples, and the mutant chimera failed to tag HSP10. The presence of the U-tag on HSP10 mRNA was confirmed by directed sequencing (Supplementary Fig. 1d). Similarly, a PUF5-PUP2 chimera added U’s to endogenous, wild-type PHD1 mRNA, a known target22, but not to the same mRNA with mutant binding elements, which was confirmed by deep sequencing as described below (Supplementary Fig. 1e,f). Thus, RNA Tagging identified protein-RNA interactions that occurred in the cell.
Transcriptome-wide RNA Tagging
To implement RNA Tagging transcriptome-wide, we grew yeast strains that expressed PUF3-PUP to mid-log phase and isolated RNA (Fig. 1a). We then enriched mRNAs and added 3′ terminal G/I nucleotides to serve as a 3′ adapter (G/I-tailing)23 (Fig. 1b). Inosines were included to reduce the stability of potential G-quadruplexes24. Next, we reverse-transcribed the G/I-tailed RNA using the U-select primer, synthesized the second strand of DNA, PCR amplified the dsDNA, and size-selected the PCR products using SPRI beads. DNA libraries were paired-end sequenced on an Illumina HiSeq 2500 instrument.
Tagged RNAs were identified using a computational approach. We used the first sequencing read (Read 1) to assign reads to particular genes, and we used the second sequencing read (Read 2) to identify the 3′ terminal nucleotides (Fig. 1c,d). RNAs with U-tags, termed “Tagged RNAs”, were defined as RNAs that ended in at least eight adenosines not encoded in the genome (the poly(A) tail), followed by at least one uridine not encoded in the genome or the U-select primer. To ensure U-tags of various lengths were accurately detected, we sequenced synthetic DNA libraries with known numbers of uridines. The libraries contained the adapter sequences, a poly(A)12 tail, and variable length U-tags (Supplementary Fig. 2a). The synthetic U-tags were accurately measured and readily distinguished (Fig. 1e).
RNA Tagging identified global Puf3p targets
Analysis of the PUF3-PUP tagging strain yielded a set of Tagged RNAs. Of the approximately ten million reads, about 50% aligned to a single location in the yeast genome (“uniquely mapped”). We detected just over one million Tagged RNAs, which corresponded to approximately 175,000 Tagged RNAs Per Million uniquely mapped reads (“TRPM”). Tagged RNAs had U-tags that ranged from one to more than ten nucleotides in length, and U-tags of all lengths were enriched approximately 500- to 1,800-fold in the PUF3-PUP strain relative to a control strain (Fig. 2a).
Figure 2.
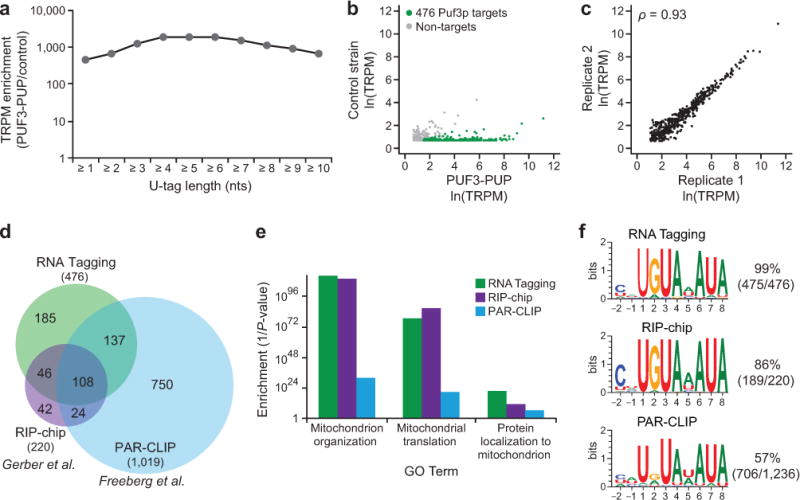
RNA Tagging identified transcriptome-wide Puf3p targets. a) Enrichment of Tagged RNAs detected across different U-tag lengths in PUF3-PUP yeast relative to a control yeast strain (BY4742). Enrichment was calculated as a ratio of TRPMs obtained in strains with and without the PUF3-PUP chimera. TRPM, Tagged RNAs per million uniquely mapped reads. b) Scatter plot of Tagged RNAs detected in the PUF3-PUP strain relative to the control strain (BY4742). Puf3p target mRNAs (see Online Methods) are colored green; non-targets are grey. c) Plot of the number of Tagged RNAs detected for the 476 Puf3p targets in two biological replicates. Spearman’s correlation coefficient (ρ) is indicated (ρ = 0.93, P = 0, n = 476). d) Proportional Venn diagram depicting the overlap between Puf3p targets identified by RNA Tagging versus those identified by other approaches15,25. e) Plot of selected Go Term enrichments (1/P-value) of Puf3p targets identified by RNA Tagging, RIP-chip15, and PAR-CLIP25. For simplicity, only 3 biological process terms are shown (see 1 for complete lists). f) Enriched sequence motifs, determined by MEME, in the 3′ UTRs Supplementary Data of Puf3p targets identified by RNA Tagging and RIP-chip15, and in the PAR-CLIP peaks25. The numbers indicate the fraction of 3′ UTRs in each set that contributed to the motif.
As assessed by RNA Tagging, Puf3p bound hundreds of RNAs in vivo. Of the RNAs detected with 3′ uridines in the PUF3-PUP strain, 476 mRNAs were enriched above background in two biological replicates and were termed “Puf3p targets” (see Online Methods) (Fig. 2b). The number of TRPM detected for each Puf3p target was highly reproducible (ρ = 0.93, P = 0) (Fig. 2c). TRPM was moderately correlated with the mean U-tag length (ρ = 0.5, P = 0) and not correlated with RNA abundance (Supplementary Fig. 3a,b). The number of U’s in the U-tag was weakly and inversely correlated with RNA abundance (ρ = −0.37, P = 0) (Supplementary Fig. 3c). The set of RNA Tagging targets significantly overlapped with those identified by RIP-chip15 and PAR-CLIP25 (hypergeometric tests, all P < 2.2 × 10⁻¹⁶) (Fig. 2d). Furthermore, Gene Ontology (GO) analyses revealed that Puf3p targets were greatly enriched for mitochondrial functions, similar to the previously identified targets (Fig. 2e).
Puf3p targets identified by RNA Tagging were highly enriched for Puf3p-binding elements. Using the unbiased algorithm Multiple Em for Motif Elicitation (MEME)26, we determined that Puf3p targets identified by RNA Tagging were highly enriched for Puf3-binding elements in their 3′ UTRs (Fig. 2f). Importantly, Puf3p tagged approximately 70% (170/246) of mRNAs with the consensus sequence CHUGUAHAUA in their 3′ UTRs, which represents the highest-affinity Puf3p-binding elements16. The binding element present in targets identified by RNA Tagging was similar to the one identified in the RIP-chip targets, while the PAR-CLIP targets yielded a more degenerate element (Fig. 2f and Supplementary Fig. 4).
The above data demonstrate that RNA Tagging globally identifies protein-RNA interactions in vivo. The approach reproducibly identified over four hundred mRNAs bound by Puf3p in the cell, and these were highly enriched for the expected mitochondrial functions and Puf3p-binding elements.
RNA Tagging and binding affinity
We hypothesized that RNA Tagging might reveal the relative affinities of Puf3p for its different targets in the cell. For example, high-affinity targets would have relatively long interactions with PUF3-PUP, providing ample time for long U-tags to be added to the RNA. In contrast, low-affinity targets would have relatively brief interactions with PUF3-PUP, resulting in shorter U-tags.
To test this hypothesis, we employed a two-dimensional ranking of Puf3p targets uniquely enabled by the RNA Tagging approach. Targets have two attributes – the number of Tagged RNAs detected and the number of U’s added. Based on these two parameters, we hierarchically clustered Puf3p targets by the number of Tagged RNAs detected at increasing U-tag lengths. Clustering results were visualized by a heat map, with the highest ranked target at the top (Fig. 3a). As expected, target rank was strongly correlated to TRPM (ρ = −0.91, P = 0) and U-tag length (ρ = −0.75, P = 0) (Supplementary Fig. 5a,b). Target rank was largely uncorrelated with RNA abundance (Supplementary Fig. 5c).
Figure 3.

Puf3p target classes correlated with in vitro binding affinity and in vivo regulation. a) Heat map of clustered Puf3p targets, with Classes A (92 targets), B (189), and C (195) indicated. Each row in the heat map is an individual Puf3p target, and the colors indicate the number of TRPM detected with U-tags of at least the indicated number of uridines (columns). The highest ranked target is at the top of the heat map, and the lowest ranked target is at the bottom. The binding elements enriched in each of the Puf3p target classes are indicated. TRPM, Tagged RNAs per million uniquely mapped reads. PBE, Puf3p-binding element. b) Plot of the median rank of Puf3p targets that contain six distinct binding elements relative to the published in vitro binding affinity (Kd) of purified Puf3p for the same sequences16. Pearson’s (r) and Spearman’s (ρ) correlation coefficients and associated P-values (P) are indicated (r = 0.98, P = 0.0009; ρ = 0.94, P = 0.0048; n = 6). c) Enrichment of Puf3p target classes for mRNAs and proteins localized to mitochondria. Mitochondria-localized mRNAs and proteins were obtained from published experiments18,32. d–f) Empirical cumulative distributions were plotted for all Puf3p targets (top) and the three Puf3p target classes (middle) relative to all mRNAs for the following attributes: enrichment for mRNAs bound by ribosomes at mitochondria33 (all mRNAs, n = 6,094; Class A, n = 92; Class B, n = 189; Class C, n = 194) (d), as well as change in mRNA abundance34 (all mRNAs, n = 4,305; Class A, n = 85; Class B, n = 151; Class C, n = 130) (e) and stability34 (all mRNAs, n = 4,228; Class A, n = 84; Class B, n = 150; Class C, n = 128) (f) in puf3Δ relative to wild-type. The P-values from Kolmogorov-Smirnov (KS) tests comparing the different distributions are indicated (bottom).
Puf3p targets are a continuum, but to facilitate downstream analyses, we separated them into three distinct groups, referred to as classes. Puf3p target classes were defined using the dendrogram from the clustering analysis and sequential statistical analyses (see Online Methods). Class A Puf3p targets, which consist of the highest ranked genes, had the most TRPM detected and the longest U-tags (Fig. 3a). They possessed nearly perfect Puf3p-binding elements in their 3′ UTRs (Fig. 3a), dramatically exemplified by the cytosine enrichment at the −2 position, which enhances Puf3p binding in vitro and PUF3-dependent regulation in vivo16,27. In contrast, Class C was the lowest ranked group, and these targets had the least TRPM and shortest U-tags. Class C targets contained degenerate binding elements in their 3′ UTRs (Fig. 3a) and were expressed more highly than Class A or B targets (Supplementary Fig. 6a). They also lacked enriched Puf3p-binding elements in their 5′ UTRs or open reading frames, which agrees well with the propensity of PUF proteins to bind 3′ UTRs15,22,28,29. The average position of the binding elements in the 3′ UTRs of targets was nearly identical across classes (Supplementary Fig. 6b,c). Similarly, the number of Tagged RNAs and the number of U’s detected on target RNAs were uncorrelated with the distance from the binding element to the 3′ terminus of the transcripts (Supplementary Fig. 6d,e).
The rank of targets correlated well with their measured binding affinities in vitro. We compared the median RNA Tagging rank of targets with six specific binding elements to the in vitro binding affinities of purified Puf3p for those same sequences16 (Supplementary Fig. 7a). Median target rank correlated well with Kd (r = 0.98, P = 0.0009; ρ = 0.94, P = 0.0048) (Fig. 3b). Similarly, Kd was correlated with TRPM and U-tag length (Supplementary Fig. 7b,c). Comparisons of Kd to RNA abundance and the distances from binding elements to 3′ termini or stop codons yielded no significant correlations. Randomized data also yielded no significant correlations for any of the above analyses.
These findings support the hypothesis that RNA Tagging reveals high- and low-affinity targets in vivo. This is demonstrated by the co-variation of target rank (and hence classes) with the quality of Puf3p-binding elements and with binding affinity measured in vitro.
RNA Tagging distinguished regulation from “sampling”
We next examined the relationship between affinity and in vivo regulation. Puf3p is required for localization of specific mRNAs to mitochondria18,19 and regulates mitochondrial function20,21. Puf3p also destabilizes some of its target mRNAs16,17,27,30,31. We hypothesized that Class A Puf3p targets, which were the best detected RNA Tagging targets and bound with the highest affinities, would exhibit the greatest enrichment for mitochondrial association as well as PUF3-dependent stability, while Class C targets would exhibit the least.
Puf3p target classes correlated with localized translation at mitochondria. We mined published data that identified mRNAs18 and proteins32 localized to mitochondria. Class A Puf3p targets were significantly enriched for mRNAs and proteins localized to mitochondria (hypergeometric tests, all P < 2.2 × 10⁻¹⁶) (Fig. 3c). Enrichments steadily decreased from Class A to Class C targets. We also mined recently published data that identified mRNAs translated by ribosomes localized to the outer mitochondrial surface, captured through proximity-specific ribosome profiling33. Puf3p targets were significantly enriched for mRNAs translated at mitochondria (Kolmogorov-Smirnov tests, all P < 2.2 × 10⁻¹⁶) (Fig. 3d). Notably, Classes A and B were highly enriched while Class C was weakly enriched. Trends were similar without the translation inhibitor cycloheximide, which confirmed that Puf3p targets are actively translated at mitochondria (Supplementary Fig. 8).
Puf3p target classes correlated with sensitivity to deletion of PUF3. We next mined published microarray experiments that measured global changes in mRNA abundance and decay rate in wild-type and puf3Δ strains34. Puf3p targets identified by RNA Tagging were significantly more abundant and more stable in the puf3Δ strain relative to all mRNAs (Kolmogorov-Smirnov tests, all P < 2.2 × 10⁻¹⁶) (Fig. 3e,f). Enrichments for both abundance and stability progressively decreased across Puf3p target classes, with Class A targets exhibiting the greatest effects. Importantly, Class C targets were hardly enriched for the effects of PUF3 on either their abundance or stability. All specific mRNAs previously shown to be stabilized in a puf3Δ strain were Class A or B targets, which independently corroborated our meta-analysis of the global experiments27 (Supplementary Fig. 9).
The correlation between Puf3p target classes and known Puf3p biological functions, as well as with binding affinity, suggests that the highest ranked Puf3p RNA Tagging targets are those that are bound and regulated in vivo. In contrast, the lowest ranked targets are bound very weakly. The fact that these RNAs (Class C) were tagged indicates they were bound; yet, they were largely unregulated. We refer to this behavior as “sampling.” We define the term “sampling” to mean that the protein bound to RNA sufficiently long to tag it, but insufficiently long to exert its regulatory effect – likely too brief to recruit effector proteins or allow them to act. On average, the RNAs that are sampled are more abundant, which may help drive their interaction in vivo.
RNA Tagging identified global Bfr1p targets
We next implemented RNA Tagging to analyze Bfr1p, which lacks canonical RNA-binding domains. Bfr1p is implicated in the secretory pathway35,36 and is localized to the endoplasmic reticulum (ER) under normal conditions37,38 and P-bodies after stress39. Bfr1p was also found associated with over a thousand mRNAs by RIP-chip29. Intriguingly, its reported mRNA targets were not enriched for those with a role in the secretory pathway.
RNA Tagging with BFR1-PUP identified more than a thousand functionally enriched Tagged RNAs. As with Puf3p, Tagged RNAs were highly enriched over many U-tag lengths (Fig. 4a). In the BFR1-PUP strain, 1,296 mRNAs and two snoRNAs (snR11 and snR31) were detected above background in three biological replicates and were termed “Bfr1p targets” (see Online Methods) (Fig. 4b). TRPMs were reproducibly detected across replicates (all pair-wise ρ ≥ 0.84) (Fig. 4c). TRPM, U-tag length, and RNA abundance were all largely uncorrelated (Supplementary Fig. 10). Approximately 30% of the targets were previously identified by RIP-chip29, which represents a significant overlap (hypergeometric test, P < 2.2 × 10⁻¹⁶) (Fig. 4d). Unlike Puf3p, Bfr1p targets identified by RNA Tagging lacked a defined binding element.
Figure 4.
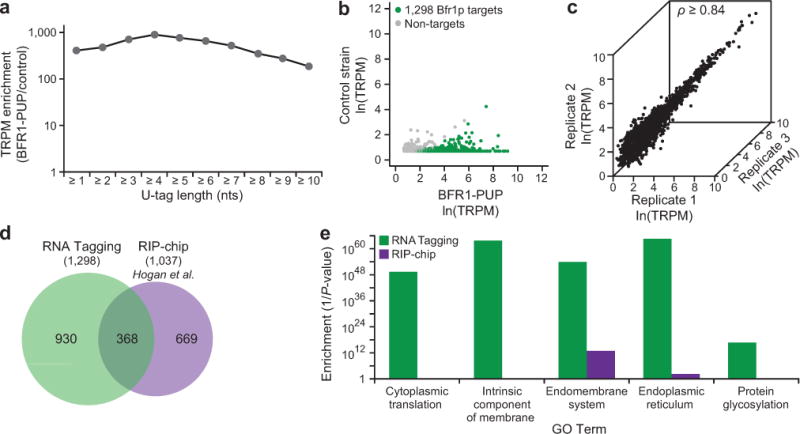
RNA Tagging identified transcriptome-wide Bfr1p targets. a) Enrichment of Tagged RNAs detected across different length U-tags in BFR1-PUP yeast relative to a control yeast strain (BY4742). Enrichment was calculated as a ratio of TRPMs obtained in strains with and without the BFR1-PUP chimera. TRPM, Tagged RNAs per million uniquely mapped reads. b) Tagged RNAs detected in the BFR1-PUP strain relative to the control strain (BY4742). Bfr1p target mRNAs (see Online Methods) are colored green while non-targets are grey. c) The number of Tagged RNAs detected for the 1,298 Bfr1p targets in three biological replicates. Spearman’s correlation coefficient (ρ) is indicated (all pair-wise ρ ≥ 0.84, P = 0, n = 1,298). d) Proportional Venn diagram depicting the overlap between Bfr1p targets identified by RNA Tagging versus published RIP-chip targets29. e) Selected Go Term enrichments (1/P-value) of Bfr1p targets identified by RNA Tagging and RIP-chip (see Supplementary Data 2 for complete lists).
As determined by GO analyses, RNA Tagging targets were much more functionally enriched than those identified by RIP-chip. RNA Tagging targets were greatly enriched for cytoplasmic translation and membrane-associated functions while RIP-chip targets were at most weakly enriched (Fig. 4e). Deeper dissection revealed that targets uniquely identified by RNA Tagging, as well as those identified by both RNA Tagging and RIP-chip, were similarly enriched for membrane-associated functions and the term “cytoplasmic translation”, which predominately encompasses ribosomal proteins (Supplementary Fig. 11). In contrast, mRNAs uniquely identified by RIP-chip were enriched for ribosome biogenesis and the processing of ncRNAs.
Bfr1p binds mRNAs translated at the ER
To more closely examine Bfr1p targets, we performed a two-dimensional analysis with Bfr1p targets as we had with Puf3p. Bfr1p targets were grouped into four classes, Classes A to D, with Class A again containing the highest ranked targets (Fig. 5a). Target rank was strongly correlated with TRPM (ρ = −0.87, P = 0), while target rank was weakly correlated with the average number of U’s in the U-tag and RNA abundance (Supplementary Fig. 12). The weak correlation between target rank and the number of U’s in the U-tag indicated that in this case, unlike that of Puf3p, target rank was driven by TRPM.
Figure 5.

Bfr1p target classes correlated with membrane functions. a) Heat map of clustered Bfr1p targets, with Classes A (174 targets), B (297), C (566), and D (261) indicated. Each row in the heat map is an individual Bfr1p target, and the colors indicate the number of TRPM detected with U-tags of at least the indicated number of uridines (columns). The highest ranked target is at the top of the heat map, and the lowest ranked target is at the bottom. TRPM, Tagged RNAs per million uniquely mapped reads. (b–e) Enrichments of Bfr1p target classes for mRNAs encoding proteins found in the secretome40 (b), with predicted transmembrane domains (TMD) (c), localized to the endoplasmic reticulum32 (ER) (d), and mRNAs found in P-bodies41 (e). The grey, dotted line represents the enrichment of all mRNAs for the given attribute. (f–h) Empirical cumulative distributions were plotted for the indicated target sets (top) and the four Bfr1p target classes (middle) relative to all mRNAs for the following attributes: enrichment for mRNAs bound by ribosomes generally at the ER (all mRNAs, n = 5,935; Class A, n = 173; Class B, n = 296; Class C, n = 561; Class D, n = 261) (log2(ubc6.7mchx enrichment)) (f), at the SEC complex (all mRNAs, n = 5,974; Class A, n = 174; Class B, n = 297; Class C, n = 560; Class D, n = 261) (log2(sec63.7mchx enrichment)) (g), and at the SSH1 translocon complex (all mRNAs, n = 5,785; Class A, n = 174; Class B, n = 297; Class C, n = 561; Class D, n = 260) (log2(ssh1.heh2.7mchx enrichment)) (h), obtained from published ER-specific ribosome profiling (RP) experiments42. The P-values from Kolmogorov-Smirnov (KS) tests comparing the different distributions are indicated (bottom).
The highest ranked Bfr1p targets were the most enriched for membrane-related functions. By mining published data, we found that Class A targets were significantly enriched for proteins that are secreted40, predicted to have a transmembrane domain, and localized to the ER32 (hypergeometric tests, all P < 2.2 ×10⁻¹⁶) (Fig. 5b–d). Enrichments progressively decreased from Class A to Class D targets. Furthermore, Class A Bfr1p targets were the least enriched for mRNAs that encode proteins localized to the nucleus, nucleolus, and mitochondria32 (Supplementary Fig. 13). These enrichments progressively increased across classes to levels near those expected by random chance. Bfr1p targets were also highly enriched for mRNAs found in P-bodies41 (hypergeometric test, P < 2.2 × 10⁻¹⁶) (Fig. 5e). The enrichment progressively decreased from Class A to Class C targets, but then slightly increased for Class D targets.
The localization of Bfr1p to the ER37,38, its presence on polysomes37, and the enrichment of its best targets for membrane-related proteins suggested that many of its targets would be translated at the ER. To test this, we mined recently published data that identified ribosome-occupied mRNAs specifically localized at the ER, captured by a proximity-specific ribosome profiling experiment42.
Bfr1p targets were highly enriched for abundant, ER-translated mRNAs. In comparison to all mRNAs, Bfr1p targets were significantly enriched for ER-localized translation, in contrast to Bfr1p targets identified by RIP-chip (Kolmogorov-Smirnov tests, all P < 2.2 × 10⁻¹⁶) (Fig. 5f). The enrichment of ER-localized translation progressively decreased from Class A to Class D targets. Bfr1p targets were similarly enriched for both SEC complex-dependent and SEC complex-independent translocation events (Kolmogorov-Smirnov tests, all P < 2.2 × 10⁻¹⁶) (Fig. 5g,h). Class A Bfr1p targets were also most enriched for abundant mRNAs, and the enrichment progressively decreased across classes (Supplementary Fig. 14). Bfr1p bound about 60% of the approximately 700 mRNAs enriched for ER-localized translation, and the Bfr1p-bound mRNAs were significantly more abundant than those not bound by Bfr1p (Fisher-Pitman permutation test, P < 10−6) (Supplementary Fig. 15).
Our findings illustrate that Bfr1p preferentially binds mRNAs that encode ribosomal and membrane-associated proteins, many of which are translated at the ER. These data clarify seemingly contradictory reports of Bfr1p function in vivo (see Discussion).
DISCUSSION
RNA Tagging identifies targets of RNA-binding proteins in vivo, relying solely on the covalent marks left on the RNA. The approach is facile, reproducible, and sensitive. Furthermore, RNA Tagging distinguishes between productive and non-productive binding events in vivo since the number of uridines added by the poly(U) polymerase likely is a direct reflection of the time the protein is bound to the RNA. In organisms with endogenous enzymes that add and remove uridines, endogenous uridylated mRNAs are sufficiently stable to be detected43–46 and can be accounted for computationally using the same approach as described here. RNA Tagging is adaptable to specific cell types and tissues of living animals, as it requires minimal starting material and only purified RNA.
RNA Tagging can provide insight into the biological roles of RNA-binding proteins. Bfr1p predominately tagged mRNAs that encode ribosomal and membrane-associated proteins, enrichments missed in earlier RIP-chip studies. Additionally, Bfr1p is part of a large protein complex37 and is required for the localization of mRNAs to P-bodies39 and the bud tip36. Thus our findings and previous studies suggest that Bfr1p is an integral component of a trafficking complex that localizes mRNAs to specific locations in the cell, particularly the ER.
RNA Tagging should facilitate access to areas of RNA biology that until now were difficult to examine. For example, it may be possible to detect RNAs both directly and indirectly associated with a protein of interest, aided by using a poly(U) polymerase with its own intrinsic but weak RNA-binding activity13. Large protein complexes often contain critical factors that only indirectly associate with RNA, such as several eukaryotic translation initiation factors or components of the CCR4-NOT complex47,48. The dynamics of RNA-protein interactions may be analyzed through rapid induction of the tagging protein, providing snapshots of the interactions at a given time. The development of new tagging enzymes that deposit different marks would enable multiple proteins of interest to be probed simultaneously, providing valuable insight into the exchanges of proteins on RNAs, how RNA-binding proteins collaborate to regulate RNA, and the encounters of single RNA molecules in the cell. It remains to be seen whether PUP fusions bound to elements in the 5′UTR will tag efficiently; flexible protein linkers or PUPs that possess higher rates of catalysis may be useful in this regard. Regardless, the versatility of RNA Tagging should enable approaches to unexplored problems in RNA biology in living cells.
ONLINE METHODS
Yeast Strains
All Saccharomyces cerevisiae strains were constructed in BY4742 yeast (MATα; his3Δ1; leu2Δ0; lys2Δ0; ura3Δ0). To construct RNA Tagging chimeras, the DNA sequence for the open reading frame (ORF) of Caenorhabditis elegans pup-2 followed by a stop codon and the URA3 marker, including its native promoter and terminator sequences, was inserted in-frame at the 3′ end of PUF3 and BFR1 using standard yeast transformation techniques. The BFR1-PUP2 strains also contained a 3-HA epitope tag on the C-terminus of the fusion protein. Catalytically inactive PUP2 strains (PUP2mut strains) had Asp185Ala and Asp187Ala substitutions in the PUP-2 protein. For wild-type and mutant PHD1 strains, the endogenous 3′ UTR of PHD1 was replaced with URA3 using standard yeast transformation techniques. Next, single colonies were transformed with DNA that encoded an RGSH6 epitope tag fused to the C-terminus of Phd1p, and either the wild-type or mutant PHD1 3′ UTRs, which had substitutions that disrupted known Puf5p-binding elements (UGUAGUUA to ACAAGUUA, and UGUAACAUUA to ACAAACAUUA). Cells were selected on 5-FOA containing plates. Integration of the epitope tag and 3′ UTRs at the endogenous PHD1 locus was confirmed by sequencing. The pup-2 ORF and a 3-HA epitope tag were then inserted in-frame at the 3′ end of PUF5 as above in both the wild-type and mutant PHD1 strains.
Yeast growth and total RNA Isolation
All strains were grown by inoculating 5 mL YPAD cultures with the indicated frozen yeast strains or freshly streaked colonies, and incubating at 30°C and 180 rpm. After ~ 24 hours, 25 mL YPAD cultures were seeded at A660 ~0.0002 and grown at 30°C and 180 rpm until A660 0.5–0.8. Yeast were harvested by centrifugation for 10 minutes at 3,000 rpm at 4°C, and the pellets were washed once with 40 mL of ice-cold water. Cells were resuspended in 500 μL RNA ISO Buffer (0.2M Tris-HCl pH 7.5, 0.5M NaCl, 0.01M EDTA, 1% SDS). Then, ~200 μL of acid washed beads and 500 μL of Phenol:Chloroform:Isoamyl alcohol (25:24:1) (PCA) were added. Cells were lysed by vortexing for 20 sec followed by 20 sec on ice ten times. Samples were then separated from the beads, split evenly into two tubes, and 375 μL of RNA ISO Buffer and 375 μL of PCA were added to each tube. Samples were mixed by gently shaking and were separated by centrifugation for 15 minutes at 15,000 rpm at 4°C. The aqueous layer was removed (~500 μL) and further extracted by two additional extractions (PCA followed by chloroform). Following the extractions, the aqueous layer was removed and ~1 mL of 100% ethanol was added to the samples, which were gently mixed and incubated at −50°C for > 1 hour. Total RNA was pelleted by centrifugation for 30 minutes at 15,000 rpm at 4°C. Pellets were washed 1X with ~70% ethanol, and resuspended in 43 μL of water. Separate tubes for each sample were then recombined, and treated with 8 Units of TURBO DNase (Life Technologies) for 1 hour at 37°C. Total RNA was purified using the GeneJet RNA Purification kit (Thermo Fisher Scientific) and eluted in 30 μL of water. RNA samples were stored at −80°C.
Targeted RNA Tagging RT-PCR assays
Terminator treatment
To deplete rRNA, 2 μg of total RNA were treated with 2 Units of Terminator enzyme (Epicentre) for 60 minutes at 30°C. The reactions were subsequently purified using 1.8 volumes of room temperature RNA Clean XP beads (Agencourt) and the standard protocol. rRNA-depleted RNA was eluted in 12 μL of water.
G/I-tailing
Terminator-treated samples were G/I-tailed by using 1,200 Units of yeast poly(A) polymerase (PAP) (Affymetrix), 0.5 mM GTP, 0.15 mM ITP, and incubated at 37°C for 90 minutes. Samples were diluted to 100 μL with water and G/I-tailed RNA was extracted with two sequential organic extractions (PCA followed by chloroform). The final aqueous layer was removed, and 10 μL of 3 M sodium acetate, 1 μL of GlycoBlue (Life Technologies), and 600 μL of 100% ethanol were added to the samples. Samples were incubated at −50°C for > 1 hour. Samples were pelleted by centrifugation for 30 minutes at 15,000 rpm at 4°C. Pellets were washed once in ~70% ethanol, and resuspended in 10 μL of water.
Selective reverse transcription
G/I-tailed samples were selectively reverse transcribed using SuperScript III reverse transcriptase (Invitrogen) under nearly standard conditions. The G/I-tailed samples were split equally (typically 3 μL) across all RT reactions. 3 μL of samples were added to 1 μL of 1 μM U-select primer (GCCTTGGCACCCGAGAATTCCACCCCCCCCCAAA), 1 μL of 10 mM dNTP mix, and 8 μL of water (13 μL total). Oligo-(dT) and –RT reactions used 1 μL of 1 μM oligo-(dT)42 (TTTTTTTTTTTTTTTTTTTTTTTTTTTTTTTTTTTTTTTTTT) in place of the U-select primer. A master mix of 4 μL of 5X reaction buffer, 1 μL of 100 mM DTT and 1 μL of 40 U per μL RNase Inhibitor per reaction was prepared separately. The primer-RNA mixes and the master mix were incubated at 65°C for 5 minutes followed by 5 minutes at 50°C in a thermocycler. With the primer-RNA mixes and the master mix still in the 50°C thermocycler, RT enzyme was added to the master mix (except for –RT samples), mixed thoroughly, and 7 μL of the resulting master mix was added to the primer-RNA mix. Samples were then incubated at 50°C for 60 minutes followed by 5 minutes at 85°C.
Polymerase chain reactions
1 μL of cDNA straight from the RT reactions was PCR amplified using GoTaq Polymerase (Promega). The HSP10 specific forward primer was: GACAGCATCCGGGTTGTATT. The HSP10 specific reverse primer was: ttttcctgtcatacataatggcc. HSP10 primers and the U-select primer were used at final concentrations of ~1 μM and ~40 nM, respectively. The COX17 specific forward primer was ATGACTGAAACTGACAAGAAAC when used with the U-select primer. The internal COX17 primers were: ACAAGAACAAGAAAACCACGC and AAGATGCATGTATCCCGCTC. All COX17 reactions were performed with final primer concentrations of ~40 nM. PCR parameters and steps were as follows: 1) 95°C for 3 min, 2) 95°C for 30 sec, 3) 50°C for 30 sec, 4) 72°C for 90 sec, 5) repeat steps 2–4 24 times (HSP10) or 36 times (COX17), 6) 72°C for 5 min, and 7) hold at 4°C.
Cloning and Sanger sequencing
HSP10 PCR products were cloned using the TOPO-TA Cloning kit (Life Technologies), standard reaction congditions, and blue-white colony screening. Individual white colonies were grown in 5 mL of lysogeny broth (LB)-ampicillin media. Plasmids were isolated from saturated cultures using the GeneJET Plasmid Miniprep kit (Thermo Scientific (Fermentas)) and subsequently Sanger sequenced using standard reaction conditions.
Transcriptome-wide RNA Tagging library preparations
Poly(A) selection and rRNA depletion
Approximately 75 μg of high-quality total RNA were poly(A) selected using the Dynabeads mRNA Purification kit (Life Technologies) and the standard protocol. Samples were eluted in 28 μL of water. The poly(A)-selected RNA was then depleted of rRNA using the RiboZeroGold (yeast) kit (Epicentre) and the standard protocol. Samples were eluted in 12 μL of water.
G/I-tailing
Samples were G/I-tailed as above, except for the following step. After the initial 90 minute G/I-tailing reaction, an additional 1,200 Units of yeast PAP was added to the reactions and incubated for an additional 30 minutes at 37°C. G/I-tailed RNA was purified as above using PCA.
Selective reverse transcription and RNase H digestion
G/I-tailed samples were selectively reverse transcribed as above. cDNAs were digested with 1 μL of RNaseH (Invitrogen) for 20 minutes at 37°C. cDNAs were purified using the GeneJet PCR Purification kit (Thermo Fisher Scientific). cDNAs were eluted twice in 32 μL of water giving a total of ~60 μL cDNA.
Second strand synthesis
60 μL of cDNA was added to 10 μL of 10X Klenow Buffer (500 mM Tris-HCl pH 7.5, 100 mM MgCL2, 10 mM DTT, 0.5 mg per mL BSA), 12 μL of water, 5 μL of 10 mM dNTPs, 10 μL of 10 μM 2nd strand synthesis primer (GTTCAGAGTTCTACAGTCCGACGATCNNNNNN), and 3 μL of 5 U per μL Exo- Klenow DNA Polymerase (Life Technologies). Reactions were incubated at 37°C for 30 minutes, and then purified twice using RNA Clean XP beads (Agencourt) at a 1:1 (bead:reaction) ratio. dsDNA was eluted in 50 μL of water.
Polymerase chain reactions
Samples were PCR amplified using GoTaq polymerase (Promega). 5 μL of cDNA was added to 8.33 μL of 2× GoTaqGreen master mix, 2 μL of water, 0.67 μL of 10 μM RP1 primer (AATGATACGGCGACCACCGAGATCTACACGTTCAGAGTTCTACAGTCCGA), and 0.67 μL of 10 μM barcoded primer (CAAGCAGAAGACGGCATACGAGATXXXXXXGTGACTGGAGTTCCTTGGCACCCGAGAATTCCA). Standard Illumina barcodes were inserted at the XXXXXX position in the primer. The PCR cycle was: 1) 94°C for 2 min, 2) 94°C for 10 sec, 3) 40°C for 2 min, 4) 72°C for 1 min, 5) Repeat 2–4 once, 6) 94°C for 10 sec, 7) 55°C for 30 sec 8) 72°C for 1 min, 9) Repeat 6–8 7×, 10) 94°C for 15 sec, 11) 55°C for 30 sec, 12) 72°C for 1 min, 13) Repeat 10–12 14 times, 14) 72°C for 5 min, 15) Hold at 4°C. To scale up, ~9 individual reactions were completed for each sample and were pooled prior to cleanup. PCR samples were size-selected twice using the RNA Clean XP beads at a 0.8:1 (bead:reaction) ratio. Samples were eluted in ~ 20 μL of water.
Synthetic U-tag libraries
Preparation
Synthesized oligos were purchased (Integrated DNA Technologies) and their sequences were: CCTTGGCACCCGAGAATTCCACCCCCCCCCAAA(A)TTTTTTTTTTTTGATCGTCGGACTGTAGAACTCTGAAC. At the (A) 0,2,4,6,8,10, and 12 adenosines were inserted to create various length U-tag standards. Synthetic libraries were amplified using GoTaq polymerase, 0.8 μM RP1 oligo, 0.8 μM barcoded primer, and 2 nM of oligo as template. Otherwise, the PCR conditions were the same as for the transcriptome-wide library preparations. Completed reactions were run on a 6% acrylamide TBE-Urea gel, and the bands corresponding to the libraries were excised from the gel (~180 bps). The gel slices were crushed in 200 μL of water, flash frozen, incubated at 37°C and 1,000 rpm for 1 hour, flash frozen again, incubated at 37°C and 1,000 rpm for 1 hour, and separated using a filter column. The libraries were ethanol precipitated with GlycoBlue as the co-precipitant. Pellets were washed once in 70% ethanol and resuspended in 10–20 μL of water.
Analysis
Raw FASTQ files of the sequenced libraries were analyzed two different ways. First, the number of uridines in the U-tag of every read in each of the libraries was determined. Using this data, the mean U-tag length (in nucleotides) and associated standard deviation was calculated for each of the synthetic libraries. Second, the base composition at each position for every read in the libraries was determined. These calculations were then used to determine how often a single uridine residue was detected in the A0 library (no U-tag encoded in the synthesized oligo), which served as the background rate referenced below.
High-throughput sequencing
Samples were sequenced on an Illumina HiSeq 2500 instrument to obtain 50 base pair paired-end read data sets. Throughout, the first sequencing read, which covers the 5′ end of the sequenced DNA fragment, is termed “Read 1”, and the second sequencing read, which covers the 3′ end of the sequenced DNA fragment, is termed “Read 2”. Raw data was deposited at the NCBI Sequence Read Archive (accession: SRP063022).
FASTQ file manipulations and alignments
Read 1
All FASTQ processing (FASTX-toolkit, http://hannonlab.cshl.edu/fastx_toolkit/) and alignments to the yeast genome were done using local installations of the given software. The U-select primer sequence (TTTGGGGGGGGGTGGAATTCTCGGGTGCCAAGG) and the poly(A) tail sequence (AAAAAAAAAA) were removed from Read 1’s using FASTA/Q Clipper [fastx_clipper -a sequence -l 15 -n -I -v input -o output -Q 34]. Any Read 1’s that were shorter than 15 nucleotides after removal of either sequence were discarded. Reads 1’s were then aligned to the S. cerevisiae genome (version R64-1-1) using bowtie49 with the following parameters: a seed length (-l) of 25 nucleotides, no more than 2 mismatches (-n), and only a single reportable alignment (-m) in the genome [bowtie -t genome input output -l 25 -m 1 -S –sam -p 3 -n 2]. Reads that aligned to more than one location were discarded.
Read 2
The 5′ adapter sequence (GATCGTCGGACTGTAGAACTCTGAAC) was removed from Read 2’s using FASTA/Q Clipper and the same parameters as above. The last six nucleotides of the resulting Read 2’s, which represent the random hexamer sequence from the 2nd strand synthesis step, were then removed using FASTA/Q Trimmer [fastx_trimmer -t 6 -i input -o output -Q 34]. The resulting Read 2’s were reverse complemented using FASTA/Q Reverse Complement [fastx_reverse_complement -i input -o output -Q 34] and any sequence corresponding to the U-select primer sequence was removed as above. Sequences with at least 3 adenosines followed any number of uridines at their 3′ end (A-U tail sequences) were identified using regular expression searches in Perl. Read 2’s were aligned twice to the yeast genome: first without any A-U tail sequence and then with any A-U tail sequence. This alignment process identified Read 2’s with A-U tail sequences that were not encoded in the genome. Bowtie alignments were conducted essentially as above, except that the seed length was 20 nucleotides and the –v alignment mode was used to exclude reads with 3 or more mismatches.
Definition of Tagged RNAs
A Tagged RNA was defined as a DNA fragment with sequence that aligned uniquely to the yeast genome and contained at least 8 adenosines followed by at least 1 uridine at their 3′ end that were not encoded by any adapter sequence or the genome. Typically, Read 1 identified the genomic location of a Tagged RNA while Read 2 identified its A-U tail sequence. Read 2 also frequently determined the 3′ terminus of an RNA. The number of Tagged RNAs per gene was calculated and normalized across samples (TRPM, Tagged RNAs per million uniquely mapped reads).
Reproducible RNA Tagging targets
In order to be identified as a target, genes with Tagged RNAs had to pass three criteria. First, the number of TRPMs detected for a particular gene must be at least 10-fold greater than the number of TRPMs detected for that gene in the non-tagging control sample. Second, the number of TRPMs detected for a particular gene must be greater than the error rate for falsely detecting Tagged RNAs. A uridine was erroneously detected 3% of the time on a synthetic polyadenylated library without a U-tag (Supplementary Fig. 2b) (see above for synthetic libraries). Thus, the error rate was defined as the number of TRPM detected by error per gene [0.03*(total # of TRPM)/(total # of genes with TRPM)]. Third, a gene must have passed both of the above criteria in all of the biological replicates. See Supplementary Data 3 and 4 for comprehensive target lists of Puf3p and Bfr1p, respectively. See Supplementary Data 5 for sequencing results of a control strain (BY4742) without any tagging chimeras.
Hierarchical clustering
Tagged RNAs per million uniquely mapped reads (TRPM) for each target were calculated across U-tag lengths of 1–10 uridines for each sample. TRPMs for biological replicates were then averaged (mean). Each U-tag length encompassed all TRPMs with at least the indicated number of uridines. Prior to clustering, the data was sorted from most to least TRPMs detected with at least 1 U in the U-tag. The data sets were log2-transformed and hierarchically clustered using the Gene Cluster 3.0 software. Heat maps were generated in Matlab (version R2014a).
Definition of target classes
To begin, classes were loosely defined to encompass groups of targets with similar TRPM and U-tag length profiles. Boundaries between putative target classes were defined by the dendrogram from the clustering analysis. Statistical analyses (as outlined below) were conducted on each putative class, sequentially from the highest ranked class to the lowest ranked class, to determine if it was distinct from directly adjacent putative classes. As an example, the enrichment of putative Class A targets for a given observation (e.g. RNAs with increased abundance in ΔPUF3) was compared to the enrichment in putative Class B targets. If the enrichments of putative Class A and B targets were statistically indistinguishable, they were combined and the analysis was repeated with the next adjacent putative class (Class C). If the enrichments of putative Class A and B targets were statistically different, putative Class A targets were defined as actual Class A targets, and the process was repeated with the remaining putative classes until only distinct classes remained.
Statistical analyses
All statistical analyses were done using RStudio (R version 3.1.2). Linear regression analyses were used to obtain R2 values and the associated P-values [summary(lm(y~x))]. Shapiro-Wilk tests [shapiro.test(x)] were used to test normality as needed. Spearman’s (ρ) and Pearson’s (r) correlation coefficients and their associated P-values were determined using the rcorr function from the hmisc package [rcorr(x, y, type=”spearman”) and rcorr(x, y, type=”pearson”), respectively]. Hypergeometric distribution tests [phyper()] were used to determine if the observed overlap between two datasets was significant. The total population size was defined as 6,607 genes, except for the following analyses: mRNA localization to mitochondria (6,256 genes), proteins with predicted transmembrane domains (TMHMM analyses, 6,713 genes), and yeast GFP protein localization (4,156 genes). Cumulative fraction plots were generated using the empirical cumulative distribution function (ecdf) [plot(ecdf(x), do.points=F, verticals=T, lty=1, lwd=3, …)]. Two-sided Kolmogorov-Smirnov tests were performed using the ks.test function [ks.test(x,y)]. For Supplementary Figures 6b–c and 15b, Fisher-Pitman permutation tests and permutations of the Wilcoxon-Mann-Whitney test were conducted using the coin package [pvalue(oneway_test(DV ~ IV, distribution=approximate(B=1000000))) and pvalue(wilcox_test(DV ~ IV, distribution=approximate(B=1000000))), respectively]. Both tests behaved similarly for all comparisons. Where indicated, data was randomized 100,000 times using the sample function.
Venn diagrams
Proportional Venn diagrams were generated using Biovenn50 and then redrawn for publication.
MEME and directed motif searches
To be as inclusive as possible, 3′ UTRs were defined as the longest isoform for a particular gene previously observed51 or, if not previously defined, as 200 bases. MEME26 analyses were done on a local server using the following command [meme.bin input.txt -oc outputdirectory -dna -mod zoops -nmotifs 5 -minw 6 -maxw 15]. The ‘maxsize’ parameter was adjusted as needed. Enriched sequence motifs were identified in the 3′ UTRs of Puf3p targets and indicated subsets using MEME as described above. To determine the binding motif present in each class of Puf3p targets, the binding elements present in each class, as determined using all of the Puf3p targets, were combined to generate the indicated motifs in Figure 3a. Unbiased MEME analyses were conducted as above on each of the classes to identify enriched motifs in the 5′ UTRs, open-reading frames, and 3′ UTRs, which confirmed the findings reported in Figure 3a. The RIP-chip motif was identified in the 3′ UTRs of the previously identified targets using MEME as above. The PAR-CLIP motif was previously identified25 but shortened here for consistency. In all cases, motifs were prepared for publication using WebLogo 352. The total number of genes with the C[AUC]UGUA[AUC]AUA consensus sequence in their 3′ UTR was determined using a Perl regular expression search on all 3′ UTR sequences. Genes with at least one occurrence of the motif were counted as positives.
PBE location in 3′ UTRs
Many 3′ termini of mRNAs were detected in our data, especially when all RNAs that were detected with a poly(A) tail of at least 8 adenosines (with or without a U-tag) were included. Using this information, the most detected isoform for particular mRNAs, the lengths of the 3′ UTRs, and the position of the PBE relative to the stop codon and 3′ termini were determined. Genes with undetected 3′ termini, and genes with negative or very large (>1,000 nucleotides) distances to 3′ termini were excluded from the analyses. For Supplementary Figure 6d&e, the mean number of Tagged RNAs, number of U’s added, and distance from the PBE to the 3′ terminus for isoforms of 64 Puf3p targets (144 distinct mRNAs) detected by at least 31 reads (24,417 reads total) were calculated and compared. In these analyses, Tagged RNAs with U-tags of more than 6 U’s were not analyzed since our deep sequencing did not yield 3′ termini for those mRNAs.
GO analyses
All GO analyses were completed using Yeast Mine from the Saccharomyces Genome Database (yeastmine.yeastgenome.org). All parameters were set to default (Holm-Bonferroni corrected). Puf3p and Bfr1p comprehensive GO Term data are available in Supplementary Data 1 and 2, respectively.
TMHMM prediction
To identify proteins with a predicted transmembrane domain (TMD), the sequences of all proteins (6,713 proteins, including dubious proteins) were downloaded from the Saccharomyces Genome Database. The sequences were then analyzed using the TMHMM 2.0 server53. Proteins with at least 1 predicted TMD were counted as positives.
RNA-seq
RNA isolation
Total RNA was isolated from S. cerevisiae (BY4742) cells using standard methods. 50 ml of cells with A660 0.5–0.8 were collected by centrifugation at 3,200 rpm at 4°C, washed once with cold water, and snap frozen in liquid N2. The tubes were vortexed for 30 seconds then incubated on ice for 30 seconds, which was repeated six times. The supernatant was removed, extracted with 1 mL of PCA, and ethanol precipitated. RNA pellets were resuspended in 50 μL water.
Library preparations
2 μg of RNA were used as input. Samples were depleted of rRNA using the Ribo-Zero Magnetic Gold Kit (Yeast) kit (Epicentre) and the standard protocol. Libraries were prepared using the TruSeq Stranded Total RNA kit (Illumina) and the standard protocol with 12 rounds of PCR. PCR samples were purified twice using RNA Clean XP beads and were eluted in 30 μL water. Libraries were sequenced on an Illumina HiSeq 2000 to get 50 base pair reads.
Data analysis
Mapped reads were assigned to genomic features by HTseq-count [htseq-count -s](version 0.5.4p3). The mean number of fragments per kilobase of exon per million reads mapped (FPKM) of four biological replicates was calculated for each genomic feature (see Supplementary Data 6).
Supplementary Material
Acknowledgments
We thank members of the Wickens lab for helpful comments and suggestions throughout the work, and for their thoughtful discussions of the manuscript. We appreciate discussions with S. Kennedy (Harvard University) and P. Anderson (University of Wisconsin-Madison) and their labs, and the discussions and efforts with E. Grayhack and E. Phizicky (University of Rochester) in early stages of the work. We thank J. Kimble and E. Sorokin (University of Wisconsin-Madison) for use of a computational server, and L. Vanderploeg of the Biochemistry Media Lab for help with the figures. We also thank the University of Wisconsin Biotechnology Center DNA Sequencing Facility, particularly M. Adams and M. Sussman, for high-throughput sequencing facilities and services. The work was supported by the US National Institutes of Health (GM50942), and by Wharton and Biochemistry Scholar Fellowships to C.P.L.
Footnotes
ACCESSION CODES
NCBI Sequence Read Archive accession: SRP063022.
AUTHOR CONTRIBUTIONS
C.P.L. and M.W. conceived of the method and designed the experiments. C.P.L. performed the experiments. C.P.L., D.W., H.A.J.S., and M.W. analyzed the data. C.P.L. and M.W. wrote the manuscript.
COMPETING FINANCIAL INTERESTS
The authors declare competing financial interests. C.P.L. and M.W. have filed a patent that encompasses the RNA Tagging approach.
References
- 1.McHugh CA, Russell P, Guttman M. Methods for comprehensive experimental identification of RNA-protein interactions. Genome biology. 2014;15:203. doi: 10.1186/gb4152. [DOI] [PMC free article] [PubMed] [Google Scholar]
- 2.Tenenbaum SA, Carson CC, Lager PJ, Keene JD. Identifying mRNA subsets in messenger ribonucleoprotein complexes by using cDNA arrays. Proc Natl Acad Sci U S A. 2000;97:14085–14090. doi: 10.1073/pnas.97.26.14085. [DOI] [PMC free article] [PubMed] [Google Scholar]
- 3.Zhao J, et al. Genome-wide identification of polycomb-associated RNAs by RIP-seq. Mol Cell. 2010;40:939–953. doi: 10.1016/j.molcel.2010.12.011. [DOI] [PMC free article] [PubMed] [Google Scholar]
- 4.Ule J, et al. CLIP identifies Nova-regulated RNA networks in the brain. Science. 2003;302:1212–1215. doi: 10.1126/science.1090095. [DOI] [PubMed] [Google Scholar]
- 5.Licatalosi DD, et al. HITS-CLIP yields genome-wide insights into brain alternative RNA processing. Nature. 2008;456:464–469. doi: 10.1038/nature07488. [DOI] [PMC free article] [PubMed] [Google Scholar]
- 6.Hafner M, et al. Transcriptome-wide identification of RNA-binding protein and microRNA target sites by PAR-CLIP. Cell. 2010;141:129–141. doi: 10.1016/j.cell.2010.03.009. [DOI] [PMC free article] [PubMed] [Google Scholar]
- 7.Konig J, et al. iCLIP reveals the function of hnRNP particles in splicing at individual nucleotide resolution. Nat Struct Mol Biol. 2010;17:909–915. doi: 10.1038/nsmb.1838. [DOI] [PMC free article] [PubMed] [Google Scholar]
- 8.Mili S, Steitz JA. Evidence for reassociation of RNA-binding proteins after cell lysis: implications for the interpretation of immunoprecipitation analyses. RNA. 2004;10:1692–1694. doi: 10.1261/rna.7151404. [DOI] [PMC free article] [PubMed] [Google Scholar]
- 9.Riley KJ, Yario TA, Steitz JA. Association of Argonaute proteins and microRNAs can occur after cell lysis. RNA. 2012;18:1581–1585. doi: 10.1261/rna.034934.112. [DOI] [PMC free article] [PubMed] [Google Scholar]
- 10.Riley KJ, Steitz JA. The “Observer Effect” in genome-wide surveys of protein-RNA interactions. Mol Cell. 2013;49:601–604. doi: 10.1016/j.molcel.2013.01.030. [DOI] [PMC free article] [PubMed] [Google Scholar]
- 11.Darnell RB. HITS-CLIP: panoramic views of protein-RNA regulation in living cells. Wiley Interdiscip Rev RNA. 2010;1:266–286. doi: 10.1002/wrna.31. [DOI] [PMC free article] [PubMed] [Google Scholar]
- 12.Fecko CJ, et al. Comparison of femtosecond laser and continuous wave UV sources for protein-nucleic acid crosslinking. Photochem Photobiol. 2007;83:1394–1404. doi: 10.1111/j.1751-1097.2007.00179.x. [DOI] [PubMed] [Google Scholar]
- 13.Lapointe CP, Wickens M. The nucleic acid-binding domain and translational repression activity of a Xenopus terminal uridylyl transferase. J Biol Chem. 2013;288:20723–20733. doi: 10.1074/jbc.M113.455451. [DOI] [PMC free article] [PubMed] [Google Scholar]
- 14.Kim B, et al. TUT7 controls the fate of precursor microRNAs by using three different uridylation mechanisms. EMBO J. 2015;34:1801–1815. doi: 10.15252/embj.201590931. [DOI] [PMC free article] [PubMed] [Google Scholar]
- 15.Gerber AP, Herschlag D, Brown PO. Extensive association of functionally and cytotopically related mRNAs with Puf family RNA-binding proteins in yeast. PLoS biology. 2004;2:E79. doi: 10.1371/journal.pbio.0020079. [DOI] [PMC free article] [PubMed] [Google Scholar]
- 16.Zhu D, Stumpf CR, Krahn JM, Wickens M, Hall TM. A 5′ cytosine binding pocket in Puf3p specifies regulation of mitochondrial mRNAs. Proc Natl Acad Sci U S A. 2009;106:20192–20197. doi: 10.1073/pnas.0812079106. [DOI] [PMC free article] [PubMed] [Google Scholar]
- 17.Olivas W, Parker R. The Puf3 protein is a transcript-specific regulator of mRNA degradation in yeast. EMBO J. 2000;19:6602–6611. doi: 10.1093/emboj/19.23.6602. [DOI] [PMC free article] [PubMed] [Google Scholar]
- 18.Saint-Georges Y, et al. Yeast mitochondrial biogenesis: a role for the PUF RNA-binding protein Puf3p in mRNA localization. PLoS One. 2008;3:e2293. doi: 10.1371/journal.pone.0002293. [DOI] [PMC free article] [PubMed] [Google Scholar]
- 19.Gadir N, Haim-Vilmovsky L, Kraut-Cohen J, Gerst JE. Localization of mRNAs coding for mitochondrial proteins in the yeast Saccharomyces cerevisiae. RNA. 2011;17:1551–1565. doi: 10.1261/rna.2621111. [DOI] [PMC free article] [PubMed] [Google Scholar]
- 20.Chatenay-Lapointe M, Shadel GS. Repression of mitochondrial translation, respiration and a metabolic cycle-regulated gene, SLF1, by the yeast Pumilio-family protein Puf3p. PLoS One. 2011;6:e20441. doi: 10.1371/journal.pone.0020441. [DOI] [PMC free article] [PubMed] [Google Scholar]
- 21.Garcia-Rodriguez LJ, Gay AC, Pon LA. Puf3p, a Pumilio family RNA binding protein, localizes to mitochondria and regulates mitochondrial biogenesis and motility in budding yeast. J Cell Biol. 2007;176:197–207. doi: 10.1083/jcb.200606054. [DOI] [PMC free article] [PubMed] [Google Scholar]
- 22.Wilinski D, et al. RNA regulatory networks diversified through curvature of the PUF protein scaffold. Nat Commun. 2015;6 doi: 10.1038/ncomms9213. [DOI] [PMC free article] [PubMed] [Google Scholar]
- 23.Kusov YY, Shatirishvili G, Dzagurov G, Gauss-Muller V. A new G-tailing method for the determination of the poly(A) tail length applied to hepatitis A virus RNA. Nucleic Acids Res. 2001;29:E57–57. doi: 10.1093/nar/29.12.e57. [DOI] [PMC free article] [PubMed] [Google Scholar]
- 24.Lane AN, Chaires JB, Gray RD, Trent JO. Stability and kinetics of G-quadruplex structures. Nucleic Acids Res. 2008;36:5482–5515. doi: 10.1093/nar/gkn517. [DOI] [PMC free article] [PubMed] [Google Scholar]
- 25.Freeberg MA, et al. Pervasive and dynamic protein binding sites of the mRNA transcriptome in Saccharomyces cerevisiae. Genome biology. 2013;14:R13. doi: 10.1186/gb-2013-14-2-r13. [DOI] [PMC free article] [PubMed] [Google Scholar]
- 26.Bailey T, E C. Fitting a mixture model by expectation maximization to discover motifs in biopolymers. Proceedings of the Second International Conference on Intelligent Systems for Molecular Biology. 1994;August:28–36. [PubMed] [Google Scholar]
- 27.Miller MA, Russo J, Fischer AD, Lopez Leban FA, Olivas WM. Carbon source-dependent alteration of Puf3p activity mediates rapid changes in the stabilities of mRNAs involved in mitochondrial function. Nucleic Acids Res. 2014;42:3954–3970. doi: 10.1093/nar/gkt1346. [DOI] [PMC free article] [PubMed] [Google Scholar]
- 28.Wickens M, Bernstein DS, Kimble J, Parker R. A PUF family portrait: 3′UTR regulation as a way of life. Trends Genet. 2002;18:150–157. doi: 10.1016/s0168-9525(01)02616-6. doi: S0168952501026166. [pii] [DOI] [PubMed] [Google Scholar]
- 29.Hogan DJ, Riordan DP, Gerber AP, Herschlag D, Brown PO. Diverse RNA-binding proteins interact with functionally related sets of RNAs, suggesting an extensive regulatory system. PLoS biology. 2008;6:e255. doi: 10.1371/journal.pbio.0060255. [DOI] [PMC free article] [PubMed] [Google Scholar]
- 30.Jackson JS, Jr, Houshmandi SS, Leban Lopez F, Olivas WM. Recruitment of the Puf3 protein to its mRNA target for regulation of mRNA decay in yeast. RNA. 2004;10:1625–1636. doi: 10.1261/rna.7270204. [DOI] [PMC free article] [PubMed] [Google Scholar]
- 31.Houshmandi SS, Olivas WM. Yeast Puf3 mutants reveal the complexity of Puf-RNA binding and identify a loop required for regulation of mRNA decay. RNA. 2005;11:1655–1666. doi: 10.1261/rna.2168505. [DOI] [PMC free article] [PubMed] [Google Scholar]
- 32.Huh WK, et al. Global analysis of protein localization in budding yeast. Nature. 2003;425:686–691. doi: 10.1038/nature02026. [DOI] [PubMed] [Google Scholar]
- 33.Williams CC, Jan CH, Weissman JS. Targeting and plasticity of mitochondrial proteins revealed by proximity-specific ribosome profiling. Science. 2014;346:748–751. doi: 10.1126/science.1257522. [DOI] [PMC free article] [PubMed] [Google Scholar]
- 34.Sun M, et al. Global analysis of eukaryotic mRNA degradation reveals Xrn1-dependent buffering of transcript levels. Mol Cell. 2013;52:52–62. doi: 10.1016/j.molcel.2013.09.010. [DOI] [PubMed] [Google Scholar]
- 35.Jackson CL, Kepes F. BFR1, a multicopy suppressor of brefeldin A-induced lethality, is implicated in secretion and nuclear segregation in Saccharomyces cerevisiae. Genetics. 1994;137:423–437. doi: 10.1093/genetics/137.2.423. [DOI] [PMC free article] [PubMed] [Google Scholar]
- 36.Trautwein M, Dengjel J, Schirle M, Spang A. Arf1p provides an unexpected link between COPI vesicles and mRNA in Saccharomyces cerevisiae. Mol Biol Cell. 2004;15:5021–5037. doi: 10.1091/mbc.E04-05-0411. [DOI] [PMC free article] [PubMed] [Google Scholar]
- 37.Lang BD, Li A, Black-Brewster HD, Fridovich-Keil JL. The brefeldin A resistance protein Bfr1p is a component of polyribosome-associated mRNP complexes in yeast. Nucleic Acids Res. 2001;29:2567–2574. doi: 10.1093/nar/29.12.2567. [DOI] [PMC free article] [PubMed] [Google Scholar]
- 38.Weidner J, Wang C, Prescianotto-Baschong C, Estrada AF, Spang A. The polysome-associated proteins Scp160 and Bfr1 prevent P body formation under normal growth conditions. J Cell Sci. 2014;127:1992–2004. doi: 10.1242/jcs.142083. [DOI] [PubMed] [Google Scholar]
- 39.Simpson CE, Lui J, Kershaw CJ, Sims PF, Ashe MP. mRNA localization to P-bodies in yeast is bi-phasic with many mRNAs captured in a late Bfr1p-dependent wave. J Cell Sci. 2014;127:1254–1262. doi: 10.1242/jcs.139055. [DOI] [PMC free article] [PubMed] [Google Scholar]
- 40.Ast T, Cohen G, Schuldiner M. A network of cytosolic factors targets SRP-independent proteins to the endoplasmic reticulum. Cell. 2013;152:1134–1145. doi: 10.1016/j.cell.2013.02.003. [DOI] [PubMed] [Google Scholar]
- 41.Mitchell SF, Jain S, She M, Parker R. Global analysis of yeast mRNPs. Nat Struct Mol Biol. 2013;20:127–133. doi: 10.1038/nsmb.2468. [DOI] [PMC free article] [PubMed] [Google Scholar]
- 42.Jan CH, Williams CC, Weissman JS. Principles of ER cotranslational translocation revealed by proximity-specific ribosome profiling. Science. 2014;346:1257521. doi: 10.1126/science.1257521. [DOI] [PMC free article] [PubMed] [Google Scholar]
- 43.Munoz-Tello P, Rajappa L, Coquille S, Thore S. Polyuridylation in Eukaryotes: A 3′-End Modification Regulating RNA Life. Biomed Res Int. 2015;2015:968127. doi: 10.1155/2015/968127. [DOI] [PMC free article] [PubMed] [Google Scholar]
- 44.Norbury CJ. Cytoplasmic RNA: a case of the tail wagging the dog. Nat Rev Mol Cell Biol. 2013;14:643–653. doi: 10.1038/nrm3645. [DOI] [PubMed] [Google Scholar]
- 45.Chang H, Lim J, Ha M, Kim VN. TAIL-seq: genome-wide determination of poly(A) tail length and 3′ end modifications. Mol Cell. 2014;53:1044–1052. doi: 10.1016/j.molcel.2014.02.007. [DOI] [PubMed] [Google Scholar]
- 46.Newman MA, Mani V, Hammond SM. Deep sequencing of microRNA precursors reveals extensive 3′ end modification. RNA. 2011;17:1795–1803. doi: 10.1261/rna.2713611. [DOI] [PMC free article] [PubMed] [Google Scholar]
- 47.Jackson RJ, Hellen CU, Pestova TV. The mechanism of eukaryotic translation initiation and principles of its regulation. Nat Rev Mol Cell Biol. 2010;11:113–127. doi: 10.1038/nrm2838. [DOI] [PMC free article] [PubMed] [Google Scholar]
- 48.Miller JE, Reese JC. Ccr4-Not complex: the control freak of eukaryotic cells. Crit Rev Biochem Mol Biol. 2012;47:315–333. doi: 10.3109/10409238.2012.667214. [DOI] [PMC free article] [PubMed] [Google Scholar]
- 49.Langmead B, Trapnell C, Pop M, Salzberg SL. Ultrafast and memory-efficient alignment of short DNA sequences to the human genome. Genome biology. 2009;10:R25. doi: 10.1186/gb-2009-10-3-r25. [DOI] [PMC free article] [PubMed] [Google Scholar]
- 50.Hulsen T, de Vlieg J, Alkema W. BioVenn – a web application for the comparison and visualization of biological lists using area-proportional Venn diagrams. BMC Genomics. 2008;9:488. doi: 10.1186/1471-2164-9-488. [DOI] [PMC free article] [PubMed] [Google Scholar]
- 51.Xu Z, et al. Bidirectional promoters generate pervasive transcription in yeast. Nature. 2009;457:1033–1037. doi: 10.1038/nature07728. [DOI] [PMC free article] [PubMed] [Google Scholar]
- 52.Crooks GE, Hon G, Chandonia JM, Brenner SE. WebLogo: a sequence logo generator. Genome Res. 2004;14:1188–1190. doi: 10.1101/gr.849004. [DOI] [PMC free article] [PubMed] [Google Scholar]
- 53.Krogh A, Larsson B, von Heijne G, Sonnhammer EL. Predicting transmembrane protein topology with a hidden Markov model: application to complete genomes. J Mol Biol. 2001;305:567–580. doi: 10.1006/jmbi.2000.4315. [DOI] [PubMed] [Google Scholar]
Associated Data
This section collects any data citations, data availability statements, or supplementary materials included in this article.