

Mathematical modeling of the cell cycle has unveiled recurrent features and emergent behaviors of cellular networks. Constructing new mutants and performing experimental tests during development of a new model of the budding yeast cell cycle yields a more efficient modeling process and results in several testable hypotheses.
Abstract
The cell cycle is composed of bistable molecular switches that govern the transitions between gap phases (G1 and G2) and the phases in which DNA is replicated (S) and partitioned between daughter cells (M). Many molecular details of the budding yeast G1–S transition (Start) have been elucidated in recent years, especially with regard to its switch-like behavior due to positive feedback mechanisms. These results led us to reevaluate and expand a previous mathematical model of the yeast cell cycle. The new model incorporates Whi3 inhibition of Cln3 activity, Whi5 inhibition of SBF and MBF transcription factors, and feedback inhibition of Whi5 by G1–S cyclins. We tested the accuracy of the model by simulating various mutants not described in the literature. We then constructed these novel mutant strains and compared their observed phenotypes to the model’s simulations. The experimental results reported here led to further changes of the model, which will be fully described in a later article. Our study demonstrates the advantages of combining model design, simulation, and testing in a coordinated effort to better understand a complex biological network.
INTRODUCTION
The eukaryotic cell division cycle is regulated by cyclin-dependent protein kinases (CDKs), which phosphorylate many cellular proteins, including transcription factors and proteins controlling DNA replication, chromosome segregation, and cell division. Transitions between successive stages of the cell cycle—G1, S, G2, and M—are controlled by irreversible, bistable, biochemical switch–based positive feedback mechanisms (Cross et al., 2002; Kapuy et al., 2009; Zhang et al., 2011; Verdugo et al., 2013).
In the budding yeast Saccharomyces cerevisiae, the sole CDK is known as Cdc28 (Lorincz and Reed, 1984; Reed et al., 1985; Wittenberg and Reed, 1988; Reed and Wittenberg, 1990; Futcher, 1991). The activity of Cdc28 and its substrate specificity are governed by its obligatory binding partners, cyclins Cln1–3 and Clb1–6 (Wittenberg and Reed, 1988; Futcher, 1991; Ghiara et al., 1991; Surana et al., 1991; Veinot-Drebot et al., 1991). The two main regulatory points in the budding yeast cell cycle are the G1–S transition and the metaphase–anaphase transition. In the case of G1–S, the mass of the cell must reach a critical value for the transition to occur (the threshold value depends on nutrient conditions). This “checkpoint” ensures that cell size homeostasis is maintained generation after generation (Wheals, 1982; Calvert and Dawes, 1984; Moore, 1988; Baroni et al., 1992; Sillje et al., 1997; Jorgensen et al., 2002; Rupes, 2002). In the case of the metaphase–anaphase transition, the DNA must be fully replicated, and the sister chromatids must be securely attached to opposite poles of the mitotic spindle before they can be segregated between mother cell and bud during anaphase (Lydall and Weinert, 1997; Straight and Murray, 1997; Taylor, 1999; Burke, 2000).
The molecular mechanisms that determine whether a cell will execute entry into the cell cycle from G1—also known as Start in yeast—have been well characterized. In early G1, the only available cyclin is Cln3, whose rate of synthesis is proportional to cell mass (Hall et al., 1998; Nash et al., 2001; Alberghina et al., 2004; Mizunuma et al., 2013; Yahya et al., 2014). Moreover, Cln3 is sequestered at the endoplasmic reticulum (ER) by Whi3 in an Ssa1-dependent process (Gari et al., 2001; Ferrezuelo et al., 2012; Caudron and Barral, 2013). Eventually, the cell grows large enough to cause a rapid release of Cln3 from the ER in a Ydj1-dependent process, allowing Cln3-CDK to enter the nucleus, where it activates two transcription factors, SCB-binding factor (SBF) and MCB-binding factor (MBF; Primig et al., 1992; Moll et al., 1993; Ferrezuelo et al., 2012). Ydj1’s activity in releasing Cln3 from the ER is also dependent on cell mass, although the mechanism of this dependence is not known (Verges et al., 2007).
SBF consists of a heterodimer of Swi4 and Swi6, and MBF consists of a heterodimer of Mbp1 and Swi6 (Primig et al., 1992; Moll et al., 1993). Swi4 and Mbp1 bind to distinct promoter elements (SCB and MCB, respectively), whereas Swi6 mediates SBF and MBF activity through its association with transcriptional activators and repressors (Andrews and Moore, 1992; Moll et al., 1992; Takahata et al., 2009). Many genes contain both SCB and MCB elements in their promoters (Moll et al., 1992; Morgan et al., 1995). SBF and MBF induce transcription of the partially redundant cyclin pairs Cln1/Cln2 and Clb5/Clb6, respectively (Moll et al., 1993). Cln1/2-CDK induces budding and the transcription of S-phase genes, and it inactivates Sic1, a stoichiometric inhibitor of Clb5/Clb6-CDK (Lew and Reed, 1993; Dirick et al., 1995; Verma et al., 1997). Clb5/6-CDK then activates numerous DNA replication proteins and the transcription of genes involved in replication (Schwob and Nasmyth, 1993; Toone et al., 1997).
Activation of SBF occurs by phosphorylation of Whi5, which is a stoichiometric repressor of SBF (Costanzo et al., 2004; de Bruin et al., 2004). Multiple phosphorylation of Whi5 by Cln3-CDK inhibits its binding to SBF (Costanzo et al., 2004; de Bruin et al., 2004). The abrupt switch-like transition from G1 to S phase occurs because Cln1/2-CDK further phosphorylates Whi5 and thereby activates its own transcription factor, SBF. Eventually, Whi5 is fully phosphorylated and exported from the nucleus via the exportin Msn5 (Taberner et al., 2009). Cln1/2-CDK and Cln3-CDK also phosphorylate Swi6, further increasing the activity of SBF and MBF for a time. Physiological levels of nonphosphorylatable Whi5 (Whi512A) and Swi6 (Swi64A) have no effect on the G1–S transition individually but delay the transition in combination (Costanzo et al., 2004; de Bruin et al., 2004; Wagner et al., 2009).
Despite the extent of evidence supporting the Start events described here, there are several gaps in this picture. Genetic and biochemical experiments show that Whi5 inhibition of MBF is weak and, therefore, that Cln3 must activate MBF in a different manner than SBF (de Bruin et al., 2004; Harris et al., 2013). Moreover, genetic experiments show that Bck2—a protein of unknown function—plays a similar role in Start to that of Cln3 (Wijnen and Futcher, 1999).
We previously used mathematical modeling to describe the temporal dynamics of CDK activities in the budding yeast cell cycle (Chen et al., 2004) and tested the model (here called START-2004) against a large set of experimental data extracted from the literature, focusing on the phenotypes of mutant strains of budding yeast. START-2004 used ordinary differential equations (ODEs) to represent most of the biochemical reactions known at the time to govern progression through the yeast cell cycle. This approach, using ODEs to model the cell cycle, synthesizes the available molecular evidence into a single mathematical framework that attempts to capture the overall dynamics of cell cycle control in budding yeast in quantitative detail. START-2004 originated from a very simple model published in 1995 and passed through an intermediate stage in 2000 (Tyson et al., 1995; Chen et al., 2000, 2004). These models of the budding yeast cell cycle have influenced many other modeling efforts (Li et al., 2004; Csikasz-Nagy et al., 2006; Gerard and Goldbeter, 2009; Singhania et al., 2011) and experimental studies (Cross et al., 2002, 2005; Thornton et al., 2004) and have been seminal in our understanding of how cell cycle transitions are irreversible due to systems-level feedback resulting in bistability and hysteresis (Novak et al., 2007; Lopez-Aviles et al., 2009; Lu et al., 2012; Zhao et al., 2012).
The budding yeast cell cycle models published from 1995 to 2004 were developed and tested in the context of published experimental data. For example, START-2000 (Chen et al., 2000) was built to account for the observed phenotypes of ∼60 mutant yeast strains, and START-2004 (Chen et al., 2004) correctly accounted for the phenotypes of 120 of 131 cell cycle mutants. In this article, we show how model development and testing can proceed in parallel with new experimental observations, thereby improving the parameterization of the model, preventing the inclusion of incorrect assumptions about network architecture, and accelerating the pace of understanding cell cycle regulation in budding yeast.
Although START-2004 was remarkably accurate in describing the phenotypes of many cell cycle mutants, it was missing many of the aforementioned control elements. Hence, over the intervening years, we expanded the model into START-2013, which was developed and tested in light of the phenotypes of 237 experimentally characterized cell cycle mutants. In this study, we focus on testing START-2013 by generating mutant strains and observing their growth phenotypes. In particular, we test START-2013’s predicted phenotypes of 15 new cell cycle mutants not previously described in the literature. In addition, we recreate two mutants previously described as viable that are inviable in model simulations and three mutants previously described as inviable that are viable in model simulations. Finally, we construct and characterize eight mutants that have been described in the literature only as “viable” or “larger/smaller than wild type.” We pay particular attention to quantitative measures of cell size because cells that delay Start are larger than normal, whereas cells that execute Start prematurely are smaller than normal.
Our new experimental observations identified problems with START-2013 and prompted us to make additional improvements before publishing the next START model.
RESULTS
New yeast START model
The START-2004 model posited a simple mechanism for Start in which growth in G1 results in increased nuclear concentrations and activities of Cln3 and Bck2, which activate SBF/MBF (lumped together) as an ultrasensitive switch (Chen et al., 2004). SBF/MBF in turn activate transcription of Cln1 and 2 and Clb5 and 6, which causes further activation of SBF/MBF. An additional positive feedback to Start is due to the initial phosphorylation of CKI (Sic1 and Cdc6) by Cln2,3–CDK (which are not inhibited by CKI), followed by full phosphorylation and inhibition of CKI by Clb5,6–CDK (which is inhibited by CKI). After the G1–S transition is complete and budding and replication have commenced, SBF and MBF are inactivated by Clb1,2–CDK (Figure 1). These assumptions of the model are consistent with experimental observations showing that Sic1 is phosphorylated by Cln-CDK and Clb-CDK, resulting in Sic1 ubiquitination by Skp, Cullin, F-box (SCF) and degradation by the 26S proteasome (Koivomagi et al., 2011). Moreover, CLN2 transcription is known to be turned off by Clb2 (Amon et al., 1993; Koch et al., 1996).
FIGURE 1:

Wiring diagram of the START-2013 model. The model is based on START-2004 (Chen et al., 2004), with significant changes as outlined in the Results section. The Start module (top left) now has a mechanism for cell size control, Whi5 inhibition of SBF, positive feedback from G1–S cyclins to SBF, and MBF via inhibition of Whi5 and direct phosphorylation, and negative feedback from Nrm1 and Clb2. It also includes control of nucleocytoplasmic shuttling of Whi5 and Swi6. The remainder of the wiring diagram is largely the same as that of START-2004, except that now Pds1 expression is constitutive and PPX (a hypothetical protein phosphatase that is now known to be PP2A-Cdc55) is inhibited by Esp1 rather than directly by Pds1. IE, a hypothetical intermediary enzyme in START-2004, is likely a Clb2-CDK–dependent phosphorylated form of anaphase-promoting complex (APC). We propose that a hypothetical protein phosphatase (hyp PP) dephosphorylates APC to prevent its premature association.
START-2013, the model used to simulate the mutants tested in this study, incorporates more regulatory mechanisms governing Cln3 synthesis and activity (ER sequestration by Whi3 and Ssa1 and release by Ydj1) and SBF/MBF regulation (Whi5 and Nrm1 inhibition; nucleocytoplasmic transport of Whi5 and SBF; Figure 1). Consequently most of the mutants we characterized to test the model perturb the levels of these Start proteins. START-2013 is described in detail on our website (tysonlab.biol.vt.edu/research/start_transition), which includes an online simulator that allows users to simulate the behavior of cells carrying any combination of mutant alleles for the genes in the model. Screen shots of a few simulated mutants are shown in Supplemental Figure S1.
The major improvements of START-2013 over START-2004 are as follows:
Incorporation of Whi5 and its differential effects on SBF and MBF, and positive feedback of Cln1,2–CDK on SBF activity via its inhibition of Whi5.
Separation of SBF and MBF into their constituent heterodimer proteins.
A role for Bck2 in promoting Start.
A mechanism explaining how SWI6-deletion mutants can transit Start without SBF and MBF.
Mechanisms explaining the nuclear localization patterns of Whi5, Swi4, and Swi6.
A more detailed cell-size control mechanism consistent with experiments showing roles for Whi3, Ydj1, and Ssa1 and including the effects of different growth media and mass-doubling times on this mechanism.
Negative feedback inhibition of MBF by Clb2 and Nrm1 (a stoichiometric inhibitor of MBF, which is transcribed by MBF).
Nuclear export of SBF because of negative feedback from Clb2-CDK.
START-2013 recapitulates the phenotypes of 229 of 237 yeast cell cycle mutants described in the literature. Because the model has changed considerably in light of the new mutants described in this study, START-2013 will not be published other than its description on our Web page. Instead, a full accounting of the latest iteration of the model, tentatively called START-2015 in this article, will be published elsewhere (K. C. Chen, J. Ravi, and J. J. Tyson, unpublished data).
Comparison of simulated and measured cell volumes
Because of the importance of Cln3 and Bck2 in initiating Start and the crucial role of positive feedback from Cln1/2 to SBF and MBF for coherent expression of Start-related genes (Skotheim et al., 2008), we focused on deletion and overexpression mutants affecting these proteins. We analyzed mutant phenotypes by time-lapse movies of live cells, cell-counter size measurements, and flow cytometry for DNA content. We determined population distributions of cell volumes for mutant strains and compared our measurements with predictions of the START-2013 model. Figure 2 shows still images of the cells and the average volume of the mutant cell relative to the average volume of wild-type cells growing under the same conditions. Tables 1, 2, and 3 show the doubling time and cell volume statistics of the mutant strains. The statistical distributions of cell sizes are shown in Supplemental Figures S2–S4.
FIGURE 2:

Phase contrast images showing the cell sizes and morphology of wild-type and mutant strains listed in Tables 1, 2, and 3. The relevant strain genotype and size (volume) relative to the wild-type strain is indicated above each panel. The GAL1 promoter is abbreviated as GAL. Scale bar, 10 μm.
TABLE 1:
Cell size phenotypes of single mutants.
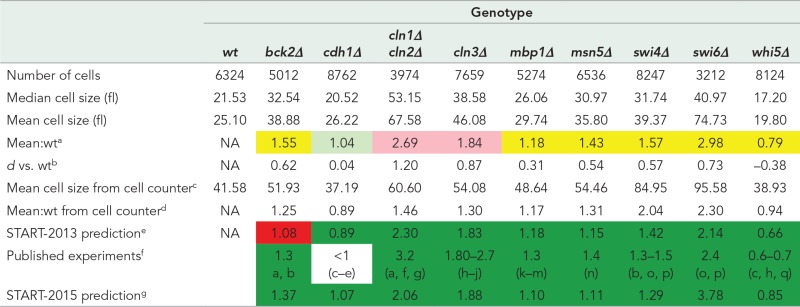 |
All cell sizes are given in femtoliters.
aRatio of the mean cell size of the mutant strain (all replicates pooled) compared with wild-type (wt) cells (all replicates pooled) from live-cell microscopy experiments. Light green cells, mean cell size is the same as wt (small effect size, d ≤ 0.2). Yellow cells, mean cell size is smaller or larger than wt with a medium effect size (0.2 < d < 0.8). Pink cells, mean cell size is smaller or larger than wt with a large effect size (d ≥ 0.8).
bCohen’s d effect size for log-transformed cell sizes (see Materials and Methods).
cMean cell size from automated cell counter measurements (see Materials and Methods). Most measurements are of a single biological replicate. When multiple replicates were measured, the number is the mean from the replicates.
dRatio of the mean cell size to the mean cell size of the wt strain from automated cell counter measurements.
eSTART-2013 model–simulated mutant cell size at division relative to wt cell size at division. Dark green cells, measurements agree with model prediction. Red cells, measurements do not agree with model prediction.
fMean population cell size of mutants relative to wt cells reported in the literature as cited. Dark green cells, measurements agree with published observations. Uncolored cell, literature provides only relative cell size. a. Epstein and Cross (1994), b. Wijnen and Futcher (1999), c. Jorgensen et al. (2002), d. Schwab et al. (1997), e. Wasch and Cross (2002), f. Dirick et al. (1995), g. Tyers et al. (1992), h. Costanzo et al. (2004), i. Cross (1988), j. Tyers et al. (1993), k. Bean et al. (2005), l. Ferrezuelo et al. (2009), m. Koch et al. (1993), n. Queralt and Igual (2003), o. Nasmyth and Dirick (1991), p. Wijnen et al. (2002), q. de Bruin et al. (2004).
gRelative cell size prediction from current updated START-2015 model incorporating changes to better fit new data (see Discussion). Dark green cells, measurements agree with model prediction.
TABLE 2:
Cell size phenotypes of double, triple, and quadruple mutants.
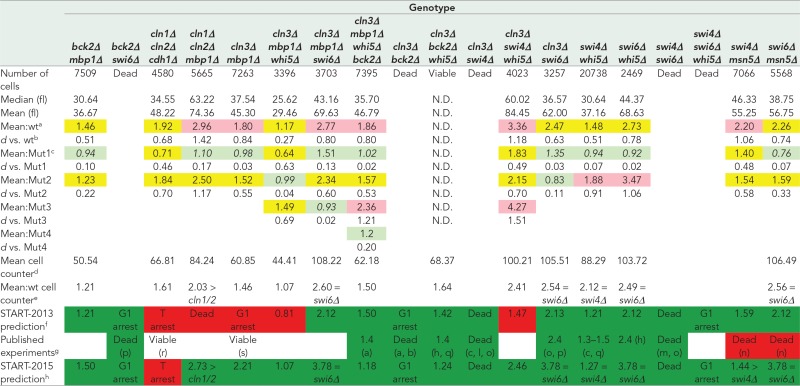 |
All cell sizes are given in femtoliters.
aRatio of the mean cell size of the mutant strain (all replicates pooled) compared with wild-type (wt) cells (all replicates pooled) from live-cell microscopy experiments. Light green cells, mean cell size is the same as wt (small effect size, d ≤ 0.2). Yellow cells, mean cell size is smaller or larger than wt with a medium effect size (0.2 < d < 0.8). Pink cells, mean cell size is smaller or larger than wt with a large effect size (d ≥ 0.8).
bCohen’s d effect size for log-transformed cell sizes (see Materials and Methods).
cRatio of the mean cell size of the mutant strain (all replicates pooled) compared with the first single mutant in the indicated genotype (Mut1) from live-cell microscopy experiments. Mut2 is the second single mutant in the genotype, and so on. Cell coloring is the same as for the mean cell sizes relative to the wt strain. Numbers in italics indicate the single mutants closest in size to the multiple deletion mutant.
dMean cell size from automated cell counter measurements (see Materials and Methods). Most measurements are of a single biological replicate. When multiple replicates were measured, the number is the mean from the replicates.
eRatio of the mean cell size to the mean cell size of the wt strain from automated cell counter measurements.
fSTART-2013 model–simulated mutant cell size at division relative to wt cell size at division. Dark green cells, measurements agree with model prediction. Red cells, measurements disagree with model prediction.
gMean population cell size of mutants relative to wt cells reported in the literature as cited. Citations are the same as in Table 1 with the additional following citations: r. Cross et al. (2002), s. Bean et al. (2006). Dark green cells, measurements agree with published observations. Red cells, measurements disagree with published observations. Uncolored cells, literature provides only viability data.
hRelative cell size prediction from START-2015 model incorporating changes to better fit new data (see Discussion). Dark green cells, measurements agree with model prediction. Red cells, measurements disagree with model prediction.
TABLE 3:
Cell size phenotypes of overexpression mutants in 2% raffinose/galactose medium.
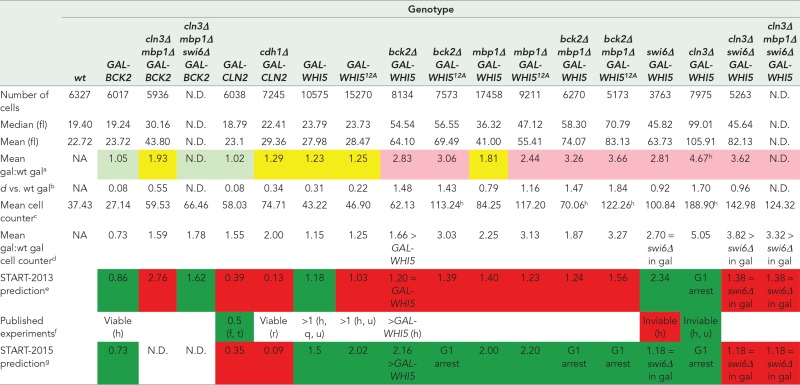 |
All cell sizes are given in femtoliters (fl).
aRatio of the mean cell size of the mutant strain grown in galactose (all replicates pooled) compared with wild-type (wt) cells grown in galactose (all replicates pooled) from live-cell microscopy experiments. Light green cells, mean cell size is the same as wt (small effect size, d ≤ 0.2). Yellow cells, mean cell size is smaller or larger than wt with a medium effect size (0.2 < d < 0.8). Pink cells, mean cell size is smaller or larger than wt with a large effect size (d ≥ 0.8).
bCohen’s d effect size for log-transformed cell sizes (see Materials and Methods).
cMean cell size when grown in galactose from automated cell counter measurements (see Materials and Methods). Most measurements are of a single biological replicate. When multiple replicates were measured, the number is the mean from the replicates.
dRatio of the mean cell size when grown in galactose to the mean cell size of the wild-type strain grown in galactose from automated cell counter measurements.
eSTART-2013 model simulated mutant cell size at division relative to wild-type cell size at division. Dark green cells, measurements agree with model prediction. Red cells, measurements disagree with model prediction.
fMean population cell size of mutants relative to wt cells reported in the literature as cited. Citations are the same as in Tables 1 and 2 with the additional following citations: t. Hadwiger et al. (1989), u. Wagner et al. (2009). Dark green cells, measurements agree with published observations. Red cells, measurements disagree with published observations. Uncolored cells, literature provides only relative cell sizes or viability data.
gRelative cell size prediction from START-2015 model incorporating changes to better fit new data (see Discussion). Dark green cells, measurements agree with model prediction. Red cells, measurements disagree with model prediction.
hThe terminal phenotype is G1 arrest (see Figures 6–9).
Single mutants.
The characterization of single-mutant phenotypes serves as control for our test strains. (Note that for our purposes, the cln1∆ cln2∆ mutant strain is a “single” mutant because of the functional redundancy of these two cyclins.) With one exception, the single-mutant phenotypes correspond well to predictions of the START-2013 model and to published data (Table 1). The exception is the bck2∆ mutant, whose size is significantly underestimated by the model. This discrepancy is due to a poor choice of certain kinetic rate constants in the START-2013 basal parameter set, as we discuss later.
In addition, there are some discrepancies between our size measurements of single cells by live-cell imaging and cell sizes measured by other methods. For example, cdh1∆ cells are not significantly smaller than wild-type cells in our measurements, but they should be smaller according to both published observations and the START-2013 model. This discrepancy is due to a technical limitation of the cell segmentation algorithm we use, which is unable to determine, using only phase-contrast or differential interference contrast (DIC) images, whether a bud is connected to or separated from a mother cell. Consequently as soon as a bud is large enough to be detected (generally around 1.5–2 fl), its volume is measured independently of its mother (Supplemental Figure S5). Hence the cell volumes we measure in populations of yeast cells are smaller than the true size of mother plus bud before cell separation (our cell size means are ∼20 fl for wild-type cells [ Table 1], compared with ∼40 fl for mother plus bud volumes reported in the literature; Brewer et al., 1984; Cross et al., 2002). The cdh1∆ mutant is reported to be only 10% smaller in volume than wild-type cells, making it difficult to observe the difference in population measurements that are already small. As a second example, whi5∆ cells are predicted to be 30–40% smaller than wild-type cells; our observations show that whi5∆ cells are indeed smaller but not quite as small as predicted (only 20% smaller in our imaging measurements). Cell size measurements taken with a cell counter confirm the predicted and known cell sizes of the cdh1∆ and whi5∆ mutants (Table 1).
Multiple-deletion mutants.
The phenotypes of five multiple-deletion strains (cln1∆ cln2∆ cdh1∆, cln1∆ cln2∆ mbp1∆, cln3∆ mbp1∆, cln3∆ mbp1∆ whi5∆, cln3∆ swi4∆ whi5∆; Table 2) do not agree with predictions of START-2013. The model predicts that cln1∆ cln2∆ cdh1∆ cells arrest in telophase and that cln3∆ mbp1∆ and cln1∆ cln2∆ mbp1∆ cells arrest in G1, but these three mutant strains are observed to be viable. The cln3∆ mbp1∆ whi5∆ and cln3∆ swi4∆ whi5∆ strains are predicted to be significantly smaller than measured sizes. The phenotypes of two mutant strains (swi4∆ msn5∆ and swi6∆ msn5∆; Table 2) agree with the model but not with previously published observations. The swi4∆ msn5∆ and swi6∆ msn5∆ strains were previously reported to be synthetic lethal but are viable in our crosses. We discuss the reasons for these discrepancies between the model, published experiments, and our experiments in subsequent sections.
Overexpression strains.
We also determined the size distributions of cell populations for strains overexpressing various genes in the short term (∼7–10 h) and compared our measurements with START-2013 predictions (Table 3). The cells of eight overexpression mutant strains are larger than the model predicts: GAL1pr-CLN2, cdh1∆ GAL1pr-CLN2, GAL1pr-WHI512A (nonphosphorylatable Whi5), bck2∆ GAL1pr-WHI5, bck2∆ GAL1pr-WHI512A, mbp1∆ GAL1pr-WHI5, mbp1∆ GAL1pr-WHI512A, and bck2∆ mbp1∆ GAL1pr-WHI5. For one strain (cln3∆ mbp1∆ GAL1pr-BCK2), cell size is smaller than the model predicts, and for another strain (swi6∆ GAL1pr-WHI5), our observations agree with the model but not with a published observation that swi6∆ GAL1pr-WHI5 cells are inviable (Costanzo et al., 2004).
For all of these experiments, cells were grown in raffinose (or glucose) before change of the medium to 2% galactose. We then compared cell sizes in the two media. Except for WHI5 overexpression in wild-type and swi6∆ cells, galactose induction resulted in a change in mean cell size even when the change in carbon source was factored into the cell size ratios, indicating that the overexpression constructs functioned as expected (Supplemental Tables S1 and S2).
The viability of some overexpression strains was previously determined only by growth on plates. For comparison to these published observations, we plated serial dilutions of the overexpression strains on glucose (repressed), raffinose (uninduced), and 0.1% or 2% galactose (each with 2% raffinose to support growth; Figure 3). Many of the overexpression strains that were viable over three or four generations in live-cell imaging experiments showed severe growth inhibition under induced or even uninduced (basal expression) conditions when grown on plates for several days. For example, even wild-type cells are sensitive to BCK2 and CLN2 overexpression on plates. We also confirmed that overexpression of WHI5 in the swi6∆ mutant inhibits cell growth on plates (Figure 3; Costanzo et al., 2004). We discuss possible causes of these differences between the predictions and observed phenotypes later.
FIGURE 3:

Growth assays for overexpression strains on glucose, raffinose, and galactose. Serial dilutions were spotted as described in Materials and Methods. The sugars contained in the plates are indicated at top. The 0.1% galactose plates were used to obtain lower levels of induction of the GAL1 promoter–driven gene. Gray triangles indicate relative concentrations of cells in the spots. The relevant genotypes of strains are indicated to the left. The GAL1 promoter is abbreviated as GAL.
In total, START-2013 correctly predicts the phenotypes of 27 of 45 cell cycle mutants tested here, three of eight of the mutants that were not previously characterized quantitatively and four of 15 of the new cell cycle mutants not described in the literature.
Steady-state phenotypes of overexpression strains
For live-cell assays using overexpression strains, we were able to observe the strains during galactose induction only for three or four generations, after which the cells became too crowded for the cell segmentation algorithm to work. Consequently a significant portion of the population comprises partially induced cells and the original-sized mothers, which cannot get smaller (cln3∆ mbp1∆ GAL1pr-BCK2 in Figure 2) but can grow larger along with their daughters (Supplemental Figure S6). To address this problem, we grew the overexpression strains in liquid medium containing glucose, raffinose, or galactose for 16 h and measured their cell size distributions using a cell counter (Figures 4, 6, and 8) and their cell cycle status by measuring their DNA content (Figures 5, 7, and 9). Trends in the cell size distributions can also be seen in the forward- and side-scatter dot plots (Supplemental Figures S7–S9).
FIGURE 4:

Steady-state cell sizes and morphologies of strains overexpressing CLN2 and BCK2. Cultures were grown in SD-Ura to an OD600 of ∼1.5 and reinoculated into SD-Ura, Sraff-Ura, and Sgal-Ura (each sugar at 2%) at a 1:1000 ratio for SD-Ura or a 1:100 ratio for Raff and Gal cultures. These cultures were shaken overnight for 16 h at 30°C to obtain an OD600 of 0.5–1.0. Cell size measurements were performed on a cell counter, and DIC images of the cultures were captured as described in Materials and Methods. Strain genotypes are indicated to the left, and the sugar used is indicated at the top of each column. Charts show the cell size distributions of the cultures. Black lines, cell volume distribution in glucose; red lines, cell volume distribution in raffinose; green lines, cell volume distribution in galactose. The mean cell size of each culture is indicated on each chart with the same color scheme as the lines and column headings for the DIC images. The maximum on the x-axis is 300 fl. The GAL1 promoter is abbreviated as GAL1pr. Scale bar, 20 μm.
FIGURE 6:

Steady-state cell sizes and morphologies of bck2∆ and mbp1∆ mutant strains overexpressing WHI5. Cultures were grown in SD-His to an OD600 of ∼1.5 and reinoculated into SD-His, Sraff-His, and Sgal-His (each sugar at 2%) at a 1:1000 ratio for SD-Ura or a 1:100 ratio for Raff and Gal cultures. These cultures were shaken overnight for 16 h at 30°C to obtain an OD600 of 0.5–1.0. Cell size measurements were performed on a cell counter, and DIC images of the cultures were captured as described in Materials and Methods. Strain genotypes are indicated to the left, and the sugar used is indicated at the top of each column. Charts show the cell size distributions of the cultures. Black lines, cell volume distribution in glucose; red lines, cell volume distribution in raffinose; green lines, cell volume distribution in galactose. The mean cell size of each culture is indicated on each chart with the same color scheme as the lines and column headings for the DIC images. The maximum on the x-axis is 300 fl. The GAL1 promoter is abbreviated as GAL1pr. Scale bar, 20 μm.
FIGURE 8:

Steady-state cell sizes and morphologies of cln3∆ and swi6∆ mutant strains overexpressing WHI5. Cultures were grown in SD-His to an OD600 of ∼1.5 and reinoculated into SD-His, Sraff-His, and Sgal-His (each sugar at 2%) at a 1:1000 ratio for SD-Ura or a 1:100 ratio for Raff and Gal cultures. These cultures were shaken overnight for 16 h at 30°C to obtain an OD600 of 0.5-1.0. Cell size measurements were performed on a cell counter, and DIC images of the cultures were captured as described in Materials and Methods. Strain genotypes are indicated to the left, and the sugar used is indicated at the top of each column. Charts show the cell size distributions of the cultures. Black lines, cell volume distribution in glucose; red lines, cell volume distribution in raffinose; green lines, cell volume distribution in galactose. The mean cell size of each culture is indicated on each chart with the same color scheme as the lines and column headings for the DIC images. Note that the maximum on the x-axis is 500 fl. The GAL1 promoter is abbreviated as GAL1pr. Scale bar, 20 μm.
FIGURE 5:

Steady-state DNA content of strains overexpressing CLN2 and BCK2. The DNA content of the strains shown in Figure 4 was determined by flow cytometry, as described in Materials and Methods. Each strain is shown in a column with the cells grown in glucose at top (black), cells grown in raffinose in the middle (red), and cells grown in galactose at the bottom (green), as indicated in the titles. The percentages of cells containing 1N or 2N DNA content are indicated next to each peak. Percentages do not add to 100% because of measured events outside of the peaks but within the gated measurements. The GAL1 promoter is abbreviated as GAL1pr.
FIGURE 7:

Steady-state DNA content of bck2∆ and mbp1∆ mutant strains overexpressing WHI5. The DNA content of the strains shown in Figure 6 was determined by flow cytometry, as described in Materials and Methods. Each strain is shown in a column with the cells grown in glucose at top (black), cells grown in raffinose in the middle (red), and cells grown in galactose at the bottom (green). The percentages of cells containing 1N or 2N DNA content are indicated next to each peak. Percentages do not add to 100% because of measured events outside of the peaks but within the gated measurements. The GAL1 promoter is abbreviated as GAL1pr.
FIGURE 9:

Steady-state DNA content of cln3∆ and swi6∆ mutant strains overexpressing WHI5. The DNA content of the strains shown in Figure 8 was determined by flow cytometry, as described in Materials and Methods. Each strain is shown in a column with the cells grown in glucose at top (black), cells grown in raffinose in the middle (red), and cells grown in galactose at the bottom (green). The percentages of cells containing 1N or 2N DNA content are indicated next to each peak. Percentages do not add to 100% because of measured events outside of the peaks but within the gated measurements. The GAL1 promoter is abbreviated as GAL1pr.
From these experiments, the growth inhibition observed for some overexpression strains when grown on plates appears to be unrelated to cell cycle effects. For example, when either CLN2 or BCK2 was overexpressed for 16 h in liquid culture, these cells had buds (Figure 4) and normal or near-normal proportions of 1N and 2N DNA content (Figure 5). Moreover, BCK2 overexpression partially rescued the large cell size of cln3∆ mbp1∆ cells (Table 3 and Supplemental Table S2), suggesting again that the cell cycle effects of overexpression are correctly captured by the model.
The morphology of the GAL1pr-CLN2 strain grown under inducing conditions was abnormal, with many elongated buds (Figures 2 and 4 and Supplemental Movies S1 and S2). This morphological defect is probably due to prolonged apical bud growth caused by abnormally high levels of Cln2-CDK, which is normally localized at bud tips and promotes apical bud growth (Colomina et al., 2009). These long buds probably account for the increase in cell size in the GAL1pr-CLN2 strain, counter to predictions (Table 3, Supplemental Table S1, and Figure 4). The phenotype of this mutant could be a spurious side effect of the large protein A tag fused to Cln2, impeding Cln2 function and possibly acting as a dominant-negative mutation. However, the reduction in 1N DNA content in cells overexpressing CLN2 suggests that the duration of G1 phase is indeed shorter, as predicted. We did not measure the growth rates of these 16-h liquid cultures, but there were not large numbers of lysed cells that could explain the inhibited growth on plates. It is possible that the bud growth abnormalities caused by elevated activity of Cln2-CDK are more problematic when the cells are grown on solid agar, possibly activating checkpoint responses such as the cell wall integrity pathway or the morphogenesis checkpoint (Lew, 2003; Levin, 2011).
The cln3∆ mbp1∆ strain exhibited a delay in G1, as predicted, but this delay was unexpectedly exaggerated when grown in raffinose or galactose and was rescued by BCK2 overexpression (Figures 4 and 5, Supplemental Table S1, and Supplemental Movie S3). In fact, of all the mutants in this study, only the cln3∆ mbp1∆ and the cln3∆ bck2∆ whi5∆ mutant strains were larger in raffinose and galactose than in glucose (Supplemental Table S1), suggesting that these strains are fundamentally different in how they respond to the carbon source.
The observed growth inhibition of the swi6∆ GAL1pr-WHI5 strain on agar plates (Figure 3; Costanzo et al., 2004) is not due to G1 arrest of the cell cycle, as there is essentially no difference in cell size between induced and uninduced cells, especially when compared with swi6∆ cells in glucose, raffinose, and galactose (Supplemental Table S2, Figure 8, and Supplemental Movie S4). However, a higher proportion of cells have 1N DNA content in raffinose and galactose in these strains (Figure 9). This shift could be due to the carbon sources, but the observation that the shift to 1N content is more dramatic in swi6∆ GAL1pr-WHI512A then in swi6∆ GAL1pr-WHI5 cells grown in raffinose suggests that the delay is due to basal expression of WHI5 in raffinose (Figure 9). Nevertheless, the G1 delay seen in these 16-h liquid cultures is not strong enough to account for the strong growth inhibition on agar plates. The lack of growth on plates is more likely a result of morphological defects in the swi6∆ mutant that are exacerbated when WHI5 is overexpressed. The swi6∆ mutants appear to prolong apical bud growth and have broad, ill-defined bud necks but continue to produce new buds (Figures 2 and 8). The morphological defects of swi6∆ cells are more apparent when WHI5 is overexpressed (especially the absence of obvious bud necks), and these cells frequently lyse (Figure 8).
In contrast, the bck2∆ mbp1∆ GAL1pr-WHI512A strain grows very large when switched to galactose and almost entirely arrested in G1, in both raffinose and galactose (Figures 6 and 7). This arrest is most likely due to elevated WHI512A expression, even in raffinose, because the bck2∆ mbp1∆ strain is smaller in raffinose and galactose than in glucose (Supplemental Table S2).
Redundancy in Start activities between Cln3 and Bck2
In the START-2013 model, Cln3 and Bck2 have the same functions (both of them inactivate Whi5 and activate SBF), and they work in parallel. The evidence supporting this assumption of the model is that both single mutants, cln3∆ and bck2∆, result in Start delay and larger cells, and the double mutation is synthetic lethal (Tables 1 and 2; Epstein and Cross, 1994; Wijnen and Futcher, 1999). This synthetic lethality is due to overactive Whi5, as shown by the observation that the cln3∆ bck2∆ whi5∆ strain is viable (Table 2; Costanzo et al., 2004; de Bruin et al., 2004).
Relative Start activities of Cln3 and Bck2
START-2013 also assumes that Cln3 activates SBF and MBF more efficiently than does Bck2, in agreement with our measurements and published results (Wijnen and Futcher, 1999). The cln3∆ mutant is larger than the bck2∆ mutant, cln3∆ mbp1∆ cells are larger than bck2∆ mbp1∆ cells, and the cln3∆ swi4∆ double mutant is dead, whereas the bck2∆ swi4∆ double mutant is viable and appears to be the same size as the swi4∆ single mutant (Table 2; Wijnen and Futcher, 1999). The latter observation also suggests that Bck2 plays only a minor role in MBF-dependent execution of Start—consistent with our model’s predictions (with the current assignments of parameter values).
Relative Start activities of SBF and MBF
Mutants lacking just SBF (swi4∆) are larger than mutants lacking just MBF (mbp1∆), indicating that SBF is more active for Start execution than is MBF (Table 1 and references therein). Consistent with this assumption are the facts that swi4∆ cells are larger than mbp1∆ cells and that cln3∆ mbp1∆ cells are viable, whereas cln3∆ swi4∆ cells are dead. These facts suggest that cells can pass Start with SBF alone even with elevated Whi5 activity, but MBF alone is not sufficient to overcome elevated Whi5 activity (Table 2 and references therein). These differences between SBF and MBF activity in the model are also supported by observations that the products of CLN1,2 (mostly transcribed by SBF) and not CLB5,6 (mostly transcribed by MBF; Bean et al., 2005) are the major drivers of positive feedback at the Start transition (Skotheim et al., 2008; Charvin et al., 2010).
Whi5 inhibition of SBF and MBF
A large component of the cell-size phenotypes we observed in mutant strains could be attributable to increased Whi5 activity. For example, the cln3∆ swi4∆ strain is synthetic lethal, but this mutant combination is rescued by deletion of WHI5 (Table 2). Whi5 binds to SBF and, more weakly, to MBF through Swi6, and Cln3-CDK phosphorylates both Whi5 and Swi6 to initiate Start, with Cln1,2–CDK providing positive feedback (Costanzo et al., 2004; de Bruin et al., 2004; Charvin et al., 2010). The observation that cln3∆ mbp1∆ and bck2∆ mbp1∆ double-mutant strains are the same size as cln3∆ and bck2∆ single-mutant strains, respectively, suggests that neither Cln3 nor Bck2 can activate MBF in the absence of the other (Table 2). Although Whi5 inhibition of MBF is normally weak, these phenotypes could be explained if increased Whi5 activity in cln3∆ or bck2∆ single-mutant cells is sufficient to completely inhibit MBF until the Cln-CDK feedback mechanism kicks in due to SBF activation by Bck2 or Cln3, respectively. Also consistent with this interpretation is the observation that cln3∆ mbp1∆ whi5∆ bck2∆ cells are the same size as cln3∆ whi5∆ bck2∆ cells (Table 2; de Bruin et al., 2004). This scenario also agrees with a normally negligible role for MBF and its main transcriptional target Clb5 in initiating Start via positive feedback, which, in wild-type cells, is dominated by SBF and its main target, Cln2 (Skotheim et al., 2008; Charvin et al., 2010).
START-2013 assumes that Cln3-CDK activates SBF both by phosphorylating and inactivating Whi5 and by phosphorylating and activating SBF (specifically Swi6), to be consistent with Wagner et al. (2009). Nevertheless, we found that cln3∆ mbp1∆ whi5∆ cells are the same size as mbp1∆ cells and smaller than cln3∆ cells (Table 2), arguing against Cln3-CDK activation of SBF in the absence of Whi5. However, the cln3∆ bck2∆ mbp1∆ whi5∆ and cln3∆ bck2∆ whi5∆ strains are the same size as the cln3∆ mutant (Table 2), whereas bck2∆ whi5∆ and cln3∆ whi5∆ strains are wild-type size (Costanzo et al., 2004; de Bruin et al., 2004). Together these observations support the proposal of partial functional redundancy between Cln3 and Bck2 but additionally suggest that Bck2 can fully compensate for the loss of Cln3 only when Whi5 is absent.
Swi4 as a non-SBF transcription factor and the inhibitory roles of Whi5
In the absence of Swi6, the presence or absence of Cln3 has no effect on cell size because, at physiological levels, Whi5 is unable to bind to and inhibit Swi4 (the only active transcription factor for Start in swi6∆ cells; Nasmyth and Dirick, 1991; Wijnen et al., 2002). Our assumption that Swi4 can act alone, in the absence of Swi6, is consistent with the synthetic lethality of the swi4∆ swi6∆ double mutant (Nasmyth and Dirick, 1991; Koch et al., 1993). Bck2 is likely involved in Swi4 activity, as it can bind Swi4, and bck2∆ swi6∆ cells are dead (Wijnen and Futcher, 1999; Breitkreutz et al., 2010). Moreover, Whi5 seems to be unable to bind to Swi4 without Swi6 (Costanzo et al., 2004). These aspects of the model are also supported by the observations that mbp1∆ swi6∆ (not in this study; Koch et al., 1993; Ferrezuelo et al., 2009), cln3∆ swi6∆, cln3∆ mbp1∆ swi6∆, swi6∆ whi5∆, and swi6∆ GAL1pr-WHI5 strains in galactose are all the same size as the swi6∆ single mutant (Tables 1 – 3 and Supplemental Table S2 and references therein). In addition, deletion of WHI5 does not rescue the lethality of bck2∆ swi6∆ (de Bruin et al., 2004) or swi4∆ swi6∆ cells (Table 2), indicating that their lethality is not due to overactive Whi5. Finally, deletion of SWI6 prevents G1 arrest of cln3∆ GAL1pr-WHI5 cells under induced conditions (Figures 8 and 9 and Supplemental Movies S5 and S6).
Nevertheless, the cln3∆ swi6∆ GAL1pr-WHI5 and cln3∆ mbp1∆ swi6∆ GAL1pr-WHI5 mutant strains had larger cells and some level of G1 delay when WHI5 was induced (Supplemental Table S2 and Figures 8 and 9). Studies of Whi5 binding used physiological levels of protein (Costanzo et al., 2004; de Bruin et al., 2004; Travesa et al., 2013). It is possible that overexpressed WHI5 has off-target effects that affect processes not directly regulating the Start transition. More likely, Whi5 probably binds weakly to Swi4, even in the absence of Swi6. Binding of Whi5 to Swi6 alone is weak, and Whi5 and Nrm1 show highly specific binding to SBF and MBF, respectively (Travesa et al., 2013). These observations could indicate that Whi5 simultaneously binds to Swi6 and Swi4 to confer SBF binding specificity. If so, massively overexpressed Whi5 could inhibit Swi4 in the absence of Swi6. Consistent with this interpretation, WHI5 overexpression in a swi4∆ mutant results in larger cells, indicating that large concentrations of WHI5 can bind to MBF—an interaction not easily observed in binding studies (Costanzo et al., 2004; de Bruin et al., 2004). Moreover, long-term WHI5 overexpression increased cell size only in swi6∆ mutants that also lacked Cln3 (Table 3, Supplemental Table S2, and Figure 8). START-2013 assumes that Whi5 does not bind to Swi4 alone and that GAL1pr-WHI5 gives 10-fold the normal concentration of Whi5. In our experiments, the actual induced concentration of Whi5 is probably higher, since native GAL1pr shows up to a 1000-fold induction in 2% galactose compared with glucose-repressed conditions (Adams, 1972). If Whi5 has even a very small rate of association with Swi4 alone, the combination of massive overexpression and lack of phosphorylation by Cln3 could permit Whi5 to bind to Swi4.
Positive feedback in Start
We generated some mutant strains specifically to test START-2013’s representation of the Cln1,2–CDK positive feedback loop. START-2013 predicts that cln1∆ cln2∆ mbp1∆ cells are dead because, in the model, SBF is nearly solely responsible for transcribing CLN1 and CLN2, whereas MBF is nearly solely responsible for transcribing CLB5 and CLB6. Therefore the cln1∆ cln2∆ mbp1∆ strain should be equivalent to swi4∆ mbp1∆ and cln1∆ cln2∆ clb5∆ clb6∆ strains, which are both inviable. In reality, cln1∆ cln2∆ mbp1∆ cells are viable and only marginally larger than cln1∆ cln2∆ cells (Table 2). We discuss the reason for this failure of the model in the Discussion.
Mitotic exit (Finish)
START-2013 predicts that cln1∆ cln2∆ cdh1∆ cells arrest in telophase, but in fact the cells are viable. In the model, cln1∆ cln2∆ cells are larger than normal when they enter M phase (cln1∆ cln2∆ cells are 2.3-fold larger than wild-type cells in the model and 2.7-fold larger than wild type in our observations). Because the rate of Clb2 synthesis is proportional to cell size in our Start models, Clb2 abundance is much higher than normal in cln1∆ cln2∆ cells at the time of mitosis. If one also removes Cdh1, which catalyzes Clb2 ubiquitination and degradation, Clb2 is too abundant for its stoichiometric inhibitor Sic1 to nullify Clb-CDK activity. The inability to clear Clb2 from cells locks the simulated triple mutant in telophase. This problem is directly related to the proportionality of Clb2 concentration to cell size in the model, and it was also a problem with START-2004 (Cross et al., 2002; Chen et al., 2004). For the same reason, START-2013 has a problem with the cdh1∆ GAL1pr-CLN2 strain. In this case, overexpression of CLN2 and the lack of Cdh1 to inhibit Clb5,6-CDK permit premature positive feedback to SBF and MBF and premature phosphorylation and degradation of Sic1 by Clb5,6–CDK. These cells pass Start and enter mitosis at very small size. Because the concentration of Clb2 is very small in model simulations, cells exit mitosis quickly at an unrealistically small cell size (10% of normal size; Table 2). However, as mentioned, CLN2 overexpression in the cdh1∆ mutant has the opposite effect on cell size (Table 3 and Figure 4).
Nucleocytoplasmic transport
Although the double-mutant strains swi4∆ msn5∆ and swi6∆ msn5∆ are reported to be inviable, the START-2013 model predicts viability. We reconstructed these strains, with total gene deletions, and found that they are indeed viable (Table 2). Nuclear export of both Whi5 and Swi6 is mediated by Msn5 (Queralt and Igual, 2003; Taberner et al., 2009). Nucleocytoplasmic shuttling of Swi6, regardless of Msn5, was shown to be important for full SBF activity (Queralt and Igual, 2003). Although Whi5 is exported from the nucleus in response to its phosphorylation by Cln-CDK, it is not clear how important its export is for inactivation, as certain phosphomutants of Whi5 inhibit its export without affecting the Start transition (Wagner et al., 2009). In START-2013’s simulation of the swi4∆ msn5∆ strain, the reduction in Swi6 activity (due to the loss of export) is small and does not recapitulate a lethal swi4∆ swi6∆ phenotype. This strain is simulated to be slightly larger than the swi4∆ single mutant, and it is (Table 2). Meanwhile, the swi6∆ msn5∆ strain has no Swi6 for Whi5 to bind, and the lack of Msn5 is moot. Therefore our simulations show this strain to be the same size as the swi6∆ single mutant, and it is (Table 2).
The original article showing inviability of these mutant strains did not use complete deletions of MSN5 but instead used disruption alleles in which the HIS3 auxotrophic marker was inserted in the MSN5 locus (Alepuz et al., 1999). Two such alleles were used in the Swi6 study, with one retaining up to 689 base pairs of the open reading frame (ORF) and the other up to 237 base pairs of the ORF (Queralt and Igual, 2003). The remaining N-terminal region of Msn5 is known to bind to Ran-GTP, the common regulator of most nucleocytoplasmic protein transport (Alepuz et al., 1999). These small fragments of Msn5 are not functional, but they could be expressed and poison the nuclear transport of other proteins by sequestering significant pools of Ran-GTP, which are needed for other nuclear transport processes. This could explain the observed synthetic lethality of swi4∆ and swi6∆ with disruption alleles of MSN5.
DISCUSSION
The molecular reaction networks that underlie almost all aspects of cell physiology have been painstakingly reconstructed over many decades by the careful experimental work of molecular geneticists, biochemists, and cell biologists. When these results are collected into a comprehensive picture of any particular control mechanism, we are confronted by an extremely complex network of interacting genes and proteins, a network so complex that biochemical intuition alone often fails to provide a comprehensive and reliable understanding of the dynamical implications of the reaction mechanism. To aid our understanding of these networks, systems biologists have turned to mathematical models based on nonlinear ODEs describing the rates of change of every biochemical component of the network. Numerical simulations of these equations determine precisely the consequences of the reaction network, given a “basal set” of kinetic rate constants describing every reaction in the underlying mechanism. These rate constants, of course, have to be estimated from relevant experimental data. Hence we can think of a “model” as a reaction mechanism plus a set of ODEs (describing the kinetics of the reaction mechanism) plus a basal set of parameter values (rate constants) plus a set of experimental constraints (used to estimate the parameter values in the ODEs). Once properly constrained and tested (a necessary first step), the model can be used to make predictions that can be tested experimentally. In the current state of the art, the reliability of model predictions is uncertain. Regardless of whether the model makes reliable predictions or not, we always stand to learn something from novel experimental tests. To the extent that tests confirm the model, we gain some confidence that we may indeed understand something about the true nature of the underlying molecular mechanism. Where the model’s predictions are at odds with experimental observations, we are directed to places where our understanding is defective. In some cases, it is simply a matter of faulty estimation of parameter values and easily corrected. In other cases, we may see that our assumptions about the reaction mechanism are at fault and may be able to correct the mistake to incorporate the new information without compromising the model’s success in accounting for the original experimental constraints. Finally, it may be that the experimental results are incorrect or misinterpreted, which can be addressed by looking more closely at the data that conflict with the model.
In this article, we have attempted to carry out this cycle of “design-simulate-test-reconsider” on a model of the budding yeast cell cycle. The model itself is not the subject of this article but rather the experimental testing procedure and subsequent refinements. The model, which we call START-2013 (Figure 1), is a “working” model (unpublished but freely available on our website). START-2013 has been under development for years as we have tried to understand new experimental evidence appearing regularly in the literature and to design new mutant yeast strains that might be especially relevant to our understanding of the control mechanism. In the work reported here, we constructed and characterized 45 mutant strains of budding yeast (15 entirely new strains not previously described in the literature). In the Results section, we described these mutant phenotypes in detail and what they teach us about the cell cycle control system in budding yeast. In this Discussion, we focus on discrepancies between the model and the new data and how these problems might be resolved in the next version of the START model.
Problems with START-2013 and their solutions
To test START-2013, we determined the cell size distributions of 45 mutant strains, 15 of which were newly generated by us and not previously described in the literature. A further eight strains were previously described only as “viable” or “viable and smaller/larger than wild-type,” without quantitative measurements of cell size. The START-2013 model correctly predicted the cell size/viability of 27 of the 45 strains, including four of 15 new mutants.
From these results, it is clear that START-2013 requires some adjustments. For example, START-2013 underestimates the sizes of all bck2∆ mutants, suggesting that its basal parameter set underestimates the strength of Bck2. Contrary to our evidence, the model predicts that the cln3∆ mbp1∆ strain is inviable (G1 arrest) because Bck2 activation of SBF (the mutant has no MBF) is too weak to support Start in the presence of Whi5. Removing Whi5 or overexpressing Bck2 (cln3∆ mbp1∆ whi5∆ or cln3∆ mbp1∆ GAL1pr-BCK2) is predicted to rescue this lethality. By adjusting parameters so that SBF activation by Bck2 is more efficient, the model’s predictions can be brought in line with our observations of bck2∆ strains, cln3∆ mbp1∆ strains, and bck2∆ mbp1∆ strains (eight strains altogether).
Furthermore, START-2013 predicts lethality of the cln1∆ cln2∆ mbp1∆ strain. Because the model has no activation of CLB5,6 transcription by SBF or of CLN1,2 transcription by MBF, the cln1∆ cln2∆ mbp1∆ strain is functionally equivalent to the lethal swi4∆ mbp1∆ double mutant (Koch et al., 1993). The promoter-binding specificities of SBF and MBF for CLN1,2 and CLB5,6, respectively (along with other genes) have been well documented (Moll et al., 1992; Koch et al., 1993; Iyer et al., 2001; Harris et al., 2013). However, these promoter-binding analyses were not performed in swi4∆ or mbp1∆ mutant strains. In fact, there is considerable transcriptional redundancy shown by SBF in the absence of MBF and vice versa (Koch et al., 1993; Iyer et al., 2001; Bean et al., 2005). By allowing for redundant (but less efficient) transcription of CLB5,6 by SBF and CLN1,2 by MBF, the cln1∆ cln2∆ mbp1∆ strain (in simulations) can express enough Clb5,6-CDK to promote Start and budding. The effects of SBF and MBF with respect to CLN1,2 and CLB5,6 might be better modeled by competition between SBF and MBF for each other’s targets, but the revised version of START-2013 seems to account adequately for their differential effects.
We intend to fully describe and document the revised version of START-2013 (called START-2015 in Tables 1 – 3) in a subsequent publication.
Problems with exit from mitosis (Finish)
Cdh1 plays a significant role in regulating the abundances of Clb proteins, and START-2013 fails to properly simulate some cdh1∆ mutants. In the case of the cln1∆ cln2∆ cdh1∆ strain, cells enter mitosis at an enlarged size due a delayed G1–S transition resulting from defective positive feedback to SBF in the absence of Cln1,2. Because Clb2 synthesis is directly proportional to cell mass in the model, these cells produce excessive amounts of Clb2 and are unable to efficiently remove Clb2 activity when it is time to exit from mitosis because Cdh1 is absent and Sic1 is kept inactive by high Clb2 activity. Hence the cells are predicted to arrest in telophase with high Clb2 activity, but, as a matter of fact, cln1∆ cln2∆ cdh1∆ cells are viable (Cross et al., 2002; Table 2). Of the six Finish mutants that are not correctly simulated by START-2013, four have problems exiting mitosis because Clb2-CDK activity reaches levels that are too large to overcome.
We have developed a more detailed model of exit from mitosis, which simulates cdh1∆ mutants correctly, largely because of an upper limit imposed on the rate of Clb2 synthesis as cells get larger and because of more realistic mechanisms controlling the spindle position checkpoint and the mitotic exit network (Kraikivski et al., 2016).
Conclusion
Because the interactions of genes and proteins in biological control systems are complex, mathematical models are often used to assist—and occasionally challenge—our understanding of such systems. By experimentally testing our mathematical model of the Start transition in budding yeast, we were able to fill in gaps in the existing data and refine the parameter values and assumptions of the model. In addition, we confirmed some predictions of the model that disagreed with published results because these results were incorrectly interpreted. This study demonstrates the advantages of the design-simulate-test-design cycle, which has recently been adopted by synthetic and systems biologists (Cheng and Lu, 2012). The yeast cell cycle has been a classic proving ground for this approach since the START-2000 model (Chen et al., 2000). A deeper understanding of the Start transition in budding yeast is of particular significance to human health because the Start transition bears many striking similarities to the mammalian restriction point, particularly with regard to network architecture (Johnson and Skotheim, 2013). Many of the principles derived from studying cell cycle control in yeast are applicable to human cell cycle control and diseases such as cancer.
MATERIALS AND METHODS
Strains and growth conditions
The S. cerevisiae strains studied here are all BY4741/2 derivatives (Supplemental Table S3). Single mutants were obtained from Open Biosystems (GE Dharmacon, Lafayette, CO) or generated by PCR cassette deletion (Longtine et al., 1998). These strains contain complete deletions of ORFs replaced with the kanMX dominant antibiotic (G418) selection cassette. The marker cassette of MATα strains was switched to nat1 (nourseothricin), hph (hygromycin B), or URA3MX (URA3 flanked by TEF1 promoter and terminator) to facilitate selection of diploids from mating reactions to MATa orf∆::kanMX deletion strains (Goldstein and McCusker, 1999). Except for the cln1∆ cln2∆ mutant (JPY1015), all double, triple, and quadruple mutants were generated by standard genetic crosses followed by tetrad dissection and analysis (Burke et al., 2000). JPY1015 was generated by PCR cassette deletion (cln1∆::hphMX) in a MATa cln2∆::kanMX strain. Presence of the proper deletion alleles was confirmed by PCR of genomic DNA using primers for the wild-type and deletion alleles both before and after crosses were performed. Overexpression strains carried plasmids (Supplemental Table S4) in which BCK2, CLN2, WHI5, or WHI512A is expressed from the GAL1 promoter (GAL1pr, abbreviated to GAL in tables and figures). The GAL1pr-BCK2 and GAL1pr-CLN2 plasmids were purchased from Open Biosystems. In these plasmids, the ORFs are cloned into BG1805 and have C-terminal hexahistidine-hemagglutinin-prA tags (Gelperin et al., 2005). GAL1pr-WHI5 and GAL1pr- WHI512A are in a pRS313-derived plasmid and were a gift from Mike Tyers (Université de Montréal, Montreal, Canada; Costanzo et al., 2004). Plasmids were introduced into yeast by lithium acetate transformation (Gietz and Schiestl, 2007).
Cultures of mutant strains were grown at 30°C in rich medium (yeast extract/peptone/dextrose) for propagation. For propagation, overexpression strains were grown at 30°C in synthetic complete medium (SC) with 2% glucose and lacking uracil (SD-Ura; GAL1pr-BCK2, GAL1pr-CLN2), histidine (SD-His; GALpr-WHI5, GAL1pr- WHI512A), or leucine (SD-Leu; GAL1pr-WHI5-FLAG). In preparation for experiments, mutant strains were grown overnight in SD medium and overexpression strains were grown in the appropriate synthetic medium with 2% raffinose instead of glucose. Overnight cultures were diluted to an OD600 of ∼0.1 and allowed to grow for two generations before loading onto a CellASIC microfluidics plate (EMD Millipore, Billerica, MA) along with appropriate prewarmed medium (well 1, SC + 2% glucose or raffinose; well 2, SC + 2% raffinose/2% galactose). Changes of medium were programmed in software as described (Ball et al., 2014).
For growth assays performed on plates, cultures were grown in the appropriate liquid synthetic medium with 2% glucose to an OD600 ∼ 1. These cells were centrifuged, washed once in sterile water, and resuspended in water. We then made one-fourth serial dilutions in water, starting with a dilution of 1.024 × 10³ cells/ml. We spotted 10 μl of each dilution in rows on the plates. After the spots had dried, plates were incubated at 30°C. Growth rates on the different sugars varied significantly, so plates were scanned when the largest isolated colonies on each plate were ∼ 1 mm in diameter or after 5 d.
Cell cycle analysis
For determination of the steady-state phenotypes of overexpression strains, we grew cells overnight at 24°C in 2% glucose-containing selective defined media (SD-Ura or SD-His; overexpression strains) or in SD complete (deletion strains). We then reinoculated into fresh SD media or the appropriate Sraff or Sgal medium for growth at 30°C for 16 h and removed aliquots to be processed for cell size measurements, flow cytometry analysis of DNA content, and bud morphology analysis (budding index).
Cell size measurements.
Cell sizes were measured on a Moxi Flow (Orflo) cell counter using MF-S cassettes. This system uses the Coulter principle to determine particle size by electrical impedance. Cell size distributions were analyzed after importing the Moxi Flow files into Vestigo2D 1.0 (Orflo Technologies, Ketchum, KY), which runs on the Igor 6.36 platform (Wavemetrics, Portland, OR).
DNA content measurements.
Samples for flow cytometry analysis of DNA content were sonicated, pelleted, resuspended in 1 ml of RNase A (Sigma-Aldrich, St. Louis, MO) solution (50 mM Tris-Cl, pH 8.0, 15 mM NaCl, 2 mg/mL RNase A), and incubated at 37°C for 4 h (Haase and Reed, 2002). After incubation, proteinase K (New England Biolabs, Ipswich, MA) was added directly to the solution to a final concentration of 200 μg/ml, and the tube was incubated at 37°C for a further 1 h. Cells were then centrifuged, resuspended in 50 mM Tris-Cl, pH 8.0, and stained for immediate fluorescence-activated cell sorting (FACS) analysis or stored at 4°C. DNA staining was accomplished by adding 100 μl of cells to 1 ml of SYTOX Green (Invitrogen, Thermo Fisher Scientific, Waltham, MA) solution (1 μM SYTOX Green in 50 mM Tris-Cl, pH 8.0). The stained cells were briefly sonicated, and FACS analysis was performed on a BD LSR II (Becton Dickinson, Franklin Lakes, NJ) using the argon laser (488 nm) and fluorescein isothiocyanate filter (505-nm low-pass splitter and 525/50-nm band-pass filter). Data were collected and analyzed with BD FACSDiva 7.0 and analyzed using the open-source software Flowing 2.5.1.
Imaging
All live-cell time-lapse images were collected on an Axio Observer Z.1 microscope (Carl Zeiss MicroImaging, Jena, Germany) equipped with a halogen lamp for bright-field imaging and a 120-W metal halide lamp (X-cite 120 PC; EXFO Photonic Solutions) for fluorescence excitation. The microscope and CellASIC Onix microfluidic platform in which the cells were growing was controlled by custom software, GenoSIGHT, developed in MATLAB, which relies on the API of the open-source microscopy control software, μManager (Edelstein et al., 2010; Ball et al., 2014). All time-lapse images were collected with a 63× Ph3 phase contrast objective (LCI Plan-Neofluar 63×/1.3 Imm Corr Ph3; Carl Zeiss MicroImaging) and a CoolSNAP HQ2 camera (Photometrics, Tucson, AZ). QuickTime movies (see supplemental movies) were rendered in ImageJ, version 1.48c (National Institutes of Health, Bethesda, MD). DIC images were collected on an Axioskop 2 Plus microscope (Carl Zeiss MicroImaging) equipped with a halogen lamp for bright-field imaging. All DIC images were collected with a 63× objective (Plan-Apochromat 63×/1.4 Oil Ph3Carl Zeiss MicroImaging) and Retiga 1300C camera (Q-imaging), using NIS-Elements 2.3.0 (Nikon).
Image processing and cell identification
Phase contrast images are segmented, as described (Ball et al., 2014), using custom software derived from Yeast Tree 1.6.3 (Bean et al., 2006). The application relies on the MATLAB Image Processing toolbox. First, the function imfill is used to flood-fill local minima not connected to the image border, which fills in the center of groups of cells. Because each group of cells will have slightly different levels to which the flood-fill will rise, we then search the image histogram for intensities greater than the calculated background, taken from the border pixels, and with a frequency greater than the minimum cell area, generally set to 200 pixels. To keep only large groups of connected pixels, an erosion (built-in function imerode) is performed, removing the outermost pixels of a region and eliminating small groups of pixels. The next step is to separate these groups into individual cells. This is done with another call to imerode to cut the small necks that appear between touching cells. Once the cells are cut, the remaining connected regions are labeled with a call to the built-in function bwlabel, which identifies the individual cells and assigns each with a unique label. To finish, the cells are returned to their original sizes with a dilation (built-in function imdilate), which adds pixels around the edges of each cell. Cell volumes are automatically calculated using measurements of the short (w) and long (l) axes of the cells, assuming ellipsoid cells (V = 4/3 × πlw2).
Statistical analysis
To test for statistically significant differences between the sizes of mutant and wild-type cells, we need a statistical test that judges size differences between biological replicates of the same strain to be statistically insignificant. Owing to the large number of cells we measured, significance-level tests, such as the two-sample Kolmogorov–Smirnov test or the Student’s t test, are not useful because they generate very small p values (p < 10−4) between the mean sizes of biological replicates of the same strain. Even though the p values for comparisons between mean sizes of wild-type and mutant cells are even smaller (p < 10−6), the significance of these differences is hard to judge. For our purposes, we find that Cohen’s d effect-size statistic is more useful to determine the extent of mean cell size differences between strains (Cohen, 1988). To obtain population means and standard deviations, we log-transformed the cell size data for each biological replicate and for pooled replicates to obtain normal or near-normal distributions (Supplemental Figures S4 and S5). Using the log-normalized data, we calculated Cohen’s d according to the formula
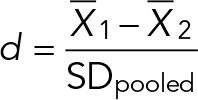 |
where
 |
By convention, effect sizes are considered small for d ≤ 0.2, medium for 0.2 < d < 0.8, and large for d ≥ 0.8 (Cohen, 1988). This convention is appropriate for our data because when we compared biological replicates of the same strain, d ≤ 0.2 in 90% of pairings and d ≤ 0.4 for all pairings of biological replicates of the same strain.
Model development and parameterization
Our website (tysonlab.biol.vt.edu/research/start_transition) provides full details of START-2013, including 1) the complete reaction mechanisms, 2) the full set of ∼100 ODEs and algebraic equations, 3) the set of ∼200 basal parameter values (kinetic rate constants describing wild-type cells), 4) the rules for simulating each type of mutation (deletion and overexpression strains, nonphosphorylatable proteins, nondegradable proteins, etc.), 5) simulations of all 228 mutant strains in the set of experimental constraints on the model, and 6) simulations of the 15 novel mutant strains considered in this study.
The ODEs were derived from the reaction mechanism by standard principles of biochemical kinetics, as practiced in START-2000 (Chen et al., 2000) and START-2004 (Chen et al., 2004). The basal parameter values were determined by manually fitting ODE simulations to the observed phenotypes of the 228 mutant strains in the constraint set. Manual fitting is difficult, to be sure, but not impossible, because START-2013 inherits many reactions (and rate constants) from START-2004, which inherited them from earlier models in the sequence. In years of trying, we have not found automatic parameter estimation tools that work reliably on complex reaction mechanisms with hundreds of undetermined parameters. We do not claim that the basal parameter set is optimal or unique, only that it is successful in accounting for the phenotypic characteristics of 214 of the 228 mutant strains in the constraining data set. Any of the 14 strains not correctly simulated by the model could be accounted for, but not without introducing other, more serious discrepancies between the model and the constraining data set.
We have used the model to simulate many novel combinations of mutant genes. For the purposes of this article, we chose 15 novel strains for experimental testing. We also studied eight strains for which the model is at odds with published experiments, and we characterized another 22 strains that serve as controls.
Supplementary Material
Acknowledgments
We thank Dan Burke (North Carolina State University, Raleigh, NC) for temporary use of his tetrad dissection microscope and advice on sporulation, Mike Tyers (Université de Montréal, Canada) for providing WHI5 plasmids, Chris Franck for advice on statistical analysis, and Shiv Kale for help in acquiring the flow cytometry data. This work was funded by National Institutes of Health Grants RO1-GM078989 and RO1-GM095955.
Abbreviations used:
- CDK
cyclin-dependent protein kinase
- MBF
MCB-binding factor
- SBF
SCB-binding factor.
Footnotes
This article was published online ahead of print in MBoC in Press (http://www.molbiolcell.org/cgi/doi/10.1091/mbc.E15-06-0358) on August 26, 2015.
REFERENCES
- Adams BG. Induction of galactokinase in Saccharomyces cerevisiae: kinetics of induction and glucose effects. J Bacteriol. 1972;111:308–315. doi: 10.1128/jb.111.2.308-315.1972. [DOI] [PMC free article] [PubMed] [Google Scholar]
- Alberghina L, Rossi RL, Querin L, Wanke V, Vanoni M. A cell sizer network involving Cln3 and Far1 controls entrance into S phase in the mitotic cycle of budding yeast. J Cell Biol. 2004;167:433–443. doi: 10.1083/jcb.200405102. [DOI] [PMC free article] [PubMed] [Google Scholar]
- Alepuz PM, Matheos D, Cunningham KW, Estruch F. The Saccharomyces cerevisiae RanGTP-binding protein msn5p is involved in different signal transduction pathways. Genetics. 1999;153:1219–1231. doi: 10.1093/genetics/153.3.1219. [DOI] [PMC free article] [PubMed] [Google Scholar]
- Amon A, Tyers M, Futcher B, Nasmyth K. Mechanisms that help the yeast cell cycle clock tick: G2 cyclins transcriptionally activate G2 cyclins and repress G1 cyclins. Cell. 1993;74:993–1007. doi: 10.1016/0092-8674(93)90722-3. [DOI] [PubMed] [Google Scholar]
- Andrews BJ, Moore LA. Interaction of the yeast Swi4 and Swi6 cell cycle regulatory proteins in vitro. Proc Natl Acad Sci USA. 1992;89:11852–11856. doi: 10.1073/pnas.89.24.11852. [DOI] [PMC free article] [PubMed] [Google Scholar]
- Ball DA, Lux MW, Adames NR, Peccoud J. Adaptive imaging cytometry to estimate parameters of gene networks models in systems and synthetic biology. PLoS One. 2014;9:e107087. doi: 10.1371/journal.pone.0107087. [DOI] [PMC free article] [PubMed] [Google Scholar]
- Baroni MD, Monti P, Marconi G, Alberghina L. cAMP-mediated increase in the critical cell size required for the G1 to S transition in Saccharomyces cerevisiae. Exp Cell Res. 1992;201:299–306. doi: 10.1016/0014-4827(92)90277-f. [DOI] [PubMed] [Google Scholar]
- Bean JM, Siggia ED, Cross FR. High functional overlap between MluI cell-cycle box binding factor and Swi4/6 cell-cycle box binding factor in the G1/S transcriptional program in Saccharomyces cerevisiae. Genetics. 2005;171:49–61. doi: 10.1534/genetics.105.044560. [DOI] [PMC free article] [PubMed] [Google Scholar]
- Bean JM, Siggia ED, Cross FR. Coherence and timing of cell cycle start examined at single-cell resolution. Mol Cell. 2006;21:3–14. doi: 10.1016/j.molcel.2005.10.035. [DOI] [PubMed] [Google Scholar]
- Breitkreutz A, Choi H, Sharom JR, Boucher L, Neduva V, Larsen B, Lin ZY, Breitkreutz BJ, Stark C, Liu G, et al. A global protein kinase and phosphatase interaction network in yeast. Science. 2010;328:1043–1046. doi: 10.1126/science.1176495. [DOI] [PMC free article] [PubMed] [Google Scholar]
- Brewer BJ, Chlebowicz-Sledziewska E, Fangman WL. Cell cycle phases in the unequal mother/daughter cell cycles of Saccharomyces cerevisiae. Mol Cell Biol. 1984;4:2529–2531. doi: 10.1128/mcb.4.11.2529. [DOI] [PMC free article] [PubMed] [Google Scholar]
- Burke D, Dawson D, Stearns T. Methods in Yeast Genetics. Plainview, NY: Cold Spring Harbor Laboratory Press; 2000. [Google Scholar]
- Burke DJ. Complexity in the spindle checkpoint. Curr Opin Genet Dev. 2000;10:26–31. doi: 10.1016/s0959-437x(99)00040-4. [DOI] [PubMed] [Google Scholar]
- Calvert GR, Dawes IW. Cell size control of development in Saccharomyces cerevisiae. Nature. 1984;312:61–63. doi: 10.1038/312061a0. [DOI] [PubMed] [Google Scholar]
- Caudron F, Barral Y. A super-assembly of Whi3 encodes memory of deceptive encounters by single cells during yeast courtship. Cell. 2013;155:1244–1257. doi: 10.1016/j.cell.2013.10.046. [DOI] [PubMed] [Google Scholar]
- Charvin G, Oikonomou C, Siggia ED, Cross FR. Origin of irreversibility of cell cycle start in budding yeast. PLoS Biol. 2010;8:e1000284. doi: 10.1371/journal.pbio.1000284. [DOI] [PMC free article] [PubMed] [Google Scholar]
- Chen KC, Calzone L, Csikasz-Nagy A, Cross FR, Novak B, Tyson JJ. Integrative analysis of cell cycle control in budding yeast. Mol Biol Cell. 2004;15:3841–3862. doi: 10.1091/mbc.E03-11-0794. [DOI] [PMC free article] [PubMed] [Google Scholar]
- Chen KC, Csikasz-Nagy A, Gyorffy B, Val J, Novak B, Tyson JJ. Kinetic analysis of a molecular model of the budding yeast cell cycle. Mol Biol Cell. 2000;11:369–391. doi: 10.1091/mbc.11.1.369. [DOI] [PMC free article] [PubMed] [Google Scholar]
- Cheng AA, Lu TK. Synthetic biology: an emerging engineering discipline. Annu Rev Biomed Eng. 2012;14:155–178. doi: 10.1146/annurev-bioeng-071811-150118. [DOI] [PubMed] [Google Scholar]
- Cohen J. Statistical Power Analysis for the Behavioral Sciences. Hillsdale, NJ: Erlbaum; 1988. [Google Scholar]
- Colomina N, Ferrezuelo F, Verges E, Aldea M, Gari E. Whi3 regulates morphogenesis in budding yeast by enhancing Cdk functions in apical growth. Cell Cycle. 2009;8:1912–1920. doi: 10.4161/cc.8.12.8740. [DOI] [PubMed] [Google Scholar]
- Costanzo M, Nishikawa JL, Tang X, Millman JS, Schub O, Breitkreuz K, Dewar D, Rupes I, Andrews B, Tyers M. CDK activity antagonizes Whi5, an inhibitor of G1/S transcription in yeast. Cell. 2004;117:899–913. doi: 10.1016/j.cell.2004.05.024. [DOI] [PubMed] [Google Scholar]
- Cross FR. DAF1, a mutant gene affecting size control, pheromone arrest, and cell cycle kinetics of Saccharomyces cerevisiae. Mol Cell Biol. 1988;8:4675–4684. doi: 10.1128/mcb.8.11.4675. [DOI] [PMC free article] [PubMed] [Google Scholar]
- Cross FR, Archambault V, Miller M, Klovstad M. Testing a mathematical model of the yeast cell cycle. Mol Biol Cell. 2002;13:52–70. doi: 10.1091/mbc.01-05-0265. [DOI] [PMC free article] [PubMed] [Google Scholar]
- Cross FR, Schroeder L, Kruse M, Chen KC. Quantitative characterization of a mitotic cyclin threshold regulating exit from mitosis. Mol Biol Cell. 2005;16:2129–2138. doi: 10.1091/mbc.E04-10-0897. [DOI] [PMC free article] [PubMed] [Google Scholar]
- Csikasz-Nagy A, Battogtokh D, Chen KC, Novak B, Tyson JJ. Analysis of a generic model of eukaryotic cell-cycle regulation. Biophys J. 2006;90:4361–4379. doi: 10.1529/biophysj.106.081240. [DOI] [PMC free article] [PubMed] [Google Scholar]
- de Bruin RA, McDonald WH, Kalashnikova TI, Yates J, 3rd, Wittenberg C. Cln3 activates G1-specific transcription via phosphorylation of the SBF bound repressor Whi5. Cell. 2004;117:887–898. doi: 10.1016/j.cell.2004.05.025. [DOI] [PubMed] [Google Scholar]
- Dirick L, Bohm T, Nasmyth K. Roles and regulation of Cln-Cdc28 kinases at the start of the cell cycle of Saccharomyces cerevisiae. EMBO J. 1995;14:4803–4813. doi: 10.1002/j.1460-2075.1995.tb00162.x. [DOI] [PMC free article] [PubMed] [Google Scholar]
- Edelstein A, Amodaj N, Hoover K, Vale R, Stuurman N. Curr Protoc Mol Biol. 2010. Computer control of microscopes using microManager. Chapter 14, Unit 14.20. [DOI] [PMC free article] [PubMed] [Google Scholar]
- Epstein CB, Cross FR. Genes that can bypass the CLN requirement for Saccharomyces cerevisiae cell cycle START. Mol Cell Biol. 1994;14:2041–2047. doi: 10.1128/mcb.14.3.2041. [DOI] [PMC free article] [PubMed] [Google Scholar]
- Ferrezuelo F, Aldea M, Futcher B. Bck2 is a phase-independent activator of cell cycle-regulated genes in yeast. Cell Cycle. 2009;8:239–252. doi: 10.4161/cc.8.2.7543. [DOI] [PubMed] [Google Scholar]
- Ferrezuelo F, Colomina N, Palmisano A, Gari E, Gallego C, Csikasz-Nagy A, Aldea M. The critical size is set at a single-cell level by growth rate to attain homeostasis and adaptation. Nat Commun. 2012;3:1012. doi: 10.1038/ncomms2015. [DOI] [PubMed] [Google Scholar]
- Futcher AB. Saccharomyces cerevisiae cell cycle: cdc28 and the G1 cyclins. Semin Cell Biol. 1991;2:205–212. [PubMed] [Google Scholar]
- Gari E, Volpe T, Wang H, Gallego C, Futcher B, Aldea M. Whi3 binds the mRNA of the G1 cyclin CLN3 to modulate cell fate in budding yeast. Genes Dev. 2001;15:2803–2808. doi: 10.1101/gad.203501. [DOI] [PMC free article] [PubMed] [Google Scholar]
- Gelperin DM, White MA, Wilkinson ML, Kon Y, Kung LA, Wise KJ, Lopez-Hoyo N, Jiang L, Piccirillo S, Yu H, et al. Biochemical and genetic analysis of the yeast proteome with a movable ORF collection. Genes Dev. 2005;19:2816–2826. doi: 10.1101/gad.1362105. [DOI] [PMC free article] [PubMed] [Google Scholar]
- Gerard C, Goldbeter A. Temporal self-organization of the cyclin/Cdk network driving the mammalian cell cycle. Proc Natl Acad Sci USA. 2009;106:21643–21648. doi: 10.1073/pnas.0903827106. [DOI] [PMC free article] [PubMed] [Google Scholar]
- Ghiara JB, Richardson HE, Sugimoto K, Henze M, Lew DJ, Wittenberg C, Reed SI. A cyclin B homolog in S. cerevisiae: chronic activation of the Cdc28 protein kinase by cyclin prevents exit from mitosis. Cell. 1991;65:163–174. doi: 10.1016/0092-8674(91)90417-w. [DOI] [PubMed] [Google Scholar]
- Gietz RD, Schiestl RH. Frozen competent yeast cells that can be transformed with high efficiency using the LiAc/SS carrier DNA/PEG method. Nat Protoc. 2007;2:1–4. doi: 10.1038/nprot.2007.17. [DOI] [PubMed] [Google Scholar]
- Goldstein AL, McCusker JH. Three new dominant drug resistance cassettes for gene disruption in Saccharomyces cerevisiae. Yeast. 1999;15:1541–1553. doi: 10.1002/(SICI)1097-0061(199910)15:14<1541::AID-YEA476>3.0.CO;2-K. [DOI] [PubMed] [Google Scholar]
- Haase SB, Reed SI. Improved flow cytometric analysis of the budding yeast cell cycle. Cell Cycle. 2002;1:132–136. [PubMed] [Google Scholar]
- Hadwiger JA, Wittenberg C, Richardson HE, de Barros Lopes M, Reed SI. A family of cyclin homologs that control the G1 phase in yeast. Proc Natl Acad Sci USA. 1989;86:6255–6259. doi: 10.1073/pnas.86.16.6255. [DOI] [PMC free article] [PubMed] [Google Scholar]
- Hall DD, Markwardt DD, Parviz F, Heideman W. Regulation of the Cln3-Cdc28 kinase by cAMP in Saccharomyces cerevisiae. EMBO J. 1998;17:4370–4378. doi: 10.1093/emboj/17.15.4370. [DOI] [PMC free article] [PubMed] [Google Scholar]
- Harris MR, Lee D, Farmer S, Lowndes NF, de Bruin RA. Binding specificity of the G1/S transcriptional regulators in budding yeast. PLoS One. 2013;8:e61059. doi: 10.1371/journal.pone.0061059. [DOI] [PMC free article] [PubMed] [Google Scholar]
- Iyer VR, Horak CE, Scafe CS, Botstein D, Snyder M, Brown PO. Genomic binding sites of the yeast cell-cycle transcription factors SBF and MBF. Nature. 2001;409:533–538. doi: 10.1038/35054095. [DOI] [PubMed] [Google Scholar]
- Johnson A, Skotheim JM. Start and the restriction point. Curr Opin Cell Biol. 2013;25:717–723. doi: 10.1016/j.ceb.2013.07.010. [DOI] [PMC free article] [PubMed] [Google Scholar]
- Jorgensen P, Nishikawa JL, Breitkreutz BJ, Tyers M. Systematic identification of pathways that couple cell growth and division in yeast. Science. 2002;297:395–400. doi: 10.1126/science.1070850. [DOI] [PubMed] [Google Scholar]
- Kapuy O, He E, Lopez-Aviles S, Uhlmann F, Tyson JJ, Novak B. System-level feedbacks control cell cycle progression. FEBS Lett. 2009;583:3992–3998. doi: 10.1016/j.febslet.2009.08.023. [DOI] [PMC free article] [PubMed] [Google Scholar]
- Koch C, Moll T, Neuberg M, Ahorn H, Nasmyth K. A role for the transcription factors Mbp1 and Swi4 in progression from G1 to S phase. Science. 1993;261:1551–1557. doi: 10.1126/science.8372350. [DOI] [PubMed] [Google Scholar]
- Koch C, Schleiffer A, Ammerer G, Nasmyth K. Switching transcription on and off during the yeast cell cycle: Cln/Cdc28 kinases activate bound transcription factor SBF (Swi4/Swi6) at start, whereas Clb/Cdc28 kinases displace it from the promoter in G2. Genes Dev. 1996;10:129–141. doi: 10.1101/gad.10.2.129. [DOI] [PubMed] [Google Scholar]
- Koivomagi M, Valk E, Venta R, Iofik A, Lepiku M, Balog ER, Rubin SM, Morgan DO, Loog M. Cascades of multisite phosphorylation control Sic1 destruction at the onset of S phase. Nature. 2011;480:128–131. doi: 10.1038/nature10560. [DOI] [PMC free article] [PubMed] [Google Scholar]
- Kraikivski P, Chen KC, Laomettachit T, Murali TM, Tyson JJ. From Start to Finish: computational analysis of cell cycle control in budding yeast. Syst Biol Appl. 2016 doi: 10.1038/npjsba.2015.16. (in press) [DOI] [PMC free article] [PubMed] [Google Scholar]
- Levin DE. Regulation of cell wall biogenesis in Saccharomyces cerevisiae: the cell wall integrity signaling pathway. Genetics. 2011;189:1145–1175. doi: 10.1534/genetics.111.128264. [DOI] [PMC free article] [PubMed] [Google Scholar]
- Lew DJ. The morphogenesis checkpoint: how yeast cells watch their figures. Curr Opin Cell Biol. 2003;15:648–653. doi: 10.1016/j.ceb.2003.09.001. [DOI] [PubMed] [Google Scholar]
- Lew DJ, Reed SI. Morphogenesis in the yeast cell cycle: regulation by Cdc28 and cyclins. J Cell Biol. 1993;120:1305–1320. doi: 10.1083/jcb.120.6.1305. [DOI] [PMC free article] [PubMed] [Google Scholar]
- Li F, Long T, Lu Y, Ouyang Q, Tang C. The yeast cell-cycle network is robustly designed. Proc Natl Acad Sci USA. 2004;101:4781–4786. doi: 10.1073/pnas.0305937101. [DOI] [PMC free article] [PubMed] [Google Scholar]
- Longtine MS, McKenzie A, 3rd, Demarini DJ, Shah NG, Wach A, Brachat A, Philippsen P, Pringle JR. Additional modules for versatile and economical PCR-based gene deletion and modification in Saccharomyces cerevisiae. Yeast. 1998;14:953–961. doi: 10.1002/(SICI)1097-0061(199807)14:10<953::AID-YEA293>3.0.CO;2-U. [DOI] [PubMed] [Google Scholar]
- Lopez-Aviles S, Kapuy O, Novak B, Uhlmann F. Irreversibility of mitotic exit is the consequence of systems-level feedback. Nature. 2009;459:592–595. doi: 10.1038/nature07984. [DOI] [PMC free article] [PubMed] [Google Scholar]
- Lorincz AT, Reed SI. Primary structure homology between the product of yeast cell division control gene CDC28 and vertebrate oncogenes. Nature. 1984;307:183–185. doi: 10.1038/307183a0. [DOI] [PubMed] [Google Scholar]
- Lu LX, Domingo-Sananes MR, Huzarska M, Novak B, Gould KL. Multisite phosphoregulation of Cdc25 activity refines the mitotic entrance and exit switches. Proc Natl Acad Sci USA. 2012;109:9899–9904. doi: 10.1073/pnas.1201366109. [DOI] [PMC free article] [PubMed] [Google Scholar]
- Lydall D, Weinert T. G2/M checkpoint genes of Saccharomyces cerevisiae: further evidence for roles in DNA replication and/or repair. Mol Gen Genet. 1997;256:638–651. doi: 10.1007/s004380050612. [DOI] [PubMed] [Google Scholar]
- Mizunuma M, Tsubakiyama R, Ogawa T, Shitamukai A, Kobayashi Y, Inai T, Kume K, Hirata D. Ras/cAMP-dependent protein kinase (PKA) regulates multiple aspects of cellular events by phosphorylating the Whi3 cell cycle regulator in budding yeast. J Biol Chem. 2013;288:10558–10566. doi: 10.1074/jbc.M112.402214. [DOI] [PMC free article] [PubMed] [Google Scholar]
- Moll T, Dirick L, Auer H, Bonkovsky J, Nasmyth K. SWI6 is a regulatory subunit of two different cell cycle START-dependent transcription factors in Saccharomyces cerevisiae. J Cell Sci Suppl. 1992;16:87–96. doi: 10.1242/jcs.1992.supplement_16.11. [DOI] [PubMed] [Google Scholar]
- Moll T, Schwob E, Koch C, Moore A, Auer H, Nasmyth K. Transcription factors important for starting the cell cycle in yeast. Philos Trans R Soc Lond B Biol Sci. 1993;340:351–360. doi: 10.1098/rstb.1993.0078. [DOI] [PubMed] [Google Scholar]
- Moore SA. Kinetic evidence for a critical rate of protein synthesis in the Saccharomyces cerevisiae yeast cell cycle. J Biol Chem. 1988;263:9674–9681. [PubMed] [Google Scholar]
- Morgan BA, Bouquin N, Merrill GF, Johnston LH. A yeast transcription factor bypassing the requirement for SBF and DSC1/MBF in budding yeast has homology to bacterial signal transduction proteins. EMBO J. 1995;14:5679–5689. doi: 10.1002/j.1460-2075.1995.tb00255.x. [DOI] [PMC free article] [PubMed] [Google Scholar]
- Nash RS, Volpe T, Futcher B. Isolation and characterization of WHI3, a size-control gene of Saccharomyces cerevisiae. Genetics. 2001;157:1469–1480. doi: 10.1093/genetics/157.4.1469. [DOI] [PMC free article] [PubMed] [Google Scholar]
- Nasmyth K, Dirick L. The role of SWI4 and SWI6 in the activity of G1 cyclins in yeast. Cell. 1991;66:995–1013. doi: 10.1016/0092-8674(91)90444-4. [DOI] [PubMed] [Google Scholar]
- Novak B, Tyson JJ, Gyorffy B, Csikasz-Nagy A. Irreversible cell-cycle transitions are due to systems-level feedback. Nat Cell Biol. 2007;9:724–728. doi: 10.1038/ncb0707-724. [DOI] [PubMed] [Google Scholar]
- Primig M, Sockanathan S, Auer H, Nasmyth K. Anatomy of a transcription factor important for the start of the cell cycle in Saccharomyces cerevisiae. Nature. 1992;358:593–597. doi: 10.1038/358593a0. [DOI] [PubMed] [Google Scholar]
- Queralt E, Igual JC. Cell cycle activation of the Swi6p transcription factor is linked to nucleocytoplasmic shuttling. Mol Cell Biol. 2003;23:3126–3140. doi: 10.1128/MCB.23.9.3126-3140.2003. [DOI] [PMC free article] [PubMed] [Google Scholar]
- Reed SI, Hadwiger JA, Lorincz AT. Protein kinase activity associated with the product of the yeast cell division cycle gene CDC28. Proc Natl Acad Sci USA. 1985;82:4055–4059. doi: 10.1073/pnas.82.12.4055. [DOI] [PMC free article] [PubMed] [Google Scholar]
- Reed SI, Wittenberg C. Mitotic role for the Cdc28 protein kinase of Saccharomyces cerevisiae. Proc Natl Acad Sci USA. 1990;87:5697–5701. doi: 10.1073/pnas.87.15.5697. [DOI] [PMC free article] [PubMed] [Google Scholar]
- Rupes I. Checking cell size in yeast. Trends Genet. 2002;18:479–485. doi: 10.1016/s0168-9525(02)02745-2. [DOI] [PubMed] [Google Scholar]
- Schwab M, Lutum AS, Seufert W. Yeast Hct1 is a regulator of Clb2 cyclin proteolysis. Cell. 1997;90:683–693. doi: 10.1016/s0092-8674(00)80529-2. [DOI] [PubMed] [Google Scholar]
- Schwob E, Nasmyth K. CLB5 and CLB6, a new pair of B cyclins involved in DNA replication in Saccharomyces cerevisiae. Genes Dev. 1993;7:1160–1175. doi: 10.1101/gad.7.7a.1160. [DOI] [PubMed] [Google Scholar]
- Sillje HH, ter Schure EG, Rommens AJ, Huls PG, Woldringh CL, Verkleij AJ, Boonstra J, Verrips CT. Effects of different carbon fluxes on G1 phase duration, cyclin expression, and reserve carbohydrate metabolism in Saccharomyces cerevisiae. J Bacteriol. 1997;179:6560–6565. doi: 10.1128/jb.179.21.6560-6565.1997. [DOI] [PMC free article] [PubMed] [Google Scholar]
- Singhania R, Sramkoski RM, Jacobberger JW, Tyson JJ. A hybrid model of mammalian cell cycle regulation. PLoS Comput Biol. 2011;7:e1001077. doi: 10.1371/journal.pcbi.1001077. [DOI] [PMC free article] [PubMed] [Google Scholar]
- Skotheim JM, Di Talia S, Siggia ED, Cross FR. Positive feedback of G1 cyclins ensures coherent cell cycle entry. Nature. 2008;454:291–296. doi: 10.1038/nature07118. [DOI] [PMC free article] [PubMed] [Google Scholar]
- Straight AF, Murray AW. The spindle assembly checkpoint in budding yeast. Methods Enzymol. 1997;283:425–440. doi: 10.1016/s0076-6879(97)83035-2. [DOI] [PubMed] [Google Scholar]
- Surana U, Robitsch H, Price C, Schuster T, Fitch I, Futcher AB, Nasmyth K. The role of CDC28 and cyclins during mitosis in the budding yeast S. cerevisiae. Cell. 1991;65:145–161. doi: 10.1016/0092-8674(91)90416-v. [DOI] [PubMed] [Google Scholar]
- Taberner FJ, Quilis I, Igual JC. Spatial regulation of the start repressor Whi5. Cell Cycle. 2009;8:3010–3018. [PubMed] [Google Scholar]
- Takahata S, Yu Y, Stillman DJ. The E2F functional analogue SBF recruits the Rpd3(L) HDAC, via Whi5 and Stb1, and the FACT chromatin reorganizer, to yeast G1 cyclin promoters. EMBO J. 2009;28:3378–3389. doi: 10.1038/emboj.2009.270. [DOI] [PMC free article] [PubMed] [Google Scholar]
- Taylor SS. Chromosome segregation: dual control ensures fidelity. Curr Biol. 1999;9:R562–564. doi: 10.1016/s0960-9822(99)80355-8. [DOI] [PubMed] [Google Scholar]
- Thornton BR, Chen KC, Cross FR, Tyson JJ, Toczyski DP. Cycling without the cyclosome: modeling a yeast strain lacking the APC. Cell Cycle. 2004;3:629–633. [PubMed] [Google Scholar]
- Toone WM, Aerne BL, Morgan BA, Johnston LH. Getting started: regulating the initiation of DNA replication in yeast. Annu Rev Microbiol. 1997;51:125–149. doi: 10.1146/annurev.micro.51.1.125. [DOI] [PubMed] [Google Scholar]
- Travesa A, Kalashnikova TI, de Bruin RA, Cass SR, Chahwan C, Lee DE, Lowndes NF, Wittenberg C. Repression of G1/S transcription is mediated via interaction of the GTB motifs of Nrm1 and Whi5 with Swi6. Mol Cell Biol. 2013;33:1476–1486. doi: 10.1128/MCB.01333-12. [DOI] [PMC free article] [PubMed] [Google Scholar]
- Tyers M, Tokiwa G, Futcher B. Comparison of the Saccharomyces cerevisiae G1 cyclins: Cln3 may be an upstream activator of Cln1, Cln2 and other cyclins. EMBO J. 1993;12:1955–1968. doi: 10.1002/j.1460-2075.1993.tb05845.x. [DOI] [PMC free article] [PubMed] [Google Scholar]
- Tyers M, Tokiwa G, Nash R, Futcher B. The Cln3-Cdc28 kinase complex of S. cerevisiae is regulated by proteolysis and phosphorylation. EMBO J. 1992;11:1773–1784. doi: 10.1002/j.1460-2075.1992.tb05229.x. [DOI] [PMC free article] [PubMed] [Google Scholar]
- Tyson JJ, Novak B, Chen KC, Val J. Checkpoints in the cell cycle from a modeler’s perspective. Prog Cell Cycle Res. 1995;1:1–8. doi: 10.1007/978-1-4615-1809-9_1. [DOI] [PubMed] [Google Scholar]
- Veinot-Drebot LM, Johnston GC, Singer RA. A cyclin protein modulates mitosis in the budding yeast Saccharomyces cerevisiae. Curr Genet. 1991;19:15–19. doi: 10.1007/BF00362082. [DOI] [PubMed] [Google Scholar]
- Verdugo A, Vinod PK, Tyson JJ, Novak B. Molecular mechanisms creating bistable switches at cell cycle transitions. Open Biol. 2013;3:120179. doi: 10.1098/rsob.120179. [DOI] [PMC free article] [PubMed] [Google Scholar]
- Verges E, Colomina N, Gari E, Gallego C, Aldea M. Cyclin Cln3 is retained at the ER and released by the J chaperone Ydj1 in late G1 to trigger cell cycle entry. Mol Cell. 2007;26:649–662. doi: 10.1016/j.molcel.2007.04.023. [DOI] [PubMed] [Google Scholar]
- Verma R, Feldman RM, Deshaies RJ. SIC1 is ubiquitinated in vitro by a pathway that requires CDC4, CDC34, and cyclin/CDK activities. Mol Biol Cell. 1997;8:1427–1437. doi: 10.1091/mbc.8.8.1427. [DOI] [PMC free article] [PubMed] [Google Scholar]
- Wagner MV, Smolka MB, de Bruin RA, Zhou H, Wittenberg C, Dowdy SF. Whi5 regulation by site specific CDK-phosphorylation in Saccharomyces cerevisiae. PLoS One. 2009;4:e4300. doi: 10.1371/journal.pone.0004300. [DOI] [PMC free article] [PubMed] [Google Scholar]
- Wasch R, Cross FR. APC-dependent proteolysis of the mitotic cyclin Clb2 is essential for mitotic exit. Nature. 2002;418:556–562. doi: 10.1038/nature00856. [DOI] [PubMed] [Google Scholar]
- Wheals AE. Size control models of Saccharomyces cerevisiae cell proliferation. Mol Cell Biol. 1982;2:361–368. doi: 10.1128/mcb.2.4.361. [DOI] [PMC free article] [PubMed] [Google Scholar]
- Wijnen H, Futcher B. Genetic analysis of the shared role of CLN3 and BCK2 at the G(1)-S transition in Saccharomyces cerevisiae. Genetics. 1999;153:1131–1143. doi: 10.1093/genetics/153.3.1131. [DOI] [PMC free article] [PubMed] [Google Scholar]
- Wijnen H, Landman A, Futcher B. The G(1) cyclin Cln3 promotes cell cycle entry via the transcription factor Swi6. Mol Cell Biol. 2002;22:4402–4418. doi: 10.1128/MCB.22.12.4402-4418.2002. [DOI] [PMC free article] [PubMed] [Google Scholar]
- Wittenberg C, Reed SI. Control of the yeast cell cycle is associated with assembly/disassembly of the Cdc28 protein kinase complex. Cell. 1988;54:1061–1072. doi: 10.1016/0092-8674(88)90121-3. [DOI] [PubMed] [Google Scholar]
- Yahya G, Parisi E, Flores A, Gallego C, Aldea M. A Whi7-anchored loop controls the G1 Cdk-cyclin complex at start. Mol Cell. 2014;53:115–126. doi: 10.1016/j.molcel.2013.11.015. [DOI] [PubMed] [Google Scholar]
- Zhang T, Schmierer B, Novak B. Cell cycle commitment in budding yeast emerges from the cooperation of multiple bistable switches. Open Biol. 2011;1:110009. doi: 10.1098/rsob.110009. [DOI] [PMC free article] [PubMed] [Google Scholar]
- Zhao X, Harashima H, Dissmeyer N, Pusch S, Weimer AK, Bramsiepe J, Bouyer D, Rademacher S, Nowack MK, Novak B, et al. A general G1/S-phase cell-cycle control module in the flowering plant Arabidopsis thaliana. PLoS Genet. 2012;8:e1002847. doi: 10.1371/journal.pgen.1002847. [DOI] [PMC free article] [PubMed] [Google Scholar]
Associated Data
This section collects any data citations, data availability statements, or supplementary materials included in this article.