

Summary
Based on deep targeted sequencing and Axiom data in 10 lung cancer studies, our fine mapping analysis identified multiple novel lung cancer susceptibility variants in 5p15.33 region. It also demonstrated that telomere length is a key mechanism of these associations.
Abstract
Chromosome 5p15.33 has been identified as a lung cancer susceptibility locus, however the underlying causal mechanisms were not fully elucidated. Previous fine-mapping studies of this locus have relied on imputation or investigated a small number of known, common variants. This study represents a significant advance over previous research by investigating a large number of novel, rare variants, as well as their underlying mechanisms through telomere length. Variants for this fine-mapping study were identified through a targeted deep sequencing (average depth of coverage greater than 4000×) of 576 individuals. Subsequently, 4652 SNPs, including 1108 novel SNPs, were genotyped in 5164 cases and 5716 controls of European ancestry. After adjusting for known risk loci, rs2736100 and rs401681, we identified a new, independent lung cancer susceptibility variant in LPCAT1: rs139852726 (OR = 0.46, P = 4.73×10⁻⁹), and three new adenocarcinoma risk variants in TERT: rs61748181 (OR = 0.53, P = 2.64×10⁻⁶), rs112290073 (OR = 1.85, P = 1.27×10⁻⁵), rs138895564 (OR = 2.16, P = 2.06×10⁻⁵; among young cases, OR = 3.77, P = 8.41×10⁻⁴). In addition, we found that rs139852726 (P = 1.44×10⁻³) was associated with telomere length in a sample of 922 healthy individuals. The gene-based SKAT-O analysis implicated TERT as the most relevant gene in the 5p15.33 region for adenocarcinoma (P = 7.84×10⁻⁷) and lung cancer (P = 2.37×10⁻⁵) risk. In this largest fine-mapping study to investigate a large number of rare and novel variants within 5p15.33, we identified novel lung and adenocarcinoma susceptibility loci with large effects and provided support for the role of telomere length as the potential underlying mechanism.
Introduction
Lung cancer has been the most common cancer in the world for several decades, as well as the most common cause of cancer death (1). Although tobacco smoking remains the dominant lung cancer risk factor, the influence of inherited genetic variation is recognized as an important determinant of lung cancer risk (2). Genome-wide association studies (GWAS) have consistently implicated the chromosome 5p15.33 as an important cancer susceptibility locus in European (3–6), East Asian (7–9) and African-American (10) populations. The 5p15.33 region contains two cancer susceptibility genes: TERT, which encodes the catalytic subunit of telomerase reverse transcriptase, and CLPTM1L, which encodes the cleft lip and palate-associated transmembrane 1-like protein. Telomerase is overexpressed in ~90% of tumors, and plays an important role in maintaining chromosome stability, telomere length and regulating the proliferative life span of the cell (11,12). CLPTM1L plays a role in apoptosis, is overexpressed in lung cancer, and is required for KRAS-driven lung cancer (13,14).
Single nucleotide variants (SNVs) within 5p15.33 also show robust associations in subgroups defined by smoking status and histology, with studies demonstrating that SNVs in TERT/CLPTM1L predict lung cancer risk in never-smokers (4), and are also strongly associated with adenocarcinoma (6,7), the most common type of lung cancer in this population (15,16). Importantly, these findings have been successfully replicated in several large international studies. A meta-analysis of 16 GWAS (17) and a pooled analysis of 21 case–control and cohort studies (18) confirmed previously reported associations and histology-specific effects in European and Asian populations. The relevance of the 5p15.33 region for cancer etiology is further illustrated by an analysis demonstrating pleiotropic effects at this locus (19), as well as previously reported associations with multiple cancer types, including glioma, prostate, breast, colorectal, bladder and pancreatic cancers (5,20–23).
Despite the accumulating evidence for the importance of TERT/CLPTM1L, the mechanisms underlying the risk variants at this locus have not been fully elucidated. The 5p15.33 region appears to be under strong evolutionary constraint and shows relatively little common genetic variation (24), which suggests that the observed associations with cancer risk may be mediated through rare [minor allele frequency (MAF) < 1%] and low-frequency (MAF ≥ 1–5%) variants, which are not interrogated by GWAS, and are difficult to capture using imputation strategies. Therefore, the aim of the present study was to refine the association signal within TERT/CLPTM1L by identifying novel lung cancer susceptibility loci and characterizing the contribution of low frequency and rare variants in 5p15.33 to lung cancer risk.
This fine-mapping analysis is the first and largest study to date to investigate rare and novel variants within 5p15.33 using pooled data from over 5000 case–control pairs from 10 studies as part of the Transdisciplinary Research in Cancer of the Lung (TRICL) consortium and International Lung Cancer Consortium (ILCCO). Although several fine-mapping studies of the 5p15.33 locus have been conducted, these analyses relied on imputation (10,19,25), or investigated a small number of known, common variants (26). In our study, variants for the fine mapping were identified using a targeted resequencing of the 5p15.33 region, and genotyped in a large population. Therefore, this analysis represents an important advance over previous work by directly investigating a large number of novel rare variants in 5p15.33. Furthermore, our genetic association analyses are complimented by an analysis of telomere length, which provides further insight into the biological mechanisms underlying 5p15.33 susceptibility loci.
Materials and methods
Studies and participants
A large pooled sample was assembled consisting of 10 independent case–control studies (Table 1): Mount-Sinai Hospital-Princess Margaret (MSH-PMH), Multiethnic Cohort, Liverpool Lung Project, Nurses’ Health Study and National Physicians Health Study, the European Prospective Investigation into Cancer and Nutrition (EPIC) Lung (3), the Prostate, Lung and Ovarian Cancer Screening Trial, Carotene and Retinol Efficacy Trial, Russian Multi-Cancer Case-Control Study, Melbourne Collaborative Cohort Study and Harvard Lung Cancer Study. All studies were reviewed and approved by institutional ethics review committees at the involved institutions.
Table 1.
Characteristics of the 10 study populations included in the pooled sample
| Characteristic and description | Cases | Controls | Total | ||||||
|---|---|---|---|---|---|---|---|---|---|
| N | (%) | N | (%) | N | (%) | ||||
| Study | CARET | Nested case–control | USA | 539 | (34.7) | 1013 | (65.3) | 1552 | (14.3) |
| EPIC-Lung | Nested case–control | Europe (Multi-site) | 1010 | (49.6) | 1025 | (50.4) | 2035 | (18.7) | |
| NHS/NPHS | Nested case–control | USA | 519 | (51.1) | 496 | (48.9) | 1015 | (9.3) | |
| LCS | Hospital-based | USA | 661 | (46.9) | 749 | (53.1) | 1410 | (13.0) | |
| LLP | Hospital-based | UK | 395 | (51.0) | 380 | (49.0) | 775 | (7.1) | |
| MEC | Nested case–control | USA | 206 | (49.6) | 209 | (50.4) | 415 | (3.8) | |
| MSH-PMH | Clinic-based | Canada | 1088 | (54.1) | 922 | (45.9) | 2010 | (18.5) | |
| MCCS | Nested case–control | Australia | 91 | (50.6) | 89 | (49.4) | 180 | (1.7) | |
| PLCO | Nested case–control | USA | 158 | (30.7) | 356 | (69.3) | 514 | (4.7) | |
| RUSS | Hospital-based | Russia | 497 | (51.0) | 477 | (49.0) | 974 | (9.0) | |
| Histology | Adenocarcinomaa | 1840 | (35.6) | — | — | — | (35.6) | ||
| Squamous cell carcinoma1 | 1296 | (25.1) | — | — | — | (25.1) | |||
| Othera | 2028 | (39.3) | — | — | 2028 | (39.3) | |||
| Age | ≤50 years | 703 | (42.4) | 954 | (57.6) | 1657 | (15.2) | ||
| >50 years | 4461 | (48.4) | 4762 | (51.6) | 9223 | (84.8) | |||
| Sex | Males | 2963 | (47.8) | 3238 | (52.2) | 6201 | (57.0) | ||
| Females | 2201 | (47.0) | 2478 | (53.0) | 4679 | (43.0) | |||
| Smoking | Non-smokers | 530 | (23.5) | 1725 | (76.5) | 2255 | (20.7) | ||
| Smokers | 4634 | (53.7) | 3991 | (46.3) | 8625 | (79.3) | |||
| Mean cigarette pack-years (SD) | 38.6 | (27.3) | 23.9 | (25.1) | 29.5 | (26.9) | |||
| Total | 5164 | (47.5) | 5716 | (52.5) | 10880 | (100.0) | |||
CARET, Carotene and Retinol Efficacy Trial; EPIC Lung, European Prospective Investigation into Cancer and Nutrition – Lung; NHS/NPHS, Nurses’ Health Study/National Physicians Health Study; LCS, Harvard Lung Cancer Study; LLP, Liverpool Lung Project; MEC, Multiethnic Cohort Study; MSH-PMH, Mount-Sinai Hospital-Princess Margaret Study; MCCS, Melbourne Collaborative Cohort Study; PLCO, Prostate, Lung and Ovarian Cancer Screening Trial; RUSS, Russian Multi-Cancer Case–Control Study; SD, standard deviation.
aPercentage calculated from the total number of cases (n = 5164).
To assess population structure, we estimated continental ancestry by using the STRUCTURE program (27). Genotypes from the three HapMap populations (CEU, YRI and JPT+CHB) representing populations of European, African and Asian origin, were used as reference populations. We excluded a total of 1550 detected as having <75% European ancestry and those self-identifying as non-Caucasian. An additional 71 samples were removed based on identity-by-state (IBS) values indicative of duplicates (IBS > 0.98) or relatedness (IBS > 0.5).
Of the remaining 11 030 individuals, 37 with less than 90% call rate were removed. Among the remaining samples, the total genotyping rate was 0.99688. We restricted our analyses to participants with complete phenotype and covariate information, resulting in a final sample size of 5164 lung cancer cases and 5716 controls (Supplementary Figure 1, available at Carcinogenesis Online).
Targeted sequencing and genotyping
Variants for fine mapping were identified through a targeted deep resequencing of 288 lung cancer case–control pairs from the Toronto lung cancer study (28,29). A two-dimensional pooling strategy was used to identify novel variants within over a 250-kb region in 5p15.33 (28). Pooled samples were arranged into four 12×12 matrices, enriched for DNA from the region of interest and captured using custom probes and Agilent SureSelect technology (28). Captured DNA was sequenced at an average depth of coverage greater than 4000× (minimum depth 200×) on an Illumina HiSeq 2000 instrument (28). Identified variants were selectively verified using amplicon sequencing on an Ion Torrent Personal Genome Machine (28).
A total of 1108 novel variants (953 SNVs and 155 insertions/deletions [indels]) identified through this re-sequencing (Table 2) were subsequently added to a custom Affymetrix Axiom Array (Affymetrix, Santa Clara, CA, USA), which contains a comprehensive panel of key GWAS markers, rare and low-frequency variants and indels. The final 5p15.33 region for the fine mapping extended from 1200 to 1530kb, and contained 4652 SNVs and 6 genes: SLC6A19, SLC6A18, TERT, CLPTM1L, SLC6A3 and LPCAT1.
Table 2.
Distribution by gene and locus type of the 1108 de novo variants that were identified through a targeted deep sequencing of 5p15.331,2 and subsequently genotyped in 10 880 individuals (5164 lung cancer cases, 5716 controls)
| Locus type | Gene | Total | |||||||||
|---|---|---|---|---|---|---|---|---|---|---|---|
| TERT | CLPTM1L | SLC6A3 | LPCAT1 | Intergenic | |||||||
| N | (%) | N | (%) | N | (%) | N | (%) | N | (%) | ||
| 3′-UTR | 2 | (0.2) | 3 | (0.3) | 7 | (0.6) | 15 | (1.4) | 0 | (0) | 27 |
| Intronic | 203 | (18.3) | 135 | (12.2) | 284 | (25.6) | 218 | (19.7) | 0 | (0) | 840 |
| Nonsynonymous | 4 | (0.4) | 2 | (0.2) | 8 | (0.7) | 3 | (0.3) | 0 | (0) | 17 |
| Synonymous | 8 | (0.7) | 3 | (0.3) | 3 | (0.3) | 5 | (0.5) | 0 | (0) | 19 |
| Upstream | 1 | (0.1) | 3 | (0.3) | 3 | (0.3) | 0 | (0) | 0 | (0) | 7 |
| Downstream | 0 | (0) | 4 | (0.4) | 5 | (0.5) | 3 | (0.3) | 0 | (0) | 12 |
| Indel | 45 | (4.1) | 16 | (1.4) | 29 | (2.6) | 43 | (3.9) | 22 | (2.0) | 155 |
| SNV | 173 | (15.6) | 134 | (12.1) | 281 | (25.4) | 201 | (18.1) | 164 | (14.8) | 953 |
| Total variants | 218 | (19.7) | 150 | (13.5) | 310 | (28.0) | 244 | (22.0) | 186 | (16.8) | 1108 |
CLPTM1L, Cleft lip and palate transmembrane protein 1-like protein; Indel, insertion/deletion variant; LPCAT1, lysophosphatidylcholine acyltransferase 1; SNV, single-nucleotide variant; SLC6A3, Solute Carrier Family 6 (Neurotransmitter Transporter) Member 3; TERT, telomerase reverse transcriptase.
aThe 5p15.33 region was sequenced at an average depth of coverage greater than 4000×.
bThe sequencing was conducted in an independent sample of 288 lung case–control pairs.
The data were filtered to remove 42 SNVs with less than 95% call rate and 1026 monomorphic variants. Variants were also excluded if quality control (QC) metrics established by Affymetrix (30) indicated suboptimal performance (QC details in Supplementary Figure 1, available at Carcinogenesis Online). A more stringent set of QC filters was applied to the novel variants to remove poorly performing SNVs and those with <97% call rate. Of the remaining 2343 SNVs, 188 variants were excluded based on these additional criteria, or if the concordance rate was less than 98% based on 168 duplicate samples. To identify poorly genotyped variants, Fisher’s exact test was used to verify that the allele distributions for each SNV were in Hardy–Weinberg equilibrium (HWE). We removed 22 SNVs with a HWE P value less than 10–7 in controls. After these exclusions, a total of 2133 variants were available for analysis.
Measurement of telomere length
Relative telomere length (TL) was measured using a standard quantitative PCR protocol (31). This method expresses telomere length as a ratio (T/S) of telomere repeat length (T) to copy number of a single copy gene (S), in each sample. Two PCR reactions were performed for each sample, the first to determine the cycle threshold (Ct) value for telomere amplification and the second to assess the Ct value for the single copy gene amplification (see Supplementary File 1, available at Carcinogenesis Online for details).
To standardize across plates a calibrator sample for quantification. The same reference DNA was used consistently for all plates. All DNA samples were run in triplicate for telomere and single-copy gene reactions. The coefficient of determination (R2) for each standard curve was ≥0.99. Intra-assay variation was examined by calculating the coefficient of variation (CV) for the Ct values across triplicate qPCR reactions. For the telomere reaction, the CV was 0.33% and for the single-copy gene reaction the CV was 0.15%. The maximum CV for both reactions was <2%. The inter-assay variation was 3.87% for the telomere reaction and 1.14% for the single copy gene reaction.
Prior to calculating the T/S ratio, mean Ct values were screened for possible outliers, such as those with standard deviations (SD) exceeding 0.25 (32). For these samples (n = 7, 0.35%) the outlying Ct value was dropped and the mean Ct was recalculated using data from two of the triplicate runs.
Statistical analysis
Two complementary statistical approaches were used to address our aims. First, we carried out a single-marker logistic regression analysis to fine-map lung cancer susceptibility loci. However, even with a large sample size, the power of such single-marker association analyses is still limited for testing rare variants. Therefore, our next step was to carry out a regional set-based analysis using the optimal unified sequence kernel association test (SKAT-O) (33). SKAT-O aggregates the weighted variance-component score statistics for each SNV within a set using a kernel function, and tests for association between groups of SNVs and a phenotype, while adjusting for relevant covariates (33). To limit the number of tests, we performed analyses on sets defined by genes as the biological unit within 5p15.33.
For single-maker analyses and set-based SKAT-O analyses, associations were tested separately for the two major histological subtypes: adenocarcinoma and squamous cell carcinoma. Analyses of other less frequent histology groups were not pursued.
Single-marker association analysis
The main effect of each variant was tested using unconditional logistic regression, assuming a log-additive genetic model with 1 df. Models were adjusted for age, gender, study and tobacco smoking, modeled using cigarette pack-years (or duration of smoking in EPIC). We also performed analyses conditioned on two previously associated risk variants denoting two main independent variants associated with lung cancer signals in this region: rs2736100 (TERT) and rs401681 (CLPTM1L).
In order to achieve sufficient statistical power for the analysis of rare and low frequency variants, all 10 studies were analyzed as a pooled data set. In addition, for common variants, a fixed-effects meta-analysis was conducted. The purpose of this analysis was to investigate heterogeneity among studies, and ensure consistency with the associations observed in the pooled analysis. The meta-analysis used the effect estimates from the logistic regression analysis within each study, adjusted for the appropriate covariates. Heterogeneity was tested with the Cochran Q test, which tests the consistency of allelic effects across studies, and I 2 index, which quantifies the percentage of variation in allelic effects across studies that is due to heterogeneity rather than chance. I 2 values of more than 50% were considered indicative of substantial heterogeneity.
To control type 1 error due to multiple testing we applied the simpleM algorithm (34). This method accounts for linkage disequilibrium between SNVs to calculate the effective number of independent tests (M eff), which can then be applied in the Bonferroni correction formula. Using this method, we set the adjusted point-wise significance level at P < 2.80×10⁻⁵ based on M eff of 1784.
Stratified association analyses
The effects of top-ranking variants were further characterized by conducting analyses stratified by age, sex and smoking status. For the age-stratified analyses 50 years was chosen as the cut-point. Non-smokers were defined as participants reporting 0 cigarette pack-years.
Calculations for the pooled single-marker logistic regression analyses and stratified association analyses were performed using PLINK (35), and the meta-analysis was conducted using GWAMA (36). LocusZoom was used for regional visualization of results (37).
Gene-based SKAT-O analysis
For the set-based SKAT-O analysis, all of the 2133 variants that passed QC were assigned to sets defined by genes within the fine-mapping region. A total of 11 non-overlapping sets were constructed, covering the genes and intergenic regions of interest within 5p15.33. Separate analyses were conduced for all variants (n = 2133) and rare variants with MAF < 0.01 (n = 1403). Models were adjusted for age (years), gender, study and tobacco smoking (cigarette pack-years or duration of smoking, where available), and genotypes for rs2736100 and rs401681. A threshold of P < 4.55×10⁻³ was considered significant after applying the Bonferroni correction for testing the 11 sets of variants.
SKAT-O analyses were carried out using the SKAT package (R v. 2.13.0).
Telomere length association analysis
Telomere length was analyzed as a continuous variable, expressed as a T/S ratio, which was calculated using the Pfaffl method (38,39):
Model diagnostics were used to identify influential observations, and individuals with T/S values outside of four standard deviations from the mean (n = 7, 0.8%) were excluded from the analysis. Telomere length was also modeled as a categorical variable. T/S quartiles were calculated based on the overall distribution and a dichotomous variable representing short TL (first quartile versus others) was created. Analyses associating 5p15.33 risk variants and TL were carried out using linear and logistic regression, adjusting for age, sex and cigarette pack-years. For consistency, the same effect allele was used in both cancer risk analysis and the telomere analysis.
Results
The combined analysis was based on a pooled sample of 5164 lung cancer cases, including 1841 adenocarcinoma and 1296 squamous cell carcinoma cases, and 5716 controls from 10 studies (Table 1). Males accounted for 57% of all lung cancer cases and 57% of controls. Females comprised 2201 cases (46% adenocarcinoma, 15% squamous cell carcinoma) and 2478 controls. Adenocarcinoma was more common among females (46% of female cases) compared to males (28% of male cases). Across all 10 studies, 530 lung cancer cases (263 adenocarcinoma, 68 squamous cell carcinoma) were diagnosed in non-smokers, and a total of 703 early-onset cases occurred in individuals aged 50 years or less.
Single-maker association analysis
Of the 2133 variants that were analyzed, 43 were significantly associated with lung cancer at P value below the threshold of 2.80×10⁻⁵, including previously reported risk variants such as rs401681, rs2853677 and rs2736098 (Supplementary Table 1, available at Carcinogenesis Online). Results based on the pooled sample did not differ from those observed in the meta-analysis of the associations within each of the 10 studies. With the exception of one SNV (rs7705526), effects were consistent across studies and any observed heterogeneity could be attributed to sampling error within studies (0 ≤ I 2 ≤ 0.16). Therefore, for common variants, the presented effect estimates are derived from the meta-analysis, whereas for variants with MAF less than 0.05, for which each individual study would be underpowered, we report P values, odds ratios (OR) and corresponding 95% confidence intervals (CI) based on the pooled sample (Supplementary Table 1, available at Carcinogenesis Online).
Of the 43 variants significantly associated with lung cancer, 26 were localized in CLPTM1L or the MIR4457-CLPTM1L intergenic region. Although the associated variants were predominantly common (n = 42), the variant with the lowest P value, rs139852726 (OR = 0.46, 95% CI: 0.36–0.60, P = 4.73×10⁻⁹), was a low-frequency variant, with an overall frequency of the minor C-allele of 0.014. As expected based on the pattern of linkage disequilibrium in this region, conditioning on the previously reported association signals, denoted by rs2736100 and rs401681, attenuated the associations observed for most of the 43 risk variants (Figure 1; Supplementary Table 2, available at Carcinogenesis Online). Notably, the association observed for rs139852726 C allele (OR = 0.47, 95% CI: 0.36–0.61, P = 1.68×10⁻⁸) remained unchanged after adjustment.
Figure 1.

Regional association plots for lung cancer (n = 5164), adenocarcinoma (n = 1841) and squamous cell carcinoma (n = 1296) based on the (i) adjusted multivariate logistic regression analysis and (ii) the multivariate analysis conditioned on genotypes for rs2736100 and rs401681.
In the histology-specific analyses, a total of 38 variants were significantly associated with adenocarcinoma risk (P < 2.80×10⁻⁵), including rs139852726 (Figure 1; Supplementary Table 3, available at Carcinogenesis Online). In addition, two novel susceptibility risk variants were identified for adenocarcinoma: rs112290073 (OR = 1.85, 95% CI: 1.40–2.44, P = 1.27×10⁻⁵) and rs138895564 (OR = 2.16, 95% CI: 1.52–3.08, P = 2.06×10⁻⁵). These associations remained significant after conditioning on the effects of rs2736100 and rs401681 (Figure 1; Supplementary Table 4, available at Carcinogenesis Online). The conditioned analyses also uncovered an additional association signal at rs61748181 (OR = 0.53, 95% CI: 0.41–0.69, P = 2.64×10⁻⁶). Notably, these novel adenocarcinoma risk variants were rare and low-frequency polymorphisms: rs112290073 (MAF = 0.015), rs138895564 (MAF=0.009) and rs61748181 (MAF = 0.030).
Few novel statistically significant associations were observed for squamous cell carcinoma (Figure 1; Supplementary Tables 5–6, available at Carcinogenesis Online). The top-ranked associated variant was rs139852726 (OR = 0.37, 95% CI: 0.23–0.58, P = 1.66×10⁻⁵). In the unconditioned analyses, rs4975616, a common intergenic SNP between MIR4457 and CLPTM1L, was significantly associated with squamous cell carcinoma risk (OR = 0.84, 95% CI: 0.76–0.93, P = 1.96×10⁻⁵).
Stratified association analyses
Top-ranking association variants identified in the single-marker logistic regression analyses were further examined in stratified analyses, in order to better characterize their effects in key subpopulations (Figure 2). For rs139852726 (Figure 2A), a stronger association was observed in older subjects (OR=0.43, 95% CI: 0.32–0.56, P = 2.84×10⁻⁹) and smokers (OR=0.48, 95% CI: 0.36–0.63, P = 1.32×10⁻⁷). However, the heterogeneity of effects across age (P het = 0.089) and smoking (P het = 0.052) sub-groups was not statistically significant.
Figure 2.
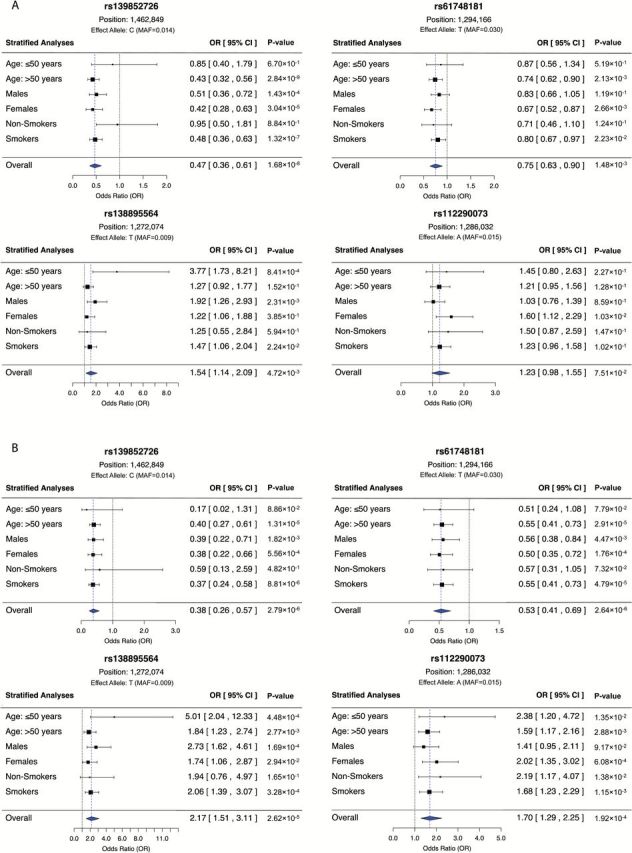
Stratified analyses1 of top-ranking variants for all lung cancer subtypes (A) and adenocarcinoma (B).
The opposite pattern was observed for rs138895564, where the magnitude of association differed significantly according to age (P het = 0.012), but not smoking status (P het = 0.908). There was higher risk for younger onset (≤50 years old) lung cancer (OR = 3.77, 95% CI: 1.73–8.21, P = 8.41×10⁻⁴), and in particular younger onset of lung adenocarcinoma (OR = 5.01, 95% CI: 2.04–12.33, P = 4.48×10⁻⁴) (Figure 2A and B). Similarly, rs112290073 was more strongly associated with young lung adenocarcinoma cases (aged 50 or less, OR = 2.38, 95% CI: 1.20–4.72, P = 1.92×10⁻⁴), but these differences were not statistically significant (P het = 0.294).
Gene-based SKAT-O analysis
In order to localize regions of interest and characterize the contribution to cancer risk of rare variants within specific to cancer risk, we performed gene-based analyses using SKAT-O. The results of this regional analysis further confirmed the pattern of associations emerging from the single-marker analysis (Figure 3).
Figure 3.
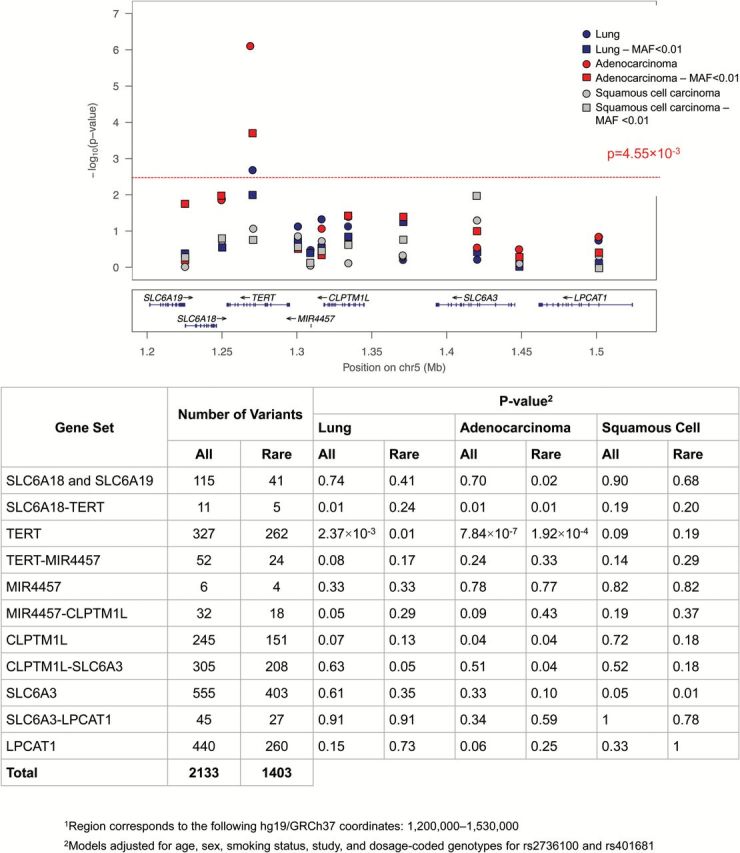
Results of the 5p15.33 regional1 gene-based SKAT-O analysis for lung cancer, adenocarcinoma and squamous cell carcinoma.
Considering both common and rare polymorphisms, the 327 variants within TERT were significantly associated with lung cancer (P = 2.37×10⁻⁵) and adenocarcinoma (P = 7.84×10⁻⁷). The analysis of rare variants with MAF < 0.01, also implicated TERT as the most relevant gene for adenocarcinoma (P = 1.92×10⁻⁴) and lung cancer (P = 0.01), although the latter was only significant at the nominal level. Squamous cell carcinoma was not associated with TERT or other genes within the 5p15.33 at the multiple-testing adjusted threshold. However, rare variants in SLC6A3 were associated with squamous cell carcinoma at the <0.05 level (P = 0.01).
Telomere length analysis
Based on the emerging pattern of results, we hypothesized that the novel risk variants we identified may influence telomere length (TL). In order to test this hypothesis, we examined the association between rs139852726, rs61748181, rs138895564, rs112290073 and relative TL in peripheral blood leukocytes of 922 non-diseased controls in the MSH-PMH study.
The minor allele C of the top-ranking lung cancer susceptibility variant rs139852726 showed a significant inverse association with mean TL (per allele β = −0.101, P = 1.44×10⁻³, Table 3). Based on the logistic regression using the lowest quartile of TL as the outcome, rs139852726-C was shown to be significantly associated with shorter TL (per allele β = 1.502, P = 2.40×10⁻⁵). Adjustment for rs2736100 and rs401681, which have been associated with TL in other studies, did not have an appreciable effect on the association with mean TL (per allele β = −0.096, P = 2.95×10⁻³), or short TL (per allele β = 1.410, P = 1.02×10⁻⁴). None of the remaining three susceptibility variants were associated with TL.
Table 3.
Associations between telomere length measured in 922 MSH-PMH non-diseased controls and top-ranking lung cancer and adenocarcinoma susceptibility loci
| SNV | Position | Effect alleleb | Continuous TL | Short TLa (Dichotomous) | ||||
|---|---|---|---|---|---|---|---|---|
| Coefficient (βSNV)c,d | SE | P valuec,d | Coefficient (βSNV)d,e | SE | P valued,e | |||
| rs139852726 | 1462849 | C | −0.101 | 0.032 | 1.44×10⁻³ | 1.502 | 0.356 | 2.40×10⁻⁵ |
| rs61748181 | 1294166 | T | 0.009 | 0.028 | 0.75 | −0.064 | 0.383 | 0.87 |
| rs138895564 | 1272074 | T | −0.035 | 0.047 | 0.45 | −1.442 | 1.037 | 0.17 |
| rs112290073 | 1286032 | A | 0.009 | 0.035 | 0.81 | −0.236 | 0.501 | 0.64 |
MSH-PMH, Mount-Sinai Hospital-Princess Margaret case–control study; SE, standard error of the regression coefficient; SNV, single-nucleotide variant; TL, telomere length.
aShort telomere length, defined as the first quartile of the T/S ratio.
bFor consistency, the effect allele corresponds to the minor allele in the cancer association analysis.
cRegression coefficients and p-values from a linear regression model with a continuous T/S ratio.
dAdjusted for age (years), sex, smoking status (cigarette pack-years).
eRegression coefficients and P values from a logistic regression model with for short telomere length.
Discussion
In this fine mapping analysis of the 5p15.33 region we identified four novel, low-frequency genetic variants associated with lung cancer risk: rs139852726, rs61748181, rs138895564 and rs112290073. The top-ranking variant, rs139852726, located within the 3′-UTR of the LPCAT1 gene, was consistently associated across different lung cancer histology groups. On the other hand, risk variants located within TERT, rs61748181, rs138895564 and rs112290073, showed more robust associations with adenocarcinoma risk. This was further supported by the results of the gene-based SKAT-O analysis, which indicated that although TERT harbors genetic variants important for overall lung cancer risk, the observed associations were strengthened when the analysis was restricted to adenocarcinoma cases, despite the reduction in sample size. However, results of the set-based analyses should be interpreted with caution since they are influenced by the number of variants included in each set, resulting in enhanced statistical power for larger genes with a higher density of variants.
The associations observed for adenocarcinoma suggest that TERT is likely the gene in this region that is functionally involved in cancer pathogenesis. To investigate possible functional consequences of the variants identified in this analysis we used several bioinformatics tools, such as RegulomeDB, Polyphen-2 and GWAVA. One of the three TERT risk variants, rs61748181, is a missense variant where the C>T allele substitution results in a protein-level change from alanine to a threonine (Ala279Thr). This variant is located in a highly conserved region, and additional investigation of rs61748181 using PolyPhen-2 (40) revealed a ‘Probably Damaging’ classification based on a score of 0.953. Investigation of non-coding susceptibility variants points to potential regulatory functions for both rs138895564 and rs112290073, which are located in a CpG-rich region and are predicted to be transcription factor binding sites.
Beyond the speculative functions of each individual risk variants, our analysis adds to the accumulating evidence implicating TERT in adenocarcinoma risk (6,7). TERT is silent in normal human somatic cells, but it is overexpressed in most human cancers and over 80% of NSCLC (41). Studies focusing on the sequence of molecular events in lung cancer initiation have identified TERT reactivation as an important early event associated with progression from bronchoalveolar carcinoma to adenocarcinoma (42). Although TERT is initially expressed in lower levels in adenocarcinoma, TERT amplification is more commonly seen in adenocarcinoma than in squamous cell carcinoma, and overexpression of TERT mRNA is correlated with TERT amplification in adenocarcinoma but not in squamous cell carcinoma (41). These differences in TERT dynamics are consistent with previously reported histology-specific effects of 5p15.33 genetic variants, and the effects observed in this analysis. In addition, the absence of heterogeneity by smoking status adds to the accumulating evidence that the effects observed for 5p15.33 loci reflect associations with specific lung cancer histology rather than smoking (26).
Moreover, our findings point to the regulation of telomere length as a possible mechanism through which genetic variation in the 5p15.33 may influence lung cancer risk. Telomeres are structures that cap the ends of linear chromosomes and shorten with each round of cell division. In checkpoint proficient cells, once telomeres become critically short, cells enter a state of replicative senescence, followed by apoptosis. However, when cell-cycle checkpoints such as p53 and p16/pRB become inactivated, cells are able to escape apoptosis and acquire replicative immortality, often though the reactivation of telomerase.
For one of the susceptibility variants identified in this analysis, rs139852726, the minor C-allele was significantly associated with shorter telomere length. These results suggest that decreasing telomere length may underpin the inverse association observed for rs139852726-C and lung cancer risk. This direction of effect is also consistent with recent studies implicating longer telomere in increased lung cancer risk (32). The minor C-allele of rs139852726 shows a higher frequency among controls, resulting in an inverse association with lung cancer risk. This may result from a balance between mutation and purifying selection, and also as a consequence of adaptation to environmental changes in modern societies (43,44). In addition, similar protective associations with lung cancer have been previously observed for a low-frequency CHEK2 polymorphism (45).
In addition to the observed effects on telomere length, a regulatory effect of rs139852726 seems likely, since this SNP is located within the 3′-UTR of LPCAT1. This region typically contains binding sites for regulatory proteins and microRNAs, and our bioinformatics analysis shows that this SNP appears to be localized within a DNAse hypersensitivity cluster and a transcription factor binding ChIP-seq peak. LPCAT1 is a recently discovered enzyme expressed in alveolar type II cells and plays a role in regulating surfactant phospholipid biosynthesis, critical for lung function (46). Studies have also reported that LPCAT1 is overexpressed in colorectal adenocarcinomas and LPCAT1 levels correlate with the progression of prostate cancer, disease grade and stage (47,48).
In summary, this analysis used a fine mapping approach following targeted sequencing to identify several novel possibly causal SNPs within the 5p15.33 lung cancer susceptibility locus. All of the newly identified associations are for rare and low frequency polymorphisms. Instead of modest effect sizes typically seen for the common sequence variants, the novel variants we identified affected the cancer risk by approximately 2-fold, which further adds to the growing recognition of the importance of rare variants in disease etiology. Even with 10 000 participants, our statistical power to detect effects of this magnitude for very rare variants (MAF < 0.5%) is limited (<80%), therefore future expanded fine mapping may further contribute to the identification of additional lung cancer variants in this region. In addition, a combination of functional studies in animal and cell models, as well as epidemiologic studies of telomere length will help elucidate the underlying mechanisms of cancer risk.
Web resources
Carotene and Retinol Efficacy Trial (CARET): http://epi.grants.cancer.gov/Consortia/members/caret.html
Harvard Lung Cancer Study (LCS): http://www.hsph.harvard.edu/christiani-mgh-studies/lung-cancer-study/
Liverpool Lung Project (LLP): http://www.liverpoollungproject.co.uk
Melbourne Collaborative Cohort Study (MCCS): http://epi.grants.cancer.gov/Consortia/members/melbourne.html
Multiethnic/Minority Cohort (MEC) Study of Diet and Cancer: http://epi.grants.cancer.gov/Consortia/members/mec.html
Nurses’ Health Study (NHS): http://epi.grants.cancer.gov/Consortia/members/nhs2.html
National Physicians’ Health Study (NPHS): http://epi.grants.cancer.gov/Consortia/members/phs.html
The Prostate, Lung, Colorectal and Ovarian (PLCO) Cancer Screening Trial: http://prevention.cancer.gov/plco
Axiom Genotyping Solutions Analysis Guide: http://www.affymetrix.com/support/technical/manuals.affx
LocusZoom: http://csg.sph.umich.edu/locuszoom/
PolyPhen-2: http://genetics.bwh.harvard.edu/pph2/
RegulomeDB: http://regulomedb.org
simpleM: http://simplem.sourceforge.net
SKAT-O: package available from: http://www.hsph.harvard.edu/skat/download/
Supplementary material
Supplementary Tables 1–6 and Figure 1 can be found at http://carcin.oxfordjournals.org/
Funding
This work was supported by: the National Institutes of Health grant U19CA148127 (PI: Amos), the data harmonization was supported by Cancer Care Ontario Research Chair of Population Studies to Rayjean J. Hung. The MSH-PMH study was supported by Canadian Cancer Society Research Institute (no. 020214, PI: Hung). The Harvard Lung Cancer Study was funded by the National Institutes of Health grants: CA092824, CA074386, CA090578 (PI: Christiani). The Multiethnic Cohort Study was supported by the National Institutes of Health grant UM1 CA164973. Linda Kachuri is a trainee in the Canadian Institutes of Health Research (CIHR) Strategic Training for Advanced Genetic Epidemiology (STAGE) Program, and is supported by the CIHR Research Doctoral Award—Frederick Banting and Charles Best Canada Graduate Scholarships.
Conflict of Interest Statement: None declared.
Supplementary Material
Glossary
Abbreviations
- GWAS
genome-wide association study
- MAF
minor allele frequency
- SNV
single nucleotide variant
References
- 1. Jemal A., et al. (2011) Global cancer statistics. CA. Cancer J. Clin., 61, 69–90. [DOI] [PubMed] [Google Scholar]
- 2. Brennan P., et al. (2011) Genetics of lung-cancer susceptibility. Lancet Oncol., 12, 399–408. [DOI] [PubMed] [Google Scholar]
- 3. McKay J.D., et al. (2008) Lung cancer susceptibility locus at 5p15.33. Nat. Genet., 40, 1404–1406. [DOI] [PMC free article] [PubMed] [Google Scholar]
- 4. Wang Y., et al. (2008) Common 5p15.33 and 6p21.33 variants influence lung cancer risk. Nat. Genet., 40, 1407–1409. [DOI] [PMC free article] [PubMed] [Google Scholar]
- 5. Rafnar T., et al. (2009) Sequence variants at the TERT-CLPTM1L locus associate with many cancer types. Nat. Genet., 41, 221–7. [DOI] [PMC free article] [PubMed] [Google Scholar]
- 6. Landi M.T., et al. (2009) A genome-wide association study of lung cancer identifies a region of chromosome 5p15 associated with risk for adenocarcinoma. Am. J. Hum. Genet., 85, 679–91. [DOI] [PMC free article] [PubMed] [Google Scholar]
- 7. Hsiung C.A., et al. (2010) The 5p15.33 locus is associated with risk of lung adenocarcinoma in never-smoking females in Asia. PLoS Genet., 6. [DOI] [PMC free article] [PubMed] [Google Scholar]
- 8. Lan Q., et al. (2012) Genome-wide association analysis identifies new lung cancer susceptibility loci in never-smoking women in Asia. Nat. Genet., 44, 1330–1335. [DOI] [PMC free article] [PubMed] [Google Scholar]
- 9. Shiraishi K., et al. (2012) A genome-wide association study identifies two new susceptibility loci for lung adenocarcinoma in the Japanese population. Nat. Genet., 44, 900–903. [DOI] [PubMed] [Google Scholar]
- 10. Walsh K.M., et al. (2013) Fine-mapping of the 5p15.33, 6p22.1-p21.31, and 15q25.1 regions identifies functional and histology-specific lung cancer susceptibility loci in African-Americans. Cancer Epidemiol. Biomarkers Prev., 22, 251–260. [DOI] [PMC free article] [PubMed] [Google Scholar]
- 11. Newbold R.F. (2002) The significance of telomerase activation and cellular immortalization in human cancer. Mutagenesis, 17, 539–550. [DOI] [PubMed] [Google Scholar]
- 12. Bodnar A.G., et al. (1998) Extension of life-span by introduction of telomerase into normal human cells. Science, 279, 349–352. [DOI] [PubMed] [Google Scholar]
- 13. Yamamoto K., et al. (2001) A novel gene, CRR9, which was up-regulated in CDDP-resistant ovarian tumor cell line, was associated with apoptosis. Biochem. Biophys. Res. Commun., 280, 1148–1154. [DOI] [PubMed] [Google Scholar]
- 14. James M.A., et al. (2014) CRR9/CLPTM1L regulates cell survival signaling and is required for Ras transformation and lung tumorigenesis. Cancer Res., 74, 1116–1127. [DOI] [PMC free article] [PubMed] [Google Scholar]
- 15. Toh C.K., et al. (2006) Never-smokers with lung cancer: epidemiologic evidence of a distinct disease entity. J. Clin. Oncol., 24, 2245–2251. [DOI] [PubMed] [Google Scholar]
- 16. Sun S., et al. (2007) Lung cancer in never smokers–a different disease. Nat. Rev. Cancer, 7, 778–790. [DOI] [PubMed] [Google Scholar]
- 17. Timofeeva M.N., et al. (2012) Influence of common genetic variation on lung cancer risk: meta-analysis of 14 900 cases and 29 485 controls. Hum. Mol. Genet., 21, 4980–95. [DOI] [PMC free article] [PubMed] [Google Scholar]
- 18. Truong T., et al. (2010) Replication of lung cancer susceptibility loci at chromosomes 15q25, 5p15, and 6p21: a pooled analysis from the International Lung Cancer Consortium. J. Natl. Cancer Inst., 102, 959–971. [DOI] [PMC free article] [PubMed] [Google Scholar]
- 19. Wang Z., et al. (2014) Imputation and subset-based association analysis across different cancer types identifies multiple independent risk loci in the TERT-CLPTM1L region on chromosome 5p15.33. Hum. Mol. Genet, 23, 6616–6633. [DOI] [PMC free article] [PubMed] [Google Scholar]
- 20. Kote-Jarai Z., et al. (2011) Seven prostate cancer susceptibility loci identified by a multi-stage genome-wide association study. Nat. Genet., 43, 785–91. [DOI] [PMC free article] [PubMed] [Google Scholar]
- 21. Petersen G.M., et al. (2010) A genome-wide association study identifies pancreatic cancer susceptibility loci on chromosomes 13q22.1, 1q32.1 and 5p15.33. Nat. Genet., 42, 224–228. [DOI] [PMC free article] [PubMed] [Google Scholar]
- 22. Kinnersley B., et al. (2012) The TERT variant rs2736100 is associated with colorectal cancer risk. Br. J. Cancer, 107, 1001–1008. [DOI] [PMC free article] [PubMed] [Google Scholar]
- 23. Walsh K.M., et al. (2014) Variants near TERT and TERC influencing telomere length are associated with high-grade glioma risk. Nat. Genet., 46, 731–5. [DOI] [PMC free article] [PubMed] [Google Scholar]
- 24. Savage S.A., et al. (2005) Genetic variation, nucleotide diversity, and linkage disequilibrium in seven telomere stability genes suggest that these genes may be under constraint. Hum. Mutat., 26, 343–350. [DOI] [PubMed] [Google Scholar]
- 25. Wang Y., et al. (2015) Deciphering associations for lung cancer risk through imputation and analysis of 12 316 cases and 16 831 controls. Eur. J. Hum. Genet, 23, 1723–1728. [DOI] [PMC free article] [PubMed] [Google Scholar]
- 26. Pande M., et al. (2011) Novel genetic variants in the chromosome 5p15.33 region associate with lung cancer risk. Carcinogenesis, 32, 1493–1499. [DOI] [PMC free article] [PubMed] [Google Scholar]
- 27. Pritchard J.K., et al. (2000) Inference of population structure using multilocus genotype data. Genetics, 155, 945–959. [DOI] [PMC free article] [PubMed] [Google Scholar]
- 28. Zuzarte P.C., et al. (2014) A two-dimensional pooling strategy for rare variant detection on next-generation sequencing platforms. PLoS One, 9, e93455. [DOI] [PMC free article] [PubMed] [Google Scholar]
- 29. Brenner D.R., et al. (2010) Lung cancer risk in never-smokers: a population-based case-control study of epidemiologic risk factors. BMC Cancer, 10, 285. [DOI] [PMC free article] [PubMed] [Google Scholar]
- 30. Affymetrix Inc. (2014) Axiom Genotyping Solution Data Analysis Guide: P/N 702961 Rev. 2. [Google Scholar]
- 31. Cawthon R.M. (2002) Telomere measurement by quantitative PCR. Nucleic Acids Res., 30, e47. [DOI] [PMC free article] [PubMed] [Google Scholar]
- 32. Sanchez-Espiridion B., et al. (2014) Telomere length in peripheral blood leukocytes and lung cancer risk: a large case-control study in Caucasians. Cancer Res., 74, 2476–2486. [DOI] [PMC free article] [PubMed] [Google Scholar]
- 33. Lee S., et al. (2012) Optimal unified approach for rare-variant association testing with application to small-sample case-control whole-exome sequencing studies. Am. J. Hum. Genet., 91, 224–237. [DOI] [PMC free article] [PubMed] [Google Scholar]
- 34. Gao X., et al. (2008) A multiple testing correction method for genetic association studies using correlated single nucleotide polymorphisms. Genet. Epidemiol., 32, 361–369. [DOI] [PubMed] [Google Scholar]
- 35. Purcell S., et al. (2007) PLINK: a tool set for whole-genome association and population-based linkage analyses. Am. J. Hum. Genet., 81, 559–575. [DOI] [PMC free article] [PubMed] [Google Scholar]
- 36. Mägi R., et al. (2010) GWAMA: software for genome-wide association meta-analysis. BMC Bioinformatics, 11, 288. [DOI] [PMC free article] [PubMed] [Google Scholar]
- 37. Pruim R.J., et al. (2010) LocusZoom: regional visualization of genome-wide association scan results. Bioinformatics, 26, 2336–2337. [DOI] [PMC free article] [PubMed] [Google Scholar]
- 38. Ehrlenbach S., et al. (2009) Influences on the reduction of relative telomere length over 10 years in the population-based Bruneck Study: introduction of a well-controlled high-throughput assay. Int. J. Epidemiol., 38, 1725–1734. [DOI] [PubMed] [Google Scholar]
- 39. Pfaffl M.W. (2001) A new mathematical model for relative quantification in real-time RT-PCR. Nucleic Acids Res., 29, e45. [DOI] [PMC free article] [PubMed] [Google Scholar]
- 40. Adzhubei I., et al. (2013) Predicting functional effect of human missense mutations using PolyPhen-2. Curr. Protoc. Hum. Genet., Chapter 7, Unit7.20. [DOI] [PMC free article] [PubMed] [Google Scholar]
- 41. Lantuejoul S., et al. (2004) Differential expression of telomerase reverse transcriptase (hTERT) in lung tumours. Br. J. Cancer, 90, 1222–1229. [DOI] [PMC free article] [PubMed] [Google Scholar]
- 42. Lantuéjoul S., et al. (2007) Telomerase expression in lung preneoplasia and neoplasia. Int. J. Cancer, 120, 1835–1841. [DOI] [PubMed] [Google Scholar]
- 43. Blekhman R., et al. (2008) Natural selection on genes that underlie human disease susceptibility. Curr. Biol., 18, 883–889. [DOI] [PMC free article] [PubMed] [Google Scholar]
- 44. Corona E., et al. (2010) Extreme evolutionary disparities seen in positive selection across seven complex diseases. PLoS One, 5, e12236. [DOI] [PMC free article] [PubMed] [Google Scholar]
- 45. Brennan P., et al. (2007) Uncommon CHEK2 mis-sense variant and reduced risk of tobacco-related cancers: case control study. Hum. Mol. Genet., 16, 1794–1801. [DOI] [PubMed] [Google Scholar]
- 46. Chen X., et al. (2006) Identification and characterization of a lysophosphatidylcholine acyltransferase in alveolar type II cells. Proc. Natl. Acad. Sci. USA, 103, 11724–11729. [DOI] [PMC free article] [PubMed] [Google Scholar]
- 47. Mansilla F., et al. (2009) Lysophosphatidylcholine acyltransferase 1 (LPCAT1) overexpression in human colorectal cancer. J. Mol. Med. (Berl), 87, 85–97. [DOI] [PMC free article] [PubMed] [Google Scholar]
- 48. Zhou X., et al. (2012) The expression level of lysophosphatidylcholine acyltransferase 1 (LPCAT1) correlates to the progression of prostate cancer. Exp. Mol. Pathol., 92, 105–110. [DOI] [PMC free article] [PubMed] [Google Scholar]
Associated Data
This section collects any data citations, data availability statements, or supplementary materials included in this article.