Abstract
Background
Initiation of re-entrant ventricular tachycardia (VT) involves complex interactions between activation and repolarization wavefronts. Recent experimental work has identified the time interval between S2 repolarization proximal to a line of functional block and the activation at the adjacent distal side, as a critical determinant of re-entry.
Objective
We hypothesized: (1) an algorithm could be developed which would generate a spatial map of this interval (designated the “re-entry vulnerability index”-RVI); (2) that this would accurately identify a pathway of re-entry as well as rotor formation in animal experiments and in a computational model; and, (3) that it would be possible to generate an RVI map in humans during routine clinical procedures and co-register with anatomical and electrophysiological features.
Methods and Results
An algorithm was developed which sampled all points on a multielectrode grid and calculated RVI between all pairs of electrodes within a given radius. The algorithm successfully identified the spatial region with increased susceptibility to re-entry in an established Langendorff pig heart model and the site of re-entry and rotor formation in an optically mapped sheep heart model and corresponding computational simulations. The feasibility of RVI mapping was evaluated during a clinical procedure by co-registering with the anatomy and physiology in a patient undergoing a VT ablation.
Conclusions
We developed an algorithm to calculate a re-entry vulnerability index from intervals between local repolarization and activation times at all adjacent points over a multielectrode grid. The algorithm accurately identified the region of re-entry in two animal models of functional re-entry. The possibility of clinical application was demonstrated in a patient with VT.
Keywords: Arrhythmia, Ventricular Tachycardia, Ablation
Introduction
Ventricular tachycardia (VT) is a well-known precursor of ventricular fibrillation and an important cause of the 300,000 sudden cardiac deaths a year in the USA[1]. The majority of VT episodes are due to re-entry involving a complex interaction between activation and repolarization wavefronts[2-7]. Prerequisites for re-entry are a region of unidirectional block and a region of slowed conduction. The ability to accurately locate ventricular regions of high susceptibility to unidirectional block could have important clinical application.
Unidirectional block is usually functional due to the presence of a region of late repolarization and hence prolonged refractoriness. A premature activation wavefront encountering a region of refractoriness is unable to conduct through the region and is blocked, but travels round the region and approaches the line of block from the distal side. If sufficiently delayed by slowed conduction such that the proximal region has had time to regain excitability, the returning wavefront may re-excite proximally and form a re-entrant circuit which self perpetuates.
Recent experimental work has demonstrated a mathematical relationship between the relative timing of depolarisation and repolarisation at upstream and downstream sites located either side of the line of block[8]. In this work, we investigated the hypothesis that an algorithm, which calculates this time interval between every feasible pair of recording sites in a multielectrode map of activation and repolarisation times, would successfully identify the location of increased vulnerability to re-entry, and the potential site(s) of re-entry. We have designated this time interval the Re-entry Vulnerability Index-RVI.
We consequently developed an algorithm based on a matrix analysis of multiple points and the spatial relationship between subsequent activation and repolarisation intervals between pairs of electrodes. We applied this to data from an established animal model of functional re-entry in which a VT circuit had been created and activation repolarization mapping performed with a multielectrode array and to an optically mapped sheep heart model of functional re-entry. Our RVI mapping of the animal data confirmed the hypothesis that the RVI map identified an area which corresponded to the re-entrant pathway. Further, importantly, the RVI map identified vulnerability to re-entry even when re-entry did not occur. Such key features were also highlighted with computational simulations, where the region of low RVI was also seen to be co-located with site of the anchoring of the phase singularity associated with the reentry. We subsequently tested the utility of RVI mapping in an in-vivo human ventricle by co-registering with anatomy during a clinical procedure.
Methods
We sought to develop an algorithm that could map the RVI globally, thus identifying spatial regions with high susceptibility to re-entry.
Principles of the RVI algorithm
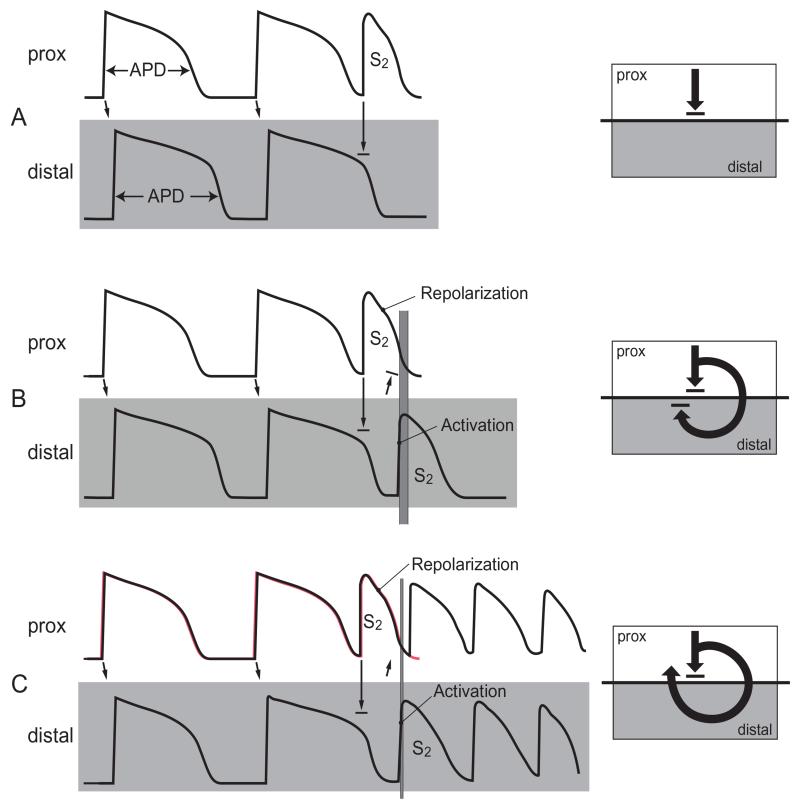
Key electrophysiological principles of this algorithm are illustrated in Figure 1 and summarized below:
Figure 1. Illustration of RVI in cases of re-entry and block.
APDs are shown for the last 2 beats of a steady state train (S1) followed by a premature beat (S2). Activation conducts from proximal sites (upper rows) to distal sites (lower rows) as indicated by arrows. The interval between the time of arrival of the premature S2 beat at the distal site and repolarization of the premature S2 beat proximally (represented in panel B and C by varying thickness of the vertical grey bars) is a critical determinant of whether re-entry will occur and is referred to as the Re-entry Vulnerability Index (RVI). Adapted from Coronel et al.[9].
Following activation (depolarization) myocardial cells remain unexcitable for 200-300ms until they repolarize. A new wavefront arriving during this refractory phase is unable to excite and blocks, whereas a wavefront arriving later, close to or after the time of repolarization is able to excite and propagate. In a typical re-entry scenario, a premature activation wavefront (S2) encounters a region with prolonged action potential duration, which has not yet repolarized (Figure 1A), and so is unable to excite and blocks (unidirectional block). The wave then travels around the blocked region and re-enters it from the distal side. Whether the wave will be able to return back to the starting point and so form a re-entry circuit will depend on whether the myocardial cells at the starting point have repolarized and thus are excitable again. If the wave arrives at the distal side too early it will not be able to re-excite the proximal region and will block (Figure 1B), whereas if it arrives later (Figure 1C) it may be able to re-excite the proximal area. The time interval between the arrival of the wave at the distal region and regaining of excitability, i.e. repolarization in the proximal region we have referred to as the RVI and is therefore a critical factor[8-9].
Development of the algorithm for measurement and mapping of RVI (both in the animal model and the human example)
For each recording location RVI is calculated as follows:
Firstly, the S2 beat of the local unipolar electrograms are identified and the activation and repolarization times are measured using the Wyatt method[10-13], where the moment of activation is taken as the dV/dt min of the activation wave and the moment of repolarization is taken as the maximum dV/dt of the T wave.
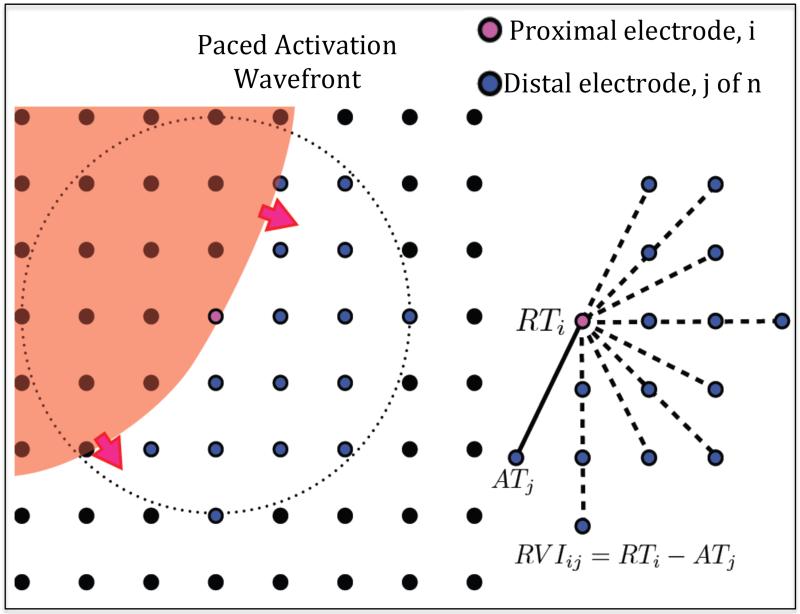
The neighbouring sites are then identified within a pre-defined radius by comparing each site’s coordinates in 3D space. Of those, identified as “downstream” sites (those that activate later than the site in question - Figure 2 – Left) the RVI is then calculated using the algorithm below;
Figure 2. RVI mapping.
Left - Activation wave (red) shown propagating through region of a recording electrode grid (black circles), with the current proximal recording electrode shown in pink. All downstream distal electrodes within a set radius are shown in blue. Right - RVIij is calculated as the difference between the repolarization time of the ith proximal electrode (RTi) and the activation time of each jth distal electrode (ATj) on the S2 beat.
RVIij = Re-entry Vulnerability Index of electrodes i and j
RTi = Repolarization time of electrode i (proximal)
ATj = Activation time of electrode j (distal) (Figure 2).
This results in a mesh of lines between pairs of points in which an RVI map is created from these paired values, which in the case of the human example also includes patient-specific ventricular geometry from the clinical mapping system. A map image is then produced by representing the value of RVI at each site as a color, in order to highlight small or negative RVI values to reveal the regions most-susceptible to re-entry.
Optimisation of the algorithm
Prior to its use on animal or human data, the parameters used in the algorithm were optimized using a theoretical analysis of their effect upon the calculated RVI between a pair of electrodes. Both the search radius of neighboring downstream sites and the resolution of the recording electrodes were identified as parameters that could be adjusted to maximize the sensitivity of the algorithm to discriminate between high and low re-entry vulnerability. Full details of this analysis are provided in the Supplementary Material (Figure S2).
Validation of the algorithm in an animal model
We tested our algorithm on data from an established animal heart model of repolarization heterogeneity which produced a region of shortened APD proximal to the stimulus site and prolonged APD distal to it (Figure 4). The preparation is summarised in the Supplemental Material[9]. Activation times and repolarisation times for each beat were measured at every mapping electrode site and the RVI mapping algorithm (above) applied under conditions when re-entry did and did not occur.
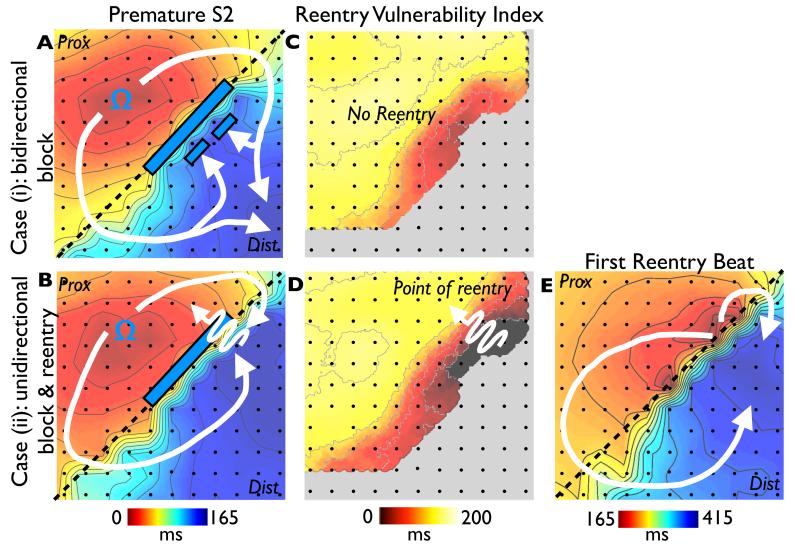
Figure 4. Animal experiments.
Activation sequence after premature stimulation (S2) from an experiment in a Langendorff pig heart model of inhomogeneous repolarization (APD shortened by Pinacidil above the dashed line and prolonged by sotalol below the dashed line) in the cases of unsuccessful (A) and successful (B) re-entry. The premature wavefront propagates from the stimulation site (Ω) and is recorded by the electrode grid (electrodes represented by dots). C & D show RVI corresponding maps, with the critical area of low RVI identified in D. E shows activation sequence of the first re-entrant beat.
In the case where re-entry did not occur (panel A) activation spread downwards from the stimulus site (Ω) and blocked as it entered the region of prolonged refractoriness (white bar). The wavefront travelled round the region of block (as shown in Figure 3A by curved white arrows) and arrived at the distal side while that region was still refractory, thus was unable to travel back through the line of block: there was subsequently no re-entry (Scenario as depicted in Figure 1B).
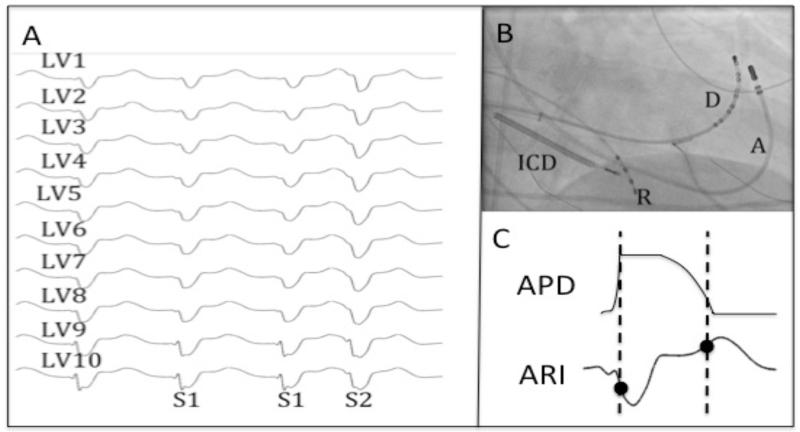
Figure 3. Data Collection.
A - Recordings of LV endocardial unipolar electrograms recorded via the Ensite 3000 system during steady state (S1) and premature activation (S2). B – Position of catheters on fluoroscopy (A – ablation catheter, D – decapole catheter, R – RV Apex catheter, ICD – ICD lead). C – Local activation and recovery times of the unipolar electrogram (following S2) were measured by the Wyatt method[10].
Figure 3B and 3E shows a similar situation but in this case the time of arrival of the wavefront at the distal side was later relative to the time of repolarization proximally, and the wave was able to re-enter the proximal region and complete a re-entry circuit (scenario as depicted in Figure 1C).
Figures 3C and 3D show the results of RVI mapping corresponding to Figures 5A and 5B respectively. In Figure 3D the algorithm identified a region where the RVI is very short compared to Figure 3C. Here, S2 activation distally occurred when S2 repolarization upstream was complete and the proximal portion was re-excitable, allowing re-entry and the initiation of VT. In Figure 3C, RVI measures were substantially longer and re-entry did not occur. Note that the critical area of susceptibility was still identified even when re-entry did not occur (Figure 3C).
Figure 5. Computational simulations.
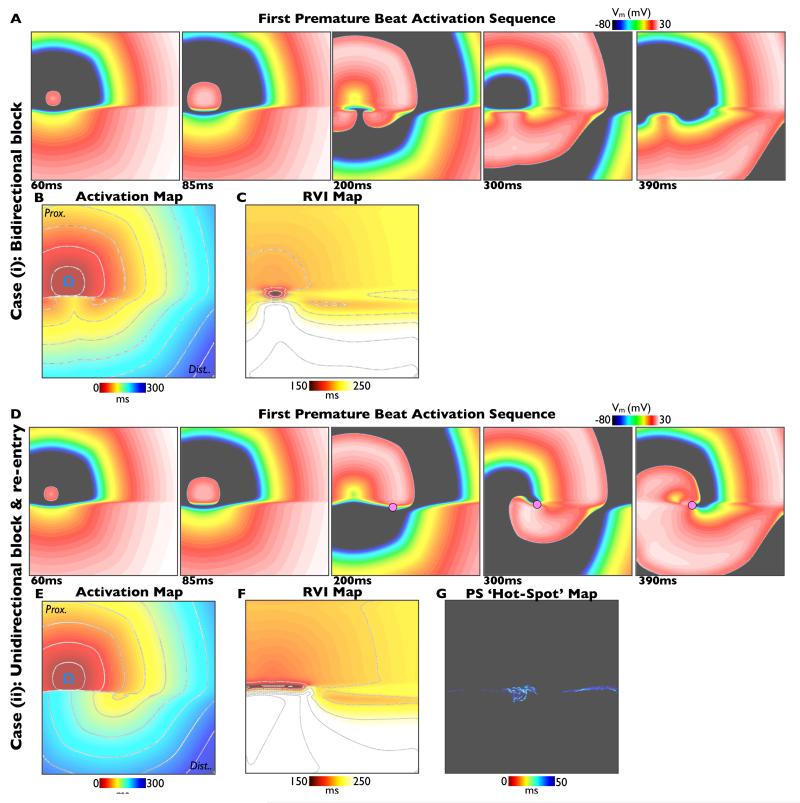
Simulations of premature S2 beats in the cases of bi-directional block (S2 interval 350ms, upper panels) and uni-directional block and re-entry (S2 interval 340ms, lower panels). In each case activation sequences (A, D), activation maps (B, E) and calculated RVI maps (C, F) are shown. Phase singularities are shown as pink circles in panel D. In the case of re-entry, a ‘hot-spot’ map showing cumulative spatial phase singularity locations is shown (panel G).
Computational Simulations
Electrical activation was simulated using a monodomain representation of ventricular tissue over a 2D sheet measuring 10×10cm. Ionic membrane dynamics were represented by the ten Tusscher cell model, with parameters adjusted to produce a region of prolonged APD in the lower half of the tissue. Full details are provided in the Supplemental Material. Simulations were performed with the Cardiac Arrhythmia Research Package.
Optical Mapping Experiments
Langendorff-perfused sheep hearts were imaged with voltage-sensitive fluorescent dyes during re-entry induction protocols. Full details are provided in the Supplemental Material.
Application to the human heart
A 63-year old man with a background of ischemic heart disease with recurrent hemodynamically tolerated VT was admitted for a VT ablation. In addition to the standard ablation procedure a short pacing programme was used for a post-procedure analysis. He had a background of a prior inferior infarction and had severely impaired systolic function. Antiarrhythmic medications were stopped prior to the procedure. The patient gave informed consent and the study was approved by the local ethics committee.
The pacing protocol involved pacing from the LV apex using the mapping catheter with a simple 8 beat S1 drive train with a cycle length of 600ms, followed by an S2 at 500ms. Unipolar electrograms were recorded from a decapolar catheter (Saint Jude Medical, 2mm inter-electrode distance and 5mm spacing between each electrode pair) positioned in the left ventricle (Figure 4). The electrograms and position of electrodes were recorded with Carto3 (Biosense Webster, Ca) with the mapping catheter remaining at the apex as the decapolar catheter was sequentially repositioned to 20 different LV locations to cover the entire endocardial surface. The same pacing protocol was applied after each repositioning of the decapolar catheter. Low amplitude electrograms with complex morphologies (as typically seen within the perimeter of the scar) were not recorded as these would invalidate the algorithm, with care taken to record normal electrograms just outside these regions (Figure S3). These measurements did not elicit any VT and the procedure subsequently continued its routine clinical course.
Electrophysiological recordings
Activation and repolarization times were computed using a semi-automated system which first identifies and discounts any cases where the T-wave is indistinct or corrupt, and then calculates the timing of activation and repolarization events using the Wyatt criteria[10], with further validity checks on relative magnitudes of key deflections in the electrograms. The algorithm, including error checking, is particularly designed for robust measures in the presence of noise; and has previously been described in detail (software was written using MATLAB R2010b, Mathworks, Inc Natick, MA, USA)[15].
Results
Computational Simulations
Figure 5 shows an example of a premature (Case (ii), re-entry initiated) and slightly less premature (Case (i), bidirectional block) S2 beat simulated within the heterogeneous 2D sheet, described above. The respective activation sequence images (panels 5A & 5D) and activation maps (panels 5B & 5E) show similar dynamics to the experimental preparation (Figure 3). In both Cases (i) and (ii), the S2 wavefront is initially blocked as it encounters refractory tissue in the region of long APD, travelling around the line of block and eventually entering the distal region of prolonged APD as it recovers. In Case (ii), the wavefront is able to propagate into recovered tissue at the site of initial block to successfully re-enter, whereas the tissue remains refractory in Case (i) and bidirectional block occurs. Panel 5F shows the computed RVI map for Case (ii), highlighting that the region of low RVI is distinctly co-located with the site of initial block and re-entry. Importantly, as in Figure 3, the corresponding RVI map for the case of failed re-entry (Case (i)) also shows low RVI values in a similar spatial location (panel 5C). Finally, for the case of sustained re-entry (Case (ii)), a ‘hot-spot’ map of cumulative phase singularity locations is shown (panel 5G), highlighting that the region of spiral wave rotor clustering occurs around the region of low RVI. Movies of all simulations can be found in the Supplemental Material.
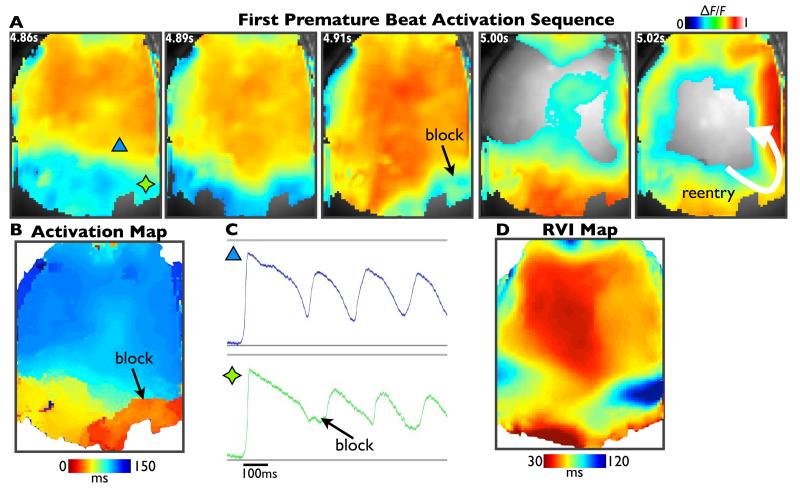
Optical Mapping
Figure 6 shows activation sequences (panel 6A) and activation map (panel 6B) from fluorescent optical mapping data for the premature S2 beat during a case of induced re-entry in the experimental Langendorff-perfused sheep heart preparation, described above. The S2 wavefront is initially blocked (4.91s image), but eventually propagates around this region of block and re-enters (5.02s image). Panel 6C shows example fluorescent signals from individual pixels, showing APD traces from sites located proximal (blue triangle) and distal (green star) to the line of block. Finally, panel 6D shows the computed RVI map, once again demonstrating that the region of low RVI is co-located with the site of initial block and re-entry.
Figure 6. Optical mapping.
Activation sequence images of normalised fluorescent optical mapping data (panel A), activation map (panel B) and calculated RVI map (panel D) following a premature S2 beat that successfully initiated re-entry. Panel C shows example fluorescent traces from a region proximal (blue) and distal (green) to the line of block.
RVI map to predict location of exit point in a human patient undergoing VT ablation
In order to test the feasibility of RVI mapping during clinical procedures, the algorithm was applied to the activation / repolarization mapping data obtained at 200 left ventricular endocardial sites in a patient with a previous myocardial infarction undergoing a routine VT ablation procedure.
Computation of site of maximum susceptibility to re-entry
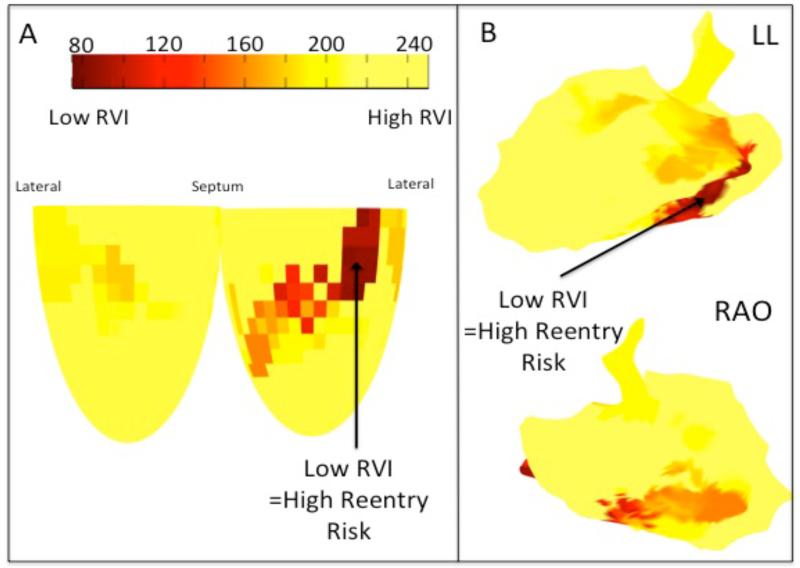
Figure 6 shows the spatial distribution of the RVI as calculated with the algorithm. The shortest values, which represent sites of highest susceptibility to re-entry, shown in dark red, are confluent in the postero-basal region.
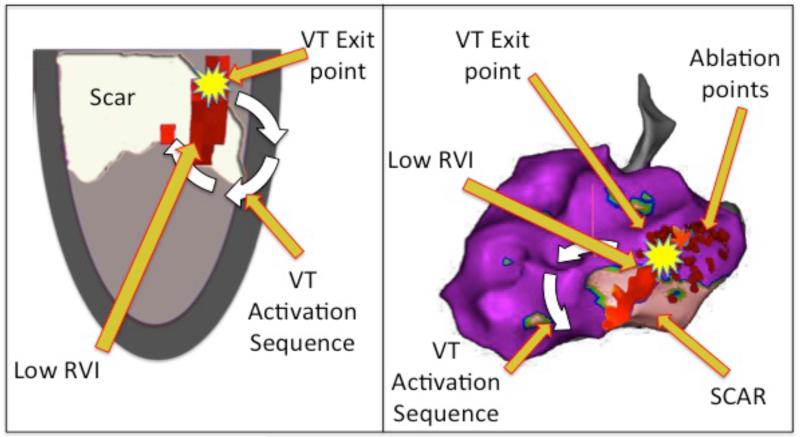
Following an isoprenaline bolus a spontaneous haemodynamically tolerated VT was induced, with the same cycle length (CL 430ms) as the clinical VT. The VT circuit was identified during the arrhythmia through a combination of activation mapping (Figure S4), locating diastolic potentials (Figure S5), and demonstrating entrainment with concealed fusion with a post-pacing interval only slightly longer than the VT cycle length (Figure S6). Radiofrequency ablation was performed in this region (Figure S7) terminating the VT, which was then no longer inducible and there has been no further VT episodes since. Superimposition of the RVI with scar, and circuit exit point is shown in Figure 8
Figure 8. Correlation of RVI with VT.
Left – Diagrammatic representation showing superimposed scar (white), activation sequence (white arrow) and area of low RVI (dark red area) co-localizing with VT exit point (yellow). Right – Carto geometry with the same features displayed on the left lateral projection of the 3D geometry. Small red dots show areas of endocardial ablation which resulted in termination and non-inducibility of the VT. White arrow represents the direction of circuit on leaving the exit point deduced from the activation map (Figure S7).
Discussion
We have developed an algorithm able to identify localized regions of high susceptibility to conduction block and re-entry using a novel parameter referred to as the re-entry vulnerability index (RVI). In an animal model of repolarization heterogeneity (mimicking the peri-infarct region) in which re-entry had been induced and mapped, the algorithm successfully identified the region of block and subsequent re-entry. We then applied this technique to a patient undergoing radiofrequency VT ablation in whom activation and repolarization times were measured from 200 electrode sites in the LV during pacing. From these data points the algorithm generated a global map of RVI which could be co-registered with the anatomy. It is of note that in this single example the RVI co-located with the VT exit site.
Optimization and experimental validation of the RVI mapping algorithm
Theoretical sensitivity analysis of the dependence of the RVI metric magnitude with respect to parameters used in its calculation allowed us to optimize the algorithm to robustly distinguish regions of block/re-entry. Although the search radius does effect the lowest RVI at distal sites the resulting RVI remains much higher than near the re-entry site under human electrophysiological conditions, and has no effect on lowest RVI in regions crossing the conduction block. The relatively minor increase in the error in RVI across the region of block as electrode resolution increased is only of the magnitude of 10ms for a 5mm electrode spacing; which is approximately the maximum electrode resolution expected to be achieved clinically during a dedicated procedure.
A low RVI is pro-arrhythmic and is enhanced by shorter action potential duration of the premature S2 in the proximal zone (see Figure 1C). Repolarization in the proximal region is determined by the local APD restitution characteristics. Steep APD restitution in this region therefore would be potentially pro-arrhythmic (shorter RVI) and conversely flattening restitution would be potentially anti-arrhythmic (longer RVI). This would be in keeping with the classic restitution hypothesis [16] and the known anti-fibrillatory effect of flattening APD restitution [17], although the latter considerations are likely more relevant to non steady-state conditions.
Clinical Application
RVI mapping may have clinical application. The treatment of VT by radiofrequency ablation may be very effective in individual cases but success rates overall are unsatisfactory[18]. The majority of ventricular tachycardia episodes following myocardial infarction are due to re-entry mechanisms, involving interaction between electrical activation and repolarization wavefronts[7].
Clinical ablation procedures typically focus on activation times rather than measure repolarization times in order to localize the circuit. The optimum ablation strategy aims to prevent the arrhythmia by interrupting the re-entry pathway by ablating within the isthmus and around the scar[19]. However this is only possible in a minority of cases, either because the arrhythmia is not haemodynamically tolerated or the VT is non-inducible. The majority of cases are treated by a substrate ablation strategy with higher recurrence rates of VT[20]. Furthermore multiple exits may exist that may remain undetected by these standard methods[19].
In ischemic cardiomyopathy re-entrant arrhythmias are based on anatomic re-entry involving the scar region, which provide the electrophysiological requirements of heterogeneous activation and repolarisation for initiating and maintaining the re-entry circuit. The re-entrant activation commonly involves conduction along channels of surviving myocardium that transect the infarcted region. Although conduction velocity along these surviving fibres is typically normal[21,22], the tortuosity of the channels causes a relatively long pathway and thereby a long conduction delay. Diastolic low-voltage potentials can be recorded from these channels, and can be seen to cover the entire diastolic interval. If the surviving fibres connect to non-infarcted myocardium circular activation can be accomplished. The apparent ‘focal’ origin of the tachycardia in reality is the exit point where the re-entrant activation emanates from the infarcted tissue. Experiment and theory predict that the site of unidirectional block in post infarct VT is located near the exit point in order to protect the isthmus[23]. Additional conduction delay is often provoked by a premature beat[24] and the completion of full re-entry depends on whether the normal tissue has regained excitability following the premature beat. These are the conditions identified by the RVI algorithm. The algorithm has the potential advantage that it does not require initiation of the tachycardia and employs non- critical prematurity of extra stimulation.
Limitations
Although the algorithm was tested in an established animal model of repolarizarion heterogeneity, it is in some ways artificial by comparison with the substrate for post infarction VT in patients. However our objective was to test the ability of the algorithm in relation to repolarisation heterogeneity related re-entry uncomplicated by other factors such as scar.
The study in one patient was intended to verify the prediction that an RVI map could be generated in the human ventricle during the course of a clinical procedure and that the RVI map could be co-registered with geometry acquired using a Carto mapping system (Biosense Webster, Ca). No attempt is made at this stage to establish a role for RVI mapping as an aid to ablation other than to demonstrate its feasibility.
Future work may identify the efficacy, sensitivity and specificity of this combined activation and repolarization mapping approach in radiofrequency ablation procedures in patients with VT.
Supplementary Material
Figure 7. Clinical RVI Map.
A – Diagrammatic representation of the LV showing a map of the spatial distribution of the RVI. B – RVI mapped on the 3D Carto geometry, displayed in the left lateral and right anterior oblique projections.
Acknowledgments
Grants and Financial Support: The research was supported by the Department of Health via the NIHR comprehensive Biomedical Research Centre award to Guy’s & St Thomas’ NHS Foundation Trust in partnership with King’s College London and King’s College Hospital NHS Foundation Trust, and by The Centre of Excellence in Medical Engineering funded by the Wellcome Trust and EPSRC (WT088641/Z/09/Z). BH and PT are supported by an MRC grant (G0901819) and RC is supported by a grant from Marató de TV3.
Industry related disclosures: NC is funded by an Educational Fellowship Grant and JG has an unrelated grant both from St. Jude Medical.
Abbreviations
- APD
Activation Potential Duration
- LV
Left ventricle
- RVI
Re-entry Vulnerability Index
- VT
Ventricular Tachycardia
Footnotes
Conflict of Interest: None.
References
- 1.Lopshire JC, Zipes DP. Sudden cardiac death: better understanding of risks, mechanisms, and treatment. Circulation. 2006;114:1134–6. doi: 10.1161/CIRCULATIONAHA.106.647933. [DOI] [PubMed] [Google Scholar]
- 2.Mines GR. On dynamic equilibrium in the heart. J Physiol. 1913;46:349–83. doi: 10.1113/jphysiol.1913.sp001596. [DOI] [PMC free article] [PubMed] [Google Scholar]
- 3.Han J, Moe GK. Nonuniform Recovery of Excitability in Ventricular Muscle. Circ Res. 1964;14:44–60. doi: 10.1161/01.res.14.1.44. [DOI] [PubMed] [Google Scholar]
- 4.Kuo CS, Munakata K, Reddy CP, Surawicz B. Characteristics and possible mechanism of ventricular arrhythmia dependent on the dispersion of action potential durations. Circulation. 1983;67:1356–67. doi: 10.1161/01.cir.67.6.1356. [DOI] [PubMed] [Google Scholar]
- 5.Gough WB, Mehra R, Restivo M, Zeiler RH, El-Sherif N. Re-entrant ventricular arrhythmias in the late myocardial infarction period in the dog. 13. Correlation of activation and refractory maps. Circ Res. 1985;57:432–42. doi: 10.1161/01.res.57.3.432. [DOI] [PubMed] [Google Scholar]
- 6.JP A. Increased dispersion of repolarization: a major mechanism behind the genesis of malignant ventricular arrhythmias in cardiac disease. In: Olsson SBAJ, Yuan S, editors. Dispersion of ventricular repolarization: State of the art. Futura Publishing Company; 2000. [Google Scholar]
- 7.Wellner MBO. Ionic mechanisms of ventricular action potential excitation. In: Zipes DPJJ, editor. Cardiac Electrophysiology: From cell to bedside. 2004. [Google Scholar]
- 8.Coronel R, Wilms-Schopman FJ, Opthof T, Janse MJ. Dispersion of repolarization and arrhythmogenesis. Heart Rhythm. 2009;6:537–43. doi: 10.1016/j.hrthm.2009.01.013. [DOI] [PubMed] [Google Scholar]
- 9.Coronel R, Wilms-Schopman FJ, Janse MJ. Anti- or profibrillatory effects of Na(+) channel blockade depend on the site of application relative to gradients in repolarization. Front Physiol. 2010;1:10. doi: 10.3389/fphys.2010.00010. [DOI] [PMC free article] [PubMed] [Google Scholar]
- 10.Wyatt RFBM, Evans AK. Estimation of ventricular transmembrane action potential durations and repolarization times from unipolar electrograms. Am J Cardiol. 1981;47:488. [Google Scholar]
- 11.Coronel R, de Bakker JM, Wilms-Schopman FJ, Opthof T, Linnenbank AC, Belterman CN, Janse MJ. Monophasic action potentials and activation recovery intervals as measures of ventricular action potential duration: experimental evidence to resolve some controversies. Heart Rhythm. 2006;3:1043–50. doi: 10.1016/j.hrthm.2006.05.027. [DOI] [PubMed] [Google Scholar]
- 12.Haws CW, Lux RL. Correlation between in vivo transmembrane action potential durations and activation-recovery intervals from electrograms. Effects of interventions that alter repolarization time. Circulation. 1990;81:281–8. doi: 10.1161/01.cir.81.1.281. [DOI] [PubMed] [Google Scholar]
- 13.Coronel R, de Bakker JM, Wilms-Schopman FJ, Opthof T, Linnenbank AC, Belterman CN, Janse MJ. Monophasic action potentials and activation recovery intervals as measures of ventricular action potential duration: experimental evidence to resolve some controversies. Heart Rhythm. 2006;3:1043–50. doi: 10.1016/j.hrthm.2006.05.027. [DOI] [PubMed] [Google Scholar]
- 14.Potse M, Vinet A, Opthof T, Coronel R. Validation of a simple model for the morphology of the T wave in unipolar electrograms. Am J Physiol: Heart Circ Physiol. 2009;297:H792–801. doi: 10.1152/ajpheart.00064.2009. [DOI] [PubMed] [Google Scholar]
- 15.Western D, Taggart P, Hanson B. Real-time feedback of dynamic cardiac repolarization properties. IEEE Eng Med Biol Soc Conf. 2010:114–7. doi: 10.1109/IEMBS.2010.5626087. [DOI] [PubMed] [Google Scholar]
- 16.Riccio ML, Koller ML, Gilmour RF., Jr. Electrical restitution and spatiotemporal organization during ventricular fibrillation. Circ Res. 1999;84:955–63. doi: 10.1161/01.res.84.8.955. [DOI] [PubMed] [Google Scholar]
- 17.Garfinkel A, Kim YH, Voroshilovsky O, Qu Z, Kil JR, Lee MH, Karagueuzian HS, Weiss JN, Chen PS. Preventing ventricular fibrillation by flattening cardiac restitution. PNAS. 2000;97:6061–6. doi: 10.1073/pnas.090492697. [DOI] [PMC free article] [PubMed] [Google Scholar]
- 18.Aliot EM, Stevenson WG, Almendral-Garrote JM, Bogun F, et al. EHRA/HRS Expert Consensus on Catheter Ablation of Ventricular Arrhythmias. Heart Rhythm. 2009;6:886–933. doi: 10.1016/j.hrthm.2009.04.030. [DOI] [PubMed] [Google Scholar]
- 19.Stevenson WG, Delacretaz E. Radiofrequency catheter ablation of ventricular tachycardia. Heart. 2000;84:553–9. doi: 10.1136/heart.84.5.553. [DOI] [PMC free article] [PubMed] [Google Scholar]
- 20.Ponti RD. Role of catheter ablation of ventricular tachycardia associated with structural heart disease. World J Cardiol. 2011;3:339–50. doi: 10.4330/wjc.v3.i11.339. [DOI] [PMC free article] [PubMed] [Google Scholar]
- 21.de Bakker JM, Coronel R, Tasseron S, et al. Ventricular tachycardia in the infarcted, Langendorff-perfused human heart: role of the arrangement of surviving cardiac fibers. J Am Coll Cardiol. 1990;15:1594–607. doi: 10.1016/0735-1097(90)92832-m. [DOI] [PubMed] [Google Scholar]
- 22.de Bakker JM, van Capelle FJ, Janse MJ, Tasseron S, Vermeulen JT, de Jonge N, Lahpor JR. Slow conduction in the infarcted human heart. ‘Zigzag’ course of activation. Circulation. 1993;88:915–26. doi: 10.1161/01.cir.88.3.915. [DOI] [PubMed] [Google Scholar]
- 23.Segal OR, Chow AW, Peters NS, Davies DW. Mechanisms that initiate ventricular tachycardia in the infarcted human heart. Heart Rhythm. 2010;7:57–64. doi: 10.1016/j.hrthm.2009.09.025. [DOI] [PMC free article] [PubMed] [Google Scholar]
- 24.Saumarez RC, Camm AJ, Panagos A, Gill JS, Stewart JT, de Belder MA, Simpson IA, McKenna WJ. Ventricular fibrillation in hypertrophic cardiomyopathy is associated with increased fractionation of paced right ventricular electrograms. Circulation. 1992;86:467–74. doi: 10.1161/01.cir.86.2.467. [DOI] [PubMed] [Google Scholar]
Associated Data
This section collects any data citations, data availability statements, or supplementary materials included in this article.


