Abstract
Traumatic brain injury (TBI), characterized by acute neurological dysfunction, is one of the best known environmental risk factors for chronic traumatic encephalopathy (CTE) and Alzheimer's disease (AD), whose defining pathologic features include tauopathy made of phosphorylated tau (p-tau). However, tauopathy has not been detected in early stages after TBI and how TBI leads to tauopathy is unknown. Here we find robust cis p-tau pathology after sport- and military-related TBI in humans and mice. Acutely after TBI in mice and stress in vitro, neurons prominently produce cis p-tau, which disrupts axonal microtubule network and mitochondrial transport, spreads to other neurons, and leads to apoptosis. This process, termed “cistauosis”, appears long before other tauopathy. Treating TBI mice with cis antibody blocks cistauosis, prevents tauopathy development and spread, and restores many TBI-related structural and functional sequelae. Thus, cis p-tau is a major early driver after TBI and leads to tauopathy in CTE and AD, and cis antibody may be further developed to detect and treat TBI, and prevent progressive neurodegeneration after injury.
Traumatic brain injury (TBI) is the leading cause of death and disability in children and young adults1 and in the US, ~2.5 million people suffer TBI each year2. Nearly 20% of the 2.3 million troops deployed by the military have sustained TBI3. Repetitive mild TBI (rmTBI), seen in contact sports, or even single moderate/severe TBI (ssTBI), seen in military blasts, may cause acute and potentially long-lasting neurological dysfunction, including the development of chronic traumatic encephalopathy (CTE)4-9. TBI is also an established environmental risk factor for Alzheimer's disease (AD)7-12. However, no treatment is available to prevent CTE or AD.
CTE is characterized by neurofibrillary tangles made of hyperphosphorylated tau4-9. Such tangles are also a hallmark of AD and related neurodegenerative disorders, collectively termed tauopathies13, 14. Tauopathy spreads in brains15-19 and is reduced by immunotherapy against tauopathy epitopes20-22. However, since little tauopathy is detectable acutely or subacutely after TBI in humans and mice5, 7-9, 23-25, whether tauopathy is a cause or consequence of post-traumatic neurodegeneration is unknown.
We have identified a unique proline isomerase, Pin1 that inhibits tauopathy in AD by converting the phosphorylated Thr231-Pro motif in tau (p-tau) from cis to trans in AD cell and mouse models26-34. In human AD, Pin1 is inhibited by multiple mechanisms27, 29, 35-37, whereas the Pin1 genetic polymorphism that prevents its down-regulation is associated with delaying AD age of onset38. In addition, Pin1 is located at a locus associated with late-onset AD39, p-tau appears early in pretangle AD neurons40 and its cerebrospinal fluid level correlates with memory loss in MCI and AD41. We have developed antibodies that distinguish cis from trans p-tau and discovered that trans p-tau is physiological, promoting MT assembly, whereas the cis is early pathogenic, leading to tauopathy in AD42. Currently, it is unknown whether cis p-tau is present after TBI and if so, how to specifically eliminate it.
Robust cis p-tau in human CTE brains
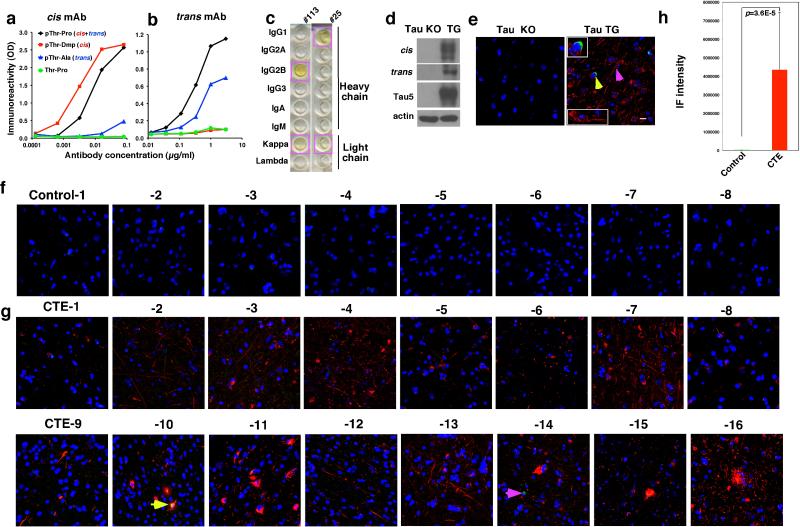
We generated mouse monoclonal antibodies (mAbs), which, like our polyclonal antibodies42 were able to distinguish cis from trans tau. We identified a cis mAb clone, #113, and a trans mAb clone, #25, with no cross-reactivity (Extended Data Fig. 1a, b). Both clones reacted to a pT231-tau peptide, but not its non-phosphorylated counterpart (Extended Data Fig. 1a, b).
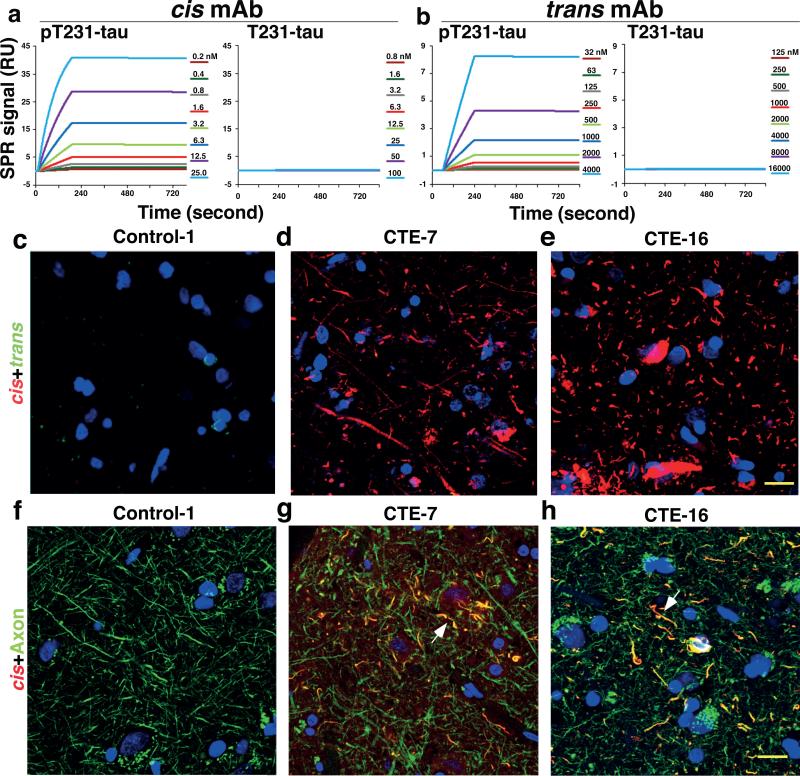
We determined antibody binding affinities using a Biacore assay. cis and trans mAbs specifically recognized the p-tau peptide (Fig. 1a, b), with their binding constants (Kd) being 0.27 and 42.1 nM, respectively (Table 1). Their IgG isotypes were IgG2b and IgG1, respectively (Extended Data Fig. 1c). Immunofluorescence (IF) and immunoblotting (IB) analyses showed robust cis signals in the soma and neurites, and trans signals in the soma in Tau-TG mice, but not in tau-null mice (Extended Data Fig. 1d, e) Thus, cis and trans mAb behave similarly to theirpolyclonal counterparts42.
Figure 1. Robust cis, but not trans, p-tau at diffuse axons in human CTE brains.
a, b, cis (a) or trans (b) mAb were immobilized on a sensor chip CM5 for surface plasmon resonance and their binding to pT231- or T231-tau peptide at different concentrations were recorded by SRP sensorgrams. c-h, The frontal cortex of neuropathologically verified human CTE brains and normal controls were subjected to double IF with cis (red) or trans (green) mAbs (c-e), N=16 for CTE and 8 for controls, or with cis pT231 (red) and the axonal marker tau (green), along with DNA dye (blue) (f-h), N=4. Two typical cis p-tau immunostaining patterns are presented, with all cases being shown in Extended Data Fig 1f. Arrows, colocalization; Bars, 20 μm.
Table 1.
Binding affinities of cis and trans mAbs.
| mAb | Peptide | Ka (Ms−1) | Kd (s−1) | Kd (nM) |
|---|---|---|---|---|
| cis | pT231-tau | 40,700 | 1.10×10⁻⁵ | 0.27 |
| cis | T231-tau | 0.17 | 1.00×10⁻⁵ | 58,820 |
| trans | pT231-tau | 250 | 1.05×10⁻⁵ | 42.0 |
| trans | T231-tau | 4.5 | 1.95×10⁻⁵ | 4,333 |
The association rate constant (Ka), dissociation rate constant (Kd), and binding constant (Kd) of cis and trans mAbs toward pT231- or T231-tau peptide were determined by Biacore analysis. Ms−1, millisecond; M, molar; s, second.
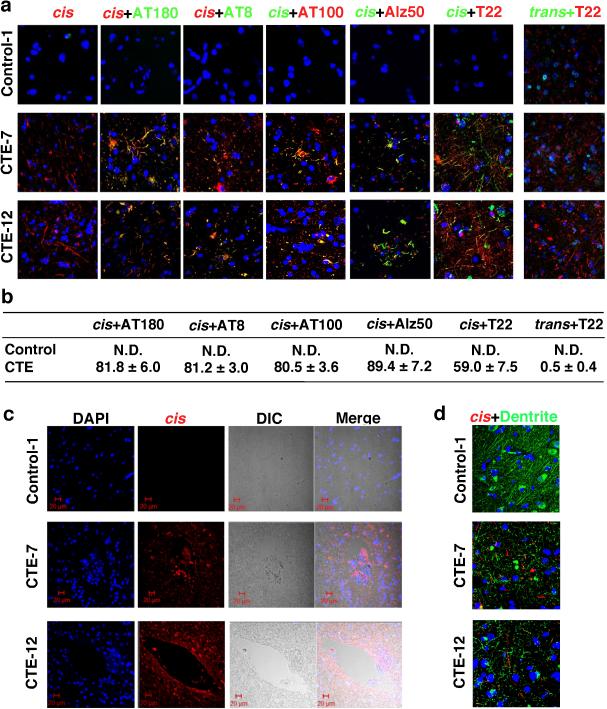
Since the T231 tau phosphor-epitope is identical among species, we performed double IF with cis and trans mAbs on CTE brain tissues from 16 patients with a history of TBI exposure and 8 healthy controls6 (Supplemental Table 1). While trans mAb detected a few neurons in the soma in control and CTE brains, cis mAb detected no signal in control brains, but robust signals were observed in diffuse neurites in all CTE brains examined, with two typical patterns evident, distinguished by one with stronger cis p-tau signals, especially in soma (Fig. 1d, e and Extended Data Fig. 1f-h). cis mAb co-localized with AT180 (recognizing pT231-tau), T22 (tau oligomers43), AT8 (early tangles), and AT100 and Alz50 (mature tangles), but trans mAb did not co-localize with T22 (Extended Data Fig. 2a, b). cis p-tau was more concentrated near blood vessels (Extended Data Fig. 2c), as expected6. cis p-tau co-localized diffusely with the axonal marker tau, but not the dendritic marker MAP2, in CTE brains (Fig. 1g, h and Extended Data Fig. 2d). Thus, cis p-tau localizes primarily to diffuse axons in CTE brains.
cis p-tau is earliest TBI tau epitope
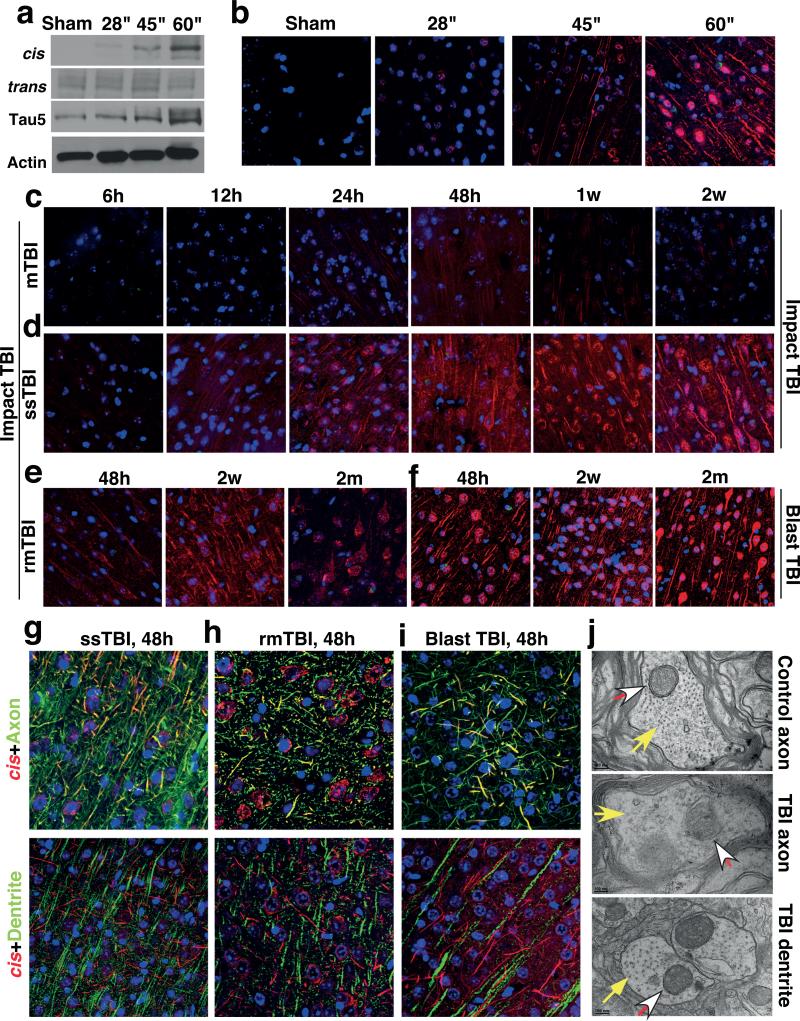
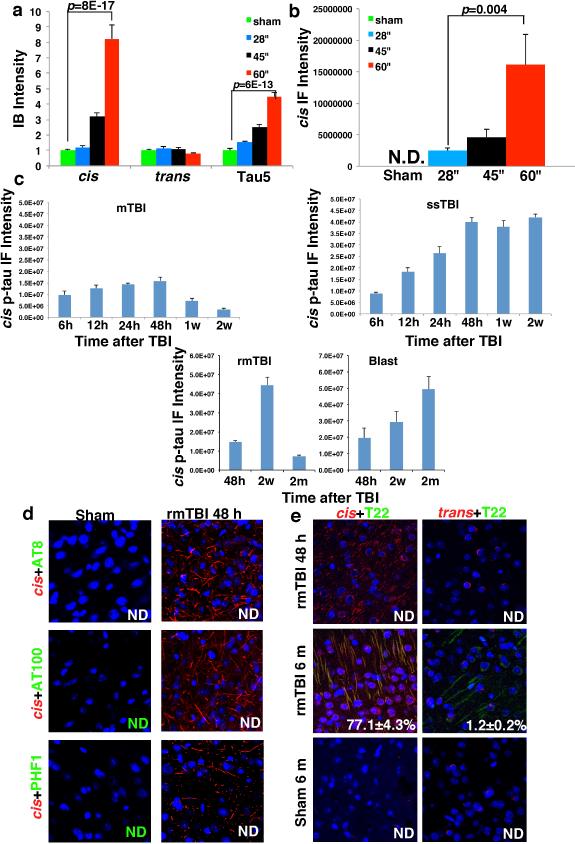
To determine the temporospatial characteristics of cis p-tau induction after TBI, we used TBI mouse models induced by impact25 and blast5, modeling sport- and military-related TBI, respectively. 48 h after impact TBI, cis, but not trans, p-tau was elevated in a severity-dependent manner, correlating with total tau (Fig. 2a, b and Extended Data Fig. 3a, b), and reflecting the stability of cis p-tau42. While single mild TBI (mTBI) moderately and transiently induced cis p-tau, which returned to the baseline by 2 weeks, single moderate/severe TBI (ssTBI) robustly and persistently induced cis p-tau, starting at 12 h and peaking at 48 h, but sustaining high levels over time (Fig. 2c, d and Extended Data Fig. 3c). Both repetitive mild TBI (rmTBI) and blast TBI also induced robust and persistent cis p-tau induction, with more profound effects in the latter (Fig. 2e, f and Extended Data Fig. 3c).
Figure 2. While mTBI has moderate and transient effect, rmTBI, ssTBI or blast TBI leads to robust and persistent cis p-tau induction notably in diffuse axons starting at 12-24 hr.
a, b, Mice were subjected to single TBI by 54 g weight drop from varying heights, followed by IB (a) and IF (b) to detect cis and trans p-tau 48 h later. cis, red; trans, green; DNA, blue. c-e, Mice were subjected to single mTBI (c), ssTBI (d) or rmTBI (e), followed by IF to detect cis and trans p-tau at different times after last injury. N=4. f, Mice were subjected to blast-induced TBI, followed by IF to detect cis and trans p-tau at different times. N=3. g-i, ssTBI (g), rmTBI (h) and blast TBI (i) brain sections at 48 hr after last injury were subjected to double IF with cis pT231 (red) and axon marker neurofilament SMI312 (green) or dendrite marker MAP2 (green), along with DNA dye (blue). N=4; Arrows, colocalization; Bars, 20 μm. j, ssTBI or sham mice were subjected to EM analysis 48 h after injury to examine the structure of MTs (filled arrows) and MI (open arrows) at axons and dendrites.
Robust cis p-tau was detected 48 hr after TBI without tau oligomers, aggregation or tangle epitopes (Extended Data Fig. 3d, e, and see results later). cis p-tau localized mainly to axons, but not dendrites in impact and blast TBI models (Fig. 2g-i), as in CTE brains (Fig. 1g, h and Extended Data Fig. 2d). cis p-tau expression was associated with axonal injury with marked disruption of MTs and mitochondria (MI), which was notably absent in dendrites (Fig. 2j),consistent with the fact that TBI mainly affects axons44. Thus, robust cis p-tau is induced in axons acutely after impact and blast TBI long before other forms of p-tau appear.
cis p-tau spreads and is toxic after TBI
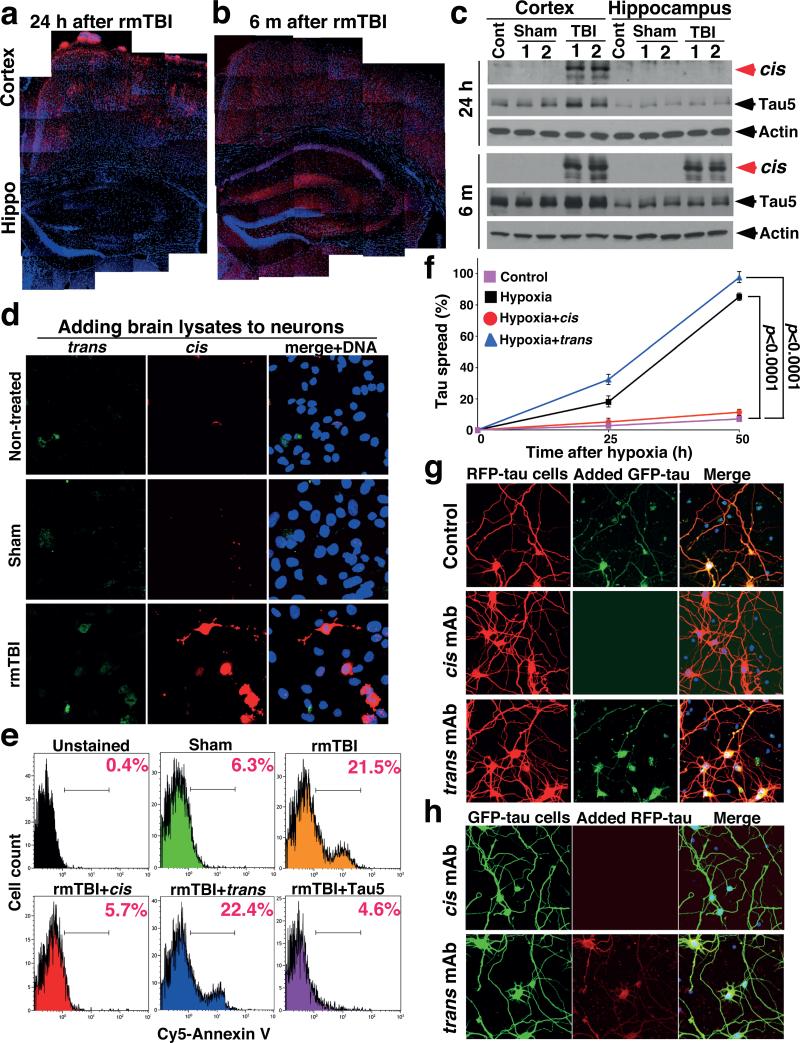
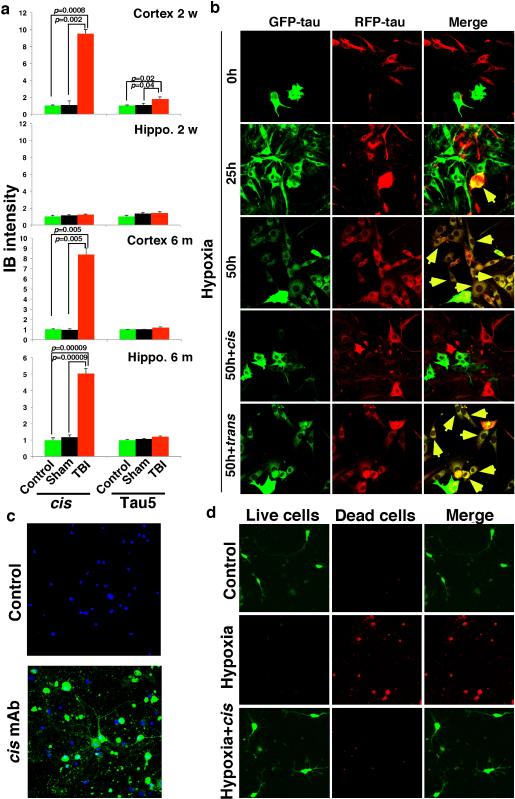
Further analysis showed cis p-tau spreading in the brain after TBI. cis p-tau was mainly limited to the cortex from 24 h to 2 months after rmTBI, but 6 months later, robust cis p-tau was detected in the cortex and other brain regions including hippocampus (Fig. 3a-c). Marked cis p-tau spread from the cortex to the hippocampus and even to other side of the brain was also observed after blast TBI (data not shown). To examine whether cis p-tau might be neurotoxic, brain lysates prepared from rmTBI and sham mice 6 months post-injury were added to growing cultured neurons overnight. cis, but not trans, p-tau was readily detected in neurons treated with rmTBI lysates, but not when treated with sham controls (Fig. 3d). Compared with untreated or sham-treated controls, neurons treated with rmTBI lysates had much higher rates of apoptosis, which was rescued by immunodepletion of total tau or cis, but not trans, mAb (Fig. 3e). Thus, after impact and blast TBI, cis p-tau is robustly induced, spreads through the brain over time, and induces apoptosis that is blocked by cis mAb.
Figure 3. cis p-tau spreads in the brain after rmTBI, and spreads and causes neurotoxicity after neuronal stress in vitro, which are fully blocked by cis, but not trans, mAb.
a-c, 24 hr or 6 months after rmTBI, mouse brains were subjected to IF (a, b) and IB (c) to detect cis p-tau in different brain regions. N=4. d, e, Mouse brain lysates prepared from 6 month after rmTBI or sham controls were added to culture media of SY5Y neurons for 17 h directly or after immunodepletion with cis or trans mAb, followed by IF with cis and trans mAbs or Annexin V FACS. N=3. f, SY5Y neurons stably expressing GFP-tau or RFP-tau were co-cultured and then treated with hypoxia or control in the presence or absence of cis or trans mAb for different times, followed by assaying cells expressing both GFP-tau and RFP-tau (mean ± S.D.). p values, two-way ANOVA test. g, h, Primary mouse neurons were transfected with GFP-tau or RFP-tau, and then subjected to hypoxia treatment in the absence or presence of cis or trans mAb for 36 hours. Resulting filtered soluble media from GFP-expressing neurons were added to RFP-expressing neurons (g) or vice versa (h), followed by detecting entry of added tau.
Stress induces cis p-tau, blocked by mAb
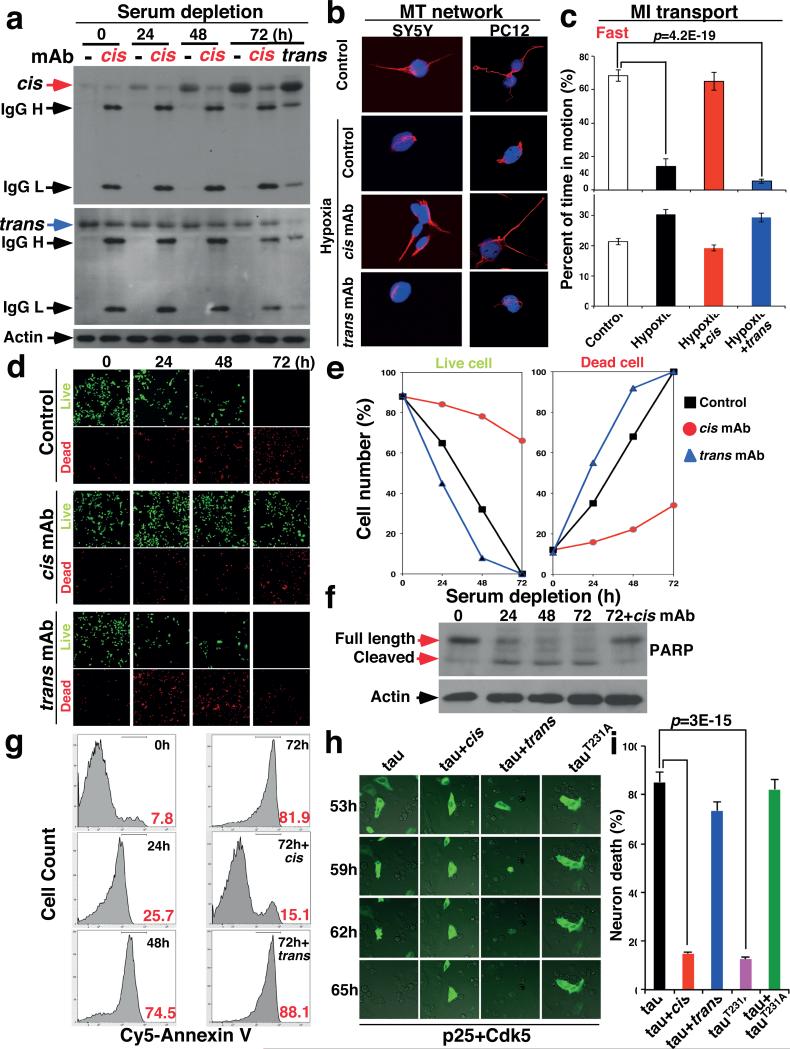
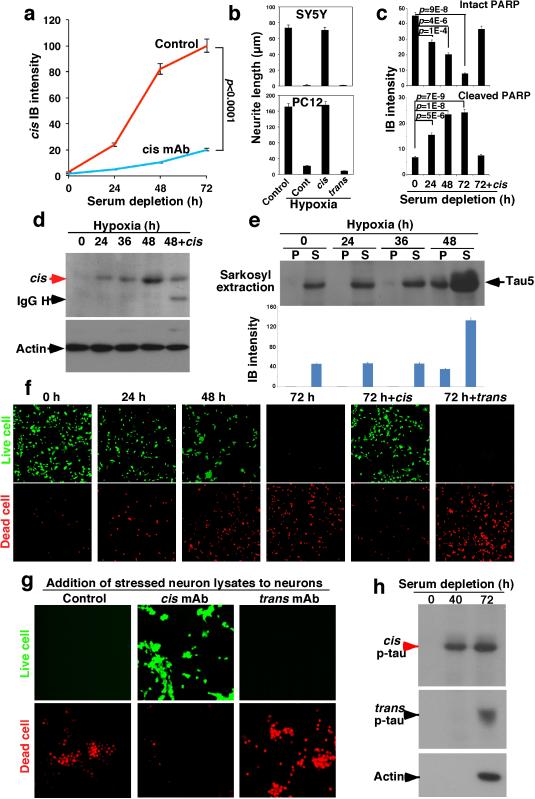
To understand how cis p-tau induces apoptosis and spreads through the brain, we examined the in vitro response to neuronal stress, serum starvation or hypoxia. Both conditions induced cis, but not trans, p-tau (Fig. 4a and Extended Data Fig. 4a, d), well before tau aggregation (Extended Data Fig. 4e). The addition of stressed neuron lysates to neurons induced cell death, which was rescued by immunodepletion with cis, but not trans, mAb, as detected by the live/dead assay (Extended Data Fig. 4g). To examine whether cis p-tau is implicated in tau spreading, we generated SY5Y cells stably expressing GFP-tau or RFP-tau, and co-cultured them with or without stress. Without hypoxia, neurons continued to express either GFP-tau or RFP-tau, but rarely both proteins (Fig. 3f, and Extended Data Fig. 5b). However, consistent with cis p-tau spreading in TBI brains (Fig. 3a-c and Extended Data Fig. 5a), hypoxia induced cis p-tau (Extended Data Fig. 4d), and caused progressive tau spreading, which was prevented by cis, but not trans, mAb (Fig. 3f and Extended Data Fig. 5b). Moreover, serum-starved neurons released cis, but not trans, p-tau at 40 h before neuronal death at 72 h (Extended Data Fig. 4h). Similar patterns of cis p-tau spread and neurotoxicity were also observed in primary neurons and blocked by cis, but not trans, mAb (Fig. 3g, h, Extended Data Fig. 5c, d). Thus, toxic cis p-tau is induced and spreads after neuronal stress, similar to TBI.
Figure 4. Stressed neurons robustly produce cis p-tau leading to cistauosis, which is blocked by cis mAb, but enhanced by trans mAb.
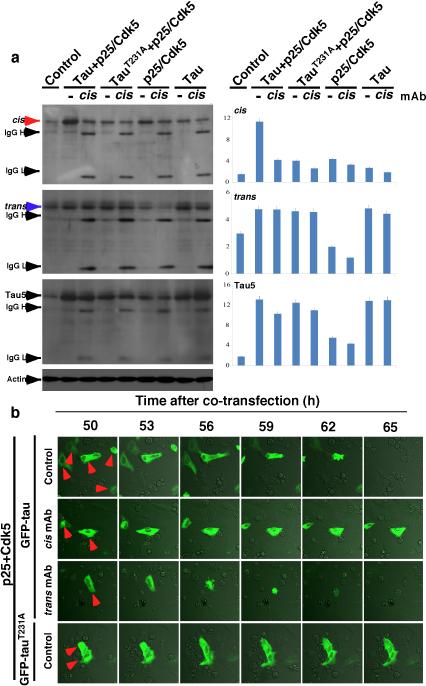
a, SY5Y cells were cultured without serum for different times in the absence and presence of cis or trans mAb, followed by IB for cis and trans p-tau. b, SY5Y and differentiated PC12 cells were treated with hypoxia in the absence and presence of cis or trans mAb for 48h, followed by staining for MTs. c, Differentiated PC12 cells were treated with hypoxia in the absence and presence of cis or trans mAb for 48 h, followed by live-cell microscopy to capture fast and slow transport of MI along neurites. d-g, SY5Y cells were cultured without serum for different times in the absence and presence of cis or trans mAb, followed by live/dead cell assay (d, e) and apoptosis assays using PARP cleavage (f) and Annexin V (g). h, i, SY5Y cells were co-transfected with GFP-tau or -tauT231A and p25/Cdk5, followed by live-cell imaging to observe cell death of GFP-tau expressing cells over 65 h (h), with quantification being shown (i) (mean ± S.D.). p values, ANOVA test.
cis mAb blocks cistauosis after stress
Given the ability of cis mAb to block tau from spreading and inducing apoptosis, we examined whether cis or trans mAb could affect intracellular p-tau after stress. Indeed, cis mAb entered neurons and effectively blocked time-dependent cis p-tau induction, without affecting trans following serum starvation (Fig. 4a and Extended Data Fig. 4a) or hypoxia (Extended Data Fig. 4d). Conversely, trans mAb reduced trans, but not cis, p-tau (Fig. 4a), indicating that the two isomers are not readily interchangeable, as suggested in TBI (Fig. 2) or CTE (Fig. 1), and AD42.
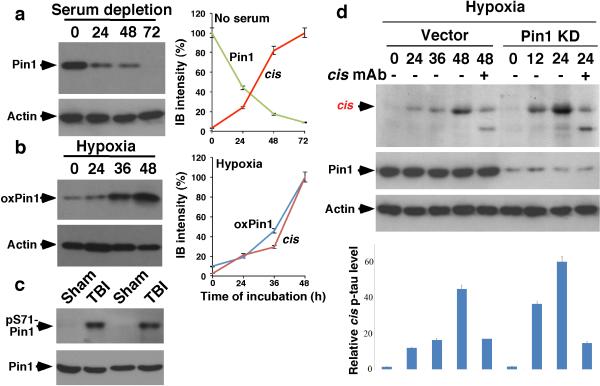
Since Pin1 inhibition by downregulation27, 29, C113 oxidization35 and S71 phosphorylation36, 37 contributes to tauopathy in AD, we asked whether such Pin1 inhibition contributes to cis p-tau induction after stress. cis induction correlated highly with Pin1 downregulation after serum starvation and Pin1 C113 oxidization after hypoxia (Extended Data Fig. 6a, b). Pin1 S71 phosphorylation was also markedly elevated in TBI brains (Extended Data Fig. 6c). Moreover, Pin1 knockdown enhanced cis p-tau induction by hypoxia, which was eliminated by cis mAb (Extended Data Fig. 6d). Since Pin1 knockout induces p-tau accumulation only in old mice29, 32, 42 and stress activates Pro-directed kinases, increased tau phosphorylation may be also important for cis p-tau induction after stress or TBI.
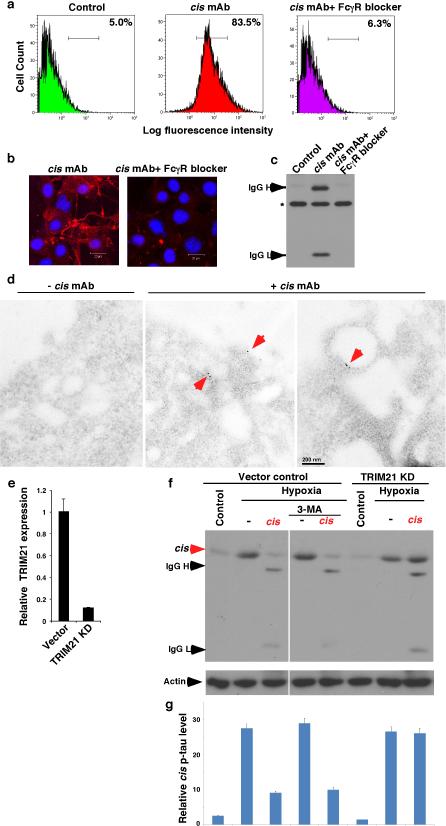
Given the ability of cis mAb to ablate intracellular cis p-tau, we evaluated how cis mAb might enter neurons to remove cis p-tau. Tau mAbs enter neurons via Fcγ receptors45 and mAbs trigger targeted protein degradation by the TRIM21-mediated proteasome pathway46. Indeed, blocking Fcγ receptors prevented cis mAb from binding to or entering neurons (Extended Data Fig. 7a-c). Immunogold EM showed cis mAb on the outer cell surface and in intracellular vesicles (Extended Data Fig. 7d). TRIM21 knockdown46, but not the autophagy inhibitor 3-MA, prevented cis mAb from ablating cis p-tau (Extended Data Fig. 7e-g). Thus, cis mAb likely enters neurons via Fcγ receptors to target cis p-tau degradation.
To examine the functional significance of neuronal cis p-tau induction and elimination, we investigated whether cis p-tau might affect the MT network and function since cis, but not trans, p-tau loses its MT function42. Hypoxia not only induced cis p-tau (Extended Data Fig. 4d), but also caused MT collapse in neurites, an effect that was rescued by cis, but not trans, mAb (Fig. 4b and Extended Data Fig. 4b). Measuring MI movement along neurites showed that hypoxia stopped MT-based fast transport, but not actin-based slow movement (Fig. 4c and Supplementary Video 1, 2). This MI transport defect was restored by cis mAb, but not trans mAb (Fig. 4c and Supplementary Video 3), with the latter even causing neurite retraction (Supplementary Video 4), likely by trans-associated promotion of MT assembly42.
Serum starvation led to robust apoptosis by the time cis p-tau was highly induced, which was potently rescued by cis, but not, trans mAb, as detected by a live/dead assay (Fig. 4d, e), PARP cleavage (Fig. 4f and Extended Data Fig. 4c) and Annexin V FACS (Fig. 4g). Similar results were obtained with hypoxia (Extended Data Fig. 4f), even in primary neurons (Extended Data Fig. 5c, d). Thus, neuronal stress robustly induces cis p-tau, which disrupts axonal MTs and organelle transport, spreads to other neurons and leads to apoptosis. These phenotypes, potently rescued by cis but not trans mAb, are here termed “cistauosis”.
To determine the importance of cis p-tau for neurotoxicity, we co-transfected neurons with GFP-tau or its T231A mutant and p25/Cdk5 phosphorylating tau on Th231 and others27, 47. Co-expression of tau, but not its T231A mutant, with p25/Cdk5 increased cis p-tau, which was eliminated by cis mAb (Extended Data Fig. 8a). Importantly, most GFP-tau-, but not -tauT231A-expressing cells were dead by 62 h, which was markedly blocked by cis mAb, but accelerated by trans mAb (Fig. 4h, i and Supplementary Videos 5, 6). Thus, cis p-tau is necessary and sufficient for p-tau to induce neurotoxicity.
cis mAb potently treats TBI and CTE
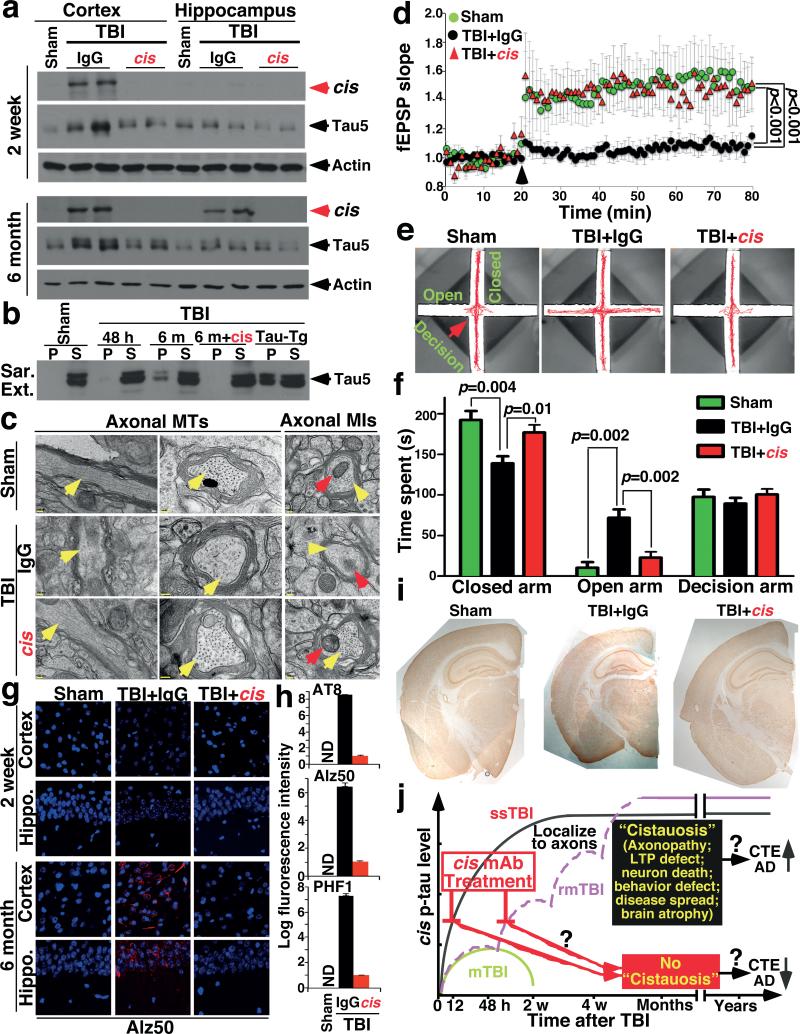
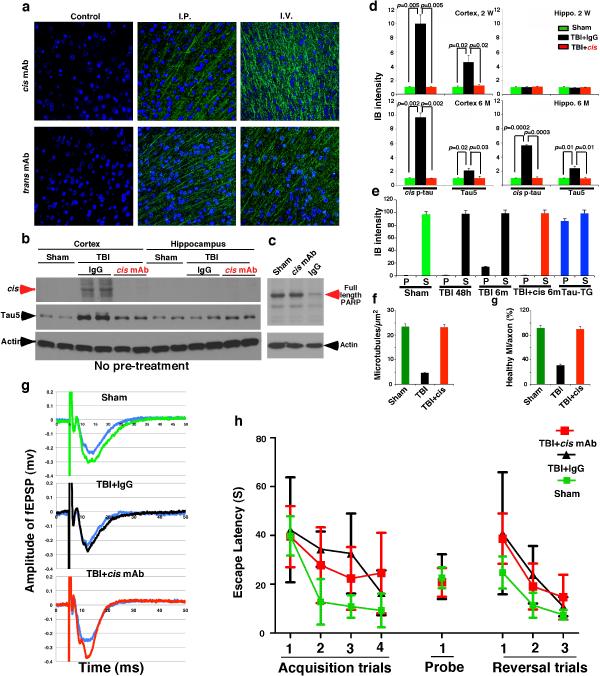
To evaluate the efficacy of cis mAb in treating TBI in vivo, we showed that cis or trans mAb were detected in brains 3 days after peripheral administration (Extended Data Fig. 9a). After treating ssTBI mice with cis mAb or IgG isotype control for 2 weeks, cis mAb effectively eliminated cis p-tau induction, both with and without pre-treatment (Fig. 5a and Extended Data Fig. 9b, d), and also potently reversed post-TBI ultrastructural pathologies of axonal MTs and MIs (Fig. 5c and Extended Data Fig. 9f), defective cortical axonal long-term potentiation (Fig. 5d and Extended Data Fig. 9g), and even apoptosis (Extended Data Fig. 9c), which is observed after TBI even in humans48.
Figure 5. Treating ssTBI mice with cis mAb blocks early cistauosis, prevents tauopathy development and spread, and improves histopathological and functional outcomes.
a, b, ssTBI mice were treated with cis mAb or control IgG for times indicated, along sham mice as controls, followed by IB to detect cis p-tau (a), and sarcosyl extraction to detect tau aggregation (b). N=4. c, d, After 2 week treatment, ssTBI mice were subjected to EM for axonal structures of MTs (yellow arrows) and MIs (red arrows) (c) or cortical fSPSP recording (d) (mean ± S.E.M.). Black arrow, theta-burst application; n=15 slices from 9 sham; n=9 slices from 5 IgG or cis mAb mice . p values, one-way ANOVA with Bonferroni posthoc test. e, f, after 2 month treatment, ssTBI mice were subjected to the elevated plus maze (e) and time spent in three arms was measured (f) (mean ± S.E.M.). n=4 for sham; n=7 for IgG or cis mAb. p values, Student's t test. g, h, After 2 week or 6 month treatment, ssTBI mice were subjected to IF with tauopathy mAbs (g), with quantification in the hippocampus being shown (h) (means ± s.d.). n=4. i, After 6 month treatment, ssTBI mice were immunostained with NeuN before determining brain thickness. n=4. j, Unlike single mTBI, rmTBI or ssTBI causes robust and persistent cis p-tau induction within 12-24 hr post-injury, which induces cistauosis, long before commonly known tauopathy and brain atrophy, hallmarks of CTE and AD. cis mAb not only blocks early cistauosis, but also prevents long-term neurodegeneration after TBI.
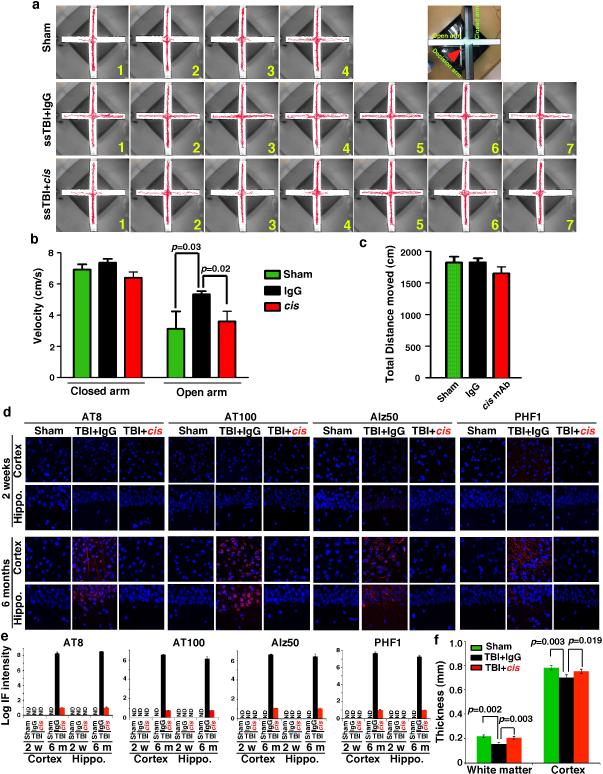
To determine the impact of cis mAb on behavioral or functional outcomes after TBI, we treated ssTBI mice with cis mAb for 2 months. There was no difference in hippocampal-dependent spatial memory between IgG and cis mAb-treated TBI mice (Extended Data Fig. 9h). However, as cis p-tau was concentrated in the medial prefrontal cortex at this time point (Fig. 3a), we utilized the elevated plus maze, an innate anxiety/risk-taking paradigm that involves cortical circuitry49 and is affected by TBI50. All groups moved similar distances and times in the decision arm (Fig. 5e, f and Extended Data Fig. 10a-c). Sham mice stayed in the two closed or “safe” arms (Fig. 5e, f and Extended Data Fig. 10a and Supplementary Video 7), but all IgG-treated ssTBI mice strikingly displayed “risk-taking” behavior, exploring the two open or “aversive” arms (Fig. 5e, f and Extended Data Fig. 10a, b and Supplementary Video 8), consistent with disinhibition in a dysfunctional medial prefrontal cortex49. By contrast, cis mAb-treated mice exhibited minimal risk-taking behavior, similar to sham mice (Fig. 5e, f and Extended Data Fig. 10a, and Supplementary Video 9).
To examine the effects of cis mAb on tauopathy development and spread, and brain atrophy, hallmarks of CTE7-9, we treated ssTBI mice with cis mAb for 6 months. cis mAb effectively prevented tauopathy development and spread, as assayed by cis p-tau, tau oligomers, aggregation and tangle epitopes (Fig. 5a, b, g, h, and Extended Data Fig. 9d, e, 10d, e), and brain atrophy in the cortex and white matter (Fig. 5i, and Extended Data Fig. 10f). Thus, cis mAb not only eliminates cis p-tau and cistauosis, but also prevents tauopathy development and spread, restores LTP and behavioral defects, as well as prevents brain atrophy after TBI (Fig. 5j).
Discussion
Here, we used cis p-tau mAbs to demonstrate the presence of, and specifically eliminate, pathogenic cis p-tau in clinically relevant in vitro and in vivo models of sport- and military-related TBI. We found robust cis p-tau after sport- and military-related TBI in humans and mice, and in stressed neurons. Following TBI or neuronal stress, cis p-tau induces cistauosis well before previously identified tauopathy is apparent. Treating TBI mice with cis mAb ablates cis p-tau and eliminates cistauosis, prevents the development of widespread tauopathy and restores histopathological and many functional outcomes of TBI. Cistausosis is an early precursor of previously described tauopathy and an early marker of neurodegeneration that can be blocked bycis mAb. We previously showed that cis p-tau plays an early pathological role in AD27-34, 42. Our current data provide a direct link from TBI to CTE and AD, and suggest that cistauosis is a common early disease mechanism in TBI, CTE and AD, and that cis p-tau and its mAb may be useful for early diagnosis, prevention and therapy for these devastating diseases (Fig. 5j).
ONLINE METHODS
Mouse mAb production
cis and trans mouse mAb were produced using the general strategy that we used to generate polyclonal cis and trans antibodies, as described42. Briefly, Balb/c female mice (2-3 months old) obtained from the Jackson Laboratories (Bar Harbor, ME) were immunized with 100 μg of pThr231-Homoproline (pThr231-Pip) tau peptide (CKKVAVVRpT(Pip)PKSPSSAK) that was coupled to KLH with N-terminal Cys mixed with complete Freund's adjuvant and boosted twice. The titration of antibody production was monitored using ELSA. When sufficient titration of antibody was produced, splenocytes were isolated and fused with SP2/0 myeloma cells to produce hybridoma cell lines, followed by screening for positive clones using ELISA for cis and trans mAbs. When positive clones were identified, they were subcloned by a limited dilution to generate single pure clones. mAbs were produced by injecting 2ml of 2.5 × 10⁶ cells/ml hybridoma cells into nude mice intraperitoneally to collect ascites, followed by purifying mAbs from ascites using antibody purification kit (Pierce) and their specificity were fully characterized. All these animal experiments were approved by Beth Israel Deaconess Medical Center IACUC and complied with the NIH Guide for the Care and Use of Laboratory Animals.
ELISA assays
ELISA assays were performed using wild-type phosphorylated Thr231-Pro tau (KVAVVRpTPPKSPS), non-phosphorylated Thr231 tau (KVAVVRTPPKSPS), cis locked phosphorylated Thr231-Dmp tau (KVAVVRpT(5,5-dimethyl-L-proline)PKSPS) and trans lock phosphorylated Thr231-Ala tau (P232A)(KVAVVRpTAPKSPS) peptides, as described 42. Briefly, peptides at various concentrations in 2,2,2-Trifluoroethanol (50 μl) were plated onto maxi soap ELISA plate and dried up at 37°C overnight. After blocking with buffer containing 5 % milk, 0.4 % bovine serum albumin and 0.05% Tween 20 in Tris-Buffered Saline, the cis or trans mAbs at various dilutions in 5% milk, 0.4% bovine serum albumin and 0.05% Tween 20 in Tris-Buffered Saline (50 μl) was loaded and incubated at room temperature for 2 hours, followed by incubation with horseradish peroxidase (HRP)-conjugated anti-rabbit IgG in 5% milk, 0.4% bovine serum albumin and 0.05% Tween 20 in Tris-Buffered Saline (50 μl) for 1 hour. The ELISA plates were washed 4 times with buffer containing 0.4% BSA and 0.05% Tween 20 in TBS after each step. The signals were detected by incubating with TMB substrate solution and were measured by Wallac 1420 software at 450 nm.
Surface plasmon resonance
Surface plasmon resonance experiments were performed on a BIAcore 3000 surface plasmon resonance instrument (GE Healthcare-BIAcore) as described by the manufacturer. Briefly, Biacore sensor chip CM-5 was activated by using EDC (1-ethyl-3-(3-dimethylaminopropyl)-carbodiimide) and NHS (N-hydroxysuccinimide) in a 1:1 ratio for 7 minutes. Anti-mouse IgG (Fc) (GE healthcare) was immobilized at pH5 on flow cells 1 and 2, followed by the capture of 3.7 μg/ml of cis or trans mAb in 10 mM Sodium acetate with a flow rate of 5 μl/min. Then all tau peptides were injected at different concentrations in filtered, degassed 0.01 M Hepes buffer, 0.15 M NaCl, 0.005% surfactant P20, pH 7.4 at a flow rate of 50 μl/min for 3 min on both flow cells 1 and 2 and allowed to dissociate for 10 min. All samples were run in duplicate. After each run with a single antibody concentration, the surface was totally regenerated by10 mM Glycine pH 1.7 flow late 10μl/min for 5 sec. Data analysis was performed by using BIAevaluation software (GE healthcare-BIAcore).
Immunoblotting analysis and immunodepletion experiment
Immunoblotting analysis was carried out as described42. Briefly, brain tissues or culture cells were lysed in RIPA buffer (50 mM Tris-HCl, pH 7.4, 150 mM NaCl, 2 mM EDTA, 1% NP 40, 0.1% SDS, 0.5% Nadeoxycholate, 50 mM NaF) containing proteinase inhibitors and then mixed with the SDS sample buffer and loaded onto a gel after boiling. The proteins were resolved by polyacrylamide gel electrophoresis and transferred to PVDF membrane. After blocking with 5% milk in TBST (10 mM Tris-HCl pH 7.6, 150 mM NaCl, 0.1% Tween 20) for 1 hr, the membrane was incubated with primary antibodies (cis and trans mAbs), Tau5 (Biosource Camarillo, CA), α-tubulin (Sigma, St. Louis, MO) and β-actin antibodies (Sigma, St Louis, MO) in 5% milk in TBST overnight at 4°C. Then, the membranes were incubated with HRP-conjugated secondary antibodies in 5% milk in TBST. The signals were detected using chemiluminescence reagent (Perkin Elmer, San Jose, CA). The membranes were washed 4 times with TBST after each step. To deplete cis or trans p-tau from lysates, brain or cell lysates were mixed with the cis or trans mAb antibody at 425 μg/ml in RIPA buffer containing proteinase inhibitors for 3 h at 4°C and then mixed with protein A/G Sepharose for 1 hours at 4°C, followed by collecting the supernatants for experiments. The supernatants were dialyzed against phosphate buffer saline (137 mM NaCl, 2.7 mM KCl, 10 mM Na2HPO4, 1.8 mM KH2PO4) for overnight prior to cell culture application. Immunoblotting results were quantified using Quantity One from BioRad.
Sarkosyl extraction
Isolation of sarkosyl-insoluble and soluble fractions of cells and brain tissues was performed as described29, 32, 42, with slight modifications. Briefly, whole brains of mice were homogenized by polytron in 10 volumes of buffer H (10 mM Tris-HCl [pH 7.5] containing 0.8M NaCl, 1 mM EGTA, and 1 mM dithiothreitol). The cell extraction was also performed with a convenient amount of buffer H (200 μl / 35 mm culture dish) and sonication. The samples were spun at 100,000 × g for 30 min at 4°C. Another 2 ml of buffer H was added to the pellet and the samples were homogenized again by polytron, incubated in 1% Triton X-100 at 37°C for 30 min. Following the incubation, the samples were spun at 100,000 × g for 30 min at 4°C, the pellet was homogenized by polytron on 1 ml of buffer H and was then incubated in 1% sarkosyl at 37°C for 30 min and spun at 100,000 × g for 30 min at 4°C. The supernatant was then collected (sarkosyl-soluble fraction). Detergent-insoluble pellets were extracted in 100 μl of urea buffer (8 M urea, 50 mM Tris-HCl [pH 7.5]), sonicated, and spun at 100,000 × g for 30 min at 4°C. The supernatant was then collected (sarkosyl-insoluble fraction). The protein concentrations of extracts were determined by BCA assay (Thermo Scientific). Sarkosyl-insoluble and -soluble fractions were run on SDS-PAGE gels.
Immunostaining Analysis
The primary antibodies used were cis and trans mAb, tau tangle-related mAbs AT180, AT8, AT100 (all from Innogenetics, Alpharetta, GA), oligomeric tau T22 polyclonal antibodies (EMD Millipore, Billerica, MA), PHF1 and Alz50 (gifts from Dr. Peter Davies), anti-tau rabbit mAb (E178, Abcam) and anti-neurofilament mouse mAb (SMI-312, IgG1, Abcam) for labeling axons, and anti-MAP2 mAb (SMI-52, IgG1, Abcam) for labeling dendrites. Immunofluorescence staining of mouse and human brains was done essentially as described29, 32, 42. After treatment with 0.3 % hydrogen peroxide, slides were briefly boiled in 10 mM sodium citrate, pH 6.0, for antigen enhancement. The sections were incubated with primary antibodies overnight at 4°C. Then, biotin-conjugated secondary antibodies (Jackson ImmunoResearch), streptavidin-conjugated HRP (Invitrogen) were used to enhance the signals. For double immunofluorescence staining, the sections were also incubated with and Alexa Fluor 488 or 568 conjugated isotype-specific secondary antibodies (Jackson ImmunoResearch, West Grove, PA) for 1 h at room temperature. Manufacturer-supplied blocking buffer (Invitrogen) was used for each reaction. The sections were washed 4 times with TBS after each step. Labeled sections were visualized with a Zeiss confocal microscope. The gain of confocal laser was set at the level where there are no fluorescence signals including autofluorescence in sections without primary antibody but with secondary antibody. Immunostaining images and their colocalization were quantified using Volocity 6.3 from Perkin Elmer and Fiji/ImagJ Coloc 2, respectively.
Electronic microscopy
Sham and TBI mouse models treated with either control IgG or cis mAb were perfused with a fixative solution, a mixture of 15% picric acid (13% saturated solution; Sigma, St. Louis, MO, USA), 4% paraformaldehyde (Electron Microscopy Sciences, Hatfield, PA, USA), and 0.1% glutaraldehyde (EM grade 50% solution; Electron Microscopy Sciences) dissolved in PEM buffer (0.1 M PIPES, pH 7.2, 1 mM EGTA, 1 mM MgCl2). Perfused brains were removed, sliced and kept in the same fixative for further 4 hours at 4°C. The samples were processed for electron microscopic observation as described51, 52. Specimens were examined with a JEM-1010 transmission electron microscope (JEOL). For immunogold staining, SY5Y cells were treated with cis mAb for 18 hr, trypsinized and collected by centrifugation, followed by fixation with 4% PFA. Samples were dehydrated with ethanol, processed for LR white resin embedding and sectioning, followed by gold staining as described53.
Human brain specimens
Fixed human brain tissue from the frontal cortex of individuals with neuropathologically verified CTE was provided from the VA-BU-SLI Brain Bank of the Boston University Alzheimer's Disease Center CTE Program, including 16 patients with a history of exposure to TBI and 8 age-matched healthy controls (Supplementary Table 1)6. Next of kin provided written consent for participation and brain donation. Institutional review board approval for brain donation was obtained through the Boston University Alzheimer's Disease Center, CTE Program, and the Bedford VA Hospital. Institutional review board approval for neuropathological evaluation was obtained through Boston University School of Medicine6. Our studies on human samples have been approved by our Institutional Review Boards at Boston University and Beth Israel Deaconess Medical Center
Transgenic overexpression and knockout mice
Tau-Tg mice54 and Tau knockout mice55 (Jackson laboratory) in the C57BL/6 background were generated, as described29, 32, 42. Animal care and use for the experiments have been approved by Institutional Animal Care and Use Committees at Beth Israel Deaconess Medical Center.
Cell culture
Neuronal cell lines including SH-SY5Y, PC12, H4 cells were cultured in Dulbecco's modified Eagle's medium (DMEM) containing 10% fetal calf serum. The media were supplemented with 100 Units/ml penicillin/steptomycin. PC12 cells were differentiated with NGF (50 ng/ml) and cultured for 2 days before stress. SY5Y cells (2.5 × 10⁵ per ml) were transiently co-transfected with 2.5 μg GFP-tau, 2.5 μg Cdk5 and 2.5 μg p25 with Lipofectamine 2000 (Invitrogen) as described 40. Cells were treated with cis or trans mAbs at 85 μg/ml once 4 hours after transfection until observation.
Cell viabilities were examined using Live & Dead cell assay kit (Abcam) according to the manufacturer. For apoptosis assay, cells were trypsinized and suspended in a binding buffer (10 mM HEPES, pH 7.4; 140 mM NaCl; 2.5 mM CaCl 2), stained with Annexin V (Biolegend #640912) for 15 minutes and subjected for flow cytometry. Brain or cell extracts were applied to culture SY5Y cells for 18 hours and the cell viabilities were examined as described earlier. We performed the cell or brain lysate extraction using RIPA buffer but efficiently dialyzed the extracts against PBS for 48 hours dialysis with 4 changes of buffer.
Stably overexpressing RFP or GFP-tau SY5Y cells were routinely generated. Briefly, the plasmids pcDNA3.1-tau-RFP and -GFP constructed through restriction sites and were transfected into SY5Y cells via Lipofectamine 2000. Cells stably expressing tau selected with G418). Equal number of GFP- and RFP-tau expressing cells (2.5 × 10⁵ per ml) were cocultured, treated or untreated with either cis or trans mAbs at concentration of 170 μg/ml for 18 hours before moving into hypoxia chamber.
To testing cell or brain lysates, accordingly, we performed the extraction using RIPA buffer but efficiently dialyzed the extracts against PBS with a cocktail of protease inhibitors at 4°C for 48 hours dialysis with 4 changes of the buffer. After dialysis, we examined cis tau concentration and conformation with IB and applied the amount of dialyzed lysates similar to the original lysates to culture dishes. SY5Y cells were treated with 3-Methyladenine at concentration of 5 mM for 24 hours.
Primary neurons were prepared from 17-day-old embryonic mouse brain cerebral cortex of either sex. Neurons were seeded on pre-coated culture dishes (2 × 10⁵ per ml). The medium was then changed to neurobasal medium supplemented with B27 (Invitrogen) and 1 mM L-glutamine as described52. Neurons were infected with lentivirus coding for either GFP- or RFP-Tau for 72 hours.
Mitochondrial transport assay
PC12 cells were differentiated with NGF (Cell Signaling) at 50 ng/ml and cultured for 2 days before stress. They were treated with cis or trans mAbs at 85 μg/ml for 18 hours and transferred into hypoxia chamber for 48 hr more. Then, mitochondria were stained using Mitotracker Green FM (Life technologies) according to manufacturer and observed with a Zeiss confocal microscope for 30 min using an incubation chamber with 5% CO2 at 37°C. Fluorescent images of labeled mitochondria in the longest process of each PC12 cell were acquired at intervals of 5 s over a period of 30 min. Individual mitochondrial movements were analyzed with ZEN 2008 software (Zeiss). Differences in the position of each mitochondrion between two frames during each 5 s interval were exported to Excel, and they were classified and scored as stationary, fast (>0.05 μm/s) or slow (<0.05 μm/s) movements.
Traumatic brain injury
The mouse mild TBI model was used as previously described25, 56. Briefly, male C57BL/6 mice (2-3 months old) obtained from the Jackson Laboratories (Bar Harbor, ME) were randomized to undergo injury or sham-injury. The mice were anesthetized for 45 seconds using 4% isoflurane in a 70:30 mixture of air:oxygen. Anesthetized mice were placed on a delicate task wiper (Kimwipe, Kimberly-Clark, Irving, TX) and positioned such that the head was placed directly under a hollow guide tube. Mouse's tail was grasped. A 54 -gram metal bolt was used to deliver an impact to the dorsal aspect of the skull, resulting in a rotational acceleration of the head through the Kimwipe. Mice underwent single severe injury (ssTBI, 60-inch height), singe mild injury (mTBI, 28-inch height), or repetitive mild injuries (rmTBI, 7 injuries in 9 days). Sham-injured mice underwent anesthesia but not concussive injury. All mice were recovered in room air. Anesthesia exposure for each mouse was strictly controlled to 45 seconds. Blast-induced TBI mouse model was performed as described5. Briefly, anesthetized adult wild-type C57BL/6 male mice were exposed to a single blast or sham blast, removed from the apparatus, monitored until recovery of gross locomotor function, and then transferred to their home cage. Maximum burst pressure compatible with 100% survival and no gross motor abnormalities was ascertained empirically. All these and following animal experiments were approved by the Boston Children's Hospital, Beth Israel Deaconess Medical Center and/or Boston University and IACUC and complied with the NIH Guide for the Care and Use of Laboratory Animals.
Antibody treatment of mice
Mice undergoing TBI were randomized to treatment with anti-cis p-tau monoclonal mouse antibody or mouse IgG2b. Mice received 1 dose of cis antibody or IgG2b intraperitoneal pretreatment (i.p. 200 μg/per mouse) 3 days prior to the injury (which was omitted in some experiments), post-injury treatment with single intracerebroventricular (ICV) treatment (20 μg in 5 microlittles) 15 minutes after injury, then post treatment 200 μg i.p. every 4 days for 3 times and analyzed brains 14 days later for IB or fEPSP recording, followed by 200 μg i.p. weekly for another 1.5 month (with total 2 months of treatment) before the elevated plus maze or the Morris Water Maze in a double blindness manner. After the above treatment, some mice received further antibody treatment, by 200 μg i.p. biweekly for another 4 months before assaying cis p-tau spread, tau aggregation and tauopathy and brain atrophy at 6 months after ssTBI, as described29, 32, 42. For all behavioral tests, experimenters were blinded to injury and treatment status, using color-coding stored in a password protected computer.
Electrophysiology
Mice were anesthetized with isoflurane (NDC 10019-360-40, Baxter Healthcare Corporation Deerfield, IL, USA) and decapitated. The brains were quickly removed and placed for sectioning in ice-cold treatment artificial cerebrospinal fluid (tACSF) containing (in mM) NaCl 124, KCl 3, NaH2PO4 1.25, NaHCO3 26, CaCl2 2, MgSO4 2, and glucose 10 (pH 7.4, and bubbled with 95% O2 and 5% CO2 gas mixture). Cortical slices (thickness 350 μm) were cut with a Vibratome 1000P (Leica VT1000P, Leica Microsystems Inc., Buffalo Grove, IL, USA) and transferred to a chamber with oxygenated tACSF for 90 min at 30°C before recording.
Field excitatory postsynaptic potentials (fEPSP) were recorded using a multi-electrode array recording system (MED64 system) with MED-P5155 probe (AutoMate Scientific, Inc., Berkeley, CA, USA) in this study. After incubation, one cortical slice was positioned in the center of the MED64 probe (to fully cover the 8 × 8 electrode array) with oxygenated recording ACSF (rACSF) containing (in mM) NaCl 124, KCl 3, NaH2PO4 1.25, NaHCO3 26, CaCl2 2, MgSO4 1, and glucose 10 (pH 7.4) at 30°C. A fine nylon mesh and a mesh anchor were placed on top of the slice to immobilize the slice during recording. The probe with immobilized slice was connected to two MED64 amplifiers [MED64 Head Amplifier (MED-A64HE1) and Main Amplifier (MED-A64MD1), AutoMate Scientific, Inc., Berkeley, CA, USA]. The slice was continuously perfused with oxygenated, fresh rACSF at the rate of 2 ml/min using a peristaltic pump (Minipuls 3, Gilson Inc., Middleton, WI).
Data was collected using Mobius software (Mobius 0.4.2). Field potentials were induced by single pulses (0.2 ms) delivered at 0.05 Hz through one planar microelectrode in layer V of cortical slice. We used stimulus intensity sufficient to induce a 50% of the maximal fEPSP slope in all experiments. The fEPSP was recorded from the channels in layer II/III. A stable fEPSP slope for at least 20 minutes was recorded as baseline. The induction protocol of LTP that we used is 5Hz theta burst (each burst consists of 4 pulses at 100hz). The data were filtered at 10 kHz and digitized at a 20 kHz sampling rate. Data were analyzed off line by the MED64 Mobius software. For quantifying the level of LTP, the mean of fEPSP slope (10-40%) within the last 10-min's recording was normalized and expressed as a fold change of the averaged baseline (first 10 min of the baseline). Three successive responses were averaged. Statistics were performed using the number of slices as ‘n’ value, and one to two slices per animal. p values was calculated using one-way ANOVA with Bonferroni posthoc test.
Morris water maze
A Morris water maze (MWM) paradigm was used to evaluate spatial learning and memory as described25, 57. Briefly, a white pool (83 cm diameter, 60 cm deep) was filled with water to 29 cm depth. Water temperature was maintained at approximately 24°C. Several highly visible intra- and extra-maze cues were located in and around the pool. The target platform (a round, clear, plastic platform 10 cm in diameter) was positioned 1 cm below the surface of the water. During hidden and visible platform trials, mice were randomized to one of four starting quadrants. Mice were placed in the tank facing the wall and given 90 seconds to find the platform, mount the platform, and remain on it for 5 seconds. Mice were then placed under a heat lamp to dry before their next run. Time until the mouse mounted the platform (escape latency) was measured and recorded. Mice that failed to mount the platform within the allotted time (90 seconds) were guided to the platform by the experimenter and allowed 10 seconds to become acquainted with its location. Each mouse was subjected to a maximum of two trials per day, each consisting of four runs, with a 45-minute break between trials. For visible platform trials, a red reflector was used to mark the top of the target platform. For probe trials, mice were placed in the tank with the platform removed and given 60 seconds to explore the tank. Noldus Ethovision 9 software tracked swim speed, total distance moved, and time spent in the target quadrant where the platform was previously located. When mice underwent repeat MWM testing, 2 to 3 months or 6 months after their final injury, the platform was moved to a different quadrant than that used previously.
Elevated plus maze
The elevated plus maze was used to assess anxiety/risk-taking behavior two months after injury and carried out as described58. Briefly, the elevated plus-maze consists of two open and two closed arms (30×5cm) extended out opposite from each other from a central platform (decision zone) to create a plus shape. The entire apparatus is raised 85 cm above the floor (Lafayette Instruments). Mice are placed on the center platform of the maze, facing a closed arm, and allowed to explore the apparatus for 5 minutes. The maze is cleaned between subjects with a weak ethanol solution and dried. A computer-assisted video-tracking system (Noldus Ethovision) recorded the total time spent in the open center (decision zone), and the two closed or “safe” arms and the two open or “aversive” arms. The percent time spent in the open arms is used as a surrogate measure of anxiety/risk-taking behavior; mice with lower levels of anxiety/risk-taking behavior spend less time in the open arms.
Immunohistochemistry
Mice were intra-cardiacally perfused with 4% paraformaldehyde at various time points after injury and brains were collected for histopathological outcomes. Serial 20μm coronal frozen sections from sham and injured brains were cut on a cryostat (Leica) from the anterior frontal lobes through the posterior extent of the dorsal hippocampus. Every 10th section was collected and mounted on slides.
Statistical analysis
Experiments were routinely repeated at least three times, and the repeat number was increased according to effect size or sample variation. We estimated the sample size considering the variation and mean of the samples. No animals or samples were excluded from any analysis. Animals were randomly assigned groups for in vivo studies and for mAb treatment experiments in mice, group allocation and outcome assessment were also done in a double blinded manner. For all behavioral tests, experimenters were blinded to injury and treatment status, using color coding stored in a password protected computer. All data are presented as the means ± s.d. except behavioral tests where data are presented as the means ± s.e.m, followed by determining significant differences using the two-tailed Student's t test for quantitative variables or ANOVA test for continuous or three or more independent variables or one-way ANOVA with Bonferroni posthoc test, and significant p-values <0.05 are shown.
Extended Data
Extended Data Figure 1. Characterization of cis and trans p-tau mAbs and robust cis p-tau in human CTE brains.
a, b, Characterization of the specificity of cis and trans p-tau mAbs by ELISA. cis (a) and trans (b) antibodies at various concentrations were incubated with cis (pT231-Dmp), trans (pT231-Ala), cis+trans (pT231-Pro) or T231-Pro tau peptides, followed by detecting the binding by ELISA. Representative examples of ELISA are shown from 3 independent experiments. pT231-Pro, CKKVAVVRpT(Pro)PKSPSSAK; pT231-Pip, CKKVAVVRpT(homoproline)PKSPSSAK; pT231-Ala, KVAVVRpT(Alanine)PKSPS; pT231-Dmp (KVAVVRpT(5,5-dimethyl-L-proline)PKSPS). c, Determination of the isotypes of cis and trans p-tau mAbs. Isotypes of cis and trans mAb heavy and light chains were determined by ELISA assay using a commercially available assay kit. d, e, Characterization of the specificity of cis and trans p-tau mAbs by IB and IF. Brain lysates (d) or sections (e) prepared from tau-deficient (KO) or wild-type tau-overexpressing (TG) mice were subjected to IB or IF with cis and/or trans antibody. The cis and trans signals were readily detected in TG, but not at all in KO mouse brains, with cis in the soma and neurites (pink arrow), but trans only in the soma (yellow arrow) (insets). Similar results were observed in at least three different animals. cis, red; trans, green; DNA, blue. f-h. Robust cis p-tau in human CTE brains. 16 CTE brain tissues and 8 healthy controls were subjected to IF, with one representative image from each case being shown) (f, g). Yellow arrow points to a neuron expressing both cis (red) and trans (green) p-tau, while pink one to a neuron expressing only trans in the soma. Fluorescence immunostaining intensity of cis p-tau was quantified using Volocity 6.3 from Perkin Elmer (h). The results are expressed as means ± s.d. and p values determined using the Student's t test.
Extended Data Figure 2. Colocalization of cis p-tau with other tau epitopes and its concentration near blood vessels in CTE brains.
a, b, Colocalization of cis p-tau with other tau epitopes in CTE brains. CTE brain tissues and healthy controls were stained with cis mAb and AT180, AT8, AT100, Alz50 or T22 antibodies, or trans mAb and T22 antibodies, with two examples being shown (a), and then quantified their colocalization using Coloc 2, with the results being expressed in a percentage (mean ± s.d.) (b). N.D., not detectable. c, CTE brain tissues and healthy controls were stained with cis mAb, with two examples being shown. cis is more prominent near blood vessels, which corresponds to the typical perivascular distribution of p-tau in CTE. d, CTE brain tissues and healthy controls were stained with cis mAb (red) and the dendritic marker MAP2 (green), along with DNA dye (blue). Colors in the text correspond to their fluorescence labels. n=4.
Extended Data Figure 3. TBI induces cis p-tau in a severity- and time-dependent manner long before other known tauopathy epitopes.
a-c, Severity- and time-dependent induction of cis p-tau after TBI. Quantification results of Fig. 2a-f. d, Robust cis p-tau signals were detected in neurons 48 hr after rmTBI without any other tangle-related tau epitopes. 48 h after rmTBI, brain sections were stained with cis mAb (red) and AT8, AT100 or PHF1 (green). e, Robust cis p-tau signals were detected in neurons 48 hr after rmTBI without tau oligomerization, which appears and colocalizes with cis p-tau at 6 month after TBI. 48 h or 6 m after rmTBI or sham treatment, brain sections were immunostained with T22 (green) and cis or trans mAb (red). The results in 48 hr sham mice were similar to those at 6 m (data not shown). The colocalization of red and green signals was quantified using Coloc-2, with the results being shown in percentages. ND, not detectable. n=3-4. The results are expressed as means ± s.d. and p values determined using the Student's t test.
Extended Data Figure 4. Stressed neurons robustly produces cis p-tau, cis p-tau is released from stressed neurons and neurotoxic, but are effectively blocked by cis, but trans, mAb.
a-c, Quantification results of Fig. 4a, b and f, respectively. The results are expressed as means ± s.d. and p values determined using the two-way ANOVA test (a) and Student's t test (c). d, Hypoxia induces cis p-tau, which is blocked by cis mAb. SY5Y neurons expressing a control vector were cultured in the hypoxia chamber in the absence or presence of cis or trans mAb for the times indicated, followed by IB for cis p-tau. e, Hypoxia induces cis p-tau before tau aggregation. SY5Y neurons were subjected to hypoxia for the times indicated, followed by sarkosyl extraction before IB with Tau5 mAb and quantification. f, Hypoxia induces cell death, which are blocked by cis, but trans, mAb. SY5Y neurons were cultured in the hypoxia chamber in the absence or presence of cis or trans mAb for the times indicated, followed by live and dead cell assay using the LIVE/DEAD® Viability/Cytotoxicity Kit. g, Stressed neuron lysates are neurotoxic, which is neutralized by cis, but not trans, mAb. Cell lysates were prepared from stressed SY5Y neurons and then added to growing SY5Y neurons directly (Control) or after immunodepletion with cis or trans mAb to remove cis or trans p-tau, respectively for 3 days, followed by live and dead cell assay. h, cis p-tau is released from stressed neurons. SY5Y neurons were cultured in the absence of serum for the times indicated and culture media were collected and centrifuged, followed by analyzing the supernatants for cis and trans p-tau with actin as a indicator of cell lysis.
Extended Data Figure 5. cis p-tau spreads after rmTBI or neuronal stress, and hypoxia induces cell death in primary neurons, which is blocked by cis mAb.
a, cis p-tau spreads in the brain after rmTBI. Quantification results of Fig. 3c. b, cis p-tau spreads after neuronal stress. GFP-tau or RFP-tau SY5Y neurons were co-cultured and subjected to hypoxia or control treatment in the presence or absence of cis or trans mAb for different times, followed by assaying cells expressing both GFP-tau and RFP-tau (arrows) to determine tau spreading among cells. The results are expressed as means ± s.d. and p values determined using the Student's t test. c, cis mAb enters primary neurons. Primary neurons were established from mouse embryos and differentiated in vitro and cis mAb was added to culture media, followed by immunostaining with secondary antibodies. d, Hypoxia induces cell death in primary neurons, which is effectively blocked by cis mAb. Primary neurons were cultured in the hypoxia chamber in the absence or presence of cis mAb for 48 h, followed by live (green) and dead (red) cell assay using the LIVE/DEAD® Viability/Cytotoxicity Kit.
Extended Data Figure 6. Pin1 inhibition by multiple mechanisms contributes to cis p-tau induction after neuron stress and TBI.
a, Pin1 was downregulated and correlated with cis p-tau induction after serum starvation. Cells were subjected to serum starvation for times indicated, followed by IB, with the right panel showing the correlation of Pin1 down regulation with cis p-tau induction from Figure 4a. b, Pin1 was oxidized and correlated with cis p-tau induction after hypoxia. SY5Y cells were subjected to hypoxia for times indicated, followed by IB for C113 oxidized Pin1, with the right panel showing the correlation of Pin1 oxidization with cis p-tau induction from Extended Data Figure 6d. c, Pin1 is inhibited in TBI mouse brains. Mouse brains 48 hr after ssTBI were subjected to IB and quantification for Pin1 and S71 phosphorylated Pin1. d, Pin1 knockdown potentiates the ability of hypoxia to induce cis p-tau. Pin1 KD or vector control SY5Y cells were subjected to hypoxia treatment for the times indicated in the presence or absence of cis mAb, followed by IB and quantification for cis p-tau levels.
Extended Data Figure 7. Inhibition of FcγR binding blocks cis mAb from entering neurons and TRIM21 KD fully prevented cis antibody from ablating cis p-tau in neurons.
a-d, Inhibition of FcγR binding potently blocks cis mAb from entering neurons. cis mAb was added to neurons in the absence or presence of a human FcγR-binding inhibitor, followed by detecting the binding of cis mAb to the cell surface by FACS (a), entry of cis mAb into cells by IF (b), IB (c) and electron microscopy after immunogold labeling (d). The FcR binding inhibitor fully blocked cis mAb from binding to the cell surface and entering neurons. Electron microscopy showed that cis mAb bounds to the cell surface and endocytic vesicles (red arrows). e, f, TRIM21 knockdown fully prevented cis antibody from ablating cis p-tau in neurons. TRIM21 was stably knocked down in SY5Y neuronal cells using a validated TRIM21 shRNA lentiviral vector and confirmed by real-time RT-PCR analysis of TRIM21 mRNA expression (e). TRIM21 knockdown or vector control SY5Y cells were subjected to hypoxia treatment in the presence or absence of cis mAb and/or 3-Methyladenine, an autophagy inhibitor, followed by IB, followed by quantifying cis p-tau levels normalized actin levels (lower panel) (f).
Extended Data Figure 8. cis pT231-tau is both necessary and sufficient for p-tau to induce neuronal cell death in vitro.
a, SY5Y cells were co-transfected with non-tagged indicated constructs in the absence and presence of cis mAb followed by IB with quantification on the right panel. b, SY5Y cells were co-transfected with GFP-tau, or GFP-tauT231A and p25/Ckd5 in the absence and presence of cis or trans mAb followed by live-cell confocal video (see videos 5, 6). Red arrows point to GFP-tau or -mutant expressing cells.
Extended Data Figure 9. cis mAb effectively blocks cis p-tau induction and spread, tau aggregation, and restores neuronal ultrastructures, apoptosis and defective LTP after TBI.
a, Peripherally administrated cis and trans mAbs enter neurons in brains. 250 μg of biotinylated cis or trans mAb was injected i.p. or i.v. into B6 mice, followed by detecting the biotinylated cis mAb in brains 3 days later. b, c, cis mAb effectively blocks cis pT231-tau induction and apoptosis. ssTBI mice were randomly and blindly treated with cis mAb or IgG isotype control, i.c.v. 20 μg per mouse 15 min after injury, and then i.p. 200 μg every 4 days for 3 times, followed by subjecting brains to IB for cis p-tau (b) and PARP cleavage (c), with sham as controls. d-f, cis mAb effectively blocks cis pT231-tau induction and spread, tau aggregation and restores neuronal ultrastructures. ssTBI mice in (c) received additional i.p. 200 μg per mouse 3 day prior to injury. d, Quantification of IB in Fig. 5a. e, Quantification of IB in Fig. 5b. f, Quantification of EM images in Fig. 5c. n=3. The results are expressed as means ± s.d. and p values determined using the Student's t test. g, cis mAb treatment of ssTBI mice rescues defective long-term potentiation in the cortex. fEPSPs were recorded in the layer II/III by stimulating the vertical pathway (the layer V to II/III) in the cortex. Robust LTP was induced by 5 Hz theta-burst in the cortical slices of sham mice (n=15 slices, 9 mice), but was deficient in the cortex of IgG-treated TBI mice (n=9 slices, 5 mice). However, LTP magnitude was restored to the control level in cis mAb-treated TBI animals (n=9 slices, 5 mice). The representative recordings were presented. h, No significant effects of cis pT231 tau mAb treatment on Morris Water Maze performance. 8 weeks after ssTBI, mice underwent Morris Water Maze (MWM) testing consisting of 4 acquisition trials (hidden platform) daily for 4 days (4 runs/trial), a probe trial, followed by a 3 reversal trials (hidden platform) daily for 3 days. Compared to sham mice, injured mice demonstrated increased latency to find the hidden platform in acquisition and reversal trials (p<0.001). There was no difference in injured cis mAb mice compared to injured IgG treated mice in acquisition trials (p=0.5) or reversal trial (p=0.9). For probe trials, injured mice performed similarly to sham mice (p=0.7) and injured cis mAb treated mice performed similarly to injured IgG treated mice (p=0.2). n=4-7. The results are expressed as means ± s.e.m. and p values determined using the ANOVA test.
Extended Data Figure 10. cis mAb treatment effectively restores risk-taking behavior and prevents tauopathy development and spread as well as brain atrophy after TBI.
a-c, cis mAb treatment effectively restores risk-taking behavior 2 months after ssTBI. Video-tracking data of each of all mice shows that ssTBI mice treated with cis mAb (n=7) spent similar and very little time in the open arm compared to sham mice (n=4), but much less time than TBI mice treated with IgG2b (n=7) (a). cis mAb-treated ssTBI mice had similar performance to sham in traveling velocity, but IgG2b-treated ssTBI mice traveled a greater velocity in the open arm (b). All three groups traveled similar total distance (c). Results are expressed as mean ± S.E.M. and p values determined using the Student's t test. d-f, cis mAb treatment effectively prevents tauopathy development and spread as well as brain atrophy 6 months after ssTBI. ssTBI mice were treated with cis mAb or IgG control for 2 weeks or 6 months, with sham mice as controls, followed by IF with various tauopathy epitopes (d), with immunostaining fluorescence intensity in the cortex and hippocampus being quantified (e), or to NeuN immunostaining for determining the thickness of the cortex and white matter at 6 months after TBI (f). n=4.
Supplementary Material
Acknowledgements
We thank T. Hunter and M. Zeidel for advice; S. Hagen for Microscopy Facility (NIH grant S10 RR017927) and P. Davies for tauopathy antibodies. C.H. C., Y. M. L., J. D. and S. W. are recipients of NIA-funded T32 Translational Research in Aging Training Grant, National Science Council Postdoctoral Fellowship from Taiwan, a VA Career Development Award, and Susan G. Komen postdoctoral fellowship, respectively. R.M. is supported by Boston Children's Hospital Pilot Grant Award and NIH training grant T32HD040128, and A. P.L. and W.P.M. by NFLPA. The CTE and blast samples used are supported by grants from NIH (UO1NS086659-01, P30AG13846), VA, Sports Legacy Institute, Andlinger Foundation, NFL and WWE. The work is supported by NIH grants R01AG029385, R01CA167677, R01HL111430 and R01AG046319, and Alzheimer's Association grant DVT-14-322623 to K.P.L. and BIDMC and NFLPA pilot grants to K.P.L. and X.Z.Z.
Footnotes
Author Contributions. A.K., and K.S. designed the studies, performed the experiments, and wrote the manuscript; R.M, helped design and conduct experiments and analyzed the data on impact TBI mouse models and wrote the manuscript; J.Q. and W.M. helped on impact TBI experiments, J.M. and L.E.G. helped on blast TBI experiments and edited the manuscript; A.C.M. provided human brains and edited the manuscript; Y.S. and A.R. performed fSPSP recording; C.H.C., Y.Y., Y.M.L, J.A.D., S.W., M.L.L., O.A. and P.H. provided technical assistances; A.R. provided assistance for developing mAbs; A.P.L. advised the project; X.Z.Z. originally discovered the procedures for generating cis and trans antibodies; and X.Z.Z. and K.P.L. conceived and supervised the project, designed the studies, analyzed the data, and wrote the manuscript.
Competing Financial Interests. K.P.L. and X.Z.Z. are inventors of Pin1 technology, which was licensed by BIDMC to Pinteon Therapeutics. Both Dr. Lu and Dr. Zhou own equity in, and consult for, Pinteon. Dr. Lu also serves on its Board of Directors. Their interests were reviewed and are managed by BIDMC in accordance with its conflict of interest policy. Readers are welcome to comments on the online version of the paper.
Online Content Methods, along with any Extended Data display items and source Data, are available in the online version of the paper; references unique to the sections appear only in the online paper.
Supplementary Information is available in the online version of the paper
References
- 1.Faul M, Xu L, Wald MM, Coronado VG. Traumatic brain injury in the United States: emergency department visits, hospitalizations, and deaths, 2002–2006. Centers for Disease Control and Prevention [online]; 2010. http://www.cdc.gov/traumaticbraininjury/tbi_ed.html. [Google Scholar]
- 2.Centers for Disease Control and Prevention CDC grand rounds: reducing severe traumatic brain injury in the United States. MMWR Morb Mortal Wkly Rep. 2013;62:549–552. http://www.cdc.gov/mmwr/preview/mmwrhtml/mm6227a6222.htm. [PMC free article] [PubMed] [Google Scholar]
- 3.Tanielian T, et al. Invisible Wounds of War: Psychological and Cognitive Injuries, Their Consequences, and Services to Assist Recovery. RAND Corporation; Santa Monica, CA: 2008. 2008, http://www.rand.org/pubs/monographs/MG720. [Google Scholar]
- 4.Omalu BI, et al. Chronic traumatic encephalopathy in a National Football League player. Neurosurgery. 2005;57:128–134. doi: 10.1227/01.neu.0000163407.92769.ed. [DOI] [PubMed] [Google Scholar]
- 5.Goldstein LE, et al. Chronic traumatic encephalopathy in blast-exposed military veterans and a blast neurotrauma mouse model. Sci Transl Med. 2012;4:134ra160. doi: 10.1126/scitranslmed.3003716. [DOI] [PMC free article] [PubMed] [Google Scholar]
- 6.McKee AC, et al. The spectrum of disease in chronic traumatic encephalopathy. Brain. 2013;136:43–64. doi: 10.1093/brain/aws307. [DOI] [PMC free article] [PubMed] [Google Scholar]
- 7.Smith DH, Johnson VE, Stewart W. Chronic neuropathologies of single and repetitive TBI: substrates of dementia? Nat Rev Neurol. 2013;9:211–221. doi: 10.1038/nrneurol.2013.29. [DOI] [PMC free article] [PubMed] [Google Scholar]
- 8.DeKosky ST, Blennow K, Ikonomovic MD, Gandy S. Acute and chronic traumatic encephalopathies: pathogenesis and biomarkers. Nat Rev Neurol. 2013;9:192–200. doi: 10.1038/nrneurol.2013.36. [DOI] [PMC free article] [PubMed] [Google Scholar]
- 9.Blennow K, Hardy J, Zetterberg H. The neuropathology and neurobiology of traumatic brain injury. Neuron. 2012;76:886–899. doi: 10.1016/j.neuron.2012.11.021. [DOI] [PubMed] [Google Scholar]
- 10.Mortimer JA, et al. Head trauma as a risk factor for Alzheimer's disease: a collaborative re-analysis of case-control studies. EURODEM Risk Factors Research Group. Int J Epidemiol. 1991;20(Suppl 2):S28–35. doi: 10.1093/ije/20.supplement_2.s28. [DOI] [PubMed] [Google Scholar]
- 11.Guo Z, et al. Head injury and the risk of AD in the MIRAGE study. Neurology. 2000;54:1316–1323. doi: 10.1212/wnl.54.6.1316. [DOI] [PubMed] [Google Scholar]
- 12.Nordstrom P, Michaelsson K, Gustafson Y, Nordstrom A. Traumatic brain injury and young onset dementia: a nationwide cohort study. Ann Neurol. 2014;75:374–381. doi: 10.1002/ana.24101. [DOI] [PubMed] [Google Scholar]
- 13.Ballatore C, Lee VM, Trojanowski JQ. Tau-mediated neurodegeneration in Alzheimer's disease and related disorders. Nat Rev Neurosci. 2007;8:663–672. doi: 10.1038/nrn2194. [DOI] [PubMed] [Google Scholar]
- 14.Mandelkow EM, Mandelkow E. Biochemistry and cell biology of tau protein in neurofibrillary degeneration. Cold Spring Harb Perspect Med. 2012;2:a006247. doi: 10.1101/cshperspect.a006247. [DOI] [PMC free article] [PubMed] [Google Scholar]
- 15.Clavaguera F, et al. Transmission and spreading of tauopathy in transgenic mouse brain. Nat Cell Biol. 2009;11:909–913. doi: 10.1038/ncb1901. [DOI] [PMC free article] [PubMed] [Google Scholar]
- 16.de Calignon A, et al. Propagation of tau pathology in a model of early Alzheimer's disease. Neuron. 2012;73:685–697. doi: 10.1016/j.neuron.2011.11.033. [DOI] [PMC free article] [PubMed] [Google Scholar]
- 17.Liu L, et al. Trans-synaptic spread of tau pathology in vivo. PLoS ONE. 2012;7:e31302. doi: 10.1371/journal.pone.0031302. [DOI] [PMC free article] [PubMed] [Google Scholar]
- 18.Clavaguera F, et al. Peripheral administration of tau aggregates triggers intracerebral tauopathy in transgenic mice. Acta Neuropathol. 2014;127:299–301. doi: 10.1007/s00401-013-1231-5. [DOI] [PMC free article] [PubMed] [Google Scholar]
- 19.Clavaguera F, Hench J, Goedert M, Tolnay M. Invited review: Prion-like transmission and spreading of tau pathology. Neuropathol Appl Neurobiol. 2015;41:47–58. doi: 10.1111/nan.12197. [DOI] [PubMed] [Google Scholar]
- 20.Asuni AA, Boutajangout A, Quartermain D, Sigurdsson EM. Immunotherapy targeting pathological tau conformers in a tangle mouse model reduces brain pathology with associated functional improvements. J Neurosci. 2007;27:9115–9129. doi: 10.1523/JNEUROSCI.2361-07.2007. [DOI] [PMC free article] [PubMed] [Google Scholar]
- 21.Rosenmann H. Immunotherapy for targeting tau pathology in Alzheimer's disease and tauopathies. Curr Alzheimer Res. 2013;10:217–228. doi: 10.2174/1567205011310030001. [DOI] [PubMed] [Google Scholar]
- 22.Sigurdsson EM. Tau Immunotherapy and Imaging. Neurodegener Dis. 2014;13:103–106. doi: 10.1159/000354491. [DOI] [PMC free article] [PubMed] [Google Scholar]
- 23.Smith C, Graham DI, Murray LS, Nicoll JA. Tau immunohistochemistry in acute brain injury. Neuropathol Appl Neurobiol. 2003;29:496–502. doi: 10.1046/j.1365-2990.2003.00488.x. [DOI] [PubMed] [Google Scholar]
- 24.Johnson VE, Stewart W, Smith DH. Widespread tau and amyloid-beta pathology many years after a single traumatic brain injury in humans. Brain Pathol. 2012;22:142–149. doi: 10.1111/j.1750-3639.2011.00513.x. [DOI] [PMC free article] [PubMed] [Google Scholar]
- 25.Mannix R, et al. Clinical Correlates in an Experimental Model of Repetitive Mild Brain Injury. Ann Neurol. 2013;74:65–75. doi: 10.1002/ana.23858. [DOI] [PMC free article] [PubMed] [Google Scholar]
- 26.Lu KP, Hanes SD, Hunter T. A human peptidyl-prolyl isomerase essential for regulation of mitosis. Nature. 1996;380:544–547. doi: 10.1038/380544a0. [DOI] [PubMed] [Google Scholar]
- 27.Lu PJ, Wulf G, Zhou XZ, Davies P, Lu KP. The prolyl isomerase Pin1 restores the function of Alzheimer-associated phosphorylated tau protein. Nature. 1999;399:784–788. doi: 10.1038/21650. [DOI] [PubMed] [Google Scholar]
- 28.Zhou XZ, et al. Pin1-dependent prolyl isomerization regulates dephosphorylation of Cdc25C and tau proteins. Mol Cell. 2000;6:873–883. doi: 10.1016/s1097-2765(05)00083-3. [DOI] [PubMed] [Google Scholar]
- 29.Liou Y-C, et al. Role of the prolyl isomerase Pin1 in protecting against age-dependent neurodegeneration. Nature. 2003;424:556–561. doi: 10.1038/nature01832. [DOI] [PubMed] [Google Scholar]
- 30.Pastorino L, et al. The prolyl isomerase Pin1 regulates amyloid precursor protein processing and amyloid-beta production. Nature. 2006;440:528–534. doi: 10.1038/nature04543. [DOI] [PubMed] [Google Scholar]
- 31.Lu KP, Zhou XZ. The prolyl isomerase PIN1: a pivotal new twist in phosphorylation signalling and human disease. Nat Rev Mol Cell Biol. 2007;8:904–916. doi: 10.1038/nrm2261. [DOI] [PubMed] [Google Scholar]
- 32.Lim J, et al. Pin1 has opposite effects on wild-type and P301L tau stability and tauopathy. J. Clin. Invest. 2008;118:1877–1889. doi: 10.1172/JCI34308. [DOI] [PMC free article] [PubMed] [Google Scholar]
- 33.Lee TH, Pastorino L, Lu KP. Peptidyl-prolyl cis-trans isomerase Pin1 in aging, cancer and Alzheimer's disease. Expet Rev Mol Med. 2011;13:e21. doi: 10.1017/S1462399411001906. [DOI] [PubMed] [Google Scholar]
- 34.Driver JA, Zhou XZ, Lu KP. Pin1 dysregulation helps to explain the inverse association between cancer and Alzheimer's disease. Biochim Biophys Acta. 2015 doi: 10.1016/j.bbagen.2014.12.025. [DOI] [PMC free article] [PubMed] [Google Scholar]
- 35.Chen CH, et al. Pin1 cysteine-113 oxidation inhibits its catalytic activity and cellular function in Alzheimer's disease. Neurobiol Dis. 2015;76:13–23. doi: 10.1016/j.nbd.2014.12.027. The cover story. [DOI] [PMC free article] [PubMed] [Google Scholar]
- 36.Lee TH, et al. Death associated protein kinase 1 phosphorylates Pin1 and inhibits its prolyl isomerase activity and cellular function. Mol Cell. 2011;22:147–159. doi: 10.1016/j.molcel.2011.03.005. [DOI] [PMC free article] [PubMed] [Google Scholar]
- 37.Kim BM, et al. Death-associated protein kinase 1 has a critical role in aberrant tau protein regulation and function. Cell Death Dis. 2014;5:e1237. doi: 10.1038/cddis.2014.216. [DOI] [PMC free article] [PubMed] [Google Scholar]
- 38.Ma SL, et al. A PIN1 polymorphism that prevents its suppression by AP4 associates with delayed onset of Alzheimer's disease. Neurobiol Aging. 2012;33:804–813. doi: 10.1016/j.neurobiolaging.2010.05.018. [DOI] [PMC free article] [PubMed] [Google Scholar]
- 39.Wijsman EM, et al. Evidence for a novel late-onset Alzheimer disease locus on chromosome 19p13.2. Am J Hum Genet. 2004;75:398–409. doi: 10.1086/423393. [DOI] [PMC free article] [PubMed] [Google Scholar]
- 40.Luna-Munoz J, Chavez-Macias L, Garcia-Sierra F, Mena R. Earliest stages of tau conformational changes are related to the appearance of a sequence of specific phospho-dependent tau epitopes in Alzheimer's disease. J Alzheimers Dis. 2007;12:365–375. doi: 10.3233/jad-2007-12410. [DOI] [PubMed] [Google Scholar]
- 41.Hampel H, et al. Total and phosphorylated tau protein as biological markers of Alzheimer's disease. Exp Gerontol. 2010;45:30–40. doi: 10.1016/j.exger.2009.10.010. [DOI] [PMC free article] [PubMed] [Google Scholar]
- 42.Nakamura K, et al. Proline isomer-specific antibodies reveal the early pathogenic tau conformation in Alzheimer's disease. Cell. 2012;149:232–244. doi: 10.1016/j.cell.2012.02.016. [DOI] [PMC free article] [PubMed] [Google Scholar]
- 43.Lasagna-Reeves CA, et al. Identification of oligomers at early stages of tau aggregation in Alzheimer's disease. FASEB J. 2012;26:1946–1959. doi: 10.1096/fj.11-199851. [DOI] [PMC free article] [PubMed] [Google Scholar]
- 44.Johnson VE, Stewart W, Smith DH. Axonal pathology in traumatic brain injury. Exp Neurol. 2013;246:35–43. doi: 10.1016/j.expneurol.2012.01.013. [DOI] [PMC free article] [PubMed] [Google Scholar]
- 45.Congdon EE, Gu J, Sait HB, Sigurdsson EM. Antibody uptake into neurons occurs primarily via clathrin-dependent Fcgamma receptor endocytosis and is a prerequisite for acute tau protein clearance. J Biol Chem. 2013;288:35452–35465. doi: 10.1074/jbc.M113.491001. [DOI] [PMC free article] [PubMed] [Google Scholar]
- 46.Mallery DL, et al. Antibodies mediate intracellular immunity through tripartite motif- containing 21 (TRIM21). Proc Natl Acad Sci U S A. 2010;107:19985–19990. doi: 10.1073/pnas.1014074107. [DOI] [PMC free article] [PubMed] [Google Scholar]
- 47.Cruz JC, Tseng HC, Goldman JA, Shih H, Tsai LH. Aberrant Cdk5 activation by p25 triggers pathological events leading to neurodegeneration and neurofibrillary tangles. Neuron. 2003;40:471–483. doi: 10.1016/s0896-6273(03)00627-5. [DOI] [PubMed] [Google Scholar]
- 48.Williams S, et al. In situ DNA fragmentation occurs in white matter up to 12 months after head injury in man. Acta Neuropathol. 2001;102:581–590. doi: 10.1007/s004010100410. [DOI] [PubMed] [Google Scholar]
- 49.Adhikari A, Topiwala MA, Gordon JA. Single units in the medial prefrontal cortex with anxiety-related firing patterns are preferentially influenced by ventral hippocampal activity. Neuron. 2011;71:898–910. doi: 10.1016/j.neuron.2011.07.027. [DOI] [PMC free article] [PubMed] [Google Scholar]
- 50.Schwarzbold ML, et al. Effects of traumatic brain injury of different severities on emotional, cognitive, and oxidative stress-related parameters in mice. J Neurotrauma. 2010;27:1883–1893. doi: 10.1089/neu.2010.1318. [DOI] [PubMed] [Google Scholar]
- 51.Tokuoka H, et al. Brain-derived neurotrophic factor-induced phosphorylation of neurofilament-H subunit in primary cultures of embryo rat cortical neurons. J Cell Sci. 2000;113(Pt 6):1059–1068. doi: 10.1242/jcs.113.6.1059. [DOI] [PubMed] [Google Scholar]
- 52.Shahpasand K, et al. Regulation of mitochondrial transport and inter-microtubule spacing by tau phosphorylation at the sites hyperphosphorylated in Alzheimer's disease. J Neurosci. 2012;32:2430–2441. doi: 10.1523/JNEUROSCI.5927-11.2012. [DOI] [PMC free article] [PubMed] [Google Scholar]
- 53.Farah CA, et al. Tau interacts with Golgi membranes and mediates their association with microtubules. Cell Motil Cytoskeleton. 2006;63:710–724. doi: 10.1002/cm.20157. [DOI] [PubMed] [Google Scholar]
- 54.Ishihara T, et al. Age-dependent emergence and progression of a tauopathy in transgenic mice overexpressing the shortest human tau isoform. Neuron. 1999;24:751–762. doi: 10.1016/s0896-6273(00)81127-7. [DOI] [PubMed] [Google Scholar]
- 55.Dawson HN, et al. Inhibition of neuronal maturation in primary hippocampal neurons from tau deficient mice. J Cell Sci. 2001;114:1179–1187. doi: 10.1242/jcs.114.6.1179. [DOI] [PubMed] [Google Scholar]
- 56.Meehan WP, 3rd, Zhang J, Mannix R, Whalen MJ. Increasing recovery time between injuries improves cognitive outcome after repetitive mild concussive brain injuries in mice. Neurosurgery. 2012;71:885–891. doi: 10.1227/NEU.0b013e318265a439. [DOI] [PMC free article] [PubMed] [Google Scholar]
- 57.Walf AA, Frye CA. The use of the elevated plus maze as an assay of anxiety-related behavior in rodents. Nat Protoc. 2007;2:322–328. doi: 10.1038/nprot.2007.44. [DOI] [PMC free article] [PubMed] [Google Scholar]
- 58.Morris R. Developments of a water-maze procedure for studying spatial learning in the rat. J Neurosci Methods. 1984;11:47–60. doi: 10.1016/0165-0270(84)90007-4. [DOI] [PubMed] [Google Scholar]
Associated Data
This section collects any data citations, data availability statements, or supplementary materials included in this article.


