

Abstract
Piplartine (PL) is an alkaloid found in black-pepper and known for its anticancer activity, however, due to poor solubility and lack of proper formulation, its use for oral administration is a challenge. The objective of this study was to formulate PL into nanoemulsion drug delivery system for oral delivery and thereafter evaluate toxicity, pharmacokinetics and therapeutic efficacy. Optimized nanoemulsions were formulated by self-emulsification as well as by homogenization-sonication method. Two nanoemulsions enhanced the solubility of PL with low polydispersity index and high stability. Both PL loaded nanoemulsions exhibited enhanced dissolution, cellular permeability and cytotoxic effects as compared to pure PL. Formulation of PL into nanoemulsions did not obstruct its cellular uptake in cancer cells. Blank or PL loaded nanoemulsions did not exhibited toxicity in mice upon daily oral administration for 60 days. Pharmacokinetics of PL followed a two-compartment model after intravenous administration. PL loaded nanoemulsions showed 1.5-fold increase in oral bioavailability as compared to free PL. Finally, PL loaded nanoemulsions showed marked anti-tumor activity at a dose of 10 mg/kg in melanoma tumor bearing mice. In conclusion, for the first time we have developed a stable nanoemulsion delivery system for oral administration of PL, which enhanced its solubility, oral bioavailability and anti-tumor efficacy.
Keywords: piplartine, piperlongumine, nanoemulsions, formulation experimental design, anti-tumor activity
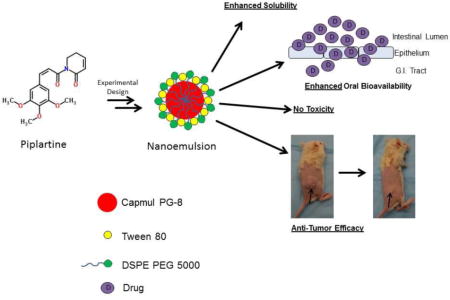
Graphical abstract
1. Introduction
Piplartine (PL), also known as piperlongumine, is an alkaloid derived from black pepper (Piper nigrum) and long pepper (Piper longum) (Chatterjee and Dutta, 1967; Lin et al., 2007). Recent studies have shown that piplartine is selectively toxic to cancer cells (Raj et al., 2011). Piplartine has been effective in suppressing tumor growth in vivo (Roh et al., 2014). PL exerts anti-cancer activity by elevation of ROS levels leading to induction of apoptosis in cancer cells (Adams et al., 2012). ROS independent mechanism of anticancer activity of PL has also been reported (Bharadwaj et al., 2015). Recent studies from our lab have shown that PL induced anoikis in melanoma and pancreatic cancer cells through inhibition of STAT3 (Fofaria and Srivastava, 2014a, b). In all of the above-mentioned studies, PL has only been administered by intraperitoneal route and therefore, its anti-cancer activity by oral administration has never been tested. Due to poor water solubility, oral administration of PL is problematic as it will limit its bioavailability. Hence, it is important to formulate piplartine in a suitable drug delivery system in order to test the oral efficacy in vivo.
Nanoemulsions are colloidal sized droplets of either oil dispersed in aqueous medium or water dispersed in oil medium (McClements and Rao, 2011; Rao and McClements, 2011). Nanoemulsions have been effectively utilized to formulate hydrophobic drug (Sarker, 2005). A recent article has differentiated nanoemulsion (droplet size < 300nm) and microemulsion with respect to stability (12). Although nanoemulsions may be thermodynamically unstable, they are kinetically stable unlike microemulsions (Anton and Vandamme, 2011). Due to high colloidal stability, small droplet size and large surface area, nanoemulsions eliminate several problems like coalescence, sedimentation and flocculation that are associated with conventional emulsions (Sadurni et al., 2005). Nanoemulsions can either be prepared by high-energy dispersion technique or by spontaneous emulsification method such as a self-nanoemulsifying drug delivery system (SNEDDS). Poorly soluble drugs formulated into nanoemulsion have exhibited better in vitro dissolution and in vivo bioavailability (Rajpoot et al., 2011). Therefore, nanoemulsions have emerged as promising drug delivery systems for poorly soluble anti-cancer agents (Qhattal et al., 2011; Ragelle et al., 2012; Yang et al., 2004).
Currently, no formulation of anticancer agent piplartine exists in the literature. Hence, the aim of the present study was to formulate PL into a suitable nanoemulsion drug delivery system for oral drug administration. Our study for the first time showed that PL formulated in nanoemulsion showed enhanced solubility, dissolution, permeability in vitro and showed promising absorption and bioavailability in vivo. Moreover, our study also established that PL exhibited better anticancer effects when formulated as nanoemulsion and administered orally. The nanoemulsion formulation will facilitate chronic oral administration of PL and assist in the preclinical development of PL as an anticancer agent.
2. Experimental Section
2.1 Chemicals
Tween 80 (polyoxyethylene sorbitan monooleate), corn oil, cottonseed oil, sulforhodamine B (SRB), polyethylene glycol (PEG) 400, Mayer’s hemotoxylin, eosin, solutol HS and tricholoacetic acid were purchased from Sigma Aldrich (St. Louis, MO). Medium chain triglyceride oil (MCT OIL®) was obtained from Nestle Nutrition (Woodlands, TX). Transcutol was purchased from Gattefosse (Toronto, ON, Canada). Capmul PG8 – NF (Propylene Glycol Caprylate) was a kind gift from Abitec Corporation (Janesville, WI). All the LC-MS grade solvents were purchased from Fisher Scientific (Houston, TX). DSPE–PEG 5000 Ammonium salt (1,2-distearoyl-sn-glycero-3-phosphoethanolamine-N-[amino(polyethylene glycol)-5000] was purchased from Avanti Polar Lipids, Inc. (Alabaster, AL). Piplartine (PL) was purchased from Cayman Chemicals (Ann Arbor, MI).
2.2 Cell Culture
Murine melanoma cell line B16-F0 was purchased from ATCC (Manassas, VA). Human melanoma cell line A375 was a kind gift from Dr. Tyler Wakenda (Rochester University, NY). Human colon cancer Caco-2 cells were a kind gift from Dr. Margeret Weis (Texas Tech University Health Sciences Center, TX). A375 and B16-F0 cells were cultured in DMEM (Corning, Manassas, VA) supplemented with 10% fetal bovine serum (Hyclone, South Logan, UT), antibiotics and HEPES buffer. Caco-2 cells were cultured in DMEM supplemented with 20% fetal bovine serum, antibiotics and HEPES buffer. Cells were grown in an incubator with an atmosphere of 5% CO2 and 95% humidity.
2.3 PL solubility study
Solubility of PL in various oils (corn oil, cottonseed oil, capmul PG8, medium chain triglyceride oil), solvents (ethanol, transcutol, PEG 400) and distilled water was determined by adding 2 mg of PL in 200 μl of the selected solvent followed by constant shaking for 24 hours at 25 ± 2°C as previously described by us (Qhattal et al., 2011). After 24 hours, the solubility of PL in solvents was checked by visual inspection. The samples were then centrifuged at 3500 rpm for 10 mins where the undissolved PL settled down. The supernatant was diluted 100 folds in methanol and the concentration of PL in the supernatant was quantified by spectrophotometric analysis at 327 nm using a UV-Vis Spectrophotometer (Shimadzu UV-1700).
2.4 Nanoemulsion Preparation
The first type of oil-in-water nanoemulsion was formulated by self-emulsification method. Based on the solubility assay, the surfactant mix (Smix) was screened by using different weight ratios of surfactant (Tween 80 or Solutol HS) and cosurfactant (PEG 400 or Transcutol). The optimal surfactant mix was chosen based on the combination which exhibited maximum solubitlity of PL, based on which, the surfactant mixture of fixed surfactant:cosurfactant ratio was chosen as 6:4. The oil and the surfactant mixture (premix) were then mixed at a weight ratio of 9:1, 8:2, 7:3, 6:4, 5:5, 4:6, 3:7, 2:8 and 1:9. The oil and surfactant mixture formed 10% of the total volume. The remaining 90% was water which was added in a dropwise manner with constant stirring. Upon addition of water, formulations were visually inspected as transparent, translucent nanoemulsion, milky emulsion or phase separation.
The second type of oil-in-water nanoemulsion was prepared by homogenization-sonication technique using a surfactant mix of Tween 80 and DSPE-PEG 5000. We performed a 2 × 2 × 2 experimental design to optimize the composition of the nanoemulsion using the software JMP® (SAS Institute Inc.). The oil phase used was either 10% (−) or 20% (+). The surfactant used was Tween 80 and the percentage of Tween 80 used was 2% (−) or 1% (+). The cosurfactant was either not used (−) or used (+). Based on this design, we prepared 8 different types of formulations. The oil phase was prepared by heating Capmul PG-8 at 50°C with or without PL (2.5 mg/ml). Once the drug was dissolved, DSPE-PEG 5000 (1% w/v) (If used) was dissolved in the oil phase. The aqueous phase was taken separately and prepared by dissolving Tween 80 in deionized water (87% w/v) at 50°C. After heating oil and water phase for 5 mins, the water phase was gradually added to the oil phase with constant and rapid stirring. The coarse emulsion was then homogenized at 9500 rpm for 10 mins using Powergen 125 homogenizer (Fisher Scientific, Houston, TX) followed by sonication for 120 mins using bath sonicator (Bransonic model 3510) to yield nanoemulsion.
PL entrapment efficiency in both the type of nanoemulsions was analyzed by centrifuging 400 μL of nanoemulsion in an Ultrafree-MC centrifugal filter (10000 MWCO, Millipore) at 13,200 rpm for 30 mins. The entrapment efficiency was calculated as a ratio of the percentage of the entrapped drug to the amount of total drug added. All the nanoemulsions were stored at 4°C.
2.5 Droplet size determination
Nanoemulsion droplet size and size distribution was measured using Malvern® Zetasizer (Malvern® Instruments Ltd., Worcestershire, UK). The samples were diluted in deionized water and the average droplet size and polydispersity index was determined.
2.6 Nanoemulsion stability analysis
The formulations were stored at room temperature and at 4°C and the droplet size of the formulation was analyzed every week for a period of 6 months. This also enabled us to determine the shelf-life and the storage conditions for the nanoemulsions. The stability of the nanoemulsions was also tested by centrifuging 1 mL of nanoemulsions at a speed of 3000 rpm for 25 mins at room temperature (Shakeel et al., 2009). The formulations were assessed for droplet size, creaming, cracking and phase separation before and after the centrifugation.
2.7 In vitro dissolution study
Dissolution studies with nanoemulsions was performed according to the method described in USP 29/NF 24 using a USP rotating paddle dissolution apparatus II (Vankel VK 7900, Agilent Technologies, Santa Clara, CA) at 37°C. The sinkers were filled with 900 mL of simulated gastric fluid without pepsin (pH 1.2) and the rotating speed of the paddle was 50 rpm. Dialysis bag (MWCO 3500 Da) containing 10 mL of dissolution media equilibrated for 12 hours were used as sampling ports as this would yield true free drug without interference of the unreleased drug from the nanoemulsion. PL loaded nanoemulsions, PEG 400 solution or capsule (Size – 00, diluent – lactose) were added to the sinker and the 1 mL aliquots were taken from the sampling ports at various time points (15, 30, 60 and 120 mins) and replaced with fresh dissolution media. The amount of PL released was determined spectrophotometrically.
2.8 Caco-2 permeability study
Transport of PL formulated in nanoemulsions from apical to basolateral compartment was measure using Transwell Permeable Supports (Corning, NY) (0.4 μm polyester membrane) in a 24-well plate. About 200,000 Caco-2 cells were plated per insert with a surface area of 0.3 cm2. The cells were cultured in the Transwell for 17 days to allow the formation of the tight junctions. The transepithelial electrical resistance (TEER) across the monolayer was measured before and after the experiment by Millicell Electrical Resistance System (Millipore, Bedford, MA). The TEER value ranged from 350–500 ohms/cm2. The cell monolayer was washed 3 times with PBS after which the apical layer of the cells were incubated with PBS, blank nanoemulsions, PL loaded nanoemulsions (PL – 2 mg/mL) or PL-PEG 400 solution (PL – 2 mg/mL) dissolved in 300 μL of PBS at 37°C. Aliquots of 300 μL were taken from the basolateral chamber at 15, 30, 60, 90, 120 and 180 mins. After sampling, equivalent amount of pre-warmed PBS was added to the basolateral chamber. PL concentration in the basolateral chamber was measured by LC-MS/MS. The apical to basolateral apparent permeability was calculated using the following equation
where dQ/dt is the rate of appearance of drug on the basolateral side, calculated from the cumulative amount versus time, C0 is the initial concentration on the apical side, and A is the surface area of the membrane inserts (0.3 cm2).
2.9 Cellular uptake studies
Intracellular uptake of PL nanoemulsions was evaluated in a human melanoma cell line A375 and a murine melanoma cell line B16-F0. About 300,000 cells were plated in a 6-well plate. Free PL in DMSO or PL nanoemulsions were added to the cells at a final PL concentration of 10 μM and incubated at 37°C for 30 mins. Cells were washed 3 times with PBS and lysed with 1% triton X. The intracellular uptake of PL was measured by LC-MS/MS. The protein concentrations were measured by Bradford Assay and the uptake was calculated as amount of drug per milligram of protein.
2.10 Cytotoxicity Analysis
Cytotoxicity assays were performed by sulforhodamine B (SRB) assay as previously described by us (Fofaria et al., 2014). A375 or B16-F0 cells were plated in a 96-well plate at a density of 5000 cells per well and were allowed to attach overnight. Following the incubation, free PL in DMSO or PL nanoemulsions were added to the cells at a series of concentrations ranging from 1–15 μM. DMSO or blank nanoemulsions at a volume equivalent to the maximum drug concentration was added to the control cells. After 24, 48 and 72 hour incubation period, cells were fixed with 10% tricholoroacetic acid for 2 hours and stained with SRB for 30 mins. The excess dye was removed by washing the cells with 1% acetic acid. The protein bound dye was dissolved in 10 mM Tris base solution and the absorbance was taken at 570 nm using a plate reader (Biotek EL 800, Winooski, VT).
2.11 LC-MS/MS analysis
PL was analyzed by liquid chromatography/tandem mass spectrometry (LC/MS–MS). The LC/MS–MS system consisted of AB SCIEX QTRAP® mass spectrometer equipped with Turbo IonSpray source (Foster City, CA, USA). Mass spectrometer was attached to a Nexera UHPLC system from Shimadzu (Columbia, MD, USA), which consisted of Sil-30AC autosampler, LC-30AD pumps, a CBM-20A controller, a DGA-20A degasser, and a CTO-30A column oven. Analyst software was used for data acquisition and MultiQuant software was used for data analysis. Chromatographic separation was carried out using Kinetex C18 (droplet size 1.7 μm; 50 × 2.0 mm) column at a temperature of 40°C. The elution of the drug and internal standard (piperlonguminine) was carried out by a gradient method using solvents (A) water (0.01% formic acid) and (B) acetonitrile (0.01% formic acid) with a flow rate of 0.4 mL/min. Elusion started with 20% solvent B, which was increased to 60% over a period of 2.5 mins. At 2.6 minutes, mobile phase was switched to 90% solvent B which was kept constant till 4 minutes after which it was returned to initial mobile phase. The total elution time was 4 minutes and the total run time was 7 minutes. However, mass spectrometer data was recorded from 1 – 3 minutes. For every run, 1 μL of sample was injected into the column. The analytes were detected by multiple reaction-monitoring (MRM) using a positive ion mode. The ion transition of PL used for analysis was parent ion m/z 318.0 to daughter ion m/z 221.3 and 190.3 and that for internal standard was parent ion m/z 274 to daughter ion m/z 201. The analytes were extracted from cell lysate and plasma by liquid-liquid extraction using 4 volumes of ethyl acetate followed by protein precipitation using 4 volumes of ice cold methanol. The samples were centrifuged at 13,000 g for 15 mins after which the supernatant was dried using an Eppendorf Vacufuge Plus at 35 °C and reconstituted in 100 μL of 1:1 ratio of water and acetonitrile. The standards were prepared by spiking PL ranging from a final concentration of 1.5 μM to 30 μM. The concentration of internal standard used was 10 μM and was kept constant.
2.12 Toxicology Studies
All the in vivo experiments were approved by the Institutional Animal Care and Use Committee (IACUC). About 5–6 week old CD-1 mice (Charles River, Wilmington, MA, USA) were allowed to acclimatize for one week prior to initiation of the experiment. Mice were randomly divided in 5 groups (N=4 in each group) i.e. Control, SENE Blank, SENE PL, CNE Blank and CNE PL. Mice were treated with blank nanoemulsions (100 μL) or PL loaded emulsions with a dose of 10 mg/kg daily by oral gavage for 60 days. The control mice were treated with PBS. The mice were weighed twice a week. At the end of 60 days, the mice were sacrificed and blood was extracted and harvested to separate plasma. Chemistry panel with plasma sample was performed at Texas Veterinary Medical Diagnostic Laboratory System, Amarillo, TX. Liver, kidney and heart were extracted and fixed with formalin and embedded in paraffin for histology.
2.13 Hematoxylin and Eosin (H & E) staining
Morphological changes due to chronic treatment with nanoemulsions were evaluated by hematoxylin and eosin staining according to the procedure described previous (Fofaria and Srivastava, 2014).
2.14 Pharmacokinetic studies
Female 7–8 week old C57-BL/6 mice were generously provided by Dr. Junxuan Lu (TTUHSC, Amarillo, TX). After overnight fasting, mice were administered with various treatments described here after. In the first group, free PL (vehicle – PEG400: ethanol: saline 57:14.5:28.5 v/v/v) was administered intravenously via tail vein injections. In the second group, free PL was administered orally via oral gavage. In the third group, PL loaded SENE-3 was administered orally and in the fourth group, PL loaded CNE-2 was administered orally. The dose of PL used in i.v. group was 2 mg/kg and that for nanoemulsion groups was 10 mg/kg. Following the administration, the blood was obtained by cardiac puncture at 2, 5, 10, 30, 60, 120, 240 and 360 mins using 3 mice per time point for every group. Plasma was obtained by centrifugation of blood at 10,000 rpm for 10 mins and stored at −20°C until LC-MS/MS analysis. The PK parameters were obtained and the PK data was modeled using Phoenix WinNonlin (Pharsight, CA, USA) using Classic WinNonlin Modeling. For oral dosing, Cmax and Tmax were calculated by extrapolation. Absorption rate constant was calculated by residual method. AUC(0–∞) was calculated by trapezoidal method. Relative oral bioavailability (FSENE PL or FCNE PL) was calculated by AUCiv/AUCoral as the dose used was the same.
2.15 In vivo efficacy studies
In vivo xenograft experiment was performed according to the method described previously with slight modifications (Pramanik et al., 2013). Female C57-BL/6 mice (5–7 weeks old) were generously provided by Dr. Junxuan Lu (TTUHSC, Amarillo, TX). About 500,000 B16-F0 cells re-suspended in 1:1 ratio of PBS and matrigel were injected subcutaneously in both the flanks of mice. Once the palpable tumors were observed, the mice were randomly divided in 3 groups (Control, SENE-3, and CNE-2) with 8 mice in each group. The treatment groups were treated with PL loaded nanoemulsions with a dose of PL equivalent to 10 mg/kg. The tumor volume was measured twice a week using vernier calipers and the tumor volume was calculated using the previously described formula (Pramanik et al., 2014). At the end of the experiment, tumors were extracted and weighed.
2.16 Statistical analysis
All the statistical calculations were performed using Prism 6.0 (GraphPad Software Inc., San Diego, CA). The data was represented as mean ± S.D. or S.E.M. Unpaired student’s t-test was used for comparison of two groups. For experiments involving more than two groups, ANOVA followed by Tukey’s post hoc multiple comparison test was used. All the statistical tests were two sided. Differences were considered statistically significant when p value was < 0.05.
3. Results
3.1 PL solubility in various solvents
Solubility of PL was initially tested in various solvents to choose the ingredients for the formulations. PL was practically insoluble in water with a solubility of 0.32 mg/mL (Fig. 1). PL was also weakly soluble in ethanol (3.6 mg/mL). Interestingly, PL exhibited low solubility in conventional oils like corn oil (2.2 mg/mL) and cottonseed oil (3.2 mg/mL) (Fig. 1). Improved solubility of 6.6 mg/mL PL was observed in medium chain triglycerides (MCT). However, solubility of PL was much higher in PEG 400 (>10 mg/mL), Transcutol (9 mg/mL) and Capmul PG8 (propylene glycol caprylate, 9.1 mg/mL) (Fig. 1).
Figure 1.
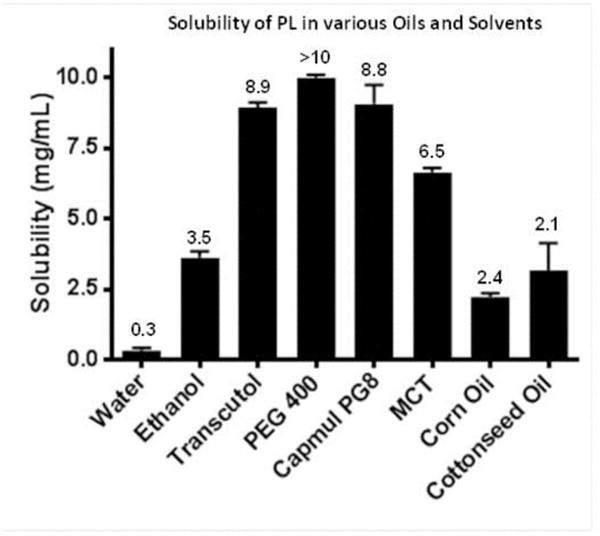
Solubility of PL in water, various oils and solvents. The value of each group is given in mg/mL.
3.2 Optimization of PL nanoemulsions
Since PL was insoluble in conventional oils like corn oil and cottonseed oil, we used Capmul PG8 as the oil phase. Capmul PG8 has been used recently to formulate nanoemulsions (Kadu et al., 2011; Mukherjee and Plakogiannis, 2010). Tween 80 or Solutol HS were chosen as primary surfactants as non-ionic surfactants are less toxic than ionic surfactants. Transcutol or PEG 400 was used as a cosurfactant to enhance the generation of a stable interfacial film. Table 1 and Supp Table 1 show the list of all the formulations along with its droplet size, polydispersity index and stability. SENE-3 containing oil:surfactant mix ratio of 3:7 was chosen for further studies as the droplet size observed was 131.2 nm along with low polydispersity index of 0.259 (Table 1). SENE-3 was also stable for more than 6 months at room temperature (Table 1). Additionally, there was no change in the phase behavior of the system when PL was incorporated in the formulation.
Table 1.
Formulation composition, droplet size, polydispersity index and stability of self-emulsifying nanoemulsion
| Formulation Code | Oil | Surfactant | Cosurfactant | Surfactant:Cosurfactant (w/w) |
Ratio (Smix:Oil) |
Droplet Size (nm) |
PI | Stability (RT) (Days) |
|---|---|---|---|---|---|---|---|---|
| SENE – 1 | Capmul PG8 | Tween 80 | PEG 400 | 6:4 | 9:1 | 9.231 | 0.155 | – |
| SENE – 2 | Capmul PG8 | Tween 80 | PEG 400 | 6:4 | 8:2 | 93.36 | 0.273 | 180 |
| SENE – 3 | Capmul PG8 | Tween 80 | PEG 400 | 6:4 | 7:3 | 131.2 | 0.259 | 180 + |
| SENE – 4 | Capmul PG8 | Tween 80 | PEG 400 | 6:4 | 6:4 | 189.3 | 0.362 | 35 |
| SENE – 5 | Capmul PG8 | Tween 80 | PEG 400 | 6:4 | 5:5 | 202.1 | 0.348 | 30 |
| SENE – 6 | Capmul PG8 | Tween 80 | PEG 400 | 6:4 | 4:6 | 297.6 | 0.326 | 7 |
| SENE – 7 | Capmul PG8 | Tween 80 | PEG 400 | 6:4 | 3:7 | >500 | 0.432 | 3 |
| SENE – 8 | Capmul PG8 | Tween 80 | PEG 400 | 6:4 | 2:8 | PS | – | – |
| SENE – 9 | Capmul PG8 | Tween 80 | PEG 400 | 6:4 | 1:9 | PS | – | – |
Smix refers to weight ratios of surfactant and cosurfactant. Samples were made at a constant premix (mixture of oil and Smix)-to-water ratio of 1:10 (w/w). PI value refers to polydispersity index and PS refers to phase separation. RT refers to room temperature.
As conventional nanoemulsions are prepared using high speed (sheer) homogenization and sonication, we next prepared a conventional nanoemulsion using this technique (Ganta and Amiji, 2009; Shakeel et al., 2009; Vyas et al., 2008). We performed a 2 × 2 × 2 factorial experimental design using JMP software. The details of the formulations with the droplet size, polydispersity index and zeta potential are shown in Table 2. Based on the formulations prepared, the optimized formulation (CNE-2) consisted of 10% Capmul PG8 (oil), 2% Tween 80 (surfactant) and 1.5% DSPE-PEG 5000 (cosurfactant). The droplet size of CNE-2 was as low as 73.6 nm (Table 2). DSPEPEG5000 was chosen because it is negatively charged and hence enhances the stability of nanoemulsion (Table 2). The zeta potential of the nanoemulsion without DSPE-PEG 5000 was −4.57 mV and that with DSPE-PEG 5000 was −14.87 mV (Table 2).
Table 2.
Formulation composition, particle size and stability of conventional nanoemulsion
| Formulation | Oil | Oil % | Tween 80 Percentage | DSPE PEG 5000 percentage | Droplet size (nm) |
Zeta Potential (mV) |
Stability at 4°C (Days) | Stability at RT (Days) |
|---|---|---|---|---|---|---|---|---|
| CNE-1 | Capmul PG8 | 20 | 2 | – | 632.8 | −1.83 | 7 | 5 |
| CNE-2 | Capmul PG8 | 10 | 2 | 1.5 | 73.6 | −14.87 | >180 | 180 |
| CNE-3 | Capmul PG8 | 10 | 2 | – | 212.3 | −4.57 | 21 | 18 |
| CNE-4 | Capmul PG8 | 10 | 1 | – | 300.7 | −3.98 | 8 | 5 |
| CNE-5 | Capmul PG8 | 10 | 1 | 1.5 | 191.3 | −5.9 | 14 | 14 |
| CNE-6 | Capmul PG8 | 20 | 1 | – | 608.5 | −1.27 | 3 | 2 |
| CNE-7 | Capmul PG8 | 20 | 1 | 1.5 | 316.7 | −1.98 | 11 | 8 |
| CNE-8 | Capmul PG8 | 20 | 1 | – | 549.5 | −1.54 | 5 | 2 |
3.3 Droplet size and PL entrapment efficiency in the optimized nanoemulsions
Composition and physical characteristics of the two optimized nanoemulsions are listed in Fig. 2A. PL was encapsulated at a concentration of 2 mg/mL in SENE-3. The particle size of SENE-3 was 131.2 nm with a polydispersity index of 0.259. SENE-3 exhibited 89% drug entrapment efficiency. The concentration of PL entrapped in CNE-2 was 2.5 mg/mL. CNE-2 exhibited particle size of 74 nm with a polydispersity index of 0.12. The PL entrapment efficiency of CNE-2 was 93%. Hence, both the formulation exhibited low droplet size and high PL entrapment.
Figure 2.
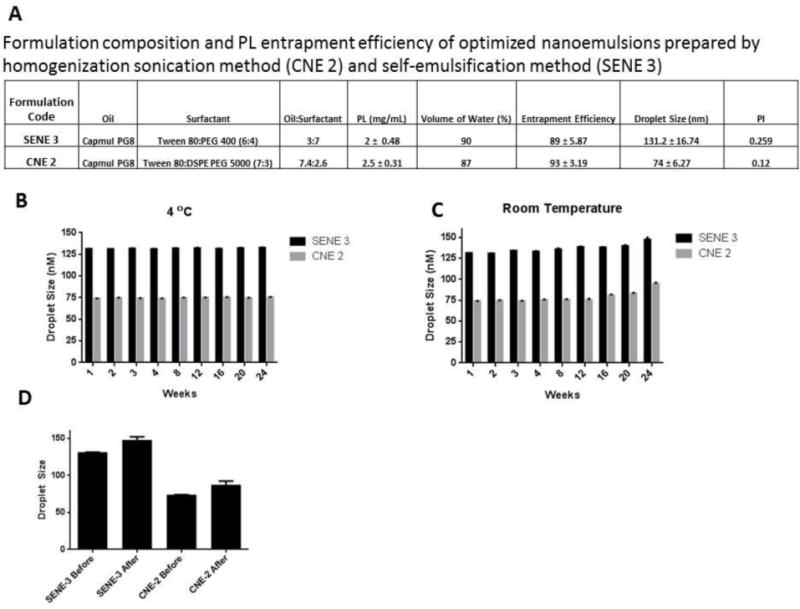
(A) Formulation composition, particle size, polydispersity index and entrapment efficiency of optimized self-emulsifying nanoemulsion (SENE-3) and conventional nanoemulsion (CNE-2). Stability of SENE-3 and CNE-2 as measured by particle size at (B) 4 °C and (C) room temperature over a period of 24 weeks. (D) Effect of centrifugal stress on particle size of SENE-3 and CNE-2.
3.4 Nanoemulsion stability
The stability of nanoemulsions was tested at room temperature and 4°C. The nanoemulsions were stored at both the temperatures and the droplet size was evaluated every week. Both the formulations demonstrated high stability at room temperature as well as 4°C (Fig. 2B–C). However, at room temperature, both the nanoemulsions showed slight increase in the droplet size at 24th week (Fig 2C). Furthermore, centrifugal stress had minimal effect on the stability of the nanoemulsions (Fig. 2D).
3.5 Dissolution study
The dissolution profiles of PL-loaded nanoemulsions were compared with PEG 400-PL solution and PL encapsulated in a hard gelatin capsule in simulated gastric fluid. The dissolution of PL from the capsule was very low with only 23.9 ± 5.2% of the drug going into the dissolution media at the end of 120 mins (Fig. 3A). The release of PL from the PEG 400 solution was 54.5 ± 6.1% (Fig. 3A). The poor dissolution of PL can be attributed to the poor aqueous solubility and wettability of PL. Both the nanoemulsions exhibited significantly faster and higher dissolution of PL as compared to either PL capsule or PL-PEG 400 solution. At the end of 120 mins, 88.5 ± 3.7% of PL was released in the dissolution media from SENE-3 (Fig. 3A). From CNE-2, 92.3 ± 13.2 % of the drug was released in the dissolution media by 120 mins of dissolution test (Fig. 3A). Our results showed that nanoemulsions effectively enhance the solubility and promote effective dispersion of PL in the dissolution media.
Figure 3.
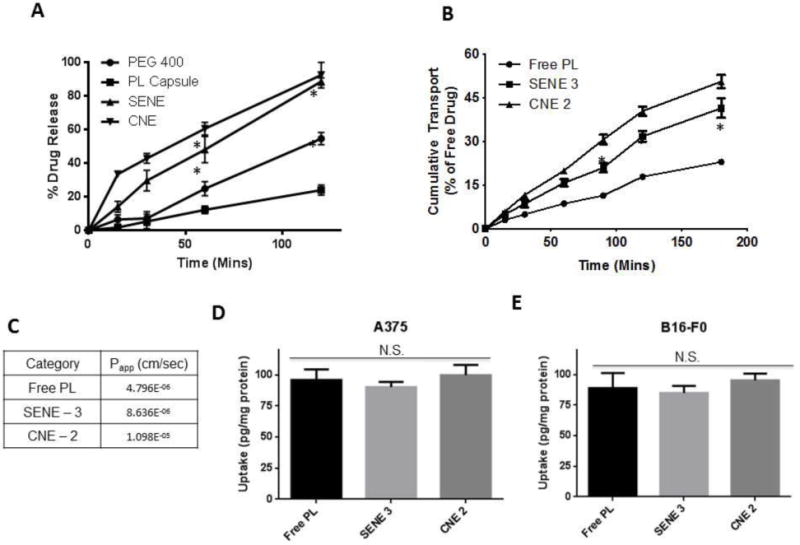
(A) Dissolution studies of pure PL, PL capsule and PL nanoemulsions in simulated gastric fluid (pH = 1.2). Data represented as mean ± S.D., n=3. * represents p < 0.05 after two-way ANOVA followed by Tukey’s multiple comparison test. (B) Time course of pure PL and PL nanoemulsion transport across Caco-2 monolayers. Data represented as mean ± S.D., n=3. * represents p < 0.05 after two-way ANOVA followed by Tukey’s multiple comparison test. (C) Apparent permeability (Papp) of pure PL and PL nanoemulsion across Caco-2 monolayers. (D–E) LC-MS/MS analysis of intracellular accumulation of PL delivered as pure solution in DMSO or nanoemulsions in A375 and B16-F0 melanoma cells after 30-min exposure (n=3).
3.6 Permeability studies in Caco-2 monolayer
Nanoemulsions can enhance the transport properties of the drug due to high interfacial area. Caco-2 cells monolayer has been used as a model of the intestinal epithelium. The permeability of drug across Caco-2 monolayer correlates with the intestinal absorption of the drug (Balimane et al., 2006; Hubatsch et al., 2007; Stenberg et al., 2001). Addition of formulations did not alter the TEER value of the monolayer. Moreover, the TEER value of the nanoemulsion group was similar to PBS, control or PL solution indicating that there was no alteration in the tight junction integrity. The cumulative amount of PL transported from apical to basolateral direction across Caco-2 monolayer was significantly higher in SENE-3 and CNE-3 than PL-PEG 400 solution (Fig. 3B). The apparent permeability (Papp) of PL free drug was 4.80×10⁻⁶ cm/sec (Fig. 3B–C). On the other hand, the Papp of PL in SENE-3 and CNE-2 was 8.64×10⁻⁶ cm/sec and 1.10×10⁻⁵ cm/sec, respectively, exhibiting more than 2-fold increase in the permeability (Fig. 3B–C). Although PL in CNE-2 demonstrated higher permeability than SENE-3, the difference was not statistically significant. These observations suggest that nanoemulsions may enhance the intestinal absorption of PL.
3.7 Cellular uptake of PL
Uptake of PL in A375 and B16-F0 melanoma cells was measured by quantitating the intracellular PL by LC-MS/MS. Uptake of PL in nanoemulsions was compared with pure PL in PEG 400 solution. The total amount of PL in nanoemulsions taken up by the cells was equivalent to pure PL in DMSO solution. The total amount of PL delivered intracellularly by SENE-3, CNE-2 and PL-PEG 400 solution in A375 cells after 30 mins of exposure was 90.23 ± 4.1, 99.9 ± 8.2 and 95.9 ± 8.4 pg/mg protein respectively (Fig. 3D). The amount of PL in SENE-3, CNE-2 and PL-PEG400 solution taken by B1F0 cells was 84.97 ± 5.9, 95.31 ± 5.5 and 88.98 ± 12.3 pg/mg protein respectively (Fig. 3E). These observations suggest that nanoemulsions did not obstruct the cellular uptake of PL.
3.8 Cytotoxic effects of PL nanoemulsions
To assess effective intracellular release of PL from nanoemulsions, we tested the cytotoxic effects of PL loaded nanoemulsions on A375 and B16-F0 melanoma cells. Blank formulations did not show any cytotoxic effects on both the cell lines (data not shown). Our results showed that PL loaded in either of the nanoemulsions exerted better cytotoxic effects as compared to the pure drug. The IC50 of PL in SENE-3 in A375 cells was 7.6, 3.7 and 2.7 μM and that in B16-F0 cells was 4.7, 3.8 and 1 μM at 24, 48 and 72 hours respectively (Fig. 4A–B). The IC50 of PL in CNE-2 in A375 cells was 3.5, 2.8 and 2.4 μM and that in B16-F0 cells was 3.6, 2.7 and 1.3 μM (Fig 4A–B). The IC50 values of pure PL in A375 cells at 24, 48 and 72 hours was 7.5, 3 and 2.5 μM respectively and that in B16-F0 cells was 6.59, 3.45 and 2.7 μM respectively (Fig. 4A–B). The IC50 of pure PL was slightly higher as compared to both the nanoemulsions, but not significantly different.
Figure 4.
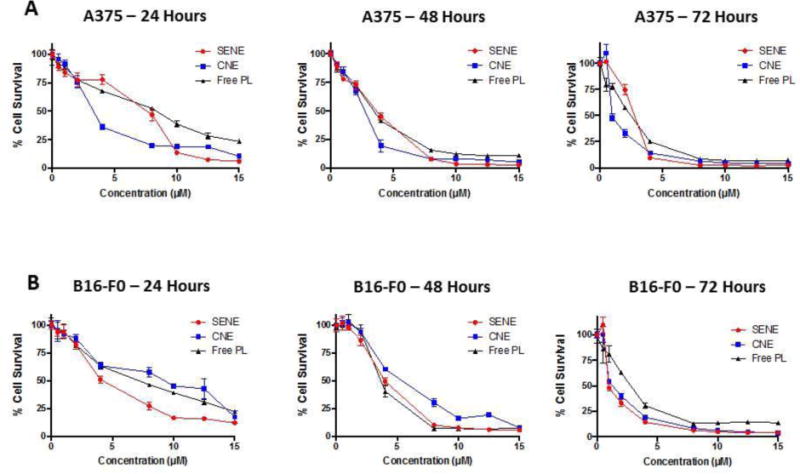
Cytotoxicity analysis of pure PL and PL nanoemulsions in (A) A375 cells and in (B) B16-F0 cells as analyzed by SRB assay.
3.9 Toxicological evaluation of nanoemulsions in vivo
To test the toxicity of nanoemulsions in vivo, mice were treated with blank or PL loaded SENE-3 and CNE-2 for 60 days. Mice were weighed twice a week throughout the study. We did not observe any difference in the weight of mice between control and blank or PL loaded nanoemulsions (Fig. 5A). At the end of 60 days, blood was collected from each mouse treated with PL loaded nanoemulsions. Plasma was separated and subjected to blood chemistry panel to estimate the levels of ALT, AST, total protein, serum albumin, glucose, cholesterol, bilirubin, creatinine, calcium, phosphorus, BUN, ALP, Amylase, GGT, Globulins, creatinine kinase and A/G ratio. Our results showed no significant difference in the levels of any of these parameters between control, blank or PL loaded SENE-3 and CNE-2 groups (Fig. 5B–H). Additionally, liver, kidney and heart were fixed in formalin and embedded in paraffin. The paraffin embedded sections were subjected to hemotoxylin and eosin staining to observe morphological differences. We did not observe any difference in the morphology between the control and the nanoemulsion groups (Fig. 5I). These observations suggested that both SENE-3 and CNE-2 nanoemulsions did not exhibit toxicity in mice.
Figure 5.
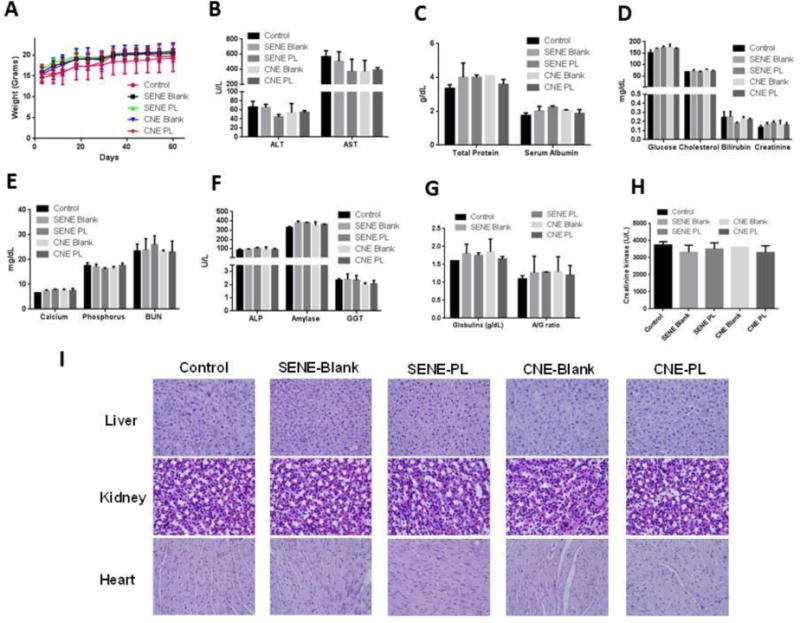
C57-BL/6 mice were treated with blank or PL loaded formulations daily for 60 days via oral gavage (n=4). (A) Body weight of mice measured twice a week throughout the duration of the experiment. (B–I) At the end of the experiment, blood was collected and harvest to separate plasma. Plasma was analyzed for entire chemistry panel. (I) H & E staining of formalin fixed paraffin embedded sections of liver, heart and kidney of the mice from control, blank or PL loaded nanoemulsions group.
3.10 Pharmacokinetic analysis of PL nanoemulsion
To perform pharmacokinetic study, we developed a LC-MS/MS method for analysis of PL in biological samples. A representative chromatogram is shown in Supp. Fig. 1. We first analyzed the pharmacokinetic profile of PL administered via intravenous route by injecting a dose of 2 mg/kg PL via tail vein. The pharmacokinetic profile (concentration vs time) is shown in Fig. 6A. After modeling the pharmacokinetic data using WinNonlin, the pharmacokinetics of PL was found to fit in a two-compartment model according to Gauss-Newton criteria. The values of the pharmacokinetic parameters are given in Fig. 6B. The apparent volume of distribution in the central compartment (V1) was 46.087 mL. The values of K10, K12 and K21 were 0.186, 0.189 and 0.092 min−1 respectively (Fig. 6B). AUC of PL after i.v. dosing was 33886.17 ng.min/mL and AUMC was observed to be 2757145 ng.min2/mL (Fig. 6B). Upon modeling the data, Cmax of PL observed was 4339.608 ng/mL, which was very low as compared to the administered dose (Fig. 6B), which could be because of high volume of distribution of PL. Additionally, the apparent volume of distribution at steady state was 140.449 mL, indicating very high distribution of PL. The clearance of PL was observed to be 8.576 mL/min (Fig. 6B).
Figure 6.
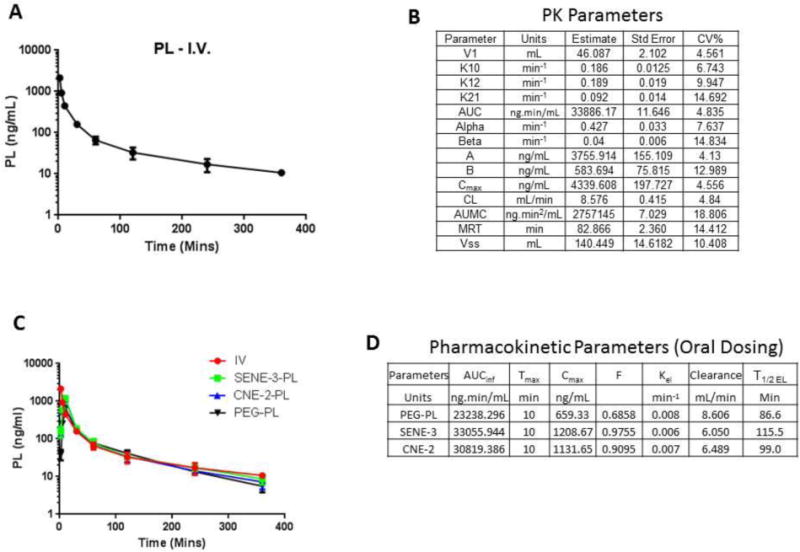
(A) Plasma Concentration vs. Time profile of PL after intravenous administration at a dose of 10 mg/kg in C57-BL/6 mice. (B) Values of the pharmacokinetic parameters along with standard error and %CV of PL evaluated by two-compartment model using WinNonlin. (C) Concentration vs. Time profile of free PL and PL loaded nanoemulsion administered orally at a dose of 10 mg/kg. (D) Values of the pharmacokinetic parameters calculated based on Concentration vs. Time profile obtained upon oral administration of free PL or PL loaded nanoemulsions.
Upon modeling the data, the standard error as well as %CV of all the calculated parameters was very low indicating the precision of the estimated parameter. The graph of predicted concentration vs. observed concentration was a straight line with a slope of 1 indicating that two compartment model was a perfect fit for the data (Supp. Fig. 2A). We further assessed the residuals to identify the correctness of the model. The plot of Residual Y vs. Predicted Y was randomly distributed around 0 and did not show any discernible trend indicating the use of correct model (Supp. Fig. 2B). Moreover, similar random distribution was observed with a plot of Residual Y vs. X indicating that the model accurately predicts the effect of time on the concentration of PL (Supp. Fig. 2C). In addition none of the values in the correlation matrix were >0.95 indicating that the parameters estimated by the model were not correlative indicating good experimental design and sampling times. The highest correlation matrix value observed was 0.508 (Supp. Fig. 2D). Finally, based on Eigen values, condition number was calculated. Generally, a condition number is supposed to be less than or equal to 10number of parameters (In this case − 104 = 10,000). The condition number obtained was 886.5 which was substantially less than 10,000, suggesting the stability of the final solution. Hence, based on these criteria, the pharmacokinetics of PL followed two-compartment model when administered intravenously.
We then performed pharmacokinetics study following oral administration of PL nanoemulsions and pure PL in PEG 400. The pharmacokinetic profile is shown in Fig. 6C. The elimination profiles of orally administered PL either in pure form or as nanoemulsion was similar to that observed after intravenous administration. The pharmacokinetic parameters of PL post oral dosing are shown in Fig. 6D. The Cmax of PL observed in SENE-3 and CNE-2 was 1208.667 and 1131.652 ng/mL respectively, which was significantly higher than that observed with PL-PEG 400 solution (659.33 ng/mL) (Fig. 6D). The oral bioavailability of PL in SENE-3 was 97.55 % and that with CNE-2 was 90.95% (Fig. 6D). However, the oral bioavailability of PL administered as PEG 400 solution was only 68.58% (Fig. 6D). The pharmacokinetic profile showed a rapid absorption phase with a Tmax of 10 mins followed by prolonged elimination phase (Fig 6C–D). The elimination half-life (T1/2 EL) of PL in SENE-3 was 115.5 mins, 99 mins for PL in CNE-2 and PL in PEG 400 solution was 86.6 mins (Fig. 6D). These observations indicated that nanoemulsions significantly enhanced that bioavailability of PL.
3.11 Efficacy studies
Finally, we evaluated the antitumor efficacy of PL loaded nanoemulsions in melanoma tumor bearing mice. B16-F0 cells were injected subcutaneously in both the flanks of mice. Once the palpable tumors were formed, mice were randomly divided in 3 groups (Control, SENE, and CNE) with 8 mice in each group. The average tumor volume in the control group at the end of 25 days was 1940 ± 284 mm3 (Fig. 7A). The average tumor volume in the mice from SENE-3 group was 545.75 ± 116 mm3 and that from CNE-2 group was 608.35 ± 51.56mm3 exhibiting about 75% reduction in the tumor growth (Fig. 7A). At the end of the experiment, the tumors were excised and weighed. The average weight of the tumors from control group was 2.1 ± 0.31 gm (Fig. 7B). The average weight of the tumors from SENE-3 and CNE-2 group was 0.46 ± 0.15 gm and 0.61 ± 0.1 gm respectively, once again exhibiting about 75% decrease in the tumor weight (Fig. 7B). These observations suggested that both PL nanoemulsions were effective in inhibiting melanoma tumor growth in vivo.
Figure 7.
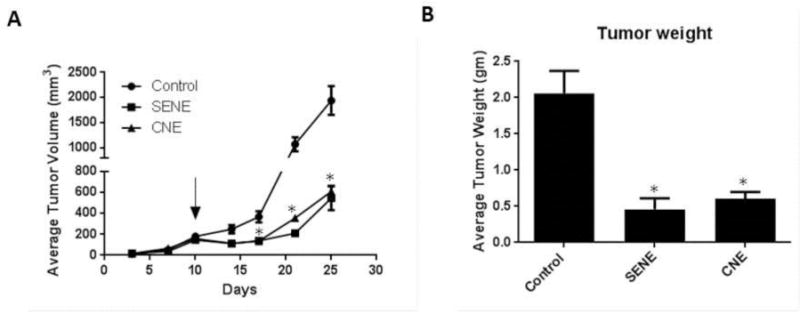
B16-F0 melanoma tumors were implanted in C57-BL/6 mice. Once palpable tumors were formed, mice were treated with PL loaded SENE-3 or CNE-2 (n=8). (A) Average tumor volume measured by vernier calipers of control and PL treated mice. (B) Average weight of the tumors from control and PL loaded nanoemulsion treated mice taken when the experiment was terminated. * represents p<0.05 as compared to control.
4. Discussion
The primary objective of this study was to design and characterize nanoemulsions for oral delivery of a lipophilic alkaloid piplartine (PL), determine its pharmacokinetics in mice and evaluate its anticancer effect in vivo. One of the issues encountered was the low solubility of PL in conventional oils like corn oil, cottonseed oil and medium chain triglycerides, which are usually employed in formulation (Date and Nagarsenker, 2008a, b; Mitri et al., 2011; Ragelle et al., 2012; Zou et al., 2015). Hence, we chose Capmul PG8 (as oil phase), which is known to produce stable nanoemulsions, for preformulation studies. Tween 80 (Hydrophilic-Lipophilic Balance HLB 15) and Solutol HS (HLB 16) were chosen as primary surfactants for preformulation studies. PEG 400 and Transcutol were chosen as cosurfactants as PL exhibited high solubility in both of these solvents. Self-emulsifying nanoemulsions formulated using Solutol HS and PEG 400 or Transcutol were highly unstable. This may be because of high thermodynamic instability when Solutol HS was mixed with either PEG 400 or Transcutol (Zhang et al., 2015). Self-emulsifying nanoemulsions formulated with a combination of Tween 80 and Transcutol displayed instability, which might be due to a shift in HLB towards hydrophobic side because of low HLB of Transcutol. Best mixture for development of self-emulsifying nanoemulsions with Capmul PG8 was the combination of Tween 80 and PEG 400. Inclusion of DSPE-PEG 5000 significantly reduced the droplet size and enhanced the stability of nanoemulsion, which could be attributed to the negative charge imparted by DSPE-PEG 5000, increasing the negativity of zeta potential. Both the formulations significantly enhanced the solubility of PL to > 2 mg/mL, which was appropriate for in vitro and in vivo dosing.
The formulations stored at 4°C as SENE-3 and CNE-2 were stable for more than 6 months. Moreover, at room temperature, which is considered as accelerated condition, both the formulations showed slight increase in the particle after 6 months.
Nanoemulsions promote the dispersion of lipophilic drug and therefore, enhance the rate and extent of dissolution in the dissolution media (Monteiro et al., 2012; Onoue et al., 2010). In fact, for poorly water-soluble drug such as PL, the rate and extent of dissolution dictates the absorption rate from the gastrointestinal tract (Amidon et al., 1995). PL nanoemulsions exhibited higher rate and extent of dissolution than free PL suggesting that nanoemulsions may enhance the oral absorption of PL. Furthermore, PL nanoemulsions demonstrated a significant increase in Papp as compared to free PL across Caco-2 monolayer further suggesting enhanced oral bioavailability. The increase in Papp could be due to enhanced contact to biological membrane because of increase in the surface area of the droplets. The ingredients of the formulation may also impact the fluidity and permeability of the biological membrane (Qhattal et al., 2011).
One of the primary concerns with SENE-3 and CNE-2 was the toxicity associated with Capmul PG8 as it has not been used extensively. The LD50 of Capmul PG8 in rats is 5 gm/kg. We observed that both the nanoemulsions did not exhibit any toxicity in vitro. Moreover, the long-term toxicity in vivo confirmed that nanoemulsions with or without PL were not toxic to mice upon long term oral administration establishing that nanoemulsions were safe in vivo.
The detailed pharmacokinetics of PL was not known. Upon modeling the concentration vs time data of intravenously administered PL using WinNonlin, we observed that that PL followed two-compartment pharmacokinetics with a high apparent volume of distribution. The pharmacokinetic profile showed an initial distribution phase followed by the elimination phase. Moreover, PL nanoemulsion showed a significant improvement in the oral bioavailability as compared to free PL, which correlated with in vitro dissolution and permeability. There was also a significant increase in the peak plasma concentration of PL when administered orally as nanoemulsions as compared to free PL. However, there was no difference in the mean absorption time between PL nanoemulsions and free PL. Hence, the increase in the bioavailability may be associated with augmented rate and extent of dissolution and permeability. This suggests that nanoemulsions are promising nanocarriers that may improve the oral bioavailability of PL.
Finally, we demonstrated that PL nanoemulsions could elicit a significant anti-tumor activity in vivo in the melanoma tumor bearing mice. It is noteworthy that B16-F0 melanoma tumors are one of the most aggressive tumors and a relatively low dose of PL (10 mg/kg) was able to suppress the tumor growth by 75%. These results suggested that nanoemulsions might be suitable oral delivery system to evaluate anti-cancer activity of PL.
5. Conclusion
In conclusion, we have developed two nanoemulsion formulations of PL that enabled relatively higher solubility of PL. The nanoemulsions improved in vitro dissolution and permeability profile of PL. The developed formulations did not show any signs of toxicity upon long-term administration. Moreover, for the first time, we conducted a detailed pharmacokinetic study of PL and performed compartmental modeling using WinNonlin. The nanoemulsions markedly increased the bioavailability of PL and effectively suppressed the growth of melanoma tumors in vivo. Our study for the first time shows that nanoemulsions can be advantageously employed to enhance the oral bioavailability and anti-cancer efficacy of PL.
Supplementary Material
Acknowledgments
This work was supported in part by R01 grant CA129038 (to S.K.S.) awarded by National Cancer Institute. The funders had no role in study design, data collection and analysis, decision to publish, or preparation of the manuscript.
Footnotes
Publisher's Disclaimer: This is a PDF file of an unedited manuscript that has been accepted for publication. As a service to our customers we are providing this early version of the manuscript. The manuscript will undergo copyediting, typesetting, and review of the resulting proof before it is published in its final citable form. Please note that during the production process errors may be discovered which could affect the content, and all legal disclaimers that apply to the journal pertain.
Conflict of Interest
Authors disclose no conflict of interest
References
- Adams DJ, Dai M, Pellegrino G, Wagner BK, Stern AM, Shamji AF, Schreiber SL. Synthesis, cellular evaluation, and mechanism of action of piperlongumine analogs. Proceedings of the National Academy of Sciences of the United States of America. 2012;109:15115–15120. doi: 10.1073/pnas.1212802109. [DOI] [PMC free article] [PubMed] [Google Scholar]
- Amidon GL, Lennernas H, Shah VP, Crison JR. A theoretical basis for a biopharmaceutic drug classification: the correlation of in vitro drug product dissolution and in vivo bioavailability. Pharmaceutical Research. 1995;12:413–420. doi: 10.1023/a:1016212804288. [DOI] [PubMed] [Google Scholar]
- Anton N, Vandamme TF. Nano-emulsions and micro-emulsions: clarifications of the critical differences. Pharmaceutical Research. 2011;28:978–985. doi: 10.1007/s11095-010-0309-1. [DOI] [PubMed] [Google Scholar]
- Balimane PV, Han YH, Chong S. Current industrial practices of assessing permeability and P-glycoprotein interaction. The AAPS Journal. 2006;8:E1–13. doi: 10.1208/aapsj080101. [DOI] [PMC free article] [PubMed] [Google Scholar]
- Bharadwaj U, Eckols TK, Kolosov M, Kasembeli MM, Adam A, Torres D, Zhang X, Dobrolecki LE, Wei W, Lewis MT, Dave B, Chang JC, Landis MD, Creighton CJ, Mancini MA, Tweardy DJ. Drug-repositioning screening identified piperlongumine as a direct STAT3 inhibitor with potent activity against breast cancer. Oncogene. 2015;34:1341–1353. doi: 10.1038/onc.2014.72. [DOI] [PMC free article] [PubMed] [Google Scholar]
- Chatterjee A, Dutta CP. Alkaloids of Piper longum Linn. I. Structure and synthesis of piperlongumine and piperlonguminine. Tetrahedron. 1967;23:1769–1781. doi: 10.1016/s0040-4020(01)82575-8. [DOI] [PubMed] [Google Scholar]
- Date AA, Nagarsenker MS. Design and evaluation of microemulsions for improved parenteral delivery of propofol. AAPS PharmSciTech. 2008a;9:138–145. doi: 10.1208/s12249-007-9023-7. [DOI] [PMC free article] [PubMed] [Google Scholar]
- Date AA, Nagarsenker MS. Parenteral microemulsions: an overview. International Journal of Pharmaceutics. 2008b;355:19–30. doi: 10.1016/j.ijpharm.2008.01.004. [DOI] [PubMed] [Google Scholar]
- Fofaria NM, Kim SH, Srivastava SK. Piperine causes G1 phase cell cycle arrest and apoptosis in melanoma cells through checkpoint kinase-1 activation. PloS One. 2014;9:e94298. doi: 10.1371/journal.pone.0094298. [DOI] [PMC free article] [PubMed] [Google Scholar]
- Fofaria NM, Srivastava SK. Critical role of STAT3 in melanoma metastasis through anoikis resistance. Oncotarget. 2014a;5:7051–7064. doi: 10.18632/oncotarget.2251. [DOI] [PMC free article] [PubMed] [Google Scholar]
- Fofaria NM, Srivastava SK. STAT3 induces anoikis resistance, promotes cell invasion and metastatic potential in pancreatic cancer cells. Carcinogenesis. 2014b;36:142–150. doi: 10.1093/carcin/bgu233. [DOI] [PMC free article] [PubMed] [Google Scholar]
- Ganta S, Amiji M. Coadministration of Paclitaxel and curcumin in nanoemulsion formulations to overcome multidrug resistance in tumor cells. Molecular Pharmaceutics. 2009;6:928–939. doi: 10.1021/mp800240j. [DOI] [PubMed] [Google Scholar]
- Hubatsch I, Ragnarsson EG, Artursson P. Determination of drug permeability and prediction of drug absorption in Caco-2 monolayers. Nature Protocols. 2007;2:2111–2119. doi: 10.1038/nprot.2007.303. [DOI] [PubMed] [Google Scholar]
- Kadu PJ, Kushare SS, Thacker DD, Gattani SG. Enhancement of oral bioavailability of atorvastatin calcium by self-emulsifying drug delivery systems (SEDDS) Pharmaceutical Development and Technology. 2011;16:65–74. doi: 10.3109/10837450903499333. [DOI] [PubMed] [Google Scholar]
- Lin Z, Liao Y, Venkatasamy R, Hider RC, Soumyanath A. Amides from Piper nigrum L. with dissimilar effects on melanocyte proliferation in-vitro. The Journal of Pharmacy and Pharmacology. 2007;59:529–536. doi: 10.1211/jpp.59.4.0007. [DOI] [PubMed] [Google Scholar]
- McClements DJ, Rao J. Food-grade nanoemulsions: formulation, fabrication, properties, performance, biological fate, and potential toxicity. Critical Reviews in Food Science and Nutrition. 2011;51:285–330. doi: 10.1080/10408398.2011.559558. [DOI] [PubMed] [Google Scholar]
- Mitri K, Shegokar R, Gohla S, Anselmi C, Muller RH. Lipid nanocarriers for dermal delivery of lutein: preparation, characterization, stability and performance. International Journal of Pharmaceutics. 2011;414:267–275. doi: 10.1016/j.ijpharm.2011.05.008. [DOI] [PubMed] [Google Scholar]
- Monteiro LM, Lione VF, do Carmo FA, do Amaral LH, da Silva JH, Nasciutti LE, Rodrigues CR, Castro HC, de Sousa VP, Cabral LM. Development and characterization of a new oral dapsone nanoemulsion system: permeability and in silico bioavailability studies. International Journal of Nanomedicine. 2012;7:5175–5182. doi: 10.2147/IJN.S36479. [DOI] [PMC free article] [PubMed] [Google Scholar]
- Mukherjee T, Plakogiannis FM. Development and oral bioavailability assessment of a supersaturated self-microemulsifying drug delivery system (SMEDDS) of albendazole. The Journal of Pharmacy and Pharmacology. 2010;62:1112–1120. doi: 10.1111/j.2042-7158.2010.01149.x. [DOI] [PubMed] [Google Scholar]
- Onoue S, Takahashi H, Kawabata Y, Seto Y, Hatanaka J, Timmermann B, Yamada S. Formulation design and photochemical studies on nanocrystal solid dispersion of curcumin with improved oral bioavailability. Journal of Pharmaceutical Sciences. 2010;99:1871–1881. doi: 10.1002/jps.21964. [DOI] [PubMed] [Google Scholar]
- Pramanik KC, Fofaria NM, Gupta P, Srivastava SK. CBP-mediated FOXO-1 acetylation inhibits pancreatic tumor growth by targeting SirT. Molecular Cancer Therapeutics. 2014;13:687–698. doi: 10.1158/1535-7163.MCT-13-0863. [DOI] [PMC free article] [PubMed] [Google Scholar]
- Pramanik KC, Kudugunti SK, Fofaria NM, Moridani MY, Srivastava SK. Caffeic acid phenethyl ester suppresses melanoma tumor growth by inhibiting PI3K/AKT/XIAP pathway. Carcinogenesis. 2013;34:2061–2070. doi: 10.1093/carcin/bgt154. [DOI] [PMC free article] [PubMed] [Google Scholar]
- Qhattal HS, Wang S, Salihima T, Srivastava SK, Liu X. Nanoemulsions of cancer chemopreventive agent benzyl isothiocyanate display enhanced solubility, dissolution, and permeability. Journal of Agricultural and Food Chemistry. 2011;59:12396–12404. doi: 10.1021/jf202612b. [DOI] [PubMed] [Google Scholar]
- Ragelle H, Crauste-Manciet S, Seguin J, Brossard D, Scherman D, Arnaud P, Chabot GG. Nanoemulsion formulation of fisetin improves bioavailability and antitumour activity in mice. International Journal of Pharmaceutics. 2012;427:452–459. doi: 10.1016/j.ijpharm.2012.02.025. [DOI] [PubMed] [Google Scholar]
- Raj L, Ide T, Gurkar AU, Foley M, Schenone M, Li X, Tolliday NJ, Golub TR, Carr SA, Shamji AF, Stern AM, Mandinova A, Schreiber SL, Lee SW. Selective killing of cancer cells by a small molecule targeting the stress response to ROS. Nature. 2011;475:231–234. doi: 10.1038/nature10167. [DOI] [PMC free article] [PubMed] [Google Scholar] [Retracted]
- Rajpoot P, Pathak K, Bali V. Therapeutic applications of nanoemulsion based drug delivery systems: a review of patents in last two decades. Recent Patents on Drug Delivery & Formulation. 2011;5:163–172. doi: 10.2174/187221111795471427. [DOI] [PubMed] [Google Scholar]
- Rao J, McClements DJ. Formation of flavor oil microemulsions, nanoemulsions and emulsions: influence of composition and preparation method. Journal of Agricultural and Food Chemistry. 2011;59:5026–5035. doi: 10.1021/jf200094m. [DOI] [PubMed] [Google Scholar]
- Roh JL, Kim EH, Park JY, Kim JW, Kwon M, Lee BH. Piperlongumine selectively kills cancer cells and increases cisplatin antitumor activity in head and neck cancer. Oncotarget. 2014;5:9227–9238. doi: 10.18632/oncotarget.2402. [DOI] [PMC free article] [PubMed] [Google Scholar]
- Sadurni N, Solans C, Azemar N, Garcia-Celma MJ. Studies on the formation of O/W nano-emulsions, by low-energy emulsification methods, suitable for pharmaceutical applications. European Journal of Pharmaceutical Sciences. 2005;26:438–445. doi: 10.1016/j.ejps.2005.08.001. [DOI] [PubMed] [Google Scholar]
- Sarker DK. Engineering of nanoemulsions for drug delivery. Current Drug Delivery. 2005;2:297–310. doi: 10.2174/156720105774370267. [DOI] [PubMed] [Google Scholar]
- Shakeel F, Ramadan W, Ahmed MA. Investigation of true nanoemulsions for transdermal potential of indomethacin: characterization, rheological characteristics, and ex vivo skin permeation studies. Journal of Drug Targeting. 2009;17:435–441. doi: 10.1080/10611860902963021. [DOI] [PubMed] [Google Scholar]
- Stenberg P, Norinder U, Luthman K, Artursson P. Experimental and computational screening models for the prediction of intestinal drug absorption. Journal of Medicinal Chemistry. 2001;44:1927–1937. doi: 10.1021/jm001101a. [DOI] [PubMed] [Google Scholar]
- Vyas TK, Shahiwala A, Amiji MM. Improved oral bioavailability and brain transport of Saquinavir upon administration in novel nanoemulsion formulations. International Journal of Pharmaceutics. 2008;347:93–101. doi: 10.1016/j.ijpharm.2007.06.016. [DOI] [PMC free article] [PubMed] [Google Scholar]
- Yang S, Gursoy RN, Lambert G, Benita S. Enhanced oral absorption of paclitaxel in a novel self-microemulsifying drug delivery system with or without concomitant use of P-glycoprotein inhibitors. Pharmaceutical Research. 2004;21:261–270. doi: 10.1023/b:pham.0000016238.44452.f1. [DOI] [PubMed] [Google Scholar]
- Zhang L, Zhang L, Zhang M, Pang Y, Li Z, Zhao A, Feng J. Self-emulsifying drug delivery system and the applications in herbal drugs. Drug Delivery. 2015;22:475–486. doi: 10.3109/10717544.2013.861659. [DOI] [PubMed] [Google Scholar]
- Zou L, Liu W, Liu C, Xiao H, McClements DJ. Utilizing food matrix effects to enhance nutraceutical bioavailability: increase of curcumin bioaccessibility using excipient emulsions. Journal of Agricultural and Food Chemistry. 2015;63:2052–2062. doi: 10.1021/jf506149f. [DOI] [PubMed] [Google Scholar]
Associated Data
This section collects any data citations, data availability statements, or supplementary materials included in this article.