

Abstract
Proper understanding of the long-term epidemiology of chikungunya has been hampered by poor surveillance. Outbreak years are unpredictable and cases often misdiagnosed. Here we analyzed age-specific data from 2 serological studies (from 1973 and 2012) in Cebu, Philippines, to reconstruct both the annual probability of infection and population-level immunity over a 60-year period (1952–2012). We also explored whether seroconversions during 2012–2013 were spatially clustered. Our models identified 4 discrete outbreaks separated by an average delay of 17 years. On average, 23% (95% confidence interval [CI], 16%–37%) of the susceptible population was infected per outbreak, with >50% of the entire population remaining susceptible at any point. Participants who seroconverted during 2012–2013 were clustered at distances of <230 m, suggesting focal transmission. Large-scale outbreaks of chikungunya did not result in sustained multiyear transmission. Nevertheless, we estimate that >350 000 infections were missed by surveillance systems. Serological studies could supplement surveillance to provide important insights on pathogen circulation.
Keywords: chikungunya, epidemiology, Philippines, modeling, serological study
Chikungunya virus (CHIKV) is a mosquito-transmitted alphavirus. While infection is rarely fatal, disease manifestations can be severe and last for many months [1]. Outbreaks of chikungunya have been recorded since the 18th century, with regular sweeps from Africa to Southeast Asia observed over 40–50-year cycles [2]. More recently, outbreaks have been observed over wider geographical areas, and since 2010, autochthonous transmission has been documented in 5 continents [1, 3]. Most recently, CHIKV was introduced into the Caribbean in 2013 and subsequently spread into mainland South America and North America [4, 5]. The source of the Caribbean outbreak is unclear. However, genetic analyses link it to Asian genotype strains circulating in the Philippines [6].
The long-term epidemiology of chikungunya within any location is poorly understood. Outbreaks are largely unpredictable, and local immunity levels at the start of an epidemic are usually unknown except in regions where all individuals are naive to CHIKV exposure. Globally, we do not know whether there are locations with stable sustained transmission that can act as viral sources for outbreaks elsewhere. Understanding the historical incidence of the disease from passive surveillance data is difficult as hospitals usually lack appropriate diagnostic assays to identify infections. Cases are often misdiagnosed as dengue, which can be found in the same communities and is transmitted by the same vector [7]. Recently, it has been demonstrated that subclinical CHIKV infections may be much more common than previously thought and may even represent the majority of infections, further raising the prospect of undetected outbreaks or even undetected sustained transmission over multiple years [6].
Individuals who become infected by CHIKV develop specific antibodies to the virus that can be detected years later, using plaque reduction neutralization tests (PRNTs) [8]. Seroprevalence studies can therefore be used to characterize the proportion of the population that has been exposed to the virus at some point. Furthermore, thorough analysis of age-specific seroprevalence patterns may potentially be used to reconstruct the historical patterns of infection within a community. This provides a unique opportunity to characterize the long-term epidemiology of a virus, something that has not been feasible from traditional surveillance system approaches despite the substantial burden of disease. Here, we used data from 2 studies conducted in the same community in the Philippines, 39 years apart (in 1973 and 2012), to estimate the historical incidence of CHIKV infection over a 60-year period [6, 8]. We also analyzed the spatial dependence among incident infections between 2012 and 2013.
METHODS
Study Area
Data for this study come from 2 seroprevalence studies conducted in Cebu City, Philippines (2010 population, 870 000) [9]. Cebu City is a large urban center located on the island of Cebu, sandwiched between hills in the center of the island and the sea (Figure 1A).
Figure 1.
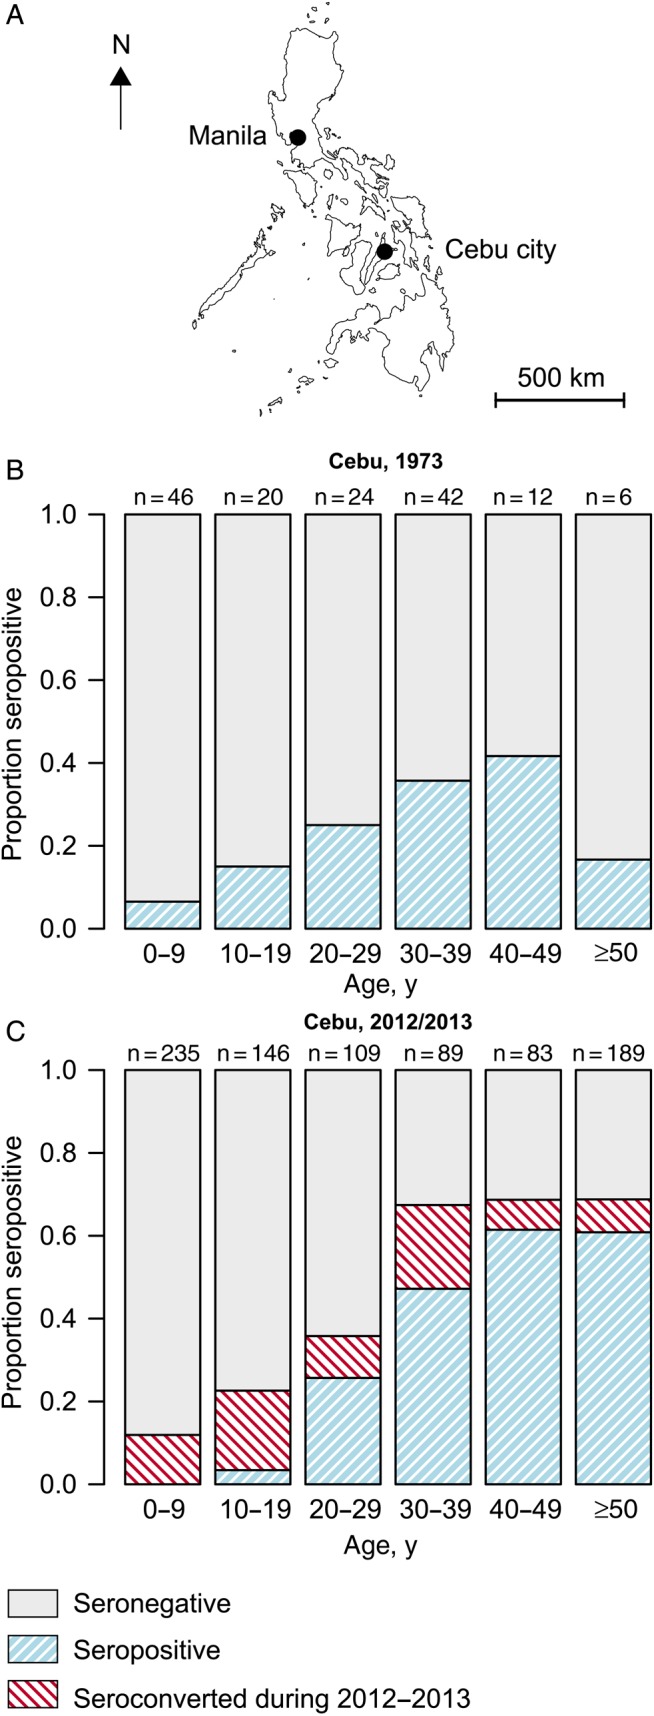
A, Map of the Philippines, showing the location of Manila and Cebu. B, Age and serostatus of participants in the 1973 study in Cebu. C, Age and serostatus of participants in the 2012 study. Also included is the proportion of individuals who seroconverted during 2012–2013.
1973 Study
In 1973, Tesh et al performed neutralization assays, using up to 5 different arboviruses, including CHIKV, on human samples from locations throughout Southeast Asia [8]. In Cebu city, the samples came from a cross-sectional study conducted among the general population during parasitological surveys. Both the number tested and the number positive were available in 10-year age groups (0–9, 10–19, 20–29, 30–39, 40–49, 50–59, and ≥60 years; Figure 1B).
2012–2013 Study
Starting in 2012, we conducted a prospective fever cohort study in Cebu City. Between March and May 2012, randomly sampled individuals ≥6 months of age were enrolled into the study [6]. Blood specimens were collected at enrollment (baseline) and 1 year after enrollment. Participants were actively followed for febrile illnesses. Reverse-transcription polymerase chain reaction analysis was used to identify symptomatic CHIKV infections in febrile individuals. PRNTs were used to identify the presence of CHIKV-specific neutralizing antibodies at baseline and after 1 year (Figure 1C). Detectable PRNT50 titers (defined as a titer ≥10 causing 50% reduction in the number of CHIKV plaques) were considered to signify past CHIKV infection. Further details on the cohort study are provided by Yoon et al [6].
Reconstruction of the Annual Probability of Infection
For immunizing infections such as those due to CHIKV, age-stratified serological surveys can be used to infer the history of circulation in the community [10]. In such situations, the age of individuals is an indicator of the cumulative time of potential infection risk. Assuming that the risk of infection is age independent, we used a likelihood framework to estimate the annual probability of infection in the population (ie, the proportion of the susceptible population infected per year) for each year between 1952 and 2012. A similar approach has been used to characterize the transmission of measles virus, dengue virus, and other pathogens [10–12]. We could not reliably estimate the annual probability of infection before 1952, as there were insufficient individuals in our data set who were alive at the time. Therefore, we assumed a constant probability of infection between 1932 and 1952 and that all individuals were susceptible before 1932. Each individual contributed to estimates of the probability of infection for the years between their birth and the serosurvey. We fit the model in a Bayesian Markov chain Monte Carlo framework, using the RStan package in R [13]. Further details of the model can be found in the Supplementary Materials (Text 1).
We compared a model with different annual probabilities of infection (ie, outbreaks lasting 1 year) to models where outbreaks lasted for 2, 3, 4, and 5 years and where the hazard of infection over the entire analyzed period was constant. We defined an outbreak as an event in which at least 1% of the susceptible population was infected over the outbreak period. The total number of outbreaks per model iteration was therefore the total number of periods with an estimated probability of infection of >1%. The deviance information criterion (DIC) was used to compare model fit. DIC differences of <3 as compared to the best model were considered good support for that model, whereas DIC differences of >5 were considered weak support [14].
Susceptible Population Reconstruction
The level of CHIKV circulation within any year may depend on the immunity in the population, which in turn depends on the history of infection and the age structure of the population. For each model iteration, we reconstructed the population-level immunity to chikungunya across the study period. For each year from 1932, we used the model estimates of the annual probability of infection to calculate the proportion of individuals in each 5-year age group who had ever been infected. We then used the proportion of individuals within 5-year age groups from historical census estimates to calculate the overall proportion of the population that was susceptible to infection each year. Age-specific population census estimates for the Philippines were available in 1939, 1948, 1960, 1970, 1975, 1980, 1990, 1995, 2000, 2007, and 2010 from the Philippine National Census Office. In addition, population projections were available for 2015. We assumed the population structure was unchanged in the years before the first census. Linear interpolation was used to estimate the population within each age group for years between census years.
Sensitivity Analysis
We could not reliably estimate annual infection probabilities prior to 1952. To explore the sensitivity to our model to our assumption of a constant force of infection in the 20 years prior to 1952, we repeated the analysis after assuming (1) complete susceptibility of the population in 1952 (ie, 0% probability of infection prior to 1952) and (2) a nonconstant force of infection between 1932 and 1952, when a different probability of infection was estimated for each year in that period.
Spatial Dependence
To explore the spatial characteristics of CHIKV transmission, we used the τ(d) clustering statistic to assess whether spatial dependence existed between individuals who seroconverted during 2012–2013 [15]. The τ(d) statistic estimates the relative risk of 2 individuals who seroconverted during the year being within distance d of each other relative to the probability of any 2 individuals in the study being that distance apart. τ(d) values of >1.0 suggest clustering of individuals at distance d. Ninety-five percent confidence intervals (CIs) were generated through 500 bootstrap simulations. The estimator used for τ(d) can be found in the Supplementary Materials (Text 2).
All analyses were conducted in the R programming language [16].
Ethical Approval
Approval for the study was obtained from institutional review boards at the Vicente Sotto Memorial Medical Center in Cebu City and the Walter Reed Army Institute of Research. Informed consent was obtained from all study participants. Researchers from the Johns Hopkins Bloomberg School of Public Health did not have access to personally identifiable data and so did not engage in human subjects research.
RESULTS
The 1973 study had 150 individuals with both seroprevalence results and age-group data available. Thirty-three (22%) of these individuals were seropositive for CHIKV, although this ranged from 6% for those aged <10 years to 42% for those aged 40–49 years (Figure 1) [8]. The 2012 study had 853 participants with baseline neutralizing antibody titers available [6]. Two individuals with detectable titers at baseline but no detectable titers after 1 year were excluded from the analysis, as we could not confidently determine their true historical infection status. In total, 241 (28%) had PRNT titers at baseline indicating a history of CHIKV infection. Strikingly, no one aged <14 years (out of 294 cohort participants in that age group) had detectable titers, suggesting negligible circulation of the virus during the 14 years prior to 2012.
The results from these 2 studies were combined to estimate the annual probability of infection between 1952 and 2012. Model realizations consisted of small numbers of outbreaks spread over the evaluated period (Figure 2). We estimated a mean of 3.1 outbreaks (95% CI, 3.0–4.0 outbreaks) over the 60 years, with a mean probability of infection among the susceptible population of 23% per outbreak (95% CI, 16%–37%). The timing and size of the outbreaks were remarkably consistent across model iterations. Fifty-five percent of model iterations had an outbreak in 1968 or 1969, with a mean probability of infection among the susceptible population of 18% (95% CI, 10%–26%) during the outbreak. One hundred percent of model iterations identified an outbreak in 1986, with a mean probability of infection of 37% (95% CI, 26%–47%). Finally, 72% of model iterations identified an outbreak in 1993, with a mean probability of infection of 14% (95% CI, 6%–23%). In addition, we have previously reported that 106 study participants (12%) seroconverted during the 2012–2013 study, resulting in an estimated probability of infection among the susceptible population of 17% for that period [6]. We found that the proportion of the population that remained susceptible never dropped below 50% after any of the outbreaks. On average, outbreaks in periods outside those described above were only supported by 1.1% of model iterations. We also estimated that 3.2% of the population in 1952 had previously been infected, suggesting there may have been CHIKV present prior to this time. However, there were insufficient individuals alive during these years to estimate the timing and size of any outbreaks during this period.
Figure 2.

A, Model estimates of the annual probability of infection and the proportion of the population susceptible between 1952 and 2012. The gray lines represent 1000 randomly chosen model realizations. The dashed line and the dotted line represent the annual probability of infection and the susceptible population, respectively, for the same single-model realization. The other 2 panels show the observed and model estimates of the number of seropositive individuals, by age group, for the 1973 (B) and 2012 (C) studies.
Outbreaks lasting 2 or 3 years were only slightly less supported by the data than single-year outbreaks (Table 1). Both the mean number of outbreaks between 1952 and 2012 and the mean probability of infection in each outbreak were the same in all 3 of these models (Figure 3). Models with outbreaks lasting 4 or 5 years or where there was a constant annual probability of infection over the entire evaluated period fit the data much worse.
Table 1.
Deviance Information Criteria (DIC) for Models Estimating the Probability of Infection Between 1952 and 2012
| Model | DIC |
|---|---|
| Model 1: annual hazard of infection | 808 |
| Model 2: hazard of infection fixed for 2-year periods | 812 |
| Model 3: hazard of infection fixed for 3-year periods | 810 |
| Model 4: hazard of infection fixed for 4-year periods | 818 |
| Model 5: hazard of infection fixed for 5-year periods | 820 |
| Model 6: constant hazard of infection over entire time series | 1095 |
Models differed in how many hazards of infection were estimated, ranging from a different hazard estimated for each year (model 1) to a single hazard measured for the entire time series (model 6).
Figure 3.
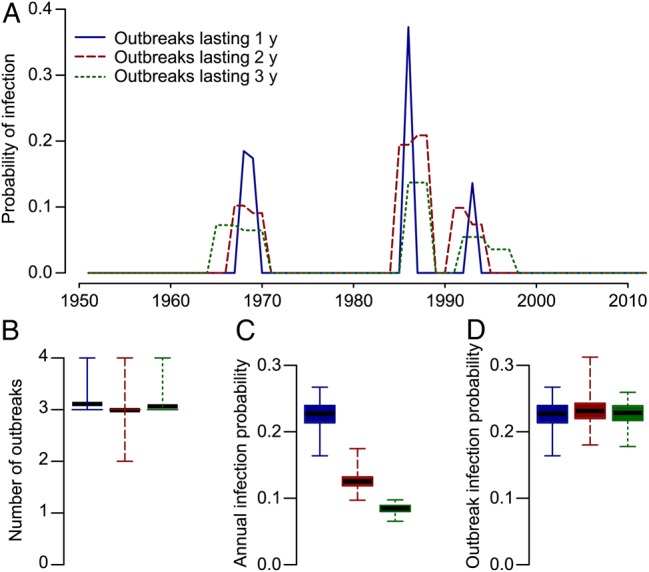
Models that incorporate a different probability of infection every year (solid), every 2 years (dashed), and every 3 years (dotted) are approximately equally supported by the data. However, within these models, those that had longer-lasting outbreaks also had lower annual probabilities of infection, so the total probability of infection over the entire outbreak remained unchanged. A, Mean probability of infection during outbreaks for the 3 models. Only years when at least 10% of iterations had an outbreak in that year are shown. B, Mean total number of outbreaks. C, Mean annual infection probability in an outbreak in the 3 model formulations. D, Mean total probability of infection during an outbreak.
Outbreaks of chikungunya have been detected in Southeast Asia since the 18th century [2], although whether they made it to the Philippines is unclear. We could not reliably estimate annual infection probabilities prior to the 1950s, as there were insufficient individuals in our data set who were alive at the time. Nevertheless, our model results were robust to different assumptions about incidence prior to 1952 (Supplementary Figure 1).
Individuals who seroconverted during 2012–2013 were 2.2 times (95% CI, 1.5–3.1 times) more likely to live within 50 m of each other relative to the probability of any 2 study participants living within 50 m of each other (Figure 4). This fell to 1.7 times (95% CI, 1.2–2.3 times) for those living within 100 m of each other. Significant spatial dependence was observed at distances of up to 230 m. These findings demonstrate significant spatial structure to where infections occurred during the year, which suggests outbreaks were driven by small-scale focal transmission.
Figure 4.

Spatial dependence among individuals who seroconverted during 2012–2013. The figure shows the results of τ(d) and represents the probability that 2 individuals who seroconverted during 2012–2013 lived within distance d of each other relative to the probability that any 2 individuals in the study lived that distance apart.
DISCUSSION
We have used 2 seroprevalence studies to reconstruct 60 years of chikungunya epidemiology in Cebu city. Understanding the burden of CHIKV infection in this setting has not previously been possible, as local surveillance systems have not been equipped to reliably capture cases, which can be easily misdiagnosed as other febrile infections, especially since appropriate diagnostic assays are often unavailable. Such gaps are neither restricted to the Philippines nor to CHIKV, and the approaches used could be applied elsewhere. Our study has demonstrated that CHIKV transmission in this setting was characterized by episodic outbreaks followed by years of absence of the virus with less than half the population immune to the virus at any time. In addition, individuals in a prospective cohort study who seroconverted during 2012–2013 tended to live much closer to each other than the study population in general, supporting focal transmission of the virus.
The outbreak years identified in our model were consistent with historical reports of chikungunya cases in Cebu or in other parts of the Philippines. In particular, our model identified an outbreak in 1986, the same year that a US Peace Corps volunteer stationed in Cebu received a diagnosis of CHIKV infection [17]. We estimated that nearly 40% of susceptible individuals were infected during this outbreak. The population of Cebu City at the time was around 600 000 individuals, of whom we estimate that 125 000 were immune, owing to previous outbreaks. The size of the 1986 outbreak therefore translates to approximately 190 000 infections. It is surprising that the only historical record of this outbreak was in a foreign visitor. We also identified an outbreak in 1968–1969 with an estimated size equivalent to 135 000 infections in Cebu City, coinciding with a historical outbreak investigation in 1968 that reported hospitalized chikungunya cases in Negros, an island next to Cebu but with no cases reported in Cebu itself [18]. Finally, we identified an outbreak in 1993 with an estimated size equivalent to 32 000 infections in Cebu City. Although there were no reports of chikungunya in Cebu during that time, an outbreak was reported by a field epidemiology training program officer on Cavite in northern Philippines in 1996, suggesting that the virus was circulating in the country around that period [18, 19]. Aside from the reports mentioned above, we found no additional historical reports of chikungunya cases in the Philippines over the study period.
While limited surveillance capabilities likely contributed to the apparently large number of unreported infections during past outbreaks, there may also have been substantial levels of subclinical or only mildly symptomatic infections. Macasaet et al reported a high proportion of mildly symptomatic patients in the 1968 outbreak, and this was also observed in the prospective cohort study in Cebu city in 2012–2013 [6, 18, 20]. The reason that this population may have had lower proportions of symptomatic disease than reported in other studies is unclear [21, 22]. Viral factors may play a role including genotype- and strain-specific effects. It appears likely that CHIKV lineages circulating in this region throughout the study period were conserved Asian genotype strains [3, 23]. Animal models have suggested increased symptomatic disease in Indian Ocean strains as compared to Asian strains [24, 25]. An alternative explanation could be cross-protection generated from prior infection by other alphaviruses. Tesh et al did not find any evidence of historic Sindbis or Ross River virus infection in the 1973 study. However, a 1953 serostudy in the Manila area found 15% seropositivity to another alphavirus, Semliki Forest virus [8, 26]. Other viruses may also exist. The role of human genetic factors may also require further investigation.
We found that CHIKV transmission was episodic in nature and followed by long absences, as evidenced by the small number of years for which we estimated nonzero probabilities of infection. These patterns are consistent with reemergence driven by reintroduction of virus, rather than with continuous low levels of undetected human infection. Sources of viral introduction are unclear but could be other communities in Southeast Asia. Mainland settings with different travel patterns than that in the island communities of Philippines may observe more regular introductions. Alternatively, nonprimate populations in the Philippines have been found with antibodies against CHIKV and may act as a source [27], although other nonhuman primate populations in nearby Borneo were not found to have been exposed [28]. Comparisons of sequences obtained from humans and primates could help us understand whether a sylvatic cycle is important here. We found that over half the population remained susceptible at any time point. Climatic or other environmental factors may also have been important contributors to CHIKV extinctions. No symptomatic cases were detected in the prospective cohort study during the drier months of January to May 2013 despite continued active surveillance, suggesting that the virus was not in widespread circulation during periods with low precipitation and limited mosquito activity. In other settings with different environmental conditions, different temporal patterns of virus circulation may be present. In particular, there remains an ongoing chikungunya epidemic in the Caribbean and the Americas due to a virus closely linked to one from the Philippines [5, 6]. For settings that are comparable to Cebu city, our findings suggest that epidemics in individual communities will not lead to sustained endemic transmission. However, without a better understanding of the key factors underlying the introduction and maintenance of the virus, there remains much uncertainty about the future course of the outbreak.
It is tempting to use the estimates of the size of the outbreaks to obtain estimates of the basic reproduction number for CHIKV. The basic reproduction number, which represents the number of infections caused by a single infectious individual in a completely susceptible population, is sought after as it provides insight into the transmissibility of the pathogen and is linked to vaccine coverage required to control spread (if a vaccine were to become widely available). However, epidemic-final-size approaches assume that epidemics cease solely because of depletion of susceptible individuals and, in this circumstance, may therefore underestimate the true basic reproduction number. Such an approach yields estimates of 1.1–1.3 across the 4 outbreaks, lower than previously reported values from other settings (values of up to 6.5 have been proposed; Supplementary Text 3) [5, 29].
We found that seroconversions in 2012–2013 were spatially correlated at distances of <230 m, consistent with transmission events centering in or near the home. Similar approaches with dengue have shown that dengue cases in both urban and rural environments in Thailand cluster at greater distances (up to 1 km) [15, 30]. However, dengue virus is in endemic circulation in these locations, and sustained transmission can lead to much larger footprints of spatial dependence than in isolated outbreaks. These findings suggest that targeted effective interventions at the neighborhood scale could potentially reduce CHIKV infection risk.
Our models could not discriminate between outbreaks lasting 1, 2, or 3 years. However, outbreaks lasting for >3 years were not supported by our data. Estimates of the total size of outbreaks remained unchanged. In the 1973 study, ages were only available in 10-year age groups, reducing the precision with which we could estimate the probability of infection during the 1950s and 1960s. Differences in risk of infection by age may have influenced our estimates. However, we did not observe any large-scale differences in risk, stratified by age, for those who seroconverted in 2012–2013, suggesting any differences were likely to be minor (Supplementary Figure 2). The long-term trajectories of antibody levels following infection remain poorly understood, although high titers have been recorded 19 years after a recorded outbreak [31]. If antibodies become undetectable after long periods, this would limit our ability to identify outbreaks in the distant past. However, where detected, neutralization titers were generally high (median PRNT50 of 841), and we observed no statistical difference in titer stratified by age (Supplementary Figure 3). In addition, we did not identify any symptomatic infections in individuals with detectable PRNT50 titers at baseline during active follow-up in 2012–2013, irrespective of how low titers were. Taken together, these observations suggest that any waning was minimal and that there was unlikely to be any loss of immune protection after infection.
CHIKV transmission appears to be episodic and focal in this setting, with over half of the population in Cebu City remaining susceptible to infection throughout the study period. This study highlights the usefulness of age-specific seroprevalence studies in efforts to understand the long-term epidemiology of pathogens such as CHIKV, especially in settings where surveillance systems may not be able to reliably capture cases. Incorporating systematic serological investigations into health systems could allow improved disease surveillance.
Supplementary Data
Supplementary materials are available at http://jid.oxfordjournals.org. Consisting of data provided by the author to benefit the reader, the posted materials are not copyedited and are the sole responsibility of the author, so questions or comments should be addressed to the author.
Notes
Disclaimer. The opinions or assertions in this article are the private views of the authors and do not necessarily reflect the official policy or position of the US Department of the Army, the US Department of Defense, or the US government. The funding sources had no role in the preparation of this manuscript or in the decision to publish this study.
Financial support. This work was supported by the National Institutes of Health (grant R01 AI102939-01A1) and the Armed Forces Health Surveillance Center–Global Emerging Infections Surveillance and Response System (grant P0149 14 AF).
Potential conflicts of interest. All authors: No reported conflicts. All authors have submitted the ICMJE Form for Disclosure of Potential Conflicts of Interest. Conflicts that the editors consider relevant to the content of the manuscript have been disclosed.
References
- 1.Weaver SC, Lecuit M. Chikungunya virus and the global spread of a mosquito-borne disease. N Engl J Med 2015; 372:1231–9. [DOI] [PubMed] [Google Scholar]
- 2.Halstead SB. Reappearance of chikungunya, formerly called dengue, in the Americas. Emerg Infect Dis 2015; 21:557–61. [DOI] [PMC free article] [PubMed] [Google Scholar]
- 3.Weaver SC. Arrival of chikungunya virus in the new world: prospects for spread and impact on public health. PLoS Negl Trop Dis 2014; 8:e2921. [DOI] [PMC free article] [PubMed] [Google Scholar]
- 4.Cauchemez S, Ledrans M, Poletto C, Quenel P. Local and regional spread of chikungunya fever in the Americas. Euro Surveill 2014; 19:1–9. [DOI] [PMC free article] [PubMed] [Google Scholar]
- 5.Perkins TA, Metcalf CJE, Grenfell BT, Tatem AJ. Estimating drivers of autochthonous transmission of chikungunya virus in its invasion of the Americas. PLoS Curr 2015; 7. [DOI] [PMC free article] [PubMed] [Google Scholar]
- 6.Yoon I-K, Alera MT, Lago CB et al. High rate of subclinical chikungunya virus infection and association of neutralizing antibody with protection in a prospective cohort in the Philippines. PLoS Negl Trop Dis 2015; 9:e0003764. [DOI] [PMC free article] [PubMed] [Google Scholar]
- 7.Carey DE. Chikungunya and dengue: a case of mistaken identity? J Hist Med Allied Sci 1971; 26:243–62. [DOI] [PubMed] [Google Scholar]
- 8.Tesh RB, Gajdusek DC, Garruto RM, Cross JH, Rosen L. The distribution and prevalence of group A arbovirus neutralizing antibodies among human populations in Southeast Asia and the Pacific islands. Am J Trop Med Hyg 1975; 24:664–75. [DOI] [PubMed] [Google Scholar]
- 9.2010 Philippines National Census report.
- 10.Grenfell BT, Anderson RM. The estimation of age-related rates of infection from case notifications and serological data. J Hyg (Lond) 1985; 95:419–36. [DOI] [PMC free article] [PubMed] [Google Scholar]
- 11.Ferguson NM, Donnelly CA, Anderson RM. Transmission dynamics and epidemiology of dengue: insights from age-stratified sero-prevalence surveys. Philos Trans R Soc Lond B Biol Sci 1999; 354:757–68. [DOI] [PMC free article] [PubMed] [Google Scholar]
- 12.Egger JR, Ooi EE, Kelly DW, Woolhouse ME, Davies CR, Coleman PG. Reconstructing historical changes in the force of infection of dengue fever in Singapore: implications for surveillance and control. Bull World Health Organ 2008; 86:187–96. [DOI] [PMC free article] [PubMed] [Google Scholar]
- 13.Stan Development Team. RStan: the R interface to Stan, version 2.5. 2014.
- 14.Spiegelhalter DJ, Best NG, Carlin BP, van der Linde A. Bayesian measures of model complexity and fit. J R Stat Soc Series B Stat Methodol 2001; 64:583–639. [Google Scholar]
- 15.Salje H, Lessler J, Endy TP et al. Revealing the microscale spatial signature of dengue transmission and immunity in an urban population. Proc Natl Acad Sci U S A 2012; 109:9535–8. [DOI] [PMC free article] [PubMed] [Google Scholar]
- 16.R Core Team. R: A language and environment for statistical computing. Vienna, Austria: R Foundation for Statistical Computing, 2015. [Google Scholar]
- 17.Hayes C, O'Rourke T. Chikungunya fever among US peace corps volunteers-republic of the Philippines. MMWR Morb Mortal Wkly Rep 1986; 35:573–4. [PubMed] [Google Scholar]
- 18.Macasaet FF. Further observations on chikungunya fever. J Philipp Islands Med Assoc 1970; 46:235–42. [Google Scholar]
- 19.Retuya TJ, Ting DL, Dacula BD et al. Chikungunya fever outbreak in an agricultural village in Indang, Cavite, Philippines. Philipp J Microbiol Infect Dis 1998; 27:1. [Google Scholar]
- 20.Macasaet FF, Rustia FS, Buscato NS, Nakao JC, Beran GW. Epidemiology of arbovirus infections in Negros Oriental, I. Clinical features of an epidemic in Amlan. J Philipp Med Assoc 1969; 45:207–15. [Google Scholar]
- 21.Moro ML, Gagliotti C, Silvi G et al. Chikungunya virus in North-Eastern Italy: a seroprevalence survey. Am J Trop Med Hyg 2010; 82:508–11. [DOI] [PMC free article] [PubMed] [Google Scholar]
- 22.Sissoko D, Moendandze A, Malvy D et al. Seroprevalence and risk factors of chikungunya virus infection in Mayotte, Indian Ocean, 2005–2006: a population-based survey. PLoS One 2007; 3:e3066. [DOI] [PMC free article] [PubMed] [Google Scholar]
- 23.Lanciotti RS, Valadere AM. Transcontinental movement of Asian genotype chikungunya virus. Emerg Infect Dis 2014; 20:1400–2. [DOI] [PMC free article] [PubMed] [Google Scholar]
- 24.Teo T-H, Her Z, Tan JJL et al. Caribbean and la réunion chikungunya virus isolates differ in their capacity to induce proinflammatory Th1 and NK cell responses and acute joint pathology. J Virol 2015; 89:7955–69. [DOI] [PMC free article] [PubMed] [Google Scholar]
- 25.Gardner J, Anraku I, Le TT et al. Chikungunya virus arthritis in adult wild-type mice. J Virol 2010; 84:8021–32. [DOI] [PMC free article] [PubMed] [Google Scholar]
- 26.Hammon WM, Schrack WD, Sather GE. Serological survey for a arthropod-borne virus infections in the Philippines. Am J Trop Med Hyg 1958; 7:323–8. [DOI] [PubMed] [Google Scholar]
- 27.Inoue S, Morita K, Matias RR et al. Distribution of three arbovirus antibodies among monkeys (Macaca fascicularis) in the Philippines. J Med Primatol 2003; 32:89–94. [DOI] [PubMed] [Google Scholar]
- 28.Wolfe ND, Kilbourn AM, Karesh WB et al. Sylvatic transmission of arboviruses among Bornean orangutans. Am J Trop Med Hyg 2001; 64:310–6. [DOI] [PubMed] [Google Scholar]
- 29.Robinson M, Conan A, Duong V et al. A model for a chikungunya outbreak in a rural Cambodian setting: implications for disease control in uninfected areas. PLoS Negl Trop Dis 2014; 8:e3120. [DOI] [PMC free article] [PubMed] [Google Scholar]
- 30.Bhoomiboonchoo P, Gibbons RV, Huang A et al. The spatial dynamics of dengue virus in Kamphaeng Phet, Thailand. PLoS Negl Trop Dis 2014; 8:e3138. [DOI] [PMC free article] [PubMed] [Google Scholar]
- 31.Nitatpattana N, Kanjanopas K, Yoksan S et al. Long-term persistence of Chikungunya virus neutralizing antibodies in human populations of North Eastern Thailand. Virol J 2013; 11:183. [DOI] [PMC free article] [PubMed] [Google Scholar]
Associated Data
This section collects any data citations, data availability statements, or supplementary materials included in this article.