Abstract
We present a dielectric model and its parameters for Chinese hamster ovary (CHO) cells based on a double-shell structure which includes the cell membrane, cytoplasm, nuclear envelope, and nucleoplasm. Employing a dielectrophoresis (DEP) based technique and a microfluidic system, the DEP response of many single CHO cells is measured and the spectrum of the Clausius-Mossotti factor is obtained. The dielectric parameters of the model are then extracted by curve-fitting to the measured spectral data. Using this approach over the 0.6–10 MHz frequency range, we report the values for CHO cells' membrane permittivity, membrane thickness, cytoplasm conductivity, nuclear envelope permittivity, and nucleoplasm conductivity. The size of the cell and its nuclei are obtained using optical techniques.
I. INTRODUCTION
Dielectric study of biological phenomena has become an important subject in biophysics due to its attractive properties such as being label-free, non-invasive, and integratable with microfluidic systems (enabling smaller sample size). Many researchers have studied the dielectric properties of different cell types and their changes due to internal or external stimuli. Dielectric based techniques have been employed to detect and separate cells' different states (e.g., viable or non-viable, healthy or cancerous) and investigate their response to drug treatments.1–15 Yeast and human blood cells are among the most widely dielectrically studied cell types, and appropriate electrical models have been developed for them.16–21
Chinese hamster ovary (CHO) cells have widespread biopharmaceutical and biomedical applications. Adaptability and ease of genetic manipulation have made CHO cells the industries' primary mammalian host for commercial production of therapeutic protein.22 CHO cells have been used in numerous biological and biomedical research studies such as cell cycle, toxicology, cancer biology, and DNA damage and repair studies.23–26 Despite the extensive applications of CHO cells, their dielectric properties are not well established. In studies where an electrical model of CHO cells is required, a model with its parameters taken from other mammalian cell lines or yeast is often adopted.27–30 With growing interest in dielectrically probing the metabolic status of CHO cells in biopharmaceutical reactors31,32 or employing CHO cells in dielectric study of biological phenomena, a complete model of CHO which includes the cell and its internal organelles and their dielectric parameters is essential to make accurate conclusions and predictions. In this work, we employ a double-shell dielectric model and present the dielectric parameters for the membrane, cytoplasm, nuclear envelope, and nucleoplasm as measured using a dielectrophoresis technique.
Impedance spectroscopy and AC electrokinetic techniques are the two main label-free dielectric study methods. Both are based on the polarization of cells in an applied electric field. In impedance spectroscopy, the frequency dependent electrical properties of a cell suspension are measured and the cells' dielectric parameters are extracted using theoretical models to remove the effect of the suspension medium.33,34 This technique has been implemented in both time-domain and frequency-domain to obtain the dielectric parameters of a population of normal and malignant white blood cells,5,20,35 electroporated and non-electroporated Jurkat cells,36,37 and mouse lymphocytes and erythrocytes,38 for example. In AC electrokinetic techniques, the frequency dependent motion of cells induced by electrorotation or dielectrophoresis (DEP) is measured. Theoretical or numerical analysis is then employed to relate the motion to the cells' dielectric parameters. Electrorotation and dielectrophoresis have been employed to study the dielectric properties of drug-treated and non-drug-treated Friend murine erythroleukemia cells,39,40 apoptotic human leukemia cells,10 and multidrug resistant human leukemia cells.41 AC electrokinetic techniques can measure the response of single cells. This allows measurement of individual cells without the influence of neighboring cells and aggregation effects.
In this paper, we employ a DEP cytometry technique to determine the dielectric properties of CHO cells based on a double-shell model. Using a microfluidic device that consists of a microfluidic channel with embedded actuating and sensing electrodes, the DEP induced translation of many individual CHO cells are measured as they flow through the channel. Cells are suspended in media with different conductivities and their response is measured over the frequency range 0.6–10 MHz. Performing numerical simulations and curve-fitting to measured data, we obtain the membrane permittivity, cytoplasm conductivity, nuclear envelope permittivity, nucleoplasm conductivity, and plasma membrane thickness of CHO cells. We report the values of the double-shell model parameters for CHO cells and compare them with three other mammalian cells. The results reported here can help the ongoing research on the dielectric study of CHO cells for biomedical and biopharmaceutical applications.
II. MATERIALS AND METHODS
We use a double-shell model for CHO cells and determine its parameters using a dielectrophoresis based technique. The approach we take is to obtain the complex permittivity of cells, , from the DEP response of many single cells over a specified frequency range. This is done by relating the DEP induced displacement of cells to by hydrodynamic simulations. is a function of the dielectric properties of the cell internal structure, and the double-shell model parameters are extracted by curve-fitting to the measured data.
A. Dielectrophoresis
DEP is the induced motion of a polarizable particle in a non-uniform electric field. The magnitude and direction of the DEP force depends on the effective polarizability of the particle with respect to its surrounding media. For biological cells, this depends on the structure and electrical properties of its constituent components. Under the assumption of a spherical cell, the time-averaged DEP force exerted on the cell is given by42
| (1) |
where is the medium permittivity, is the cell volume, and is the rms value of the electric field at the center of the cell. is the real part of the Clausius-Mossotti factor given by
| (2) |
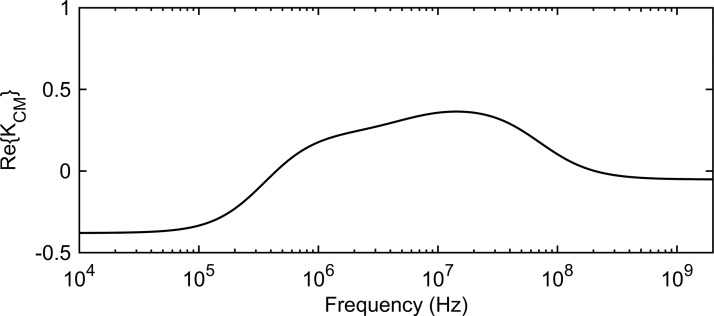
In the above equation, and are the complex permittivity of the medium and the cell, respectively, defined as , with being the frequency of the electric field. The conductivity term is assumed to incorporate conduction current as well as dielectric dispersion losses. is an effective value incorporating the electrical properties of the cell's complex internal structure. The DEP force is frequency dependent through and is directed with (pDEP) or against (nDEP) the gradient of the square of the electric field depending on the sign of . An example of the frequency dependent behavior of for a eukaryotic cell suspended in an aqueous medium with conductivity is presented in Fig. 1. The dielectric and geometric parameters of the cell are typical values measured for mammalian cells.43
FIG. 1.
as a function of frequency for a typical eukaryotic cell (parameters from literature43) in an aqueous medium with conductivity .
B. Measurement of the DEP force acting on a cell
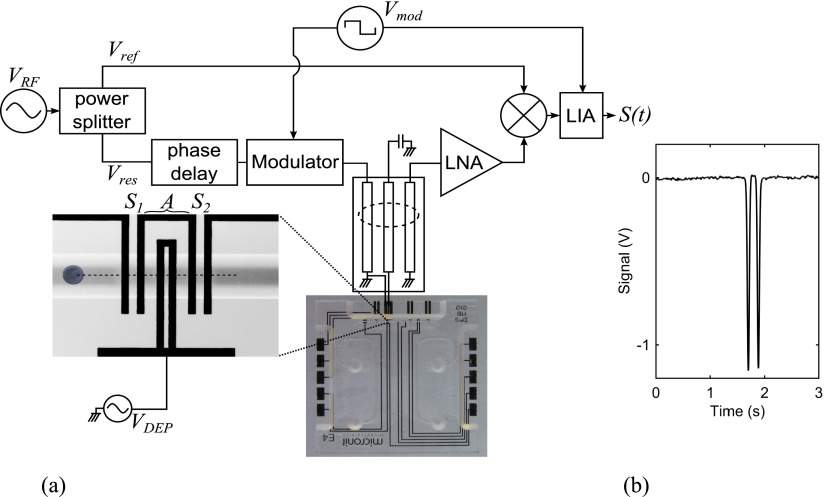
In order to actuate individual cells by a DEP force, a microfluidic system with embedded actuating and sensing electrodes at the bottom of the microfluidic channel is employed, as shown in the inset of Fig. 2. As a cell passes in the microfluidic channel, it experiences a DEP force generated by a set of actuating electrodes, A in the inset of Fig. 2. Two sets of sensing electrodes, S1 and S2 in the inset of Fig. 2, on each side of the DEP actuating electrode are used to measure the altitude of a cell in the channel before and after the DEP actuation. The altitude of the cell is determined by measuring the impedance change of the sensing electrodes at microwave frequencies due to the cell. The impedance change is capacitance dominated and is given by44
| (3) |
where is the voltage applied to the sensing electrodes and is the amplitude of the microwave electric field at the location of the cell. Since the sensing electric field generated by coplanar electrodes decreases with distance from them the capacitance change due to a cell depends on the altitude of the cell in the microfluidic channel. The higher the cell in the channel the lower the field intensity and the smaller the electrode's capacitance change. A microwave interferometer, as shown in the block diagram in Fig. 2, is used to measure the small capacitance change of the sensing electrodes. The microwave interferometer has been discussed in detail elsewhere.45,46 Changes in the capacitance of S1 or S2 due to a cell produce a change in the insertion phase of the resonator in the interferometer sensing path. This causes a small phase difference between the sensing and reference paths, Vres and Vref, which is extracted by combining the sensing and reference signals using a mixer. The mixer output is detected using a lock-in-amplifier (LIA) to improve the signal-to-noise ratio of the final output signal, S(t), which is proportional to the time-dependent capacitance change . With no particle in the channel, the phase difference between the sensing and reference paths is set to 90° to null the output. As a cell passes over the sensing electrodes, a signal is registered with its amplitude proportional to the capacitance change of electrodes (Eq. (3)). A typical signal obtained for a CHO cell as it passes at an altitude of approximately 16 μm above the sensing electrodes is shown in Fig. 2. It features two peaks corresponding to the maximum field regions of the two sensing electrodes. Sensing of cells is performed with a low amplitude (about 500 mVpp) and high frequency (about 1.5 GHz) signal to avoid microwave DEP actuation of cells and minimize variation due to interfacial dispersion (variation among cells in a culture affects to lesser extent at higher frequencies).
FIG. 2.
(a) Schematic of the microwave interferometer system used to measure the DEP response of a single cell in a microfluidic channel and (b) a typical measured signal for a CHO cell at an altitude of approximately 16 μm above the sensing electrodes. The capacitance change of sensing electrodes due to a typical CHO cell is approximately 30 aF. The interferometer sensitivity is typically less than 0.1 aF.
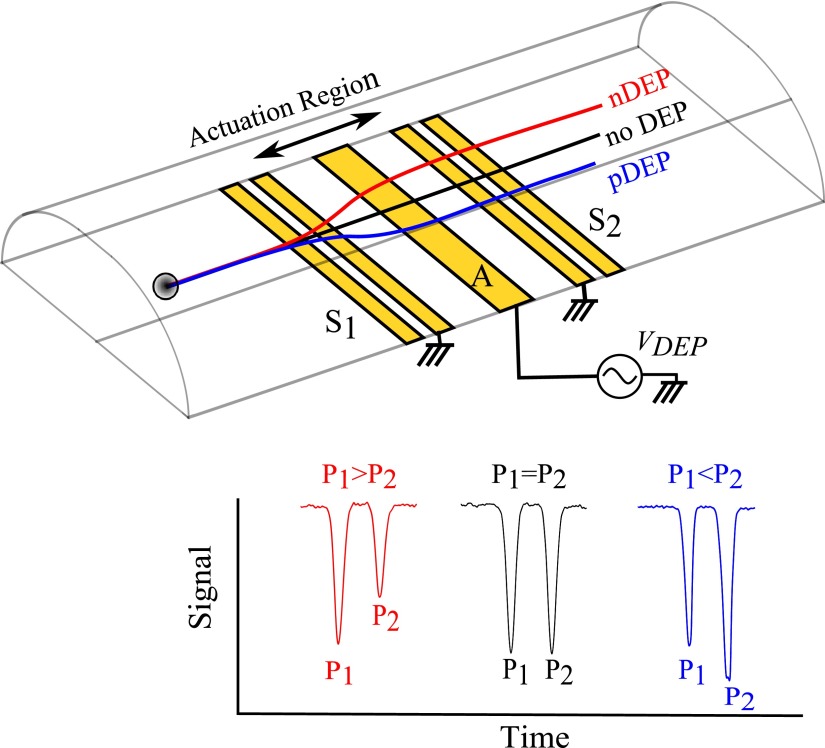
Example trajectories and corresponding signals for cells passing over the device are shown in Fig. 3. The DEP actuation electrode, A, located between S1 and S2 applies a DEP force on a passing cell which causes it to approach S2 at a higher altitude (when experiencing nDEP) or lower altitude (when experiencing pDEP). As a result, the amplitude of the peak P2 registered by S2 differs from the peak P1 registered at S1 depending on the strength and direction of the DEP force applied to the cell (Eq. (1)). We define a parameter, force index, to quantify the change in the electrical signal due to a DEP actuation. The force index is a measure of the DEP force acting on the cell and hence the Clausius-Mossotti factor of the cell in its suspending medium.
FIG. 3.
Schematic of the microfluidic channel with coplanar sensing, S1 and S2, and actuating, A, electrodes. Examples of signals, S(t), recorded for CHO experiencing nDEP (P1 > P2), no DEP (P1 = P2), and pDEP (P1 < P2) actuations are shown underneath.
C. Microfluidic system
Our microfluidic chip was fabricated by Micronit Microfluidics using their Sensonit Glass-Based Microfluidic Technology with Metallization process. The 15 × 15 mm2 chip consists of two layers of borosilicate glass with 1.1 and 0.7 mm thickness as the top and bottom layers. A 20 nm thick Ta adhesion layer and 180 nm thick Au layer are deposited in 200 nm depth etched trenches in the bottom layer to form the electrodes. A 40 μm high and 100 μm wide microfluidic channel is etched in the top layer and heat bonded to the bottom layer. The electrodes are 25 μm wide and extend entirely across the microfluidic channel. The spacing between the sensing pairs and the DEP gaps are 25 μm and 35 μm, respectively. Fluid is pumped through the microfluidic channel via powder-blasted access ports using a Fluigent MFCS-4 C Microfluidic Flow Control System. The throughput of the system is related to the flow velocity and cell suspension concentration. Typical experimental throughput of 30–50 cells per minute is obtained for cell concentration of 2 × 10⁵ cells per milliliter and flow velocity of 1500–2500 μm/s. Substantially higher throughput can be achieved using a larger cell concentration, however, it increases the chance of having more than one cell over the sensing and actuation region.
D. Calculation of Re{KCM}
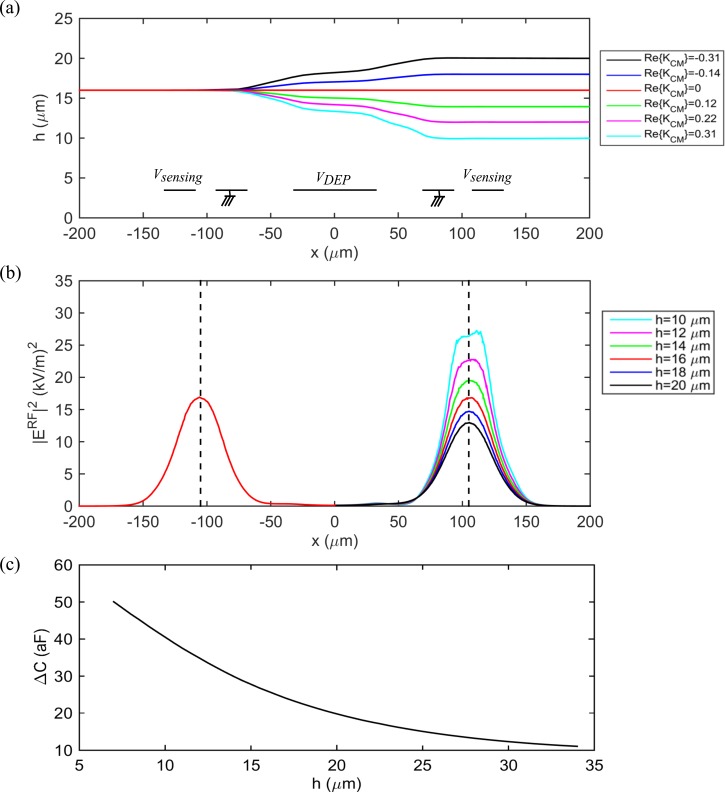
In order to calculate from the measured force indices, fluid dynamics simulation is employed. Here, the movement of a homogenous particle with various dielectric constants (resulting in ranging from −0.4 to +0.4) is simulated using COMSOL Multiphysics 4.3 b Particle Tracking for Fluid Flow and Electric Currents modules. With the particle entering at a given altitude, h1, and subjected to DEP and hydrodynamic forces, we obtain its exit altitude, h2, at the location of the second pair of sensing electrodes, for different values of (Fig. 4(a)). The capacitance change of the two pairs of sensing electrodes due to the particle is then calculated using Eq. (3) with obtained from solving the Laplace equation using COMSOL Multiphysics. Fig. 4(b) shows the profile of for several exit altitudes when VRF = 0.5 Vpp. The capacitance change of the sensing electrodes due to a particle versus the particle's altitude is shown in Fig. 4(c). Since the amplitude of the signals associated with sensing electrodes S1 and S2 are proportional to their capacitance change, the force index corresponding to each is estimated from .
FIG. 4.
(a) Trajectories of a 6 μm radius particle with variable and an entrance altitude 16 μm subjected to DEP and hydrodynamic forces as obtained from COMSOL simulations. The trajectories are used to estimate the altitude of the particle after DEP actuation for different values of ranging from −0.4 to +0.4. (b) Simulation results of the amplitude of the square of the electric field over the sensing electrodes for different exit altitudes. The capacitance change of a pair of sensing electrodes due to a particle is directly proportional to |ERF|2 at its center. (c) Capacitance change of the second sensing electrode pair (after DEP actuation) versus altitude as obtained from Eq. (3). This curve is used to calculate the force index corresponding to different values of .
E. Simulation of DEP and hydrodynamic forces
Fluid flow in a microfluidic channel can be assumed laminar since the Reynolds number is much less than one.47 Given that in our experiments the fluid is viscous and incompressible and there is no fluid acceleration, a Poiseuille flow is established in the microfluidic channel which is characterized by a parabolic velocity profile (zero at walls and maximum at the center of the channel). The fluid velocity at any altitude, h, from the bottom of the channel is given by47
| (4) |
where is the mean flow velocity and H is the height of the channel. The majority of cells flowing in the microfluidic channel sediment and acquire an equilibrium altitude before entering the DEP actuation region. Forces which govern the vertical movement of a cell outside the DEP actuation region are gravity, buoyancy, and hydrodynamic lift force given by48
| (5) |
| (6) |
where = 9.81 m/s2 is the gravitational acceleration, and are densities of the cell and suspension medium, r is the cell radius, is the viscosity of the medium, and h is the distance from the cell centre to the bottom of the channel. Here, C is a coefficient which is obtained experimentally using standard dielectric particles (Section III A). The equilibrium altitude, heq, of a cell is the elevation at which gravity, buoyancy, and lift forces are in balance. We use heq obtained from Eqs. (4)–(6) (with the velocity and size matching the average of our measured data for single cells) as the initial altitude in our simulations. During DEP actuation, the gravity and buoyancy forces are negligible as compared with other forces and the cell movement is mostly impacted by the DEP, drag and hydrodynamic lift forces (in the case that the cell is close to a wall). The DEP and lift force are expressed in Eqs. (1) and (6) and the fluid drag force is given by49
| (7) |
where and are the fluid and particle velocities, respectively, and λ represents the ratio of the force experienced by a particle between two confining walls to the force in an unbounded fluid. λ is a function of the cell altitude in the channel and varies as the cell moves in response to the DEP force. Given the channel geometry, we obtain the altitude dependent λ for our system from the data provided in literature.49
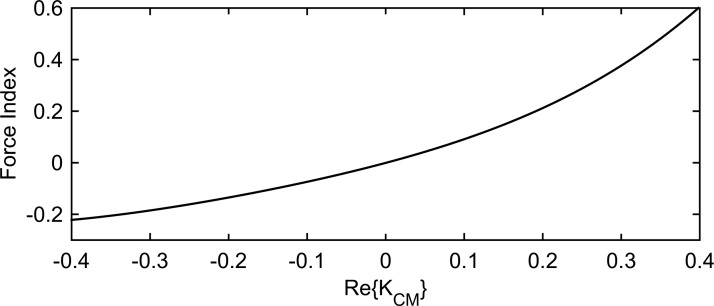
In our simulations, the channel, particle, and medium parameters are set according to our experiments and are listed in Table I. Fig. 5 is an example plot of force index versus for a 6 μm (radius) particle moving with initial velocity 2200 μm/s at an equilibrium altitude heq = 16.5 μm and experiencing a DEP force generated by a sinusoidal voltage of 8 Vpp applied to the actuation electrodes.
TABLE I.
Channel, particle, and medium parameters employed in simulations.
| Parameter | Symbol | Value | Ref. |
|---|---|---|---|
| Channel height | H | 40 μm | |
| Channel width | W | 100 μm | |
| PSS density | 1050 kg/m3 | Datasheet50 | |
| Cell density | 1050 kg/m3 | 51 | |
| PSS radius | r | 5.5 μm | Datasheet50 |
| Cell radius | r | 5.9–6.2 μm | Measured |
| Particle initial velocity | vc0 | 2000–2500 μm/s | Measured |
| Medium density | 1019–1027 kg/m3 | Calculateda | |
| Medium viscosity | η | 0.001 Pa s | 52 |
| Medium conductivity | 0.17–0.5 S/m | Measured | |
| Medium permittivity | 78 | 53 |
Cells are measured in media with different conductivities. The density of each medium is calculated considering its glucose and sucrose content.52
FIG. 5.
Force index versus obtained from simulation for a 6 μm particle moving with an initial velocity 2200 μm/s and an altitude 16.5 in the microfluidic channel subjected to DEP and hydrodynamic forces. The DEP force is generated by applying a 8 Vpp sinusoidal voltage to the actuation electrodes. Channel, particle, and medium parameters are listed in Table I.
F. Extracting cell model parameters from Re {KCM}
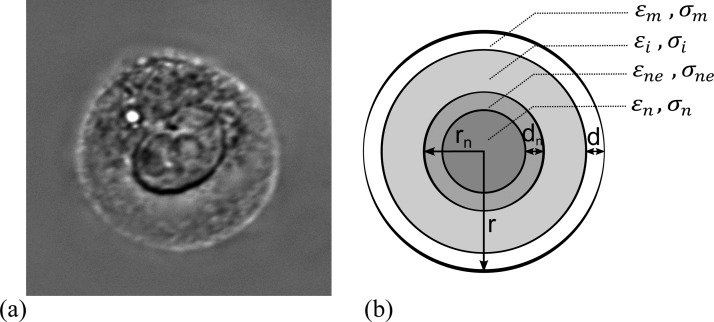
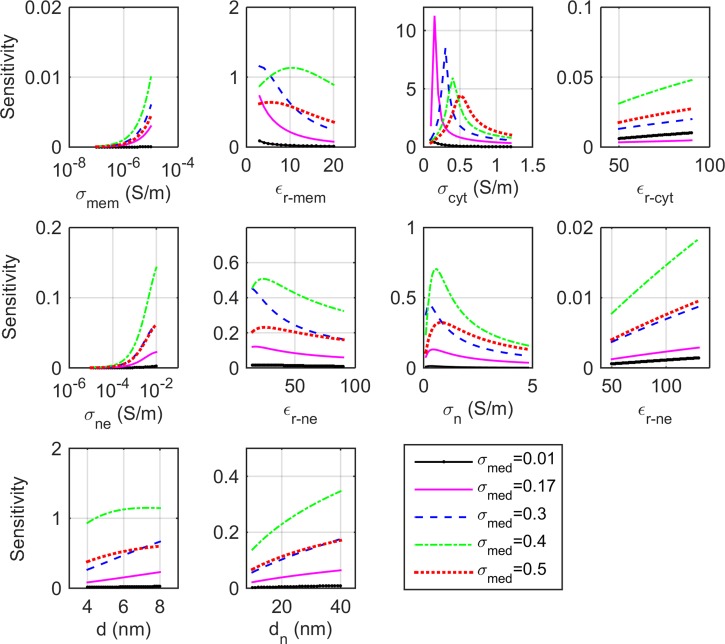
A Chinese hamster ovary cell is a eukaryote with a nucleus much larger than other organelles and approximately half the cell's radius (Fig. 6(a)). In this study, we employ a double-shell model for CHO cells consisting of the cell nucleus, nuclear envelope, cytoplasm, and plasma membrane, as shown in Fig. 6(b). With this model, there are eight dielectric parameters (permittivity and conductivity of each compartment) and four geometric parameters (radius of the cell and nucleus and the thickness of the membrane and nuclear envelope). The parameters are obtained by curve fitting to the measured data ( vs. frequency). Reliably extracting all parameters is challenging due to interdependency of some parameters and insensitivity of some parameters over the frequency range of measured data. To overcome this, we perform a sensitivity analysis to determine the parameters that predominantly affect the spectrum over the frequency range of measurements. We also obtain the size of the cells and their nuclei by optical microscopy.
FIG. 6.
(a) Image of a typical CHO cell in our experiment obtained using an inverted DIC microscope. (b) Double-shell model of a cell consisting of the cell nucleus, nuclear envelope, cytoplasm, and plasma membrane. The dielectric and geometric parameters of the model are indicated.
1. Sensitivity analysis
The sensitivity of the spectrum to a parameter xi is defined as the relative root-mean-square change in the entire spectrum of due to a small change in xi over the relative change of xi. The sensitivity function at xi = xi0 is described as54
| (8) |
where K(f,x1,…,xi,…,xn) is the function , fmin and fmax denote the frequency range of measurement, and xi represents the dielectric and geometric parameters. For calculating the sensitivity to each parameter xi, we vary its value over a selected range (chosen for mammalian cells) while keeping other parameters constant. Therefore, is dependent on the value of all parameters and is initially selected to be that of typical values reported for mammalian cells.20,38 Larger u(xi) implies greater effect on the spectrum of over the measured frequency range. Based on the sensitivity analysis, a subset of the most sensitive parameters are chosen for curve-fitting to the measured spectra. Insensitive parameters are identified and their values are kept as the typical reported values.
2. Obtaining parameters by curve fitting
The values of the parameters which are selected for optimization (based on the sensitivity analysis) are obtained by curve fitting to the measured spectra. The Nelder-Mead simplex optimization technique (MATLAB R2014b Optimization Toolbox) is employed to minimize the error function
| (9) |
where Kmeas(f,x1,…,xn) and Kopt(f,x1,…,xn) are the measured and fitted spectra, respectively.
G. Cell preparation
The Chinese hamster ovary cells (CHODG44-EG2-hFc/clone 1A7), kindly provided by Yves Durocher of the National Research Council, are grown in 250 ml shaker flasks and incubated at 37 °C with a 10% CO2 overlay on a shaker platform (120 rpm). The cells are passaged every 2–3 days with a seeding density of 2 × 10⁵ cells/ml in BioGro-CHO serum-free medium (BioGro Technologies, Winnipeg, MB) supplemented with 0.5 g/l yeast extract (BD, Sparks, MD), 1 mM glutamine (Sigma, St. Louis, MO), and 4 mM GlutaMax I (Invitrogen, Grand Island, NY). On the day of the experiment, the cell suspension is prepared by centrifuging and resuspending day 2 cells in a mix of low conductivity [22.9 mM sucrose (Sigma), 16 mM glucose (Fisher), 1 mM CaCl2 (Fisher), 16 mM Na2HPO4 (Fisher)] and BioGro CHO medium to a concentration of 2 × 10⁵ cells/ml. The ratio of low conductivity to BioGro CHO medium is based on the desired sample conductivity: 0.17 S/m (30:2), 0.30 S/m (26.8:5.2), 0.40 S/m (24.4:7.6), and 0.50 S/m (22:10). All media are isotonic and their osmotic pressure, as measured with an osmometer (Advanced® Model 3300 Micro-Osmometer, Advanced Instruments Inc., Norwood, USA), is 291, 303, 298, and 305 mOsm/kg for conductivities 0.17, 0.3, 0.4, and 0.5, respectively.
III. RESULTS AND DISCUSSION
A. System calibration
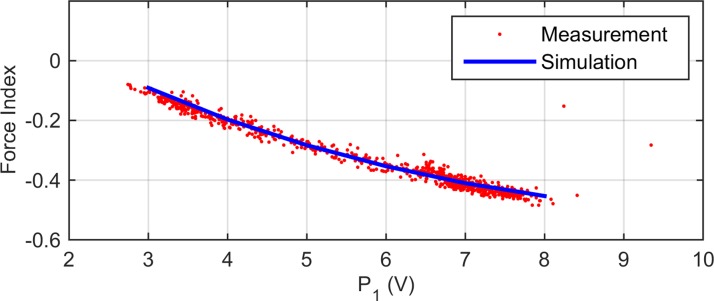
In order to determine the lift coefficient, C, and verify our COMSOL simulations, experiments are performed on 11 μm diameter polystyrene spheres (PSS) (close to CHO cell diameter and density) suspended in a medium with the same density and viscosity as the one used for cells. While applying a 10 MHz, 8 Vpp DEP voltage to the actuating electrode, force indices are recorded for 800 individual beads flowing at different velocities which causes them to settle at different equilibrium altitudes. Given that a PSS acts like a lossless dielectric sphere with = 2.5 in the MHz range, we simulate the DEP response of a bead at a specific initial altitude. The lift coefficient, C = 0.31, is obtained by adjusting it such that the force index predicted by the simulation matches the average of force indices measured for beads with the same altitude in the channel. To verify the result, we use the obtained value of C to simulate beads at other initial altitudes (ranging from 11 to 27 μm) and compare the results with the measured data. The results depicted in Fig. 7 show a good agreement between the simulation and measured data.
FIG. 7.
Measured and simulated force indices for 11 μm polystyrene spheres. The x-axis is the amplitude of the peak registered by the sensing electrodes, S1, before the DEP actuation, which is a measure of particles altitude in the channel (see Fig. 4(b)). Good agreement between the measured and simulation results verifies the lift coefficient value, C = 0.031.
B. Measurement of the DEP response of CHO cells
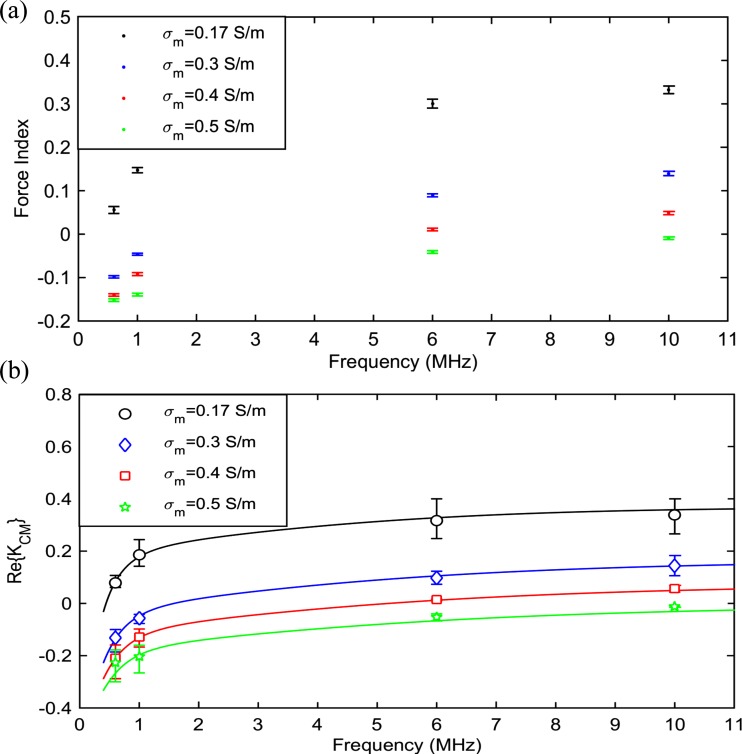
CHO cells are suspended in media with conductivities 0.17, 0.3, 0.4, and 0.5 S/m and the DEP response of individual cells are measured at frequencies 0.6, 1, 6, and 10 MHz in each medium. The measurement frequency range is selected to include the part of spectrum which exhibits the dispersion effects of the cells internal structure. Measurements at very low and very high frequencies are limited by our measurement setup. Cells in the medium with the lowest ionic concentration, 0.17 S/m, were tested beforehand to ensure their viabilities were not affected over the course of an experiment (approximately an hour). The average measured force indices versus frequency for each medium is depicted in Fig. 8(a) with error bars representing the standard error of the mean. Each data point is the average of force indices of approximately 400 individual cells. In this experiment, the system throughput is approximately 40 cells per minute. The values of corresponding to average measured force indices, obtained using COMSOL simulations as described in Sections II D and II E, yield the result shown in Fig. 8(b). Error bars represent the deviation in simulation results when the particle velocity (which has influence on the determination of the particle initial altitude) is set to one standard deviation above and below the average velocity of measured cells.
FIG. 8.
(a) Average measured force indices for CHO cells suspended in media with various conductivities. Each data point is the average of approximately 400 individual cells. Error bars represent the standard error of the mean. (b) corresponding to the measured force indices as obtained from simulations. Error bars represent the deviation in simulation results when the particle velocity is set to one standard deviation above and below the average velocity of measured cells. Data points correspond to the measured values in Fig. 8(a). Solid lines show the calculated spectrum using the curve-fitted CHO double-shell model dielectric parameters as determined later (see Table II).
C. Measurement of cell and nucleus size
The average diameter of cells is determined by optical imaging using a Cedex XS cell analyzer (Innovatice, Germany) which provides the average diameter based on approximately 150 viable cells. The average radius of CHO cells suspended in 0.17, 0.3. 0.4, and 0.5 S/m media was measured to be 5.9, 6.1, 6.0, and 6.2, respectively. In order to determine the nucleus diameter, CHO cells were imaged in suspension using an inverted differential interference contrast (DIC) microscope (Observer.Z1, Zeiss, Germany). A typical cell image is shown in Fig. 6(a). After analyzing the images of 40 cells (using the ImageJ image processing program), the ratio of nucleus radius (average of major and minor axes) to cell radius is obtained as = 0.55. This is consistent with other reported results.55
D. Cell model parameter sensitivity analysis
The double-shell model parameters of a CHO cell are extracted by curve fitting to the measured spectrum for employing an optimization method as described in Section II F 2. The double-shell model requires optimization of 10 parameters, assuming that the cell and nucleus radii are obtained by optical methods. An initial evaluation of the number of parameters that can be reliably optimised is determined by sensitivity analysis while testing the optimization process with sets of synthetic data. Due to interdependency and insensitivity of some parameters for the frequency range and conductivities chosen in the experiments, the optimization algorithm is able to recover five parameters with less than 0.2% error. Fig. 9 shows the sensitivity factor for different cell parameters calculated using Eq. (8) as their values vary over the following ranges: 10−7 < < 10−5 S/m, 3 < < 20 F/m, 0.1 < < 1.2 S/m, 50 < < 90 F/m, 10−5 < < 10−2 S/m, 15 < < 90 F/m, 0.1 < < 4.8 S/m (which makes 1 < < 4), 50 < < 130 F/m, 5 < d < 8 nm, and 10 < dn < 40 nm. The range of variation for each parameter is chosen such that it encompasses the values previously reported in literature for other mammalian cells.11,20,21,38,39,56–59 Sensitivity of each parameter is calculated with respect to the nominal values: = 1×10 − 6 S/m, = 11 F/m, = 0.4 S/m, = 60 F/m, = 1×10⁻³ S/m, = 86 F/m, = 2, = 120 F/m, d = 7 nm, dne = 40 nm which are the values obtained for normal lymphocyte cells.20,38 Since the medium conductivity has a substantial influence, the sensitivities are presented for five media conductivities (0.17, 0.3, 0.4, and 0.5 S/m media as employed in our measurements and a very low conductivity medium, 0.01 S/m, which has been used in many other dielectric parameter studies10,11,39,41,59,60).
FIG. 9.
Sensitivity factors of 10 electrical and geometrical parameters for a double-shell cell model as their values vary over specified ranges. The sensitivity of each parameter is calculated with respect to the nominal values: = 1×10 − 6 S/m, = 11 F/m, d = 7 nm, = 0.4 S/m, = 60 F/m, = 1×10⁻³ S/m, = 86 F/m, dne = 40 nm, = 2, = 120 F/m.20,38 Sensitivities are presented for five media conductivities (0.17, 0.3, 0.4, and 0.5 S/m, as employed in our measurements and one very low conductivity medium, 0.01 S/m).
As our measurements are in the 0.6–10 MHz frequency range, the sensitivity to the membrane conductivity is low as this parameter predominantly affects the low frequency part of the spectrum (less than 200 kHz). Similarly, the cytoplasm and nucleoplasm permittivities predominantly affect the high frequency part of the spectrum (greater than 50 MHz). Based on the sensitivity results in Fig. 9, membrane permittivity, cytoplasm conductivity, nuclear envelope permittivity, nucleoplasm conductivity, and plasma membrane thickness are selected as parameters for optimization. Among these parameters, cytoplasm conductivity is the most sensitive parameter for our measured frequency range. In general, the membrane thickness and permittivity have an interdependency and in many cases is modeled as a membrane capacitance. In this work, we maintain them as separate parameters. The nuclear envelope thickness has a slight effect on the spectrum over our measured frequency range. We chose to fix the nuclear envelope thickness to 40 nm, dn = 40 nm, which is the value reported in literature by optical measurement of single nuclear pore permeability61 and electron microscopy.56 It should be noted that the sensitivity to cell parameters (especially the nucleus and nuclear envelope) is substantially lower for media with very low ionic concentration (less than 0.1 S/m). Therefore, parameters of a double-shell model extracted from measurements in a very low conductivity medium may have lower accuracy.
E. CHO double-shell model parameters
The final double-shell model parameters of CHO cells are given in Table II. Seven parameters are obtained by curve fitting to the measured data and optical measurements (cell and nucleus sizes). Five remaining parameters, which our measurements are most insensitive to, , , , , and dne, are set to the values obtained for normal lymphocyte cells.20,38 The reported parameters of three other mammalian cells (leukocytes) obtained by time domain dielectric spectroscopy,20 frequency domain dielectric spectroscopy,38 and electrorotation technique21 are also presented in Table II for comparison.
TABLE II.
Double shell-model parameters for CHO cells (and three other mammalian cells).
| Parameters | CHO | T lymphocytesa | Lymphocytesb | Monocytesc |
|---|---|---|---|---|
| Membrane permittivity (F/m) | 8.5 | 11.1 | 6.8 | 8.6 d |
| cytoplasm conductivity (S/m) | 0.42 | 0.65 | 0.32 | 0.56 |
| Nuclear envelope permittivity (F/m) | 23.2 | 85.6 | 28 | N/A |
| Nucleoplasm conductivity (S/m) | 1.50 | 1.26 | 1.35 | N/A |
| Membrane thickness (nm) | 5 | 7 | 7 | N/A |
| Average cell radius (μm) | 6.0 | 3.4 | 2.9 | 4.6 |
| Nucleus radius/cell radius | 0.55 | 0.84 | 0.86 | N/A |
| Membrane conductivity (S/m) | 1 × 10⁻⁶ | 27.4 × 10⁻⁶ | <10−5σcyt | 1 × 10⁻⁴d |
| Cytoplasm permittivity (F/m) | 60 | 60 | 60 | 126.8 |
| Nuclear envelope conductivity (S/m) | 1 × 10⁻³ | 8.8 × 10⁻³ | 6 × 10⁻³ | N/A |
| Nucleoplasm permittivity (F/m) | 120 | 52 | 120 | N/A |
| Nuclear envelope thickness (nm) | 40 | 40 | 40 | N/A |
Our values of membrane permittivity and cytoplasm conductivity of CHO cells are close to the values reported for other mammalian cells. Parameters for the nuclei of cells have been investigated to a lesser extent, and the reported values are scattered over a broader range. Our obtained value for the nuclear envelope permittivity is close to Refs. 38 and 56. We found that the nucleoplasm conductivity is substantially higher than the cytoplasm conductivity. This is consistent with the findings in Refs. 20 and 36 which describe the nuclear envelope as a dynamic ion-selective membrane capable of maintaining ion gradients across. A plot of based on the extracted CHO model (Table II) is given in Fig. 8(b) showing the fit to the measured data.
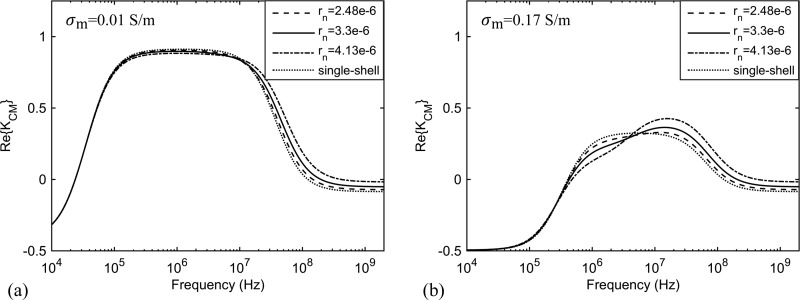
CHO cells have a much smaller nucleus (less than 20% of the cell volume) as compared with leukocytes. Nevertheless, measurements in moderately conductive media (which increases the sensitivity to nucleus parameters) enable us to accurately determine the dielectric properties of the nucleus. Fig. 10 shows the simulated spectrum of for a CHO cell with parameters given in Table II and medium conductivity of 0.01 and 0.17 S/m (close to medium conductivities used in several pervious works10,39,43,59,62–64). It demonstrates that changing the radius of the nucleus by 25% (while keeping all other parameters the same) causes a noticeable change in the spectrum for medium conductivity 0.17 S/m. The effect on the spectrum for medium conductivity 0.01 S/m is not discernible at frequencies less than 10 MHz and less pronounced at higher frequencies. The single-shell model (membrane and cytoplasm with no nucleus) spectrum is also shown in Fig. 10.
FIG. 10.
Simulated spectrum of for a CHO cell with parameters from Table II in a medium with conductivity (a) 0.01 S/m and (b) 0.17 S/m (solid line). The effect of changing the nucleus radius by 25% smaller (dashed line) and larger (dash-dot line) on the spectrum as well as modeling the cell with a single-shell structure, including only the membrane and cytoplasm, (dotted line) is demonstrated.
IV. CONCLUSIONS
In this paper, we showed how the dielectric properties of CHO cells could be represented accurately by a double-shell model. By measuring the DEP response of single CHO cells along with optical measurements, we reported values for CHO cells' membrane permittivity, membrane thickness, cytoplasm conductivity, nuclear envelope permittivity, nucleoplasm conductivity, cell size, and nucleus size. The parameters reported are the most sensitive ones over the frequency range of our experiments (0.6–10 MHz). Despite the small size of CHO cell's nucleus, it causes a discernable dispersion over our measured frequency range for the chosen media conductivities. This enabled us to determine the nucleus and nuclear envelope dielectric parameters fairly accurate.
ACKNOWLEDGMENTS
The authors would like to thank the Natural Sciences and Engineering Research Council (NSERC), the Canada Foundation for Innovation (CFI), Canadian Microelectronics Corporation (CMC) Microsystems, and the Province of Manitoba for the financial support of this research.
References
- 1. Talary M. S., Burt J. P. H., Tame J. A., and Pethig R., J. Phys. D: Appl. Phys. 29, 2198 (1996). 10.1088/0022-3727/29/8/021 [DOI] [Google Scholar]
- 2. Raicu V., Biochim. Biophys. Acta, Gen. Subj. 1379, 7 (1998). 10.1016/S0304-4165(97)00056-1 [DOI] [PubMed] [Google Scholar]
- 3. Valero A., Braschler T., Demierre N., and Renaud P., Biomicrofluidics 4, 022807 (2010). 10.1063/1.3430542 [DOI] [PMC free article] [PubMed] [Google Scholar]
- 4. Hu X., Arnold W. M., and Zimmermann U., Biochim. Biophys. Acta 1021, 191 (1990). 10.1016/0005-2736(90)90033-K [DOI] [PubMed] [Google Scholar]
- 5. Ermolina I., Polevaya Y., Feldman Y., Ginzburg B. Z., and Schlesinger M., IEEE Trans. Dielectr. Electr. Insul. 8, 253 (2001). 10.1109/94.919948 [DOI] [Google Scholar]
- 6. Ratanachoo K., Gascoyne P. R. C., and Ruchirawat M., Biochim. Biophys. Acta, Biomembr. 1564, 449 (2002). 10.1016/S0005-2736(02)00494-7 [DOI] [PMC free article] [PubMed] [Google Scholar]
- 7. Huang Y., Joo S., Duhon M., Heller M., Wallace B., and Xu X., Anal. Chem. 74, 3362 (2002). 10.1021/ac011273v [DOI] [PubMed] [Google Scholar]
- 8. Altomare L., Borgatti M., Medoro G., Manaresi N., Tartagni M., Guerrieri R., and Gambari R., Biotechnol. Bioeng. 82, 474 (2003). 10.1002/bit.10590 [DOI] [PubMed] [Google Scholar]
- 9. Das C. M., Becker F., Vernon S., Noshari J., Joyce C., and Gascoyne P. R. C., Anal. Chem. 77, 2708 (2005). 10.1021/ac048196z [DOI] [PMC free article] [PubMed] [Google Scholar]
- 10. Labeed F. H., Coley H. M., and Hughes M. P., Biochim. Biophys. Acta 1760, 922 (2006). 10.1016/j.bbagen.2006.01.018 [DOI] [PubMed] [Google Scholar]
- 11. Duncan L., Shelmerdine H., Hughes M. P., Coley H. M., Hübner Y., and Labeed F. H., Phys. Med. Biol. 53, N1 (2008). 10.1088/0031-9155/53/2/N01 [DOI] [PubMed] [Google Scholar]
- 12. Gascoyne P. R. C., Noshari J., Anderson T. J., and Becker F. F., Electrophoresis 30, 1388 (2009). 10.1002/elps.200800373 [DOI] [PMC free article] [PubMed] [Google Scholar]
- 13. Vahey M. D. and Voldman J., Anal. Chem. 80, 3135 (2008). 10.1021/ac7020568 [DOI] [PubMed] [Google Scholar]
- 14. Vahey M. D. and Voldman J., Anal. Chem. 81, 2446 (2009). 10.1021/ac8019575 [DOI] [PMC free article] [PubMed] [Google Scholar]
- 15. Su H.-W., Prieto J. L., and Voldman J., Lab Chip 13, 4109 (2013). 10.1039/c3lc50392e [DOI] [PubMed] [Google Scholar]
- 16. Asami K., Hanai T., and Koizumi N., J. Membr. Biol. 28, 169 (1976). 10.1007/BF01869695 [DOI] [PubMed] [Google Scholar]
- 17. Hölzel R. and Lamprecht I., Biochim. Biophys. Acta, Biomembr. 1104, 195 (1992). 10.1016/0005-2736(92)90150-K [DOI] [PubMed] [Google Scholar]
- 18. Holzel R., Biophys. J. 73, 1103 (1997). 10.1016/S0006-3495(97)78142-6 [DOI] [PMC free article] [PubMed] [Google Scholar]
- 19. Raicu V., Raicu G., and Turcu G., Biochim. Biophys. Acta, Bioenerg. 1274, 143 (1996). 10.1016/0005-2728(96)00024-2 [DOI] [PubMed] [Google Scholar]
- 20. Polevaya Y., Ermolina I., Schlesinger M., Ginzburg B. Z., and Feldman Y., Biochim. Biophys. Acta 1419, 257 (1999). 10.1016/S0005-2736(99)00072-3 [DOI] [PubMed] [Google Scholar]
- 21. Yang J., Huang Y., Wang X., Wang X. B., Becker F. F., and Gascoyne P. R., Biophys. J. 76, 3307 (1999). 10.1016/S0006-3495(99)77483-7 [DOI] [PMC free article] [PubMed] [Google Scholar]
- 22. Jayapal K., Wlaschin K., Hu W., and Yap G., Chem. Eng. Prog. 103, 40 (2007). [Google Scholar]
- 23. Fiore M., Zanier R., and Degrassi F., Mutagenesis 17, 419 (2002). 10.1093/mutage/17.5.419 [DOI] [PubMed] [Google Scholar]
- 24. Fernández M. J., López A., and Santa-Maria A., J. Appl. Toxicol. 23, 221 (2003). 10.1002/jat.910 [DOI] [PubMed] [Google Scholar]
- 25. Zeng Q., Dong J.-M., Guo K., Li J., Tan H.-X., Koh V., Pallen C. J., Manser E., and Hong W., Cancer Res. 63, 2716 (2003). [PubMed] [Google Scholar]
- 26. Batista L. F. Z., Chiganças V., Brumatti G., Amarante-Mendes G. P., and Menck C. F. M., Apoptosis 11, 1139 (2006). 10.1007/s10495-006-7109-4 [DOI] [PubMed] [Google Scholar]
- 27. Yan S., Zhang J., Yuan Y., Lovrecz G., Alici G., Du H., Zhu Y., and Li W., Electrophoresis 36, 284 (2015). 10.1002/elps.201400397 [DOI] [PubMed] [Google Scholar]
- 28. Mernier G., Majocchi S., Mermod N., and Renaud P., Sens. Actuators B Chem. 166–167, 907 (2012). 10.1016/j.snb.2012.03.057 [DOI] [Google Scholar]
- 29. Čemažar J., Vrtačnik D., Amon S., and Kotnik T., IEEE Trans. Nanobiosci. 10, 36 (2011). 10.1109/TNB.2011.2128340 [DOI] [PubMed] [Google Scholar]
- 30. Cemažar J. and Kotnik T., Electrophoresis 33, 2867 (2012). 10.1002/elps.201200265 [DOI] [PubMed] [Google Scholar]
- 31. Justice C., Brix A., Freimark D., Kraume M., Pfromm P., Eichenmueller B., and Czermak P., Biotechnol. Adv. 29, 391 (2011). 10.1016/j.biotechadv.2011.03.002 [DOI] [PubMed] [Google Scholar]
- 32. Opel C. F., Li J., and Amanullah A., Biotechnol. Prog. 26, 1187 (2010). 10.1002/btpr.425 [DOI] [PubMed] [Google Scholar]
- 33. Asami K., Prog. Polym. Sci. 27, 1617 (2002). 10.1016/S0079-6700(02)00015-1 [DOI] [Google Scholar]
- 34. Gawad S., Cheung K., Seger U., Bertsch A., and Renaud P., Lab Chip 4, 241 (2004). 10.1039/b313761a [DOI] [PubMed] [Google Scholar]
- 35. Surowiec A., Stuchly S. S., and Izaguirre C., Phys. Med. Biol. 31, 43 (1986). 10.1088/0031-9155/31/1/004 [DOI] [PubMed] [Google Scholar]
- 36. Garner A. L., Chen G., Chen N., Sridhara V., Kolb J. F., Swanson R. J., Beebe S. J., Joshi R. P., and Schoenbach K. H., Biochem. Biophys. Res. Commun. 362, 139 (2007). 10.1016/j.bbrc.2007.07.159 [DOI] [PubMed] [Google Scholar]
- 37. Zhuang J., Ren W., Jing Y., and Kolb J. F., IEEE Trans. Dielectr. Electr. Insul. 19, 609 (2012). 10.1109/TDEI.2012.6180256 [DOI] [Google Scholar]
- 38. Asami K., Takahashi Y., and Takashima S., Biochim. Biophys. Acta, Mol. Cell Res. 1010, 49 (1989). 10.1016/0167-4889(89)90183-3 [DOI] [PubMed] [Google Scholar]
- 39. Gascoyne P. R., Pethig R., Burt J. P., and Becker F. F., Biochim. Biophys. Acta 1149, 119 (1993). 10.1016/0005-2736(93)90032-U [DOI] [PubMed] [Google Scholar]
- 40. Burt J. P., Pethig R., Gascoyne P. R., and Becker F. F., Biochim. Biophys. Acta 1034, 93 (1990). 10.1016/0304-4165(90)90158-S [DOI] [PubMed] [Google Scholar]
- 41. Labeed F. H., Coley H. M., Thomas H., and Hughes M. P., Biophys. J. 85, 2028 (2003). 10.1016/S0006-3495(03)74630-X [DOI] [PMC free article] [PubMed] [Google Scholar]
- 42. Jones T. B. and Jones T. B., Electromechanics of Particles ( Cambridge University Press, 2005). [Google Scholar]
- 43. Braasch K., Nikolic-Jaric M., Cabel T., Salimi E., Bridges G. E., Thomson D. J., and Butler M., Biotechnol. Bioeng. 110, 2902 (2013). 10.1002/bit.24976 [DOI] [PubMed] [Google Scholar]
- 44. Stratton J. A., Electromagnetic Theory ( Wiley-IEEE Press, 2007). [Google Scholar]
- 45. Nikolic-Jaric M., Romanuik S. F., Ferrier G. A., Bridges G. E., Butler M., Sunley K., Thomson D. J., and Freeman M. R., Biomicrofluidics 3, 034103 (2009). 10.1063/1.3187149 [DOI] [PMC free article] [PubMed] [Google Scholar]
- 46. Ferrier G. A., Romanuik S. F., Thomson D. J., Bridges G. E., and Freeman M. R., Lab Chip 9, 3406 (2009). 10.1039/b908974h [DOI] [PubMed] [Google Scholar]
- 47. Shames I. H., Mechanics of Fluids, 4th ed. ( McGraw-Hill, Boston, 2003). [Google Scholar]
- 48. Williams S. P., Koch T., and Calvin Giddings J., Chem. Eng. Commun. 111, 121 (1992). 10.1080/00986449208935984 [DOI] [Google Scholar]
- 49. Ganatos P., Weinbaum S., and Pfeffer R., J. Fluid Mech. 99, 739 (1980). 10.1017/S0022112080000870 [DOI] [Google Scholar]
- 50.Polysciences Inc., “Polybead polystyrene microspheres technical datasheet,” 2013.
- 51. Anderson E. C., Petersen D. F., and Tobey R. A., Biophys. J. 10, 630 (1970). 10.1016/S0006-3495(70)86325-1 [DOI] [PMC free article] [PubMed] [Google Scholar]
- 52. Hofmann G., Iscotables: A Handbook of Data for Biological and Physical Scientists ( Instrumentation Specialties Company, Lincoln, Nebraska, 1977). [Google Scholar]
- 53. Ellison W. J., Lamkaouchi K., and Moreau J. M., J. Mol. Liq. 68, 171 (1996). 10.1016/0167-7322(96)00926-9 [DOI] [Google Scholar]
- 54. Gascoyne P. R. C., Becker F. F., and Wang X.-B., Bioelectrochem. Bioenerg. 36, 115 (1995). 10.1016/0302-4598(94)05015-M [DOI] [Google Scholar]
- 55. Han A., Abuhabsah R., Blue J. P., Sarwate S., and O'Brien W. D., J. Acoust. Soc. Am. 130, 4139 (2011). 10.1121/1.3655879 [DOI] [PMC free article] [PubMed] [Google Scholar]
- 56. Irimajiri A., Doida Y., Hanai T., and Inouye A., J. Membr. Biol. 38, 209 (1978). 10.1007/BF01871923 [DOI] [PubMed] [Google Scholar]
- 57. Merla C., Liberti M., Apollonio F., Nervi C., and D'Inzeo G., IEEE MTT-S Int. Microw. Symp. Dig. 2009, 1333. 10.1109/TBME.2010.2104150 [DOI] [Google Scholar]
- 58. Gascoyne P. R. C., Shim S., Noshari J., Becker F. F., and Stemke-Hale K., Electrophoresis 34, 1042 (2013). 10.1002/elps.201200496 [DOI] [PMC free article] [PubMed] [Google Scholar]
- 59. Wu L., Lanry Yung L.-Y., and Lim K.-M., Biomicrofluidics 6, 14113 (2012). 10.1063/1.3690470 [DOI] [PMC free article] [PubMed] [Google Scholar]
- 60. Broche L. M., Labeed F. H., and Hughes M. P., Phys. Med. Biol. 50, 2267 (2005). 10.1088/0031-9155/50/10/006 [DOI] [PubMed] [Google Scholar]
- 61. Keminer O. and Peters R., Biophys. J. 77, 217 (1999). 10.1016/S0006-3495(99)76883-9 [DOI] [PMC free article] [PubMed] [Google Scholar]
- 62. Moisescu M. G., Radu M., Kovacs E., Mir L. M., and Savopol T., Biochim. Biophys. Acta, Biomembr. 1828, 365 (2013). 10.1016/j.bbamem.2012.08.030 [DOI] [PubMed] [Google Scholar]
- 63. Nikolic-Jaric M., Cabel T., Salimi E., Bhide A., Braasch K., Butler M., Bridges G. E., and Thomson D. J., Biomicrofluidics 7, 024101 (2013). 10.1063/1.4793223 [DOI] [PMC free article] [PubMed] [Google Scholar]
- 64. Oblak J., Križaj D., Amon S., Maček-Lebar A., and Miklavčič D., Bioelectrochemistry 71, 164 (2007). 10.1016/j.bioelechem.2007.04.001 [DOI] [PubMed] [Google Scholar]


