Significance
In all kingdoms of life, gene transcription is not carried out by RNA polymerase enzymes alone. Instead, the behavior of RNA polymerases during transcription initiation, elongation, and termination is regulated by accessory proteins that bind to the polymerase molecule. Bacterial σ proteins are historically thought of as transcription initiation factors primarily involved in promoter recognition. Here, we use light microscopy to directly observe the behavior of individual fluorescently labeled σ70 subunits during transcript elongation by Escherichia coli RNA polymerase. We show that σ70 can be retained on an RNA polymerase molecule throughout transcription and alters polymerase behavior during transcript elongation.
Keywords: CoSMoS, single-molecule fluorescence, sigma factor, elongation complex, transcription regulation
Abstract
Production of a messenger RNA proceeds through sequential stages of transcription initiation and transcript elongation and termination. During each of these stages, RNA polymerase (RNAP) function is regulated by RNAP-associated protein factors. In bacteria, RNAP-associated σ factors are strictly required for promoter recognition and have historically been regarded as dedicated initiation factors. However, the primary σ factor in Escherichia coli, σ70, can remain associated with RNAP during the transition from initiation to elongation, influencing events that occur after initiation. Quantitative studies on the extent of σ70 retention have been limited to complexes halted during early elongation. Here, we used multiwavelength single-molecule fluorescence-colocalization microscopy to observe the σ70–RNAP complex during initiation from the λ PR′ promoter and throughout the elongation of a long (>2,000-nt) transcript. Our results provide direct measurements of the fraction of actively transcribing complexes with bound σ70 and the kinetics of σ70 release from actively transcribing complexes. σ70 release from mature elongation complexes was slow (0.0038 s−1); a substantial subpopulation of elongation complexes retained σ70 throughout transcript elongation, and this fraction depended on the sequence of the initially transcribed region. We also show that elongation complexes containing σ70 manifest enhanced recognition of a promoter-like pause element positioned hundreds of nucleotides downstream of the promoter. Together, the results provide a quantitative framework for understanding the postinitiation roles of σ70 during transcription.
Although DNA-directed RNA synthesis can be carried out by RNA polymerase (RNAP) alone, it is well established that transcribing RNAPs in the cell have bound accessory proteins that modulate transcription initiation and elongation (1). Elucidating the dynamics of accessory factor binding to and release from the transcription apparatus is essential to achieving a quantitative understanding of the molecular mechanisms that control transcription in cells.
In bacteria, any of a variety of σ subunits can associate with the core RNAP, conferring on the enzyme the ability to bind to distinct subsets of promoter sequences (2). Some σ subunits release from core RNAP immediately upon the initiation of RNA synthesis (3). In contrast, the primary σ factor in Escherichia coli, σ70, may be associated in vivo with a fraction of transcription elongation complexes (TECs) even far downstream of the promoter (4–8). It is unclear whether this downstream association in vivo reflects retention of the initiating σ70 subunit or binding of σ70 after TEC formation and whether the σ70–TEC association is kinetically stable during transcript elongation (9).
Retention of σ70 by early elongation TECs has demonstrated consequences for gene regulation. In particular, the σ70-containing TEC (σ70TEC) plays an essential role in bacteriophage λ late gene expression (10–12) because bound σ70 is required for the recognition of a promoter-like pause element that induces a critical early elongation pause. This early elongation pause, in turn, allows loading of an antitermination factor that enables transcription of the late gene operon (10, 13–15). Similar promoter-proximal pause elements are also associated with many E. coli promoters (16–19), but the function of these elements is yet unknown. Furthermore, σ70 interaction sites on core RNAP partially overlap with those of transcription elongation factors such as NusA, NusG, and RfaH (20–23). This and other evidence raises the possibility that σ70 retained in TECs sterically occludes the binding of other factors, which in turn could affect processes modulated by these factors, including intrinsic termination, rho-dependent termination, and transcription–translation coupling (10, 14, 15, 23).
σ70 retention by TECs early in elongation (<100 bp downstream of the promoter) is well established in vitro (9, 24). Retention can be detected indirectly as pausing that occurs at downstream pause elements that resemble promoter –10 elements (7, 12, 23). In addition, TECs with σ70 stably bound have been reported (25), and retention of σ70 by TECs stalled at different positions downstream of promoters has been confirmed in bulk (26, 27) and single-molecule (28) studies. The latter data have been interpreted to support models in which σ70 is stochastically released after promoter escape, but there are no studies directly characterizing release kinetics on actively elongating TECs.
To understand the postinitiation roles of σ70, it is essential to identify the conditions under which σ70 is retained by RNAP after promoter escape and to describe the kinetics of its release from actively elongating TECs. Here, we use multiwavelength single-molecule fluorescence techniques to follow in real time the initiation and elongation of transcription complexes from the phage λ PR′ promoter. The measurements allow us to directly observe σ70 retention on and subsequent departure from transcription complexes, both near to and far (>2,000 nt) downstream of the promoter, and to separately characterize the behavior of TECs and σ70TECs with respect to elongation velocity, intrinsic termination efficiency, and –10-like pause element recognition.
Results
Direct Detection of σ70 on Actively Elongating Transcription Complexes.
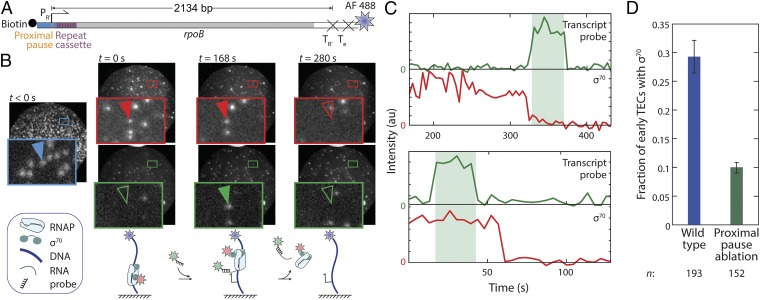
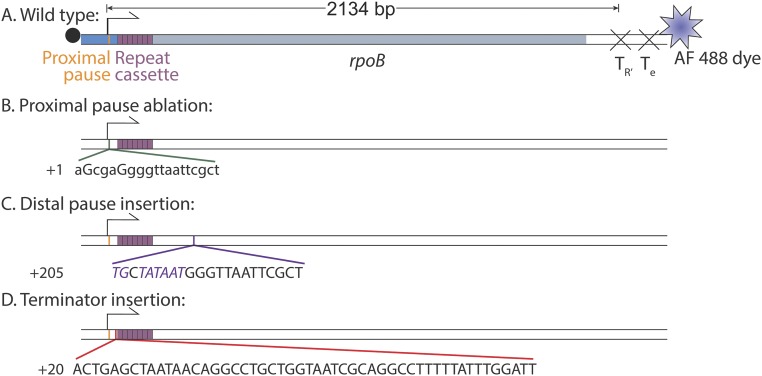
To observe the presence of σ70 within promoter complexes and TECs, we tethered linear DNA molecules labeled with AlexaFluor 488 (AF488) dye and containing the phage λ PR′ promoter to the surface of a glass flow chamber (Fig. 1A). We incubated the surface with a solution containing E. coli RNAP holoenzyme containing a σ70 subunit labeled on a single cysteine with Cy5 dye. Formation of promoter complexes was visualized as the appearance in total internal reflection fluorescence microscopy (29) of discrete spots of fluorescence that colocalized with the spots from AF488–DNA (Fig. 1B; t = 0). Unbound holoenzyme was then removed from the chamber by extensive washing with buffer. After washing, the DNA-colocalized σ70 spots persisted for several minutes or longer, suggesting that they reflect the formation of the kinetically stable open complexes that are expected on this promoter (30).
Fig. 1.
Direct detection of σ70 on active TECs. (A) Transcription template. The template contains the wild-type λ PR′ promoter region (blue) with its transcription start site (bent arrow) and promoter proximal pause element (orange), followed by seven tandem repeats of a 21-nt cassette (mauve), followed by a portion of the E. coli rpoB coding region (gray) and by two consecutive intrinsic terminators (X). (B) Images (65 × 65 μm) of the same microscope field of view of AF488–DNA (blue), Cy5–σ70 (red), and transcript-hybridization probe (green) taken at the specified times. Insets are magnified views of the marked regions. NTPs were introduced at time t = 0. The blue arrow marks a DNA spot; red and green arrows mark the same surface location in the other images, with the presence (filled arrows) and absence (open arrows) of a colocalized fluorescence spot indicated. Cartoons show the molecular structures hypothesized to be at the arrow at the three times shown; blue, red, and green stars represent the dye molecules attached to template DNA, σ70, and transcript probe, respectively. (C) Two examples of time records of transcript probe (green) and σ70 (red) fluorescence, each colocalized at a DNA spot. (C, Upper) σ70 fluorescence departs before the time interval (shaded) during which transcript probe fluorescence is present. (C, Lower) σ70 fluorescence persists throughout transcript probe interval. (D) The fraction (± SEM) of TECs that retain σ70 at the time transcript probe is first detected on the TEC. Retention is reduced when the wild-type promoter-proximal transcription pause is disrupted by mutation of the pause sequence. The reported values are corrected for photobleaching (Fig. S3).
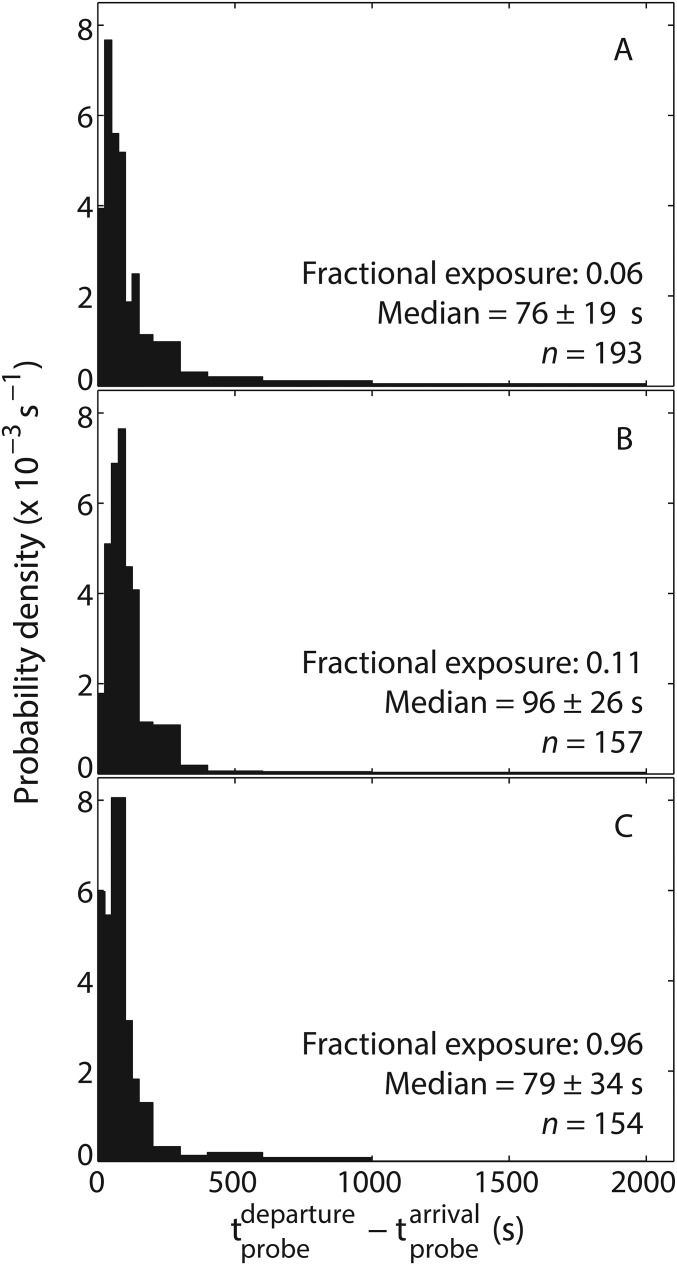
Once open complexes formed, we initiated transcription at time t = 0 by introducing 0.5 mM each of ATP, CTP, GTP, and UTP (NTPs). The solution also contained a Cy3-labeled oligonucleotide probe that was used to detect the nascent transcript by hybridization to a repeated target sequence near the 5′ end of the RNA (Fig. 1A) (3). At 34% of the 576 DNA locations that displayed a spot of Cy5–σ70RNAP fluorescence before NTP addition, we subsequently observed colocalization of a Cy3–probe spot, indicating the formation of a nascent transcript (Fig. 1B). A control experiment without NTPs showed only 4% probe colocalization. The two intrinsic terminators near the downstream end of the template (Fig. 1A) are expected to efficiently induce rapid (within 1 s) release of the transcript from RNAP (31–33). Consistent with transcript release upon termination, 94% of transcript probe spots seen in the NTPs-containing sample disappeared during the 47 min duration recording; the spots that disappeared (for example, Fig. 1C and Fig. S1, green traces) had a median lifetime of 79 ± 34 s (±SE). The median Cy3–probe spot lifetime was not significantly altered by changes in laser exposure (Fig. S2), indicating that most or all probe colocalizations were not prematurely terminated by photobleaching. During the median duration of the probe spot, an elongation complex is expected to transcribe 1260 ± 540 bp of DNA [at 15.9 ± 0.6 bp/s (34)]. Since the template encodes a 2134- to 2322-nt long RNA, this analysis implies that the transcript is first detected by probe hybridization when the TEC is located 870 ± 540 bp downstream of the promoter, a value consistent within experimental uncertainty with the probe association rate constant, 1.1 × 10+7 s−1 M−1 (3).
Fig. S1.
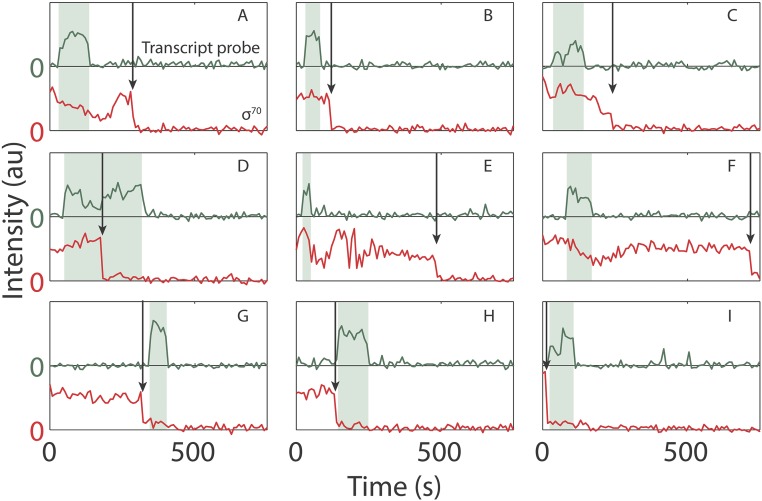
Example time records of transcript probe (green) and σ70 (red) fluorescence colocalized at a DNA spot. The time interval during which transcript probe fluorescence was present (shaded) and the time of σ70 departure (arrow) are indicated. The records show both σ70TECs (A–F) and TECs (G–I).
Fig. S2.
Effect of laser exposure on transcript probe lifetimes. The data in the first and second graphs at the top of Fig. 3A were aggregated to produce the distribution of lifetimes in A. Those data were collected at fractional exposure (i.e., the fraction of time the sample is exposed to the excitation laser) of 0.06, which corresponds to the condition under which all of the data in Figs. 1–3 were collected. To test for effects of photobleaching on probe lifetimes, the measurement was repeated at fractional exposures of 0.11 (B) and 0.96 (C). A Kolmogorov–Smirnov test (P = 0.95) yielded no evidence of significant differences between the distributions.
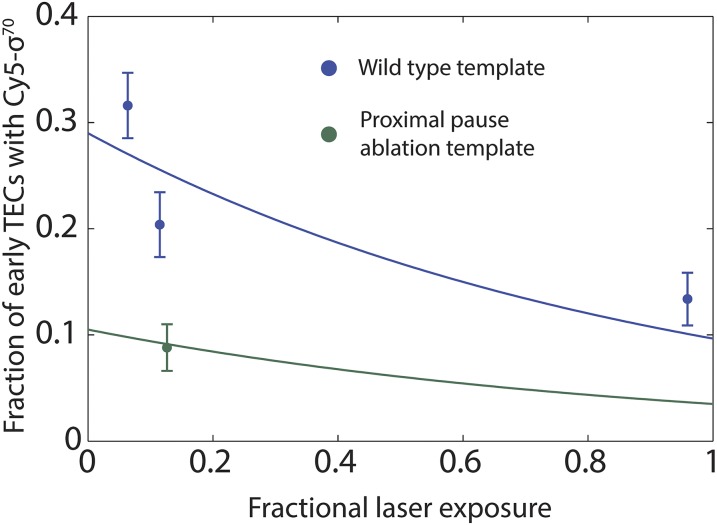
To assess the extent to which σ70 was retained during early elongation and beyond, we examined each DNA template location that had a colocalized Cy5–σ70 spot at t = 0 and determined whether σ70 was still present when the Cy3–probe spot was first observed at the same location. On most complexes, the Cy5–σ70 spot was lost before transcript was detected (Fig. 1C, Upper). In contrast, 29 ± 3% retained σ70 (Fig1B; Fig. 1C, Lower; Fig. 1D; Fig. S1; and Fig. S3), consistent with previous literature suggesting that σ70 can be retained by early and in some cases also mature TECs (7, 25, 26, 28). This fraction was significantly reduced when we used a transcription template with two point mutations that ablate the promoter-proximal pause element (Fig. 1D and Fig. S4B), consistent with earlier bulk measurements of actively elongating transcription complexes initiated from λ PR′ (7) but inconsistent with previous single-molecule measurements of TECs halted 50 bp downstream of a different promoter (PlacUV5) (28). Our data establish by direct observation on actively elongating transcription complexes that a substantial fraction (29%) can retain bound σ70 hundreds of base pairs downstream of the promoter.
Fig. S3.
Correction for photobleaching of Cy5–σ70 in determination of the fraction of σ70 retained in early elongation (Fig. 1D). Points are the fraction (± SEM; n = 152–193) of TECs that displayed Cy5–σ70 fluorescence at the time the Cy3–probe was first detected on the TEC in experiments with the indicated template DNAs. Lines are maximum likelihood global fits of the four data points to where L is the fractional laser exposure (i.e., the fraction of time the sample was exposed to the excitation laser), yielding values of the fit parameters F1 ± 0.03, the photobleaching-independent fraction of early TECs with σ70 on the wild-type (i = 1) template; F2 ± 0.01, the photobleaching-independent fraction of early TECs with σ70 on the proximal pause ablation (i = 2) template; and kPB = 0.11 ± 0.03 the characteristic photobleaching decay constant.
Fig. S4.
Wild-type transcription template (A) (same as Fig. 1A) and mutant templates constructed by ablating the λ PR′ promoter-proximal pause element (B), inserting a consensus σ70-dependent pause element (italics) after the repeat cassette (C) or inserting a λ tR2 intrinsic terminator between the promoter-proximal pause element and repeat cassette (D). Capital letters indicate sequence substitutions (B) or insertions (C and D); numbers indicate the position of the first nucleotide shown relative to the transcription start site.
σ70 Can Be Retained During Synthesis of Thousands of Nucleotides of RNA.
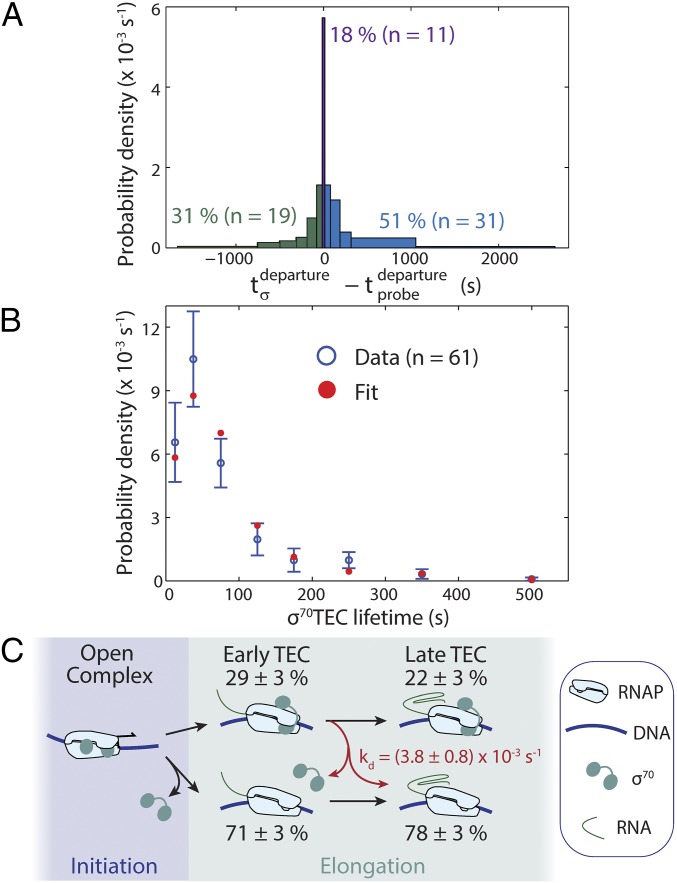
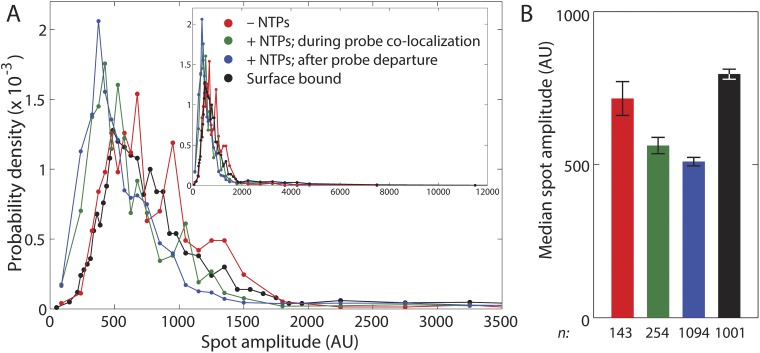
We next investigated the fate of TEC-associated σ70 molecules from the time when transcript was first detected (with the Cy-3 probe) until transcript was released after the synthesis of >2,000 nt of RNA. In a minority of cases (31%), Cy5–σ70 fluorescence disappeared before loss of Cy3–probe fluorescence. However, the majority of complexes retained Cy5–σ70, releasing it either simultaneously with or subsequent to termination as judged by Cy3–probe disappearance (Fig. 2A). Fluorescence intensity measurements (Fig. S5) were consistent with the idea that the σ70 present had been carried by the TEC to the terminator, rather than remaining behind at the promoter or nonspecifically bound to the slide surface. Thus, even on a long transcription unit, most TECs that retained σ70 until nascent transcript was first detected retained σ70 until termination or longer.
Fig. 2.
Dissociation of σ70 from TECs is slow compared with transcript production. (A) Histogram of σ70 departure time relative to transcript probe departure from the same TEC. The σ70 spot departed either before (green), simultaneously with (purple), or after (blue) transcript probe spot departure. (B) Lifetime distribution of σ70TECs (blue) and fit to a first-order dissociation model (red) yielding an apparent σ70TEC dissociation rate constant kapp = 4.0 ± 0.5 × 10⁻³ s−1. σ70TEC lifetime was calculated as the duration of the simultaneous presence of Cy5–σ70 and Cy3–probe fluorescence. (C) Kinetic model. Percentages (± SE) indicate fractions of initially observed open complexes (n = 61) that reach the indicated states.
Fig. S5.
Cy5–σ70 spot intensity distributions (A) and their medians (± SE) (B) from the wild-type template experiment shown in Fig. 1. Inset in A shows the full distribution; a magnified view of the low intensity range is shown in the main graph. Data were compiled separately from template DNA-colocalized Cy5–σ70 spots recorded before adding NTPs (red), from template DNA-colocalized Cy5–σ70 spots after adding NTPs during (green) and after (blue) a colocalized transcript probe spot was present, and from spots that did not colocalize with template (black). These populations are assumed to correspond to promoter-bound open complexes (red), elongating σ70TECs (green), σ70-containing complexes remaining after termination (blue), and σ70 holoenzyme nonspecifically bound to the slide surface (black). In total internal reflection fluorescence microscopy, excitation intensity decreases with increasing distance of the labeled molecule from the slide surface (45). Thus, the pattern of intensities seen here (red > green > blue) is consistent with the expected movement of RNAP away from the slide surface during transcription of the upstream surface-tethered template used in this experiment. Posttermination complexes (blue) display significantly lower intensities than nonspecifically bound (black) or open complexes (red) (P < 10−10 in both cases; Kolmogorov–Smirnov test), consistent with the idea that σ70 in the posttermination complexes was carried to the terminator by the elongation complex and inconsistent with models in which the posttermination σ70 remained at the promoter or was stuck to the surface. Spot intensities were measured at each time point by fitting with a 2D Gaussian as described (46). n indicates the number of spot intensities measured for each type.
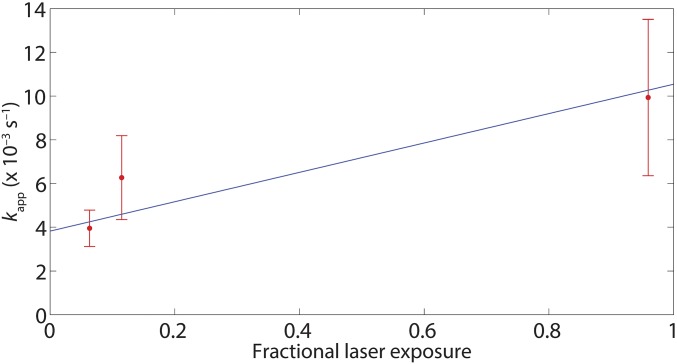
To ask whether σ70 is released stochastically albeit slowly during elongation, we compiled σ70TEC lifetimes. We separately tabulated the populations that appeared to dissociate during elongation (Fig. 2A, green) and those that persisted at least until termination (Fig. 2A, purple and blue). Joint fitting of these two sets of lifetime data (Methods) showed that the observations were consistent with slow stochastic release of σ70 (Fig. 2B). The apparent σ70 dissociation rate constant kapp derived from the fit includes contributions both from dissociation and from photobleaching; to determine the true dissociation rate constant, we repeated the experiment at different laser exposures and extrapolated to zero exposure (Fig. S6), yielding kd = (3.8 ± 0.8) × 10−3 s−1. Fig. 2C summarizes this dissociation process and the fates of the complexes we observe in our experiments. We see that a majority of transcription complexes release σ70 early in the transcription cycle during or shortly after the transition from initiation to elongation, whereas a subset remains stably bound to the TEC. Under our experimental conditions, once a σ70TEC has transcribed ∼870 bp or less, dissociation becomes extremely slow. In fact, the ∼100 s required to transcribe an E. coli transcription unit of average length (∼1,700 bp; Methods) at 15.9 ± 0.6 bp/s (34) is less than the characteristic lifetime of the slowly dissociating σ70 (1/kd = 260 s). Thus, once early transcription is completed, retained σ70 subunits would usually remain bound to TECs until termination on a transcription unit of typical length.
Fig. S6.
Correction for photobleaching of Cy5–σ70 in determination of the rate of dissociation of σ70 from σ70TECs. The apparent dissociation rate constant kapp at each laser exposure (± SE; red) was determined as in Fig. 2B (number of observations at each exposure, n = 21–61). A maximum-likelihood linear fit (blue) was used to extrapolate to zero exposure to yield the dissociation rate constant kd = (3.8 ± 0.8) × 10−3 s−1.
Effect of Retained σ70 on TEC Function.
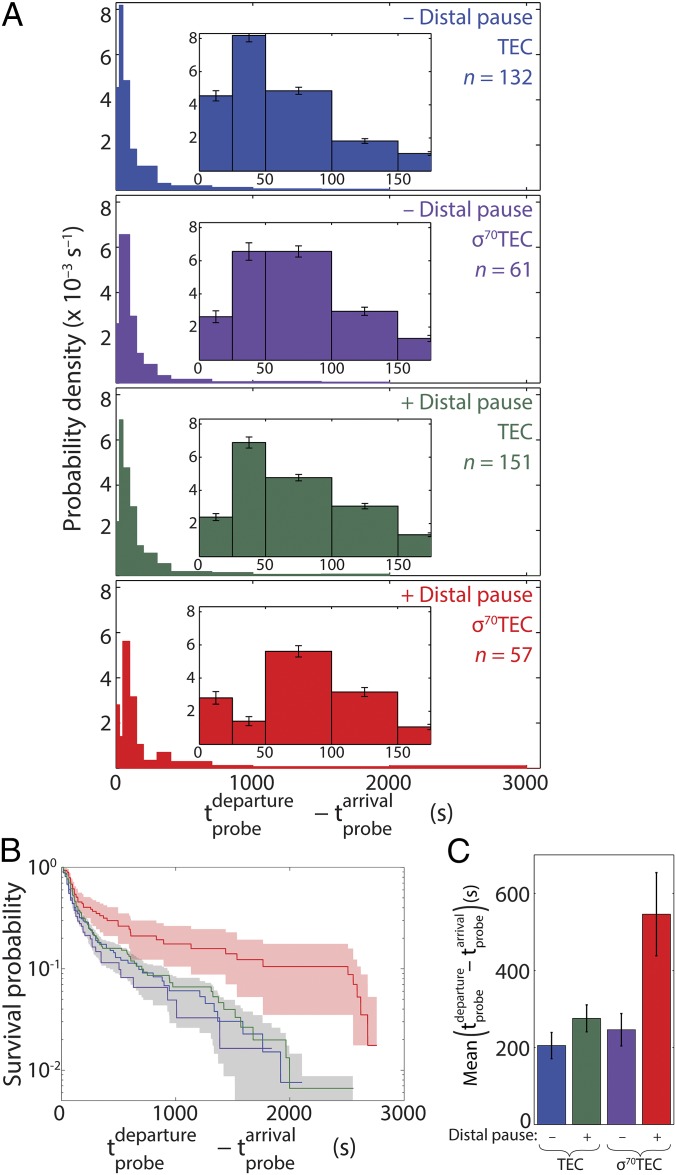
The forgoing experiments demonstrated that two different types of complexes, canonical TECs and σ70TECs, are synthesizing RNA transcripts in our experiments. Do the functional properties of these two species differ? We first determined the relative elongation rates of canonical TECs and σ70TECs by measuring the transcript probe lifetime as the time difference between the first detection of probe fluorescence (estimated to occur 870 bp downstream of the promoter) and its departure (TECs: Fig. 3 A and B, blue; σ70TECs: Fig. 3 A and B, purple). The distributions of probe lifetimes show pronounced tails, which is consistent with bulk measurements of transcript elongation kinetics (35) and is presumably attributable, at least in part, to heterogeneity in elongation rates across the populations of TECs and σ70TECs (34). The probe lifetime distribution was indistinguishable within experimental uncertainty for canonical TECs and σ70TECs, indicating that the two types of complexes elongated transcripts at the same rate.
Fig. 3.
Effect of retained σ70 on elongation time and on recognition of a distal –10-like pause. (A) Distributions of elongation complex transcript probe lifetimes on wild-type transcription template (Fig. 1A) and on a mutant template with a –10-like pause element inserted at +225 with respect to the transcription start sequence (see Fig. S4C). For each template, TEC and σ70TEC are the distinct subpopulations of elongation complexes from the same recording that, respectively, did not or did have bound Cy5–σ70 at the time of probe arrival. (B) Survival curves of the distributions in A. Shaded regions show the 90% confidence intervals of red curve and of the aggregate of the blue, purple, and green curves. (C) Means (± SE) of distributions in A.
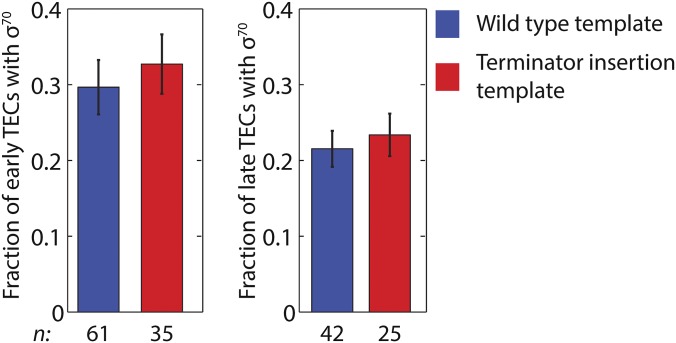
We also examined whether the termination efficiency at an intrinsic transcription terminator is different for canonical TECs and σ70TECs. We prepared a terminator insertion template (Fig. S4D) on which the only TECs detected by probe hybridization were those that had already read through a terminator of moderate strength [λ tR2; termination efficiency 49 ± 4% (36)]. We reasoned that if σ70TECs recognized the terminator more (or less) efficiently than canonical TECs, then the fraction of TECs that retain σ70 would be decreased (or increased) on template sequences downstream of the terminator. Instead, we found that the presence of the terminator did not significantly change this fraction either immediately after terminator readthrough or at the time of transcript probe departure (Fig. S7). This finding also indicates that terminator read-through did not detectably stimulate σ70 dissociation from the TEC.
Fig. S7.
Fraction of TECs with bound σ70 at the time when transcript was first detected (TECs in early elongation) (Left) and at the time of transcript probe departure (TECs in late elongation) (Right) on wild-type (Fig. S4A) and terminator insertion (Fig. S4D) templates.
When functionally engaged with the TEC, either because of retention or rebinding, σ70 is expected to be able to mediate recognition of promoter –10-like pause elements within the transcribed sequences (7, 12, 16, 22, 24). We therefore examined whether such a pause element positioned 224 bp downstream of the promoter (Fig. S4C) affected the time required for transcript elongation. This promoter-distal pause element significantly increased the elongation time but did so only for the subpopulation of TECs that retained σ70 (Fig. 3). The statistical significance of this difference (red vs. green distributions in Fig. 3 A and B) was confirmed by a Kolmogorov–Smirnov test (P = 0.006). These data strongly suggest that the σ70 molecules that we detect are functionally associated with their colocalized TECs and that only σ70TECs (and not canonical TECs) can recognize –10-like pause elements.
Discussion
We used single-molecule methods to study transcription complexes undergoing steady-state transcript elongation and to directly observe the times at which σ70 subunits dissociated relative to two markers: a time relatively early in elongation (detected by probe hybridization to the nascent transcript, which occurs after the synthesis of ∼870 nt of RNA) and the time of termination (detected by release of the probe–transcript hybrid). During production of the >2,000-nt transcript, a substantial fraction (∼29%) of TECs retained σ70 throughout the early phase of elongation. This fraction depended on the initially transcribed sequence: a –10-like sequence element directing a promoter-proximal pause on the wild-type template increased the fraction of TECs that retain σ70 over that retaining σ70 when this sequence element was mutated. Release of the retained σ70 from actively transcribing σ70TECs is slow enough that most such complexes retain σ70 until termination. TECs and σ70TECs appeared identical with respect to their elongation rates and termination efficiencies at an intrinsic terminator. However, σ70TECs but not TECs could recognize a −10-like pause element >200 bp downstream of the promoter. Although our work examined initiation from only the λ PR′ promoter, ChIP-chip data (5, 6) suggest that fractional σ70 retention during elongation might occur on many E. coli transcription units in vivo. However, those data do not distinguish between σ70 retention and σ70 rebinding to TECs [which has been demonstrated to occur in vivo (37)], nor do the data measure the fraction of TECs containing σ70.
Several prior studies that examined the σ70 content of TECs stalled very early in elongation, after the synthesis of ≤50 nt of RNA, concluded that a variable fraction, 20–100%, of TECs retain σ70 (16, 26–28). It is difficult to quantitatively compare those results to ours. In particular, because the earlier studies examined artificially stalled complexes, it was not always clear whether detected σ70 release occurred during promoter escape, during the brief period of active elongation or after stalling (which was in some cases accompanied by RNAP backtracking). Our study bypasses this ambiguity by examining actively elongating complexes in real time. The kinetics of the dissociation of σ70TECs we see after the first phase of elongation are consistent with a low, constant probability of release per unit time (Fig. 2B). Furthermore, the rate of σ70 dissociation from active TECs we measured is more than 10-fold faster than was observed previously for σ70 dissociation from stalled TECs under similar conditions (28). This finding suggests that σ70TECs undergoing elongation enter states more prone to σ70 release than are stalled σ70TECs, highlighting the importance of characterizing actively elongating TECs.
In another previous study (25), stalled TECs with σ70 stably bound were characterized after anti-TEC affinity immobilization; it is unclear whether or not this isolated TEC species corresponds to the σ70TECs in steady-state elongation that we studied. However, those complexes displayed normal elongation rates and termination efficiencies when restarted, similar to the results we obtained observing σ70TECs during steady-state elongation.
The structure of the σ70TEC has not been directly characterized. Nevertheless, we can make some educated guesses about its features (see ref. 9 and references cited therein). In the σ70 holoenzyme structure, σ70 region 3.2 interacts with core RNAP in such a way to obstruct the RNA exit channel; thus, this interaction is likely absent in the σ70TEC, in which the exit channel is occupied with RNA. In addition, an interaction between σ70 region 4 and core RNAP that is required for recognition of the promoter –35 element is likely absent in the σ70TEC, also because of clashes with the nascent RNA. In contrast, the interaction of σ70 region 2 with core RNAP that is seen in the holoenzyme and open complex structures is likely to be present in σ70TECs, because this interaction is presumed necessary for the recognition of the distal σ70-dependent pause element that we observe.
In our experiments, the majority of complexes release σ70 before transcript probe arrival (which occurs after synthesis of ∼870 nt of RNA). Our experiments do not address the question of whether this release occurs during promoter escape or from early TECs. Although we observe that a sequence element near the promoter can alter the amount of early release, we cannot exclude the possibility that other factors (e.g., posttranslational modification of a fraction of RNAP molecules; see refs. 25 and 34) might also influence the retention of σ70 before transcript probe arrival.
For TECs free to diffuse in solution, it is well established that the RNA transcript loses its association with the template DNA within seconds of successful termination at intrinsic terminators (32, 33). Less is known about dissociation of RNAP from the template upon termination (38). We see a significant number of retained σ70 subunits depart from the template simultaneously with RNA dissociation, consistent with RNAP dissociation from DNA at the terminator (Fig. 2A, purple bar). Interestingly, we see that many more [31/(31 + 11) = 74%; Fig. 2A] of the σ70 subunits that were retained on a TEC up to the point of termination then persist on the template, typically for hundreds of seconds, following probe departure (Fig. S1 A–F). This is an unexpected result. The simplest interpretation of these data is that σ70RNAP holoenzyme often remains associated with template DNA after termination under the conditions of these experiments, raising the possibility that this species might be able to reinitiate on a nearby promoter. An optical trapping study (33) detected efficient rapid release of core RNAP from template DNA upon termination; the apparent discrepancy between that result and our observation of kinetically stable association may arise from the application of force (3 pN or more) to the RNAP–DNA linkage by the optical trap in the former experiment.
Does the lengthy σ70 retention within TECs that we observe in vitro also occur in living cells? In principle, other proteins present in cells (but not present in our experiments in vitro) might bind to σ70TECs and accelerate σ70 release (e.g., by forming a ternary complex with the σ70TEC). However, several lines of evidence suggest that transcription complexes in living cells exhibit behaviors that correspond to the phenomena we observe in vitro: (i) genome-wide ChIP-chip experiments (4, 6, 8) detected a low level of σ70 on many transcription units, and the level did not change systematically beyond the peak at the transcription start site; (ii) TECs initiated from λ PR′ in vivo exhibited σ70 ChIP that was suppressed by the same promoter-proximal pause element mutations that we observe suppress σ70 retention in vitro (7); and (iii) recognition of downstream –10-like pause elements in vivo (7) was ablated by the same mutations, paralleling our observations in vitro that recognition of these pause elements is restricted to σ70TECs.
It is currently uncertain why the mutations that abolish the promoter proximal pause also greatly reduce the fraction of TECs that retain σ70. One of a number of possible hypotheses is that pausing provides time to form new, stabilizing σ70–transcription complex interactions that are not present in promoter complexes. Another is that pausing itself is irrelevant to σ70 retention: it may be that the mutations disrupt a sequence element in the nascent RNA that binds directly to σ70 and inhibits its dissociation during early elongation.
Taken in the context of previous results, our observations suggest that σ70 can maintain a kinetically stable association with TECs to the end of a long transcription unit and that such transcription units are thus transcribed by at least two subpopulations of elongation complexes with distinct subunit compositions and functional properties, similar to the well-established examples of the stably bound phage antitermination complexes (10, 12, 14, 24). With the antitermination complexes, the biological role of an augmented TEC is well established, whereas the biological function of σ70 retention within at least a subset of TECs distal from the start site is not clearly established. Although the presence of σ70 within TECs induces the recognition of promoter-distal –10-like pause elements, the regulatory role of such pausing remains speculative. Nevertheless, it seems likely that σ70 retention within TECs has significant regulatory consequences through its effect on the binding of other elongation factors to TECs. In particular, evidence from a variety of sources suggest that NusG and its paralog RfaH compete with σ70 for binding to TECs (6, 9, 23). These proteins have a variety of biological functions in rho-dependent termination, transcription-translation coupling, and regulating the expression of horizontally acquired genes (11, 38, 39), and these functions may be suppressed in the subpopulation of TECs with stably bound σ70. Further research will be required to test for the occurrence of this suppression and to explore its consequences.
The work presented here demonstrates a method for quantitatively characterizing the dynamics of the interaction of a transcription factor with TECs engaged in steady-state elongation. The same approach could be applied to studying other elongation factors either singly or in combination and may thus lead to new insights into the molecular mechanisms by which the mutually competing and cooperating elongation factors present in the cell collaborate to regulate gene expression.
Methods
DNA and Plasmids.
To synthesize the wild-type transcription template (Fig. S4A), we first constructed plasmid pCDW114: DNA encoding an RNA containing seven tandem repeats of the 21-bp transcript probe target site (5′-AGA CAC CAC AGA CCA CAC ACA-3′) and flanked by restriction sites BamH1 and Sph1 was synthesized by GenScript. The multiple repeats of the transcript probe site were included to increase the rate of probe hybridization to nascent RNA (3). This construct was introduced into the pFW11 Tet plasmid (40) along with the λ PR′ promoter/initial transcribed region (−109 to +21 with respect to the PR′ transcription start site), a segment of the E. coli rpoB coding sequence (+577 to +2,399 with respect to the start codon), and the λ tR2 terminator (+49 to +232 with respect to the PR′ transcription start site) using standard cloning techniques. The same approach was used to make pCDW115, which was identical except that it contained the proximal pause ablation mutations (Fig. S4B). The distal pause and terminator insertion plasmids pTH07 and pTH09 (Fig. S4 C and D) were constructed with Gibson Assembly Master Mix (New England BioLabs) using synthetic DNA and PCR products amplified from pCDW114. All four plasmid inserts (GenBank accession nos. KT326913, KT326914, KT326915, and KT326916) were verified by sequencing. Each transcription template (Fig. S4) was prepared by PCR from the corresponding plasmid with an upstream primer 5′-/5Biosg/CCT ATA AAA ATA GGC GTA TCA CGA G-3′ and a downstream primer 5′-/AF488/AGA TAT CGC AGA AAG GCC CAC CCG AAG GTG AGC CAG TGT GAT TAC CAG GGT TTT CCC AGT CAC GAC CTT G-3′ containing the T7 Te terminator sequence (italics). The 20-nt Cy3-labeled probe oligonucleotide and all primer end modifications were previously described (3).
Proteins.
An N-terminal His6-tagged single-cysteine derivative of E. coli σ70 (C132S C291S C295S S366C; see ref. 41) was expressed in pRPODS366C Rosetta 2(DE3) cells, denatured in 6 M urea, and purified as described in ref. 42, except for the following modifications: Ni-affinity chromatography was done at 4 °C over a 5-mL HisTRAP column (General Electric) charged according to the manufacturer’s instructions. The protein was eluted with a linear imidazole gradient from 10 to 500 mM over 40 mL in binding buffer [20 mM Tris⋅OAc (pH 8.0), 250 mM NaCl, and 50 µM Tris⋅2-carboxyethyl phosphine hydrochloride] with 6 M urea at a flow rate of 0.5 mL min−1. The protein was refolded by sequential 1-h dialyses against 3, 1.5, 0.75, 0.32, 0.18, and 0 M urea in binding buffer and labeled with Cy5–maleimide dye. Cy5–σ70RNAP holoenzyme was prepared by incubating 2.6 µM Cy5–σ70 and 1.3 µM core RNAP (Epicenter) in 50% wt/vol glycerol, 20 mM Tris⋅HCl (pH 8.0), 250 mM NaCl, 0.1 mM EDTA, 0.1 mM DTT at 37 °C for 10 min and then stored at −20 °C for up to 3 h before use.
Transcription Experiments.
Single-molecule total internal reflection fluorescence microscopy was performed at excitation wavelengths 488, 532, and 633 nm for observation of AF488–DNA template, Cy3-transcript probe, and Cy5–σ70, respectively, as described (3); focus was automatically maintained as described (43). Transcription reactions were observed in glass flow chambers (volume, ∼20 µL) passivated with succinimidyl (NHS) polyethylene glycol (PEG) and NHS-PEG-biotin (Laysan Bio) as described (3). Streptavidin (no. 21125; Life Technologies) was introduced at 220 nM in wash buffer [50 mM Tris⋅OAc, 100 mM KOAc, 8 mM MgOAc, 27 mM NH4OAc, 0.1 mg mL−1 BSA (pH 8.0) (no. 126615; EMB Chemicals)], incubated for 45 s, and washed out (this and all subsequent washout steps used two flushes each of four chamber volumes of wash buffer). The chamber was then incubated with 50 pM AF488–DNA in wash buffer for ∼2 min and washed out. Next, locations of surface-tethered AF488–DNA molecules were recorded by acquiring four 1-s images with 488-nm excitation at a power of 350 µW incident to the objective lens (43). Cy5–σ70RNAP was then introduced at 1.9 nM in transcription buffer [wash buffer supplemented with 3.5% wt/vol PEG 8000 (no. 81268; Sigma-Aldrich), 1 mg mL−1 BSA, and an O2-scavenging system (29)], incubated for ∼10 min, and washed out. Finally, we started continuous image acquisition (1-s exposure every 1.0, 8.7, or 15.7 s to simultaneous 532- and 633-nm excitation, each at 200 µW) and initiated transcription by introducing transcription buffer supplemented with 500 µM each of ATP, CTP, GTP, and UTP and 10 nM Cy3–probe.
Data Analysis.
Image analysis was done using custom software and algorithms for automatic spot detection, spatial drift correction, and colocalization as described (44). To measure the apparent σ70TEC dissociation rate constant kapp (Fig. 2B and Fig. S6), we used the method of Ensign and Pande (45) to jointly fit the measured lifetimes of Cy5–σ70TECs that terminated by disappearance of the Cy5 spot and those that were censored by transcription termination (i.e., disappearance of the Cy3–probe spot) using the maximum likelihood algorithm. To calculate the fit curve in Fig. 2B, we performed 100,000 Monte Carlo simulations in which exponentially distributed lifetimes with mean equal to the reciprocal of kapp were each assigned an observation window length by random sampling from the distribution of observed transcript probe lifetimes (Fig. S2A); when the window length was less than the corresponding lifetime, the latter was truncated to the window length to mimic the censoring of the experimental data.
The average E. coli transcription unit length was estimated from a search of the EcoCyc database (www.biocyc.org) for all transcription units in the E. coli K-12 genome. The search yielded 3,541 transcription units with a broad distribution of lengths: 1,700 ± 1,600 bp (SD).
Acknowledgments
We thank members of the R.L., Block, J.K., and J.G. laboratories for insightful discussion. This work was supported by NIH Grants R01GM81648, R01GM44025, and R01GM38660; NSF Grant DMR1206146; and a grant from the G. Harold and Leila Y. Mathers Foundation.
Footnotes
The authors declare no conflict of interest.
This article is a PNAS Direct Submission.
Data deposition: The sequences reported in this paper have been deposited in the GenBank database (accession nos. KT326913–KT326916).
This article contains supporting information online at www.pnas.org/lookup/suppl/doi:10.1073/pnas.1513899113/-/DCSupplemental.
References
- 1.Blombach F, et al. Archaeology of RNA polymerase: Factor swapping during the transcription cycle. Biochem Soc Trans. 2013;41(1):362–367. doi: 10.1042/BST20120274. [DOI] [PubMed] [Google Scholar]
- 2.Gross CA, et al. The functional and regulatory roles of sigma factors in transcription. Cold Spring Harb Symp Quant Biol. 1998;63:141–155. doi: 10.1101/sqb.1998.63.141. [DOI] [PubMed] [Google Scholar]
- 3.Friedman LJ, Gelles J. Mechanism of transcription initiation at an activator-dependent promoter defined by single-molecule observation. Cell. 2012;148(4):679–689. doi: 10.1016/j.cell.2012.01.018. [DOI] [PMC free article] [PubMed] [Google Scholar]
- 4.Reppas NB, Wade JT, Church GM, Struhl K. The transition between transcriptional initiation and elongation in E. coli is highly variable and often rate limiting. Mol Cell. 2006;24(5):747–757. doi: 10.1016/j.molcel.2006.10.030. [DOI] [PubMed] [Google Scholar]
- 5.Raffaelle M, Kanin EI, Vogt J, Burgess RR, Ansari AZ. Holoenzyme switching and stochastic release of sigma factors from RNA polymerase in vivo. Mol Cell. 2005;20(3):357–366. doi: 10.1016/j.molcel.2005.10.011. [DOI] [PubMed] [Google Scholar]
- 6.Mooney RA, et al. Regulator trafficking on bacterial transcription units in vivo. Mol Cell. 2009;33(1):97–108. doi: 10.1016/j.molcel.2008.12.021. [DOI] [PMC free article] [PubMed] [Google Scholar]
- 7.Deighan P, Pukhrambam C, Nickels BE, Hochschild A. Initial transcribed region sequences influence the composition and functional properties of the bacterial elongation complex. Genes Dev. 2011;25(1):77–88. doi: 10.1101/gad.1991811. [DOI] [PMC free article] [PubMed] [Google Scholar]
- 8.Wade JT, Struhl K. Association of RNA polymerase with transcribed regions in Escherichia coli. Proc Natl Acad Sci USA. 2004;101(51):17777–17782. doi: 10.1073/pnas.0404305101. [DOI] [PMC free article] [PubMed] [Google Scholar]
- 9.Mooney RA, Darst SA, Landick R. Sigma and RNA polymerase: An on-again, off-again relationship? Mol Cell. 2005;20(3):335–345. doi: 10.1016/j.molcel.2005.10.015. [DOI] [PubMed] [Google Scholar]
- 10.Roberts JW, et al. Antitermination by bacteriophage lambda Q protein. Cold Spring Harb Symp Quant Biol. 1998;63:319–325. doi: 10.1101/sqb.1998.63.319. [DOI] [PubMed] [Google Scholar]
- 11.Shankar S, Hatoum A, Roberts JW. A transcription antiterminator constructs a NusA-dependent shield to the emerging transcript. Mol Cell. 2007;27(6):914–927. doi: 10.1016/j.molcel.2007.07.025. [DOI] [PMC free article] [PubMed] [Google Scholar]
- 12.Ring BZ, Yarnell WS, Roberts JW. Function of E. coli RNA polymerase sigma factor sigma 70 in promoter-proximal pausing. Cell. 1996;86(3):485–493. doi: 10.1016/s0092-8674(00)80121-x. [DOI] [PubMed] [Google Scholar]
- 13.Ring BZ, Roberts JW. Function of a nontranscribed DNA strand site in transcription elongation. Cell. 1994;78(2):317–324. doi: 10.1016/0092-8674(94)90300-x. [DOI] [PubMed] [Google Scholar]
- 14.Nickels BE, Roberts CW, Sun H, Roberts JW, Hochschild A. The σ(70) subunit of RNA polymerase is contacted by the (λ)Q antiterminator during early elongation. Mol Cell. 2002;10(3):611–622. doi: 10.1016/s1097-2765(02)00648-2. [DOI] [PubMed] [Google Scholar]
- 15.Nickels BE, Roberts CW, Roberts JW, Hochschild A. RNA-mediated destabilization of the σ(70) region 4/β flap interaction facilitates engagement of RNA polymerase by the Q antiterminator. Mol Cell. 2006;24(3):457–468. doi: 10.1016/j.molcel.2006.09.014. [DOI] [PMC free article] [PubMed] [Google Scholar]
- 16.Nickels BE, Mukhopadhyay J, Garrity SJ, Ebright RH, Hochschild A. The σ 70 subunit of RNA polymerase mediates a promoter-proximal pause at the lac promoter. Nat Struct Mol Biol. 2004;11(6):544–550. doi: 10.1038/nsmb757. [DOI] [PubMed] [Google Scholar]
- 17.Brodolin K, Zenkin N, Mustaev A, Mamaeva D, Heumann H. The σ 70 subunit of RNA polymerase induces lacUV5 promoter-proximal pausing of transcription. Nat Struct Mol Biol. 2004;11(6):551–557. doi: 10.1038/nsmb768. [DOI] [PubMed] [Google Scholar]
- 18.Hatoum A, Roberts J. Prevalence of RNA polymerase stalling at Escherichia coli promoters after open complex formation. Mol Microbiol. 2008;68(1):17–28. doi: 10.1111/j.1365-2958.2008.06138.x. [DOI] [PMC free article] [PubMed] [Google Scholar]
- 19.Perdue SA, Roberts JW. Σ(70)-dependent transcription pausing in Escherichia coli. J Mol Biol. 2011;412(5):782–792. doi: 10.1016/j.jmb.2011.02.011. [DOI] [PubMed] [Google Scholar]
- 20.Gill SC, Weitzel SE, von Hippel PH. Escherichia coli σ 70 and NusA proteins. I. Binding interactions with core RNA polymerase in solution and within the transcription complex. J Mol Biol. 1991;220(2):307–324. doi: 10.1016/0022-2836(91)90015-x. [DOI] [PubMed] [Google Scholar]
- 21.Ha KS, Toulokhonov I, Vassylyev DG, Landick R. The NusA N-terminal domain is necessary and sufficient for enhancement of transcriptional pausing via interaction with the RNA exit channel of RNA polymerase. J Mol Biol. 2010;401(5):708–725. doi: 10.1016/j.jmb.2010.06.036. [DOI] [PMC free article] [PubMed] [Google Scholar]
- 22.Mooney RA, Landick R. Tethering σ70 to RNA polymerase reveals high in vivo activity of σ factors and σ70-dependent pausing at promoter-distal locations. Genes Dev. 2003;17(22):2839–2851. doi: 10.1101/gad.1142203. [DOI] [PMC free article] [PubMed] [Google Scholar]
- 23.Sevostyanova A, Svetlov V, Vassylyev DG, Artsimovitch I. The elongation factor RfaH and the initiation factor sigma bind to the same site on the transcription elongation complex. Proc Natl Acad Sci USA. 2008;105(3):865–870. doi: 10.1073/pnas.0708432105. [DOI] [PMC free article] [PubMed] [Google Scholar]
- 24.Marr MT, Datwyler SA, Meares CF, Roberts JW. Restructuring of an RNA polymerase holoenzyme elongation complex by lambdoid phage Q proteins. Proc Natl Acad Sci USA. 2001;98(16):8972–8978. doi: 10.1073/pnas.161253298. [DOI] [PMC free article] [PubMed] [Google Scholar]
- 25.Bar-Nahum G, Nudler E. Isolation and characterization of σ(70)-retaining transcription elongation complexes from Escherichia coli. Cell. 2001;106(4):443–451. doi: 10.1016/s0092-8674(01)00461-5. [DOI] [PubMed] [Google Scholar]
- 26.Shimamoto N, Kamigochi T, Utiyama H. Release of the σ subunit of Escherichia coli DNA-dependent RNA polymerase depends mainly on time elapsed after the start of initiation, not on length of product RNA. J Biol Chem. 1986;261(25):11859–11865. [PubMed] [Google Scholar]
- 27.Mukhopadhyay J, et al. Translocation of σ(70) with RNA polymerase during transcription: Fluorescence resonance energy transfer assay for movement relative to DNA. Cell. 2001;106(4):453–463. doi: 10.1016/s0092-8674(01)00464-0. [DOI] [PubMed] [Google Scholar]
- 28.Kapanidis AN, et al. Retention of transcription initiation factor σ70 in transcription elongation: Single-molecule analysis. Mol Cell. 2005;20(3):347–356. doi: 10.1016/j.molcel.2005.10.012. [DOI] [PubMed] [Google Scholar]
- 29.Friedman LJ, Chung J, Gelles J. Viewing dynamic assembly of molecular complexes by multi-wavelength single-molecule fluorescence. Biophys J. 2006;91(3):1023–1031. doi: 10.1529/biophysj.106.084004. [DOI] [PMC free article] [PubMed] [Google Scholar]
- 30.Leibman M, Hochschild A. A sigma-core interaction of the RNA polymerase holoenzyme that enhances promoter escape. EMBO J. 2007;26(6):1579–1590. doi: 10.1038/sj.emboj.7601612. [DOI] [PMC free article] [PubMed] [Google Scholar]
- 31.Reynolds R, Bermúdez-Cruz RM, Chamberlin MJ. Parameters affecting transcription termination by Escherichia coli RNA polymerase. I. Analysis of 13 rho-independent terminators. J Mol Biol. 1992;224(1):31–51. doi: 10.1016/0022-2836(92)90574-4. [DOI] [PubMed] [Google Scholar]
- 32.Yin H, Artsimovitch I, Landick R, Gelles J. Nonequilibrium mechanism of transcription termination from observations of single RNA polymerase molecules. Proc Natl Acad Sci USA. 1999;96(23):13124–13129. doi: 10.1073/pnas.96.23.13124. [DOI] [PMC free article] [PubMed] [Google Scholar]
- 33.Larson MH, Greenleaf WJ, Landick R, Block SM. Applied force reveals mechanistic and energetic details of transcription termination. Cell. 2008;132(6):971–982. doi: 10.1016/j.cell.2008.01.027. [DOI] [PMC free article] [PubMed] [Google Scholar]
- 34.Tolić-Nørrelykke SF, Engh AM, Landick R, Gelles J. Diversity in the rates of transcript elongation by single RNA polymerase molecules. J Biol Chem. 2004;279(5):3292–3299. doi: 10.1074/jbc.M310290200. [DOI] [PubMed] [Google Scholar]
- 35.Schafer DA, Gelles J, Sheetz MP, Landick R. Transcription by single molecules of RNA plolymerase observed by light microscopy. Nature. 1991;352(6334):444–448. doi: 10.1038/352444a0. [DOI] [PubMed] [Google Scholar]
- 36.Kröger M, Hobom G. A chain of interlinked genes in the ninR region of bacteriophage lambda. Gene. 1982;20(1):25–38. doi: 10.1016/0378-1119(82)90084-1. [DOI] [PubMed] [Google Scholar]
- 37.Goldman SR, Nair NU, Wells CD, Nickels BE, Hochschild A. The primary sigma factor in Escherichia coli can access the transcription elongation complex from solution in vivo. eLife. 2015;4:e10514. doi: 10.7554/eLife.10514. [DOI] [PMC free article] [PubMed] [Google Scholar]
- 38.Peters JM, Vangeloff AD, Landick R. Bacterial transcription terminators: The RNA 3′-end chronicles. J Mol Biol. 2011;412(5):793–813. doi: 10.1016/j.jmb.2011.03.036. [DOI] [PMC free article] [PubMed] [Google Scholar]
- 39.Peters JM, et al. Rho and NusG suppress pervasive antisense transcription in Escherichia coli. Genes Dev. 2012;26(23):2621–2633. doi: 10.1101/gad.196741.112. [DOI] [PMC free article] [PubMed] [Google Scholar]
- 40.Whipple FW. Genetic analysis of prokaryotic and eukaryotic DNA-binding proteins in Escherichia coli. Nucleic Acids Res. 1998;26(16):3700–3706. doi: 10.1093/nar/26.16.3700. [DOI] [PMC free article] [PubMed] [Google Scholar]
- 41.Callaci S, Heyduk E, Heyduk T. Conformational changes of Escherichia coli RNA polymerase σ70 factor induced by binding to the core enzyme. J Biol Chem. 1998;273(49):32995–33001. doi: 10.1074/jbc.273.49.32995. [DOI] [PubMed] [Google Scholar]
- 42.Panaghie G, Aiyar SE, Bobb KL, Hayward RS, de Haseth PL. Aromatic amino acids in region 2.3 of Escherichia coli σ 70 participate collectively in the formation of an RNA polymerase-promoter open complex. J Mol Biol. 2000;299(5):1217–1230. doi: 10.1006/jmbi.2000.3808. [DOI] [PubMed] [Google Scholar]
- 43.Crawford DJ, Hoskins AA, Friedman LJ, Gelles J, Moore MJ. Visualizing the splicing of single pre-mRNA molecules in whole cell extract. RNA. 2008;14(1):170–179. doi: 10.1261/rna.794808. [DOI] [PMC free article] [PubMed] [Google Scholar]
- 44.Friedman LJ, Gelles J. Multi-wavelength single-molecule fluorescence analysis of transcription mechanisms. Methods. 2015;86:27–36. doi: 10.1016/j.ymeth.2015.05.026. [DOI] [PMC free article] [PubMed] [Google Scholar]
- 45.Ensign DL, Pande VS. Bayesian single-exponential kinetics in single-molecule experiments and simulations. J Phys Chem B. 2009;113(36):12410–12423. doi: 10.1021/jp903107c. [DOI] [PubMed] [Google Scholar]
- 46.May PFJ, et al. Tethered fluorophore motion: Studying large DNA conformational changes by single-fluorophore imaging. Biophys J. 2014;107(5):1205–1216. doi: 10.1016/j.bpj.2014.07.024. [DOI] [PMC free article] [PubMed] [Google Scholar]


