

Abstract
Sirtuin 1 (SIRT1) is a nicotinamide adenine dinucleotide-dependent deacetylase, and its dysregulation can lead to ageing, diabetes, and cancer. From 346 experimentally confirmed SIRT1 inhibitors, an inhibitor structure pattern was generated by inductive logic programming (ILP) with DMax Chemistry Assistant software. The pattern contained amide, amine, and hetero-aromatic five-membered rings, each of which had a hetero-atom and an unsubstituted atom at a distance of 2. According to this pattern, a ligand-based virtual screening of 1 444 880 active compounds from Chinese herbs identified 12 compounds as inhibitors of SIRT1. Three compounds (ZINC08790006, ZINC08792229, and ZINC08792355) had high affinity (−7.3, −7.8, and −8.6 kcal/mol, respectively) for SIRT1 as estimated by molecular docking software AutoDock Vina. This study demonstrated a use of ILP and background knowledge in machine learning to facilitate virtual screening.
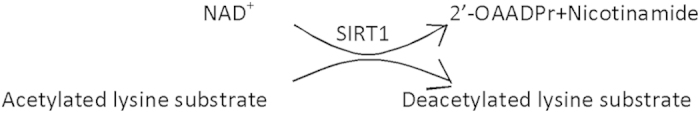
Sirtuin 1 (SIRT1) is a nicotinamide adenine dinucleotide (NAD+)-dependent histone deacetylase with an anti-ageing function1. Figure 1 shows the catalytic process between SIRT1 and its substrates (some non-histones or histones)2,3,4,5. Through this deacetylation process, SIRT1 is involved in various cellular processes including cell proliferation, cellular responses, DNA repair, and cell apoptosis2,3,4,5. SIRT1 is a potential therapeutic target for type 2 diabetes and cancer1,6. Thus, specific SIRT1 ligands with biological activities may help to delineate the molecular relationship of SIRT1 to type 2 diabetes and cancer. A variety of SIRT1 ligands with binding specificity have already been reported. Specific SIRT1 inhibitors include tenovins7 and EX-5278, while SIRT1 activators include SRT1720, SRT2183, and SRT1460, although they might activate SIRT1 indirectly9. Further SIRT1 ligands still need to be discovered from natural products.
Figure 1. A reaction catalysed by SIRT1.
High-throughput screening (HTS) has been used to develop novel SIRT1 inhibitors10,11 and activators11,12,13. It was estimated that about 60 million chemical structures are available for HTS, but only 1% of these structures have been screened for SIRT1 activators13,14. Cost-effective ligand-based virtual screening (VS) would be a good option for identifying potential compounds in silico before HTS15. Even if the experimental information for compounds is scanty, VS can still accelerate the identification and optimisation of candidate compounds16,17. In this ligand-based VS study, inductive logic programming (ILP) was used to develop molecular search patterns, and molecular docking was performed to estimate the binding affinities of potential SIRT1 ligands. ILP can consider specific characteristics of compounds and human-generated rules as background knowledge to outperform traditional approaches18.
The objective of the present study was to construct quantitative structure–activity relationship (QSAR) models19 of SIRT1 ligands for VS15 of 1 444 880 chemical structures collected from two major active compound databases, i.e. Traditional Chinese Medicines@Taiwan Database20 and Traditional Chinese Medicine Integrated Database21. The molecular search results were validated by molecular docking using AutoDock Vina software22.
Results and Discussion
Selection and characteristics of studies
A total of 1010 studies were retrieved from PubMed and ScienceDirect. After excluding 178 duplicates, the abstracts and full texts of the remaining 832 studies were screened and 36 eligible studies7,10,11,12,23,24,25,26,27,28,29,30,31,32,33,34,35,36,37,38,39,40,41,42,43,44,45,46,47,48,49,50,51,52,53,54. were included according to the study selection criteria. The flow diagram of the study selection is shown in Fig. 2.
Figure 2. Flow diagram of the literature search and study selection.

As shown in Table 1, the eligible studies were published in the years between 2005 and 2013. There were 33 studies on SIRT1 inhibitors, two studies on SIRT1 activators, and one study on both activators and inhibitors. The three studies12,19,37 on SIRT1 activators employed HTS, which seemed to be the available approach in practice to screen for potential SIRT1 activators.
Table 1. Characteristics of eligible studies.
| First author | Year | Bioassay | Substrate | Number | Target | Ligand type |
|---|---|---|---|---|---|---|
| Alvala | 2012 | fluorimetric assay | residues 379–382 of p53 (Arg-His-Lys-Lys (Ac)) | 8 | SIRT1 | inhibitor |
| Amagata | 2012 | fluorimetric assay | Arg-His-Lys-Lys (epsilon-acetyl)-AMC | 2 | SIRT1,SIRT2 | inhibitor |
| Asaba | 2008 | fluorimetric assay | residues 379–382 of p53 (Arg-His-Lys-Lys (Ac)) | 24 | SIRT1 | inhibitor |
| Bemis | 2009 | unspecified | unspecified | 30 | SIRT1 | activator |
| Disch | 2013 | mass spectrometry assay | Ac-RHKKAcW-NH2 | 37 | SIRT1,SIRT2,SIRT3 | inhibitor |
| Freitag | 2011 | fluorimetric assay | ZMAL | 6 | SIRT1,SIRT2,SIRT3 | inhibitor |
| Hirsch | 2011 | HPLC | H2NHK-AcK-LM-COOH | 3 | SIRT1,SIRT2,SIRT3 | inhibitor |
| Huber | 2010 | fluorimetric assay | ZMAL | 2 | SIRT1,SIRT2,SIRT3 | inhibitor |
| Huhtiniemi | 2010 | fluorimetric assay | residues 379–382 of p53 (Arg-His-Lys-Lys (Ac)) | 14 | SIRT1,SIRT2 | inhibitor |
| Huhtiniemi | 2011 | fluorimetric assay | residues 379–382 of p53 (Arg-His-Lys-Lys (Ac)) | 20 | SIRT1,SIRT2 | inhibitor |
| Huhtiniemi | 2008 | Microplate filtration assay | residues 379–382 of p53 (Arg-His-Lys-Lys (Ac)) | 5 | SIRT1,SIRT2 | inhibitor |
| Kalle | 2010 | fluorimetric assay | residues 379–382 of p53 (Arg-His-Lys-Lys (Ac)) | 1 | SIRT1 | inhibitor |
| Kiviranta | 2007 | fluorimetric assay | residues 379–382 of p53 (Arg-His-Lys-Lys (Ac)) | 3 | SIRT1,SIRT2 | inhibitor |
| Kiviranta | 2009 | fluorimetric assay | residues 379–382 of p53 (Arg-His-Lys-Lys (Ac)) | 23 | SIRT1,SIRT2 | inhibitor |
| Mai | 2005 | fluorimetric assay | residues 379–382 of p53 (Arg-His-Lys-Lys (Ac)) | 4 | Sir2,SIRT1,SIRT2 | inhibitor |
| Mai | 2009 | fluorimetric assay | unspecified | 2 | SIRT1,SIRT2,SIRT3 | activator, inhibitor |
| Manjulatha | 2012 | fluorimetric assay | residues 379–382 of p53 (Arg-His-Lys-Lys (Ac)) | 2 | SIRT1 | inhibitor |
| McCarthy | 2012 | fluorimetric assay | residues 379–382 of p53 (Arg-His-Lys-Lys (Ac)) | 22 | SIRT1,SIRT2 | inhibitor |
| Medda | 2009 | fluorimetric assay | residues 379–382 of p53 (Arg-His-Lys-Lys (Ac)) | 8 | SIRT1,SIRT2 | inhibitor |
| Napper | 2005 | fluorimetric assay | residues 379–382 of p53 (Arg-His-Lys-Lys (Ac)) | 24 | SIRT1 | inhibitor |
| Pasco | 2010 | fluorimetric assay | residues 379–382 of p53 (Arg-His-Lys-Lys (Ac)) | 12 | SIRT1,SIRT2 | inhibitor |
| Pesnot | 2011 | fluorimetric assay | ZMAL | 1 | SIRT1,SIRT2 | inhibitor |
| Rotili | 2011 | fluorimetric assay | residues 379–382 of p53 (Arg-His-Lys-Lys (Ac)) | 6 | SIRT1,SIRT2 | inhibitor |
| Rotili | 2012 | fluorimetric assay | residues 379–382 of p53 (Arg-His-Lys-Lys (Ac)) | 14 | SIRT1,SIRT2 | inhibitor |
| Sanders | 2009 | fluorimetric assay | residues 379–382 of p53 (Arg-His-Lys-Lys (Ac)) | 14 | Hst2,SIRT1 | inhibitor |
| Suzuki | 2009 | fluorimetric assay | residues 379–382 of p53 (Arg-His-Lys-Lys (Ac)) | 2 | SIRT1,SIRT2,SIRT3 | inhibitor |
| Suzuki | 2009 | fluorimetric assay | residues 379–382 of p53 (Arg-His-Lys-Lys (Ac)) | 10 | SIRT1 | inhibitor |
| Suzuki | 2006 | fluorimetric assay | residues 379–382 of p53 (Arg-His-Lys-Lys (Ac)) | 10 | SIRT1 | inhibitor |
| Suzuki | 2012 | fluorimetric assay | residues 379–382 of p53 (Arg-His-Lys-Lys (Ac)) | 68 | SIRT1,SIRT2 | inhibitor |
| Tavares | 2009 | fluorimetric assay | unspecified | 12 | Sir2,SIRT1 | inhibitor |
| Trapp | 2006 | fluorimetric assay/scintillation | ZMAL | 4 | SIRT1,SIRT2 | inhibitor |
| Trapp | 2007 | fluorimetric assay | ZMAL | 19 | SIRT1,SIRT2 | inhibitor |
| Uciechowska | 2008 | fluorimetric assay | ZMAL | 7 | SIRT1,SIRT2 | inhibitor |
| Vu | 2009 | Mass Spectrometry Assay | derived from the sequence of p53 | 25 | SIRT1 | activator |
| Wu | 2013 | fluorimetric assay | Ac-RHKKAc-AMC | 22 | SIRT1 | inhibitor |
| Zhang | 2009 | fluorimetric assay | unspecified | 1 | SIRT1,SIRT2, SIRT3 | inhibitor |
Selection of ligands for modelling
A total of 482 compounds were identified from the 36 eligible studies. After removing 74 duplicates, the remaining 408 compounds were identified to be 354 inhibitors (Table S1) and 54 activators (Table S2). Three of the 54 activators lacked bioactivity data (i.e. EC50 and MA), and were not used for machine learning in activator model construction. According to PubChem55, a compound with an inhibitory effect had an IC50 below 50. Therefore, the 354 inhibitors were classified into three groups: 169 compounds were not significantly inhibitory (IC50 > 50, i.e. outcome = “unspecified” in Table S1); 179 were inhibitory (IC50 < 50, i.e. outcome = “active” in Table S1); and 6 had inconsistent outcomes in different studies (IC50 ≥ 50 in some studies and IC50 < 50 in other studies). Two compounds (SI27 and SI111) from the 169 compounds with implausible IC50 and six compounds with inconsistent outcomes were excluded from machine learning. According to PubChem55, 96 of the 179 inhibitor compounds were known to be inhibitors of both SIRT1 and SIRT2, possibly targeting the same catalytic core structure56.
Model generation
Activator model. An activator model was built from 54 activators by setting “rank low” and EC50 < 2.15 as the cut-off criteria. As the area under the receiver-operating characteristic (ROC) curve (AUC) was only 0.67 and only a limited number of activators from three studies were available for modelling, the generated model would not be unbiased. Therefore, we did not use the activator model for further screening and focused on screening for inhibitors.
Inhibitor model. A total of 346 inhibitors were used to construct the inhibitor model, for which we performed a three-fold cross-validation. N1 inhibitors were randomly selected from the 346 inhibitors to construct a learning dataset, and the remaining N2 inhibitors were used as a testing dataset. The generated inhibitor model (hypotheses) suggested that inhibitors with specific structures containing two benzene rings and amine may have high IC50 values (P = 1.32 × 10⁻⁴, Table S3) and that inhibitors with specific structures containing amine, amide, and hetero-aromatic five-membered rings may have low IC50 values (P = 1.16 × 10⁻⁴, Table S3). The reference compound structures for these two hypotheses are shown in Fig. 3a,b, respectively.
Figure 3. Reference structures and performance of the inhibitor model.

(a) Reference structures of inhibitors with high IC50 values. (b) Reference structures of inhibitors with low IC50 values. (c) Predicted–actual scatter diagram of the inhibitor model. (d) Cumulative response curve of the inhibitor model, showing the percentage of hits (y-axis) within the first n percent of data (x-axis). (e) Lift curve of the inhibitor model, showing observation from the first top n percent of data about how many times the model outperformed a random model (y-axis). (f) ROC curve of the inhibitor model, showing the percentage of non-hits (x-axis: false alarms) to obtain a particular percentage of hits.
Under the cut-off criteria of “rank low” and IC50 < 50, the AUC, the root mean square error (RMSE), Pearson correlation coefficient (r), and Spearman’s rank correlation coefficient (rho) of the model were satisfactory at 0.86, 0.79, 0.75, and 0.74, respectively. The scatter diagram with predicted values and experimental values is shown in Fig. 3c. The cumulative response curve (Fig. 3d) and lift curve (Fig. 3e) of the inhibitor model showed better performance of the model than stochastic ranking. The ROC curve (Fig. 3f) indicated that the model was accurate in identifying inhibitors. Therefore, we applied this model to screen natural product compounds for potential inhibitors of SIRT1.
Differential model. The differential model to distinguish between activators and inhibitors was built from bioactive ligands including 54 activators and 179 inhibitors (reference to Tables S1 and S2). The model indicated that inhibitor compounds contain thioamide (P = 1.84 × 10⁻³, Table S4) and activator compounds contain nitrogen heterocyclic five-membered ring, benzene ring, and amide (P = 1.21 × 10⁻⁹, Table S4). The confusion matrix of the differential model is shown in Table S5. Table S5 provides mis-classification details, showing that the model satisfactorily distinguished between inhibitors and activators. The reference compound structure with activation activity is shown in Figure S1. The differential model did not find a reference compound structure for inhibitors. This is probably based on the fact that the available activators were too few in number and too similar in structure as counter-examples to help generalise the inhibitor structures through inductive reasoning.
Inhibitor binding model. To survey the binding energy profiles of the inhibitors, we conducted molecular docking on 178 known inhibitor compounds to estimate the inhibitor binding energy (Table S6). The binding energy between NAD+ and SIRT1, i.e. −7.1 kcal/mol, was regarded as a reference value. The binding energy information together with other required chemical information was fed in the DMax Chemistry Assistant (DCA) software18 to generate the inhibitor binding model. The generated inhibitor model suggested that compounds containing methyl, amide (thioamides, etc.), and aliphatic chains would have high binding energy (P = 0.01, Table S7) and that compounds containing two benzene rings, a general (hierarchy of moieties definition) functional group, and rings would have low binding energy (P = 6.52 × 10⁻⁴, Table S7). The reference compound structures of these two hypotheses are shown in Fig. 4a,b, respectively.
Figure 4. Reference structures of the inhibitor binding model.

(a) Reference structures of inhibitors with high binding energy. (b) Reference structures of inhibitors with low binding energy.
With the cut-off criteria of “rank low” and “binding energy <−6.0 kcal/mol”, the AUC, RMSE, r, and rho of this model were 0.9, 0.62, 0.68, and 0.67, respectively. The predicted vs. actual curve for the model is shown in Figure S2a. Sorting quality curves are shown in Figures S2b–S2d. All of these results showed a fair performance of the model.
Inhibitor affinity model. An inhibitor affinity model was generated using categorical variables and an inhibitor binding model was generated using numerical variables to investigate whether these two models were well-matched and whether the two methods were feasible for achieving the same goal, which was to find potential high-affinity compounds. Among the 178 known inhibitors shown in Table S7, only 23 compounds had binding energy lower than or equal to the reference value, which was too low to form a good model. We examined several cut-off values to divide the inhibitors into high-affinity and low-affinity compounds. Finally, −6.0 kcal/mol was regarded as the cut-off value, under which criterion high-affinity inhibitors (labelled with ‘a’) had binding energy <−6.0 kcal/mol and the others were low-affinity inhibitors (labelled with ‘b’). The affinity information together with other required chemical information was fed into the DCA software18 to generate an inhibitor affinity model with the highest model precision (78.26%), lowest P-value (3.58 × 10⁻⁴), and largest ROC (0.87) among all the attempts. The generated inhibitor affinity model suggested that compounds containing a ring, two benzene rings, and a general functional group would have high affinity (6.93 × 10⁻⁶, Table S8). The reference structures are shown in Figure S3. The model also suggested that compounds containing methyl, general amide, and aliphatic chain might have low affinity (P = 2.82 × 10⁻³, Table S8). The confusion matrix of this model is shown in Table S9, which shows that the model could separate the inhibitors of high affinity from those of low affinity.
Potential inhibitors with high affinity were investigated by two inhibitor models: the inhibitor binding model and the inhibitor affinity model. Under the cut-off criteria of “rank low” and “binding energy <−6.0 kcal/mol”, the AUC of the inhibitor binding model was 0.9 (Figure S2d), indicating its high quality of prediction. As shown in Table S7, the credibility of assuming a structure with low binding energy (i.e. high affinity) was obviously higher than the credibility of assuming a structure with high binding energy (i.e. low affinity) in the model. Under the same cut-off criterion (−6.0 kcal/mol), the inhibitor affinity model performed well (AUC = 0.87) as the inhibitor binding energy model and their characteristics were extremely well-matched (Table 2). It appeared that both of these models could be effective approaches to find potent inhibitors with low binding energy (i.e. high affinity). Integrating the results of both the binding and affinity models, we found that some ligands did have low affinity for SIRT1, but a significant inhibitory effect. This finding supported a previous study showing that SIRT1 ligands were not in simple competition with the substrate, but in a mixed-type process57. These models (Table 2) mainly covered the low-affinity inhibitors, which are acceptable for database screening purposes.
Table 2. Summary comparison of three models.
| Model | Parameter | Structural characteristics |
|---|---|---|
| Inhibitor model | inhibitory effect | amides, amines, hetero-aromatic five-membered rings |
| Inhibitor binding model | high binding energy | methyl, general amide groups, aliphatic chains |
| low binding energy | two benzene rings, a general functional group, rings | |
| Inhibitor affinity model | high affinity | a ring, two benzene rings and a general functional group |
| low affinity | methyl, general amide and aliphatic chain |
The DCA software18 only considered two-dimensional (2D) molecular structures, and could thus ignore some compounds with different 2D molecular descriptors but similar three-dimensional (3D) structural features to the bioactive compounds, e.g. SI611. The DCA software18 would also ignore the chirality of chemical compounds that may lead to differences in biological activity.
As detailed bioactivity information was not available, the inhibitor models were actually generated from multiple categories of inhibitors, which might have different action mechanisms. Further studies should be conducted as soon as the detailed bioactivity information is available.
Ligand-based virtual screening
We performed database screening with the inhibitor models and molecular docking to estimate the affinity of potential inhibitors. For the database screening, we downloaded chemical information from the Traditional Chinese Medicines@Taiwan database20 and Traditional Chinese Medicine Integrated Database21 and reconciled their format differences. We only used the inhibitor models for database screening because of their better predictive performance, as found in the model generation process. Twelve inhibitor candidates were identified by database screening based on the inhibitor models. The molecular features and binding energies of the candidates were further estimated by molecular docking (Fig. 5). Among the 12 compounds, the binding energies of three compounds (ZINC08790006, ZINC08792229, and ZINC08792355) were less than −7.1 kcal/mol and within the high-affinity range. The binding energies of the other nine compounds were between −4.8 and −6.4 kcal/mol and within the low-affinity range. The structures of the high-affinity compounds contained amide, amine, and hetero-aromatic five-membered ring, in accordance with the generated inhibitor models. The basic properties of these compounds (Table 3) obeyed Lipinski’s Rule of Five58, except for the large molecular weight and LogP3 value of compound ZINC08792355. As the numbers of H-bond donors and H-bond acceptors were less than 5 and the rotatable bond count was not more than 6, compound ZINC08792355 would have poorer absorption or permeability than the other two candidate compounds. This information would be useful to prioritise the candidate compounds for further laboratory testing.
Figure 5. Structures (source, binding energy) of the 12 potential inhibitors identified by virtual screening.

TCMT: Traditional Chinese Medicines@Taiwan20; TCMID: Traditional Chinese Medicine Integrated Database21.
Table 3. Properties of three potential SIRT1 inhibitors.
| Properties | ZINC08790006 | ZINC08792229 | ZINC08792355 |
|---|---|---|---|
| Molecular Weight (g/mol) | 326.34982 | 486.52068 | 500.54726 |
| Molecular Formula | C17H18N4O3 | C30H22N4O3 | C31H24N4O3 |
| XLogP3-AA | 0.8 | 4.9 | 5.3 |
| H-Bond Donor | 3 | 2 | 2 |
| H-Bond Acceptor | 4 | 4 | 4 |
| Rotatable Bond Count | 1 | 6 | 6 |
| Topological Polar Surface Area | 88.7 | 89 | 89 |
| Heavy Atom Count | 24 | 37 | 38 |
| Formal Charge | 0 | 0 | 0 |
| Complexity | 65 | 868 | 898 |
Significance of the study
This study is the first to apply an inductive learning technique to generate molecular models of SIRT1 inhibitors. Use of the molecular models in database screening before molecular docking reduced the time and cost of screening through molecular docking alone. The whole process of the ligand-based VS required hours rather than days. This study is also the first to apply ligand-based VS to screen for active compounds in natural products, particularly traditional Chinese medicines.
This study successfully demonstrated a use of the ILP approach to ligand-based virtual screening, based on machine learning from the structures of experimentally confirmed inhibitors (positive examples) and activators (negative examples), as well as optional background knowledge about the desirable targets. Although this study covered only a specific kind of chemical compounds (i.e. SIRT1 inhibitors), this approach can be generalized and applied to the virtual screening for other chemicals that require rich knowledge representations and automated reasoning.
Methods
Literature search
Two reviewers independently conducted database searches in PubMed and ScienceDirect. The search strategy was: (TITLE-ABSTR-KEY (sirt1) or TITLE-ABSTR-KEY (sirtuin 1)) and (TITLE-ABSTR-KEY (activator) or TITLE-ABSTR-KEY (inhibitor) or TITLE-ABSTR-KEY (agonist) or TITLE-ABSTR-KEY (antagonist) or TITLE-ABSTR-KEY (binder) or TITLE-ABSTR-KEY (ligand)). The publication language was English. The last search date was 20 February 2014.
Eligible articles were scientific experiment reports on biological activities of SIRT1 ligands with information on IC50, EC50, and maximum activation (MA). Articles were excluded if they were: (i) not original research articles; (ii) lacking in biological activity data; or (iii) lacking in chemical structures of the ligands.
Information was extracted from each eligible study, including first author, publication year, bioassay methods, substrates used in bioassays, and chemical information of discovered ligands.
Data preparation
2D chemical structures of the ligands reported in eligible studies were re-sketched with ChemSketch software59. A compound search for chemical information from PubChem55 was performed with the search function of ChemSketch59. Canonical simplified molecular input line entry specification (SMILES), ID code, and all bioactivity information of the compounds were compiled in datasets and saved in sdf format (MDL MOL format) by OpenBabel 2.3.2 software60 with the settings of “add hydrogen to polar atoms only”, “canonicalize the atom order”, “generate 2D coordinates”, and “use wedge and hash bonds from input”. The chirality of the ligands was disregarded in the present study. Duplicate records were removed so that each record was unique. SIRT1 activators were indicated by IDs with prefix “SA” and SIRT1 inhibitors were indicated by IDs with prefix “SI”. The files containing the compound information in appropriate format were used in subsequent QSAR modelling.
QSAR modelling by inductive learning
To relate the common structural compound features of the SIRT1 ligands to their bioactivities in QSAR modelling13 by machine learning, this study employed ILP-based DCA software18,61, ILP was applied in the modelling, including hierarchical hypotheses derivation, validation and deployment steps18. As an artificial intelligence method, ILP represents a particular model internally as formal logics that would facilitate inductive reasoning among data (examples or facts), background knowledge (facts or rules), and hypotheses (rules). ILP generates a more generic hypothesis to cover, subsume, or entail the given data and background knowledge. For non-computer scientists as its users, the DCA software employs logic formulae as its internal representations for inductive reasoning. The DCA software translates the input (data/examples and background knowledge) into or the output (hypotheses) from the internal logic formulae for more friendly interactions with the users. The workflow of DCA software is shown in Figure S4, and the models (in both English text and chemical structures) displayed by the DCA software is shown in Figure S5. For efficiency, the DCA software also incorporates simpler algorithms such as SVM and statistical regressions for specific classification tasks that do not require logical reasoning62. The parameters for these additional algorithms were automatically set by the DCA software. In the individual hypotheses generation step, DCA18 took advantage of the ILP capability for incorporating background knowledge. The background knowledge in DCA18 was divided into four parts: electron flow; element (e.g. carbon, nitrogen); moiety (functional groups and rings); and substructure relationship (e.g. connected, fused, linked, and position on ring). DCA18 could add vertices for all moieties to an atom-bond graph, connect the vertices and molecular structure elements with edges labelled by the substructure relationship, and then find correlation rules between the molecular structure information represented by the atom-bond graph and its experimental biological activity63. Users can set parameters for optimisation between model quality and run time. In this research, we explored with different the parameter settings and finally optimized the parameters as shown in Table S10, which were chosen for good model quality for screening purpose within an acceptable short period of time. The last parameter “both high and low values” in Table S10 aimed to broaden the search space (beyond “low values only” or “high values only” settings) for the model information. We also find that minor changes around the chosen parameter settings would return similar results. Generally, the dataset input for hypotheses formation was divided into a training set and a test set based on their structure diversity and activity performed by the software. The hypotheses were generated using the training set by machine learning and automatically validated by the test set data. The hypothesis validation was performed to observe whether the hypothesis was capable of distinguishing between active and inactive ligands64, and the statistical significance (e.g. P-values) was determined. We considered the significance level to be high for values of P < 0.005. Multiple descriptors and curves were used to present the performance of the models. A good model was characterized by a large AUC, low RMSE, good r, and good rho. Predicted–actual scatter plots indicated the Pearson correlations between the predicted and actual target values, while rank correlation values showed the correlations between the predicted ranks and actual ranks. Curves shown in red represented the performance of a random model which acted as a non-biased baseline, while curves shown in blue indicated the performance of the predictive models in the present study. In cumulative response curves, if the blue line was above the red line, the predictive model outperformed the random model. Lift curves showed how many times the predictive model outperformed the random model. ROC curves took the AUC between the blue line and the red line (0 ≤ AUC ≤ 1) to show how much better the predictive model was compared with the random model.
In operations, compound information files containing the data sets were fed into the DCA18 software to generate QSAR models, for which five descriptive models were constructed: (i) activator model; (ii) inhibitor model; (iii) differential model (i.e. ligand model that distinguished between activators and inhibitors); (iv) inhibitor binding model that distinguished between inhibitors with high and low binding energies; and (v) inhibitor affinity model that distinguished between high-affinity and low-affinity inhibitors. The binding energy and affinity between each inhibitor and SIRT1 were determined by molecular docking (see section titled Molecular Docking).
Ligand-based virtual screening
We performed VS using the “apply hypotheses” option in the DCA software18. The validated QSAR models were used to screen natural product compounds, for which data were downloaded from the two major databases (Traditional Chinese Medicines@Taiwan Database20 and Traditional Chinese Medicine Integrated Database21), converted, and saved in sdf format by OpenBabel software60. Duplicate and incomplete records were removed. Finally, candidates were screened with predicted values (e.g. logIC50) and then taken for further molecular docking (see section titled Molecular Docking).
Molecular docking
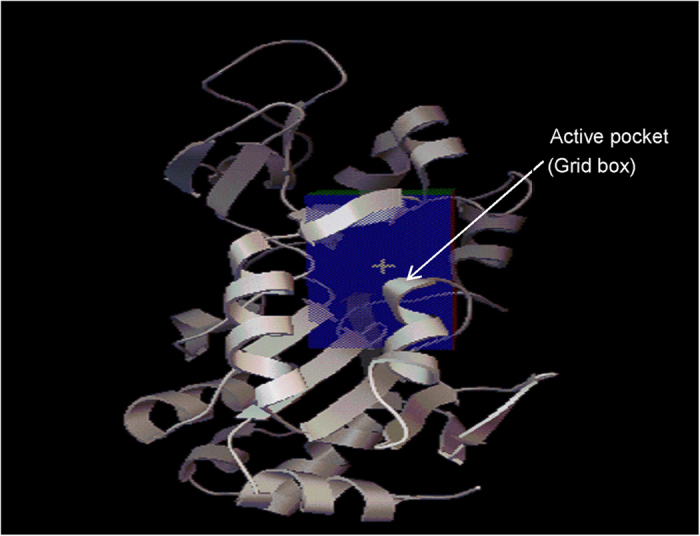
To investigate the intermolecular interactions between ligands and SIRT1, we performed semi-flexible docking using AutoDock Vina software22. 3D structural information for SIRT1 protein was obtained from the Protein Data Bank (PDB; ID: 4I5I). The information for the catalytic domain of SIRT1 (Fig. 6) and NAD+ protein-binding site was used for molecular docking as previously reported65. Hydrogen atoms were added to prepare the receptor file, for which the 3D structure was saved in pdbqt format by AutoDock Tools66. The ligand file was prepared in the same manner. The receptor and ligand files were then applied to docking in the AutoDock Vina software, which also estimated the binding energy and affinity22.
Figure 6. SIRT1 active pocket.
Additional Information
How to cite this article: Sun, Y. et al. Ligand-based virtual screening and inductive learning for identification of SIRT1 inhibitors in natural products. Sci. Rep. 6, 19312; doi: 10.1038/srep19312 (2016).
Supplementary Material
Acknowledgments
This work was supported by two research grants (MYRG190-Y1-L3-ICMS11-LSW and MYRG2014-00117-ICMS-QRCM) received from the University of Macau.
Footnotes
Author Contributions S.L. conceived and designed the study. Y.S. searched the databases, assessed and extracted the data from eligible studies, analysed the data and draft a report on the virtual screening experiments. H.Z., Y.S. and H.M.Z. further analysed, interpreted the data and wrote the manuscript. S.L. wrote about the ILP machine learning for ligand-based virtual screening, checked the results and revised other parts of the manuscript. All the authors contributed to extensive discussion of the results, revised the manuscript, and approved the final manuscript.
References
- Kitada M. & Koya D. SIRT1 in Type 2 diabetes: mechanisms and therapeutic potential. Diabetes Metab J. 37, 315–325 (2013). [DOI] [PMC free article] [PubMed] [Google Scholar]
- Yeung F. et al. Modulation of NF‐κB‐dependent transcription and cell survival by the SIRT1 deacetylase. EMBO J. 23, 2369–2380 (2004). [DOI] [PMC free article] [PubMed] [Google Scholar]
- Nemoto S., Fergusson M. M. & Finkel T. SIRT1 functionally interacts with the metabolic regulator and transcriptional coactivator PGC-1α. J Biol Chem. 280, 16456–16460 (2005). [DOI] [PubMed] [Google Scholar]
- Fan W. & Luo J. SIRT1 regulates UV-induced DNA repair through deacetylating XPA. Mol cell 39, 247–258 (2010). [DOI] [PubMed] [Google Scholar]
- Brunet A. et al. Stress-dependent regulation of FOXO transcription factors by the SIRT1 deacetylase. Science 303, 2011–2015 (2004). [DOI] [PubMed] [Google Scholar]
- Huffman D. M. et al. SIRT1 is significantly elevated in mouse and human prostate cancer. Cancer Res. 67, 6612–6618 (2007). [DOI] [PubMed] [Google Scholar]
- Medda F. et al. Novel cambinol analogs as sirtuin inhibitors: synthesis, biological evaluation, and rationalization of activity. J Med Chem. 52, 2673–2682 (2009). [DOI] [PMC free article] [PubMed] [Google Scholar]
- Solomon J. M. et al. Inhibition of SIRT1 catalytic activity increases p53 acetylation but does not alter cell survival following DNA damage. Mol Cell Biol. 26, 28–38 (2006). [DOI] [PMC free article] [PubMed] [Google Scholar]
- Pacholec M. et al. SRT1720, SRT2183, SRT1460, and resveratrol are not direct activators of SIRT1. J Biol Chem. 285, 8340–8351 (2010). [DOI] [PMC free article] [PubMed] [Google Scholar]
- Napper A. D. et al. Discovery of indoles as potent and selective inhibitors of the deacetylase SIRT1. J Med Chem. 48, 8045–8054 (2005). [DOI] [PubMed] [Google Scholar]
- Sanders B. D. et al. Identification and characterization of novel sirtuin inhibitor scaffolds. Bioorg Med Chem. 17, 7031–7041 (2009). [DOI] [PMC free article] [PubMed] [Google Scholar]
- Vu C. B. et al. Discovery of imidazo [1, 2-b] thiazole derivatives as novel SIRT1 activators. J Med Chem. 52, 1275–1283 (2009). [DOI] [PubMed] [Google Scholar]
- Pulla V. K. et al. Structure-based drug design of small molecule SIRT1 modulators to treat cancer and metabolic disorders. J Mol Graph Model. 52, 46–56 (2014). [DOI] [PubMed] [Google Scholar]
- Hann M. M. & Oprea T. I. Pursuing the leadlikeness concept in pharmaceutical research. Curr Opin Chem Biol. 8, 255–263 (2004). [DOI] [PubMed] [Google Scholar]
- Bielska E. et al. Virtual screening strategies in drug design-methods and applications. BioTechnologia. BioTechnologia. 92, 249–264 (2011). [Google Scholar]
- Ragno R. et al. Identification of Small‐Molecule Inhibitors of the XendoU Endoribonucleases Family. ChemMedChem 6, 1797–1805 (2011). [DOI] [PMC free article] [PubMed] [Google Scholar]
- Brenk R., Irwin J. J. & Shoichet B. K. Here be dragons: docking and screening in an uncharted region of chemical space. J Biomol Screen. 10, 667–674 (2005). [DOI] [PMC free article] [PubMed] [Google Scholar]
- Ando H. Y. et al. Discovering H-bonding rules in crystals with inductive logic programming. Mol Pharm. 3, 665–674 (2006). [DOI] [PubMed] [Google Scholar]
- So S. S. & Karplus M. Evolutionary optimization in quantitative structure-activity relationship: an application of genetic neural networks. J Med Chem. 39, 1521–1530 (1996). [DOI] [PubMed] [Google Scholar]
- Sanderson K. Databases aim to bridge the East-West divide of drug discovery. Nat Med. 17, 1531–1531 (2011). [DOI] [PubMed] [Google Scholar]
- Xue R. et al. TCMID: traditional Chinese medicine integrative database for herb molecular mechanism analysis. Nucleic Acids Res. 41, 1089–1095 (2013). [DOI] [PMC free article] [PubMed] [Google Scholar]
- Trott O. & Olson A. J. AutoDock Vina: improving the speed and accuracy of docking with a new scoring function, efficient optimization, and multithreading. J Comput Chem. 31, 455–461 (2010). [DOI] [PMC free article] [PubMed] [Google Scholar]
- Alvala M. et al. Novel acridinedione derivatives: design, synthesis, SIRT1 enzyme and tumor cell growth inhibition studies. Bioorg Med Chem Lett. 22, 3256–3260 (2012). [DOI] [PubMed] [Google Scholar]
- Amagata T. et al. Creation of an HDAC-based yeast screening method for evaluation of marine-derived actinomycetes: discovery of streptosetin A. J Nat Prod. 75, 2193–2199 (2012). [DOI] [PMC free article] [PubMed] [Google Scholar]
- Asaba T. et al. Inhibition of human sirtuins by in situ generation of an acetylated lysine-ADP-ribose conjugate. J Am Chem Soc. 131, 6989–6996 (2009). [DOI] [PubMed] [Google Scholar]
- Bemis J. E. et al. Discovery of oxazolo [4, 5-b] pyridines and related heterocyclic analogs as novel SIRT1 activators. Bioorg Med Chem Lett. 19, 2350–2353 (2009). [DOI] [PubMed] [Google Scholar]
- Disch J. S. et al. Discovery of thieno [3, 2-d] pyrimidine-6-carboxamides as potent inhibitors of SIRT1, SIRT2, and SIRT3. J Med Chem. 56, 3666–3679 (2013). [DOI] [PubMed] [Google Scholar]
- Freitag M. et al. Synthesis and biological activity of splitomicin analogs targeted at human NAD+-dependent histone deacetylases (sirtuins). Bioorg Med Chem. 19, 3669–3677 (2011). [DOI] [PubMed] [Google Scholar]
- Hirsch B. M. et al. A mechanism-based potent sirtuin inhibitor containing N ε-thiocarbamoyl-lysine (TuAcK). Bioorg Med Chem Lett. 21, 4753–4757 (2011). [DOI] [PMC free article] [PubMed] [Google Scholar]
- Huber K. et al. Novel 3-arylideneindolin-2-ones as inhibitors of NAD+-dependent histone deacetylases (sirtuins). J Med Chem. 53, 1383–1386 (2009). [DOI] [PubMed] [Google Scholar]
- Huhtiniemi T. et al. Structure-based design of pseudopeptidic inhibitors for SIRT1 and SIRT2. J Med Chem. 54, 6456–6468 (2011). [DOI] [PubMed] [Google Scholar]
- Huhtiniemi T. et al. Nε-Modified lysine containing inhibitors for SIRT1 and SIRT2. Bioorg Med Chem. 18, 5616–5625 (2010). [DOI] [PubMed] [Google Scholar]
- Huhtiniemi T. et al. Oxadiazole-carbonylaminothioureas as SIRT1 and SIRT2 inhibitors. J Med Chem. 51, 4377–4380 (2008). [DOI] [PubMed] [Google Scholar]
- Kalle A. M., Mallika A., Badiger J. & Talukdar P. Inhibition of SIRT1 by a small molecule induces apoptosis in breast cancer cells. Biochem Biophys Res Commun. 401, 13–19 (2010). [DOI] [PubMed] [Google Scholar]
- Kiviranta P. H. et al. N-(3-(4-Hydroxyphenyl)-propenoyl)-amino acid tryptamides as SIRT2 inhibitors. Bioorg Med Chem Lett. 17, 2448–2451 (2007). [DOI] [PubMed] [Google Scholar]
- Kiviranta P. I. H. et al. N ϵ-Thioacetyl-Lysine-Containing Tri-, Tetra-, and Pentapeptides as SIRT1 and SIRT2 Inhibitors. J Med Chem. 52, 2153–2156 (2009). [DOI] [PubMed] [Google Scholar]
- Mai A. et al. Design, synthesis, and biological evaluation of sirtinol analogues as class III histone/protein deacetylase (Sirtuin) inhibitors. J Med Chem. 48, 7789–7795 (2005) [DOI] [PubMed] [Google Scholar]
- Mai A. et al. Study of 1, 4-dihydropyridine structural scaffold: discovery of novel sirtuin activators and inhibitors. J Med Chem. 52, 5496–5504 (2009). [DOI] [PubMed] [Google Scholar]
- Manjulatha K. et al. Ethylenediamine diacetate (EDDA) mediated synthesis of 7789-7795 (2005).aurones under ultrasound: Their evaluation as inhibitors of SIRT1. Bioorg Med Chem Lett. 22, 6160–6165 (2012). [DOI] [PubMed] [Google Scholar]
- McCarthy A. R. et al. Synthesis and biological characterisation of sirtuin inhibitors based on the tenovins. Bioorg Med Chem. 20, 1779–1793 (2012). [DOI] [PubMed] [Google Scholar]
- Pasco M. Y. et al. Characterization of sirtuin inhibitors in nematodes expressing a muscular dystrophy protein reveals muscle cell and behavioral protection by specific sirtinol analogues. J Med Chem. 53, 1407–1411 (2009). [DOI] [PubMed] [Google Scholar]
- Pesnot T. et al. Two-step synthesis of novel, bioactive derivatives of the ubiquitous cofactor nicotinamide adenine dinucleotide (NAD). J Med Chem. 54, 3492–3499 (2011). [DOI] [PubMed] [Google Scholar]
- Rotili D. et al. Simplification of the tetracyclic SIRT1-selective inhibitor MC2141: Coumarin-and pyrimidine-based SIRT1/2 inhibitors with different selectivity profile. Bioorg Med Chem. 19, 3659–3668 (2011). [DOI] [PubMed] [Google Scholar]
- Rotili D. et al. Benzodeazaoxaflavins as sirtuin inhibitors with antiproliferative properties in cancer stem cells. J Med Chem. 55, 8193–8197 (2012). [DOI] [PubMed] [Google Scholar]
- Suzuki T. et al. Identification of a cell-active non-peptide sirtuin inhibitor containing N-thioacetyl lysine. Bioorg Med Chem Lett. 19, 5670–5672 (2009). [DOI] [PubMed] [Google Scholar]
- Suzuki T. et al. Design, synthesis, enzyme inhibition, and tumor cell growth inhibition of 2-anilinobenzamide derivatives as SIRT1 inhibitors. Bioorg Med Chem. 17, 5900–5905 (2009). [DOI] [PubMed] [Google Scholar]
- Suzuki T., Imai K., Nakagawa H. & Miyata N. 2‐Anilinobenzamides as SIRT Inhibitors. ChemMedChem. 1, 1059–1062 (2006). [DOI] [PubMed] [Google Scholar]
- Suzuki T. et al. Design, synthesis, and biological activity of a novel series of human sirtuin-2-selective inhibitors. J Med Chem. 55, 5760–5773 (2012). [DOI] [PubMed] [Google Scholar]
- Tavares J. et al. Bisnaphthalimidopropyl derivatives as inhibitors of Leishmania SIRT2 related protein 1. ChemMedChem. 5, 140–147 (2010). [DOI] [PubMed] [Google Scholar]
- Trapp J. et al. Adenosine mimetics as inhibitors of NAD+-dependent histone deacetylases, from kinase to sirtuin inhibition. J Med Chem. 49, 7307–7316 (2006). [DOI] [PubMed] [Google Scholar]
- Trapp J. et al. Structure-activity studies on suramin analogues as inhibitors of NAD+‐dependent histone deacetylases (sirtuins). ChemMedChem. 2, 1419–1431 (2007). [DOI] [PubMed] [Google Scholar]
- Uciechowska U. et al. Thiobarbiturates as Sirtuin Inhibitors: Virtual Screening, Free‐energy calculations, and biological testing. ChemMedChem. 3, 1965–1976 (2008). [DOI] [PubMed] [Google Scholar]
- Wu J. et al. Identification of benzofuran-3-yl (phenyl) methanones as novel SIRT1 inhibitors: binding mode, inhibitory mechanism and biological action. Eur J Med Chem. 60, 441–450 (2013). [DOI] [PubMed] [Google Scholar]
- Zhang Y. et al. Identification of a small molecule SIRT2 inhibitor with selective tumor cytotoxicity. Biochem Biophys Res Commun. 386, 729–733 (2009). [DOI] [PubMed] [Google Scholar]
- Bolton E. E., Wang Y., Thiessen P. A. & Bryant S. H. PubChem: integrated platform of small molecules and biological activities. Annu Rep Comput Chem. 4, 217–241 (2008). [Google Scholar]
- Finkel T., Deng C.-X. & Mostoslavsky R. Recent progress in the biology and physiology of sirtuins. Nature. 460, 587–591 (2009). [DOI] [PMC free article] [PubMed] [Google Scholar]
- Blum C. A. et al. SIRT1 modulation as a novel approach to the treatment of diseases of aging. J Med Chem. 54, 417–432 (2010). [DOI] [PubMed] [Google Scholar]
- Lipinski C. A., Lombardo F., Dominy B. W. & Feeney P. J. Experimental and computational approaches to estimate solubility and permeability in drug discovery and development settings. Adv Drug Deliv Rev. 64, 4–17 (2012). [DOI] [PubMed] [Google Scholar]
- Osterberg T. & Norinder U. Prediction of drug transport processes using simple parameters and PLS statistics. The use of ACD/logP and ACD/ChemSketch descriptors. Eur J Pharm Sci. 12, 327–337 (2001). [DOI] [PubMed] [Google Scholar]
- O’Boyle N. M. et al. Open Babel: An open chemical toolbox. J Cheminf. 3, 33 (2011). [DOI] [PMC free article] [PubMed] [Google Scholar]
- De Grave K., De Raedt L. & Ramon J. in Predictive Quantitative Structure-Activity Relationship Models and their use for the Efficient Screening of Molecules (Automatisch leren van structuur-activiteitsrelaties met hoge voorspellende kracht en hun toepassing bij het efficiënt screenen van moleculen). status: published, 1-99 (Thesis, 2011).
- Suykens J. A. K. & Vandewalle J. Least squares support vector machine classifiers. Neural Process Lett. 9, 293–300 (1999). [Google Scholar]
- Grave K. D. & Costa F. Molecular graph augmentation with rings and functional groups. J Chem Inf Model. 50, 1660–1668 (2010). [DOI] [PubMed] [Google Scholar]
- Bharatham N., Bharatham K. & Lee K. W. Pharmacophore identification and virtual screening for methionyl-tRNA synthetase inhibitors. J Mol Graph Model. 25, 813–823 (2007). [DOI] [PubMed] [Google Scholar]
- Zhao X. et al. The 2.5 Å crystal structure of the SIRT1 catalytic domain bound to nicotinamide adenine dinucleotide (NAD+) and an indole (EX527 analogue) reveals a novel mechanism of histone deacetylase inhibition. J Med Chem. 56, 963–969 (2013). [DOI] [PubMed] [Google Scholar]
- Morris G. M. et al. AutoDock4 and AutoDockTools4: Automated docking with selective receptor flexibility. J Comput Chem. 30, 2785–2791 (2009). [DOI] [PMC free article] [PubMed] [Google Scholar]
Associated Data
This section collects any data citations, data availability statements, or supplementary materials included in this article.