Abstract
Modern functional nanomaterials and devices are increasingly composed of multiple phases arranged in three dimensions over several length scales. Therefore there is a pressing demand for improved methods for structural characterization of such complex materials. An excellent emerging technique that addresses this problem is diffraction/scattering computed tomography (DSCT). DSCT combines the merits of diffraction and/or small angle scattering with computed tomography to allow imaging the interior of materials based on the diffraction or small angle scattering signals. This allows, e.g., one to distinguish the distributions of polymorphs in complex mixtures. Here we review this technique and give examples of how it can shed light on modern nanoscale materials.
1 The need for 3D imaging
Many functional materials are structured in three dimensions (3D) over several length scales. The hierarchical arrangement of structures across length scales results in materials with superior properties as is the case for biological materials such as bone and shell,1–4 but also many synthetic materials such as catalyst materials,5 battery and other energy storage materials.6
To understand these materials in full it is necessary to study them with 3D imaging techniques that allow probing their structure. Ideally, it should be possible to study the materials at all relevant length scales in one experiment with minimal or no sample preparation. This ideal is not met by any technique. However, combining diffraction or small angle scattering with tomographic reconstruction methods provides a significant step in the direction of this idealized technique. In the present review, we discuss how combining diffraction and tomography into a technique called either diffraction tomography (DT) or diffraction/scattering computed tomography (DSCT)7,8 provides new and profound insights into modern nanoscale materials. We will briefly describe the experimental methodology in sections 2 and 3 and provide several recent applications in section 4 that illustrate the potential materials science insights that can be obtained through DSCT.
2 Tomography: 3D vision
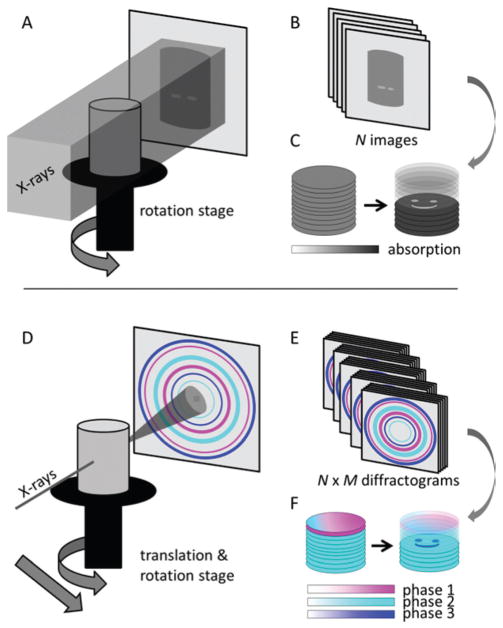
Three dimensional imaging of the interior structure of materials is in principle simple: tomographic reconstruction. In classical computed tomography a series of projections of the X-ray absorption of the sample is collected from multiple viewing angles. The internal structure of the sample can be reconstructed from these projection images by mathematical algorithms. The process is illustrated in Fig. 1A–C. An entire absorption projection can be measured in one single exposure by using a beam larger than the sample and a 2D detector to collect the transmitted X-ray signal. The absorption is calculated by relating the transmitted beam intensity to the incident beam intensity (the so called white or flat field). One projection will be collected at each viewing angle resulting in N images showing the sample from all directions, Fig. 1B. Applying reconstruction algorithms9 to these projections leads to a 3D representation of the sample where the inner structure can be explored, Fig. 1C. The contrast in the final images of the sample is proportional to the material density. The technique has in medical imaging been extensively used to generate 3D images of implants, bones and other hard tissue, and has also found widespread use in materials science.9 Absorption based computed tomography with ~10 μm resolution (μ-CT) is a standard technique using laboratory scale instruments. Moreover the superior beam quality of synchrotrons opens up for additional uses of the techniques. The X-ray flux at synchrotrons is several orders of magnitude higher than laboratory sources allowing e.g. in situ measurements in need of fast data-collection. Moreover there are several recent improvements of this basic imaging technique that make use of the monochromaticity and coherence of synchrotron light to obtain quantitative images. Coherence results in refraction effects becoming important. This allows for phase contrast imaging where interfaces between objects stand out clearly and even imaging of soft tissues becomes possible.10 The charge density can be quantitatively reconstructed by combining measurements at several distances in what is referred to as holotomography.11 This results in quantitative images that combined with magnification optics can yield sub-100 nm resolution12 – the lower limit of resolution rapidly improving at the time of writing. An alternative approach called ptychography is based on coherent diffraction imaging obtained by raster scanning a small coherent beam across the sample. This also allows ultrahigh resolution reconstructions of material charge density.13–16 Common for all of these techniques is that the results reflect variations in electron densities but do not distinguish between e.g. different crystallographic phases.
Fig. 1.
Principles of tomography (A–C) and diffraction/scattering tomography (D–F). In traditional absorption tomography, the sample is illuminated and the X-ray attenuation is recorded for a set of N viewing angles (A, B); typically this is done with a box shaped beam, the figure shows a single slice of such a beam only. Through tomographic reconstruction 3D images of the sample absorption density are obtained that reveal the interior structure (D). In diffraction/scattering tomography on the other hand, a pencil shaped X-ray beam is raster scanned across the samples in M positions for a set of N viewing angles (D) resulting in N × M individual diffraction patterns (E). The diffraction information is then reconstructed using the same algorithms as for absorption tomography resulting in images based on diffraction contrast (F) that allow distinguishing materials with similar X-ray attenuation coefficients such as polymorphs.
2.1 Why do we need different contrast mechanisms?
The tomographic techniques described above are excellent, but also affected by certain limitations: The observed mass density for a given volume element (voxel) represents an average for that voxel and in many cases, advanced materials consist of mixtures of constituent micro- or nanoscale materials. Examples of this come from biomineralization research,1,2,4 but similar cases are found in composites, batteries, catalysts and many other classes of synthetic materials. In biominerals, the material is composed of a mixture of an organic phase and one or several inorganic phases.1,2,4 Hence there is no way of knowing if an observed mass density change originates from changes in composition of the mineral phases or from variation in the amount of mineral present. Yet this question is absolutely essential for understanding the function of the material. Thus more revealing imaging techniques are needed.
2.1.1 Possible X-ray contrast mechanisms: fluorescence, scattering and diffraction
Firstly, X-rays interact with matter through either scattering or absorption. Absorption can lead to fluorescence that is characterized by element-specific X-ray emission. Scattering is in practice separated into wide angle scattering (diffraction in the case of crystalline materials) and small angle X-ray scattering (SAXS). The former probes the atomic lengths scales while the latter probes the mesoscopic length scales of roughly 1–100 nm. Real space pair distribution function (PDF) analysis uses wide angle scattering data collected for very high angles corresponding to large momentum transfers (q-values) to yield information on nanocrystalline and amorphous materials.17 We will describe diffraction and SAXS tomography implemented for nanocrystalline or powder-like materials below. The analysis of (multi) single-crystal materials can also be conducted in 3D by grain mapping and this technique is also often referred to as box beam diffraction contrast tomography.18 This technique is however restricted to materials of a limited number of grains of single-crystal quality and will not be discussed further. Fluorescence can also be used tomographically in much the same way as difraction or SAXS. Fluorescence tomography yields maps of 3D distributions of elements inside materials provided the fluorescence signal can exit the material and reach the detector. This limits somewhat the applicability of the technique in materials research. Nevertheless, fluorescence tomography has provided excellent insights into element distributions in several complex cases,19 but will not be further discussed here. The techniques described below can also be employed in the transmission electron microscope (TEM) using e.g. small angle electron scattering signals as done by Mayence et al. to map defects in 3D in nanoparticle superlattices.20
3 Diffraction tomography in practice
In contrast to conventional full field absorption tomography immersing the entire sample in the beam, DSCT requires using a 1D pencil beam to avoid the overlap of diffraction information. To cover the entire sample, the specimen is scanned horizontally through the beam collecting a projection one point at a time. The sample is rotated about the vertical axis, and the process is repeated until projections of the sample from all angles are collected. 3D data sets are in turn produced by combining several 2D slices. Thus DSCT remains a rather time-consuming technique, but as shown in section 4, the added information is well worth the extra effort.
3.1 Resolution
The resolution of the final images is directly determined by the size of the beam. This is in turn limited by the focusing capability of the beamline and by the scattering properties of the sample. The technique requires a powder-like signal in each probed point meaning that the illuminated volumes given by the beam area times the sample thickness must contain a sufficient number of coherently scattering domains. The synchrotron X-ray beam is typically focused by Kirkpatric–Baez mirrors or a lens and cut by a pair of slits. An additional pair of slits is often employed as beam guards to reduce parasitic scattering. The diffraction of the sample is collected using a large area detector. By selecting the sample to detector distance, a balance between the desired reciprocal space resolution, i.e. the number of detector pixels per diffraction peak, and momentum transfer range, i.e. the lowest observed d-spacing, can be attained. The incoming beam intensity is monitored by an ion chamber placed before the sample, while absorption of the sample can be collected in the direct beam by an ion chamber or a pin diode placed after the sample. The technique is well suited for simultaneous collection of SAXS and WAXS information. This can either be done by using a single large detector capable of collecting the two signals concurrently or by allowing the small angle signal to pass through the WAXS detector(s) and collect it further downstream. The latter will be more technically challenging requiring multiple detectors but would allow a much better reciprocal space resolution in the SAXS regime.
3.2 Practical implementations
In order to align the sample on the rotation axis prior to DSCT measurements and to allow collection of a high resolution CT image of the sample, a setup capable of rapidly switching between diffraction tomography and full field tomography is desirable.21 To switch to full field tomography conditions, the focusing lens is moved out of the beam and the slits are opened to allow a large beam to illuminate the entire sample. A magnifying scintillator-based detector is placed downstream of the sample and collects the projections. Due to the high energies often used for DSCT, absorption is usually negligible. The full field image is instead dominated by phase contrast (refraction). The simple and reproducible switch between the two setups allows high resolution imaging and DSCT of the same sample position and within the complex sample environment.
3.2.1 The high energy advantage
DSCT is often implemented with high X-ray energies. High energies allow studies of large samples due to the high penetration power of both the direct and the scattered beam. At lower energies absorption corrections of moderately absorbing samples are feasible and usually implemented directly in the reconstruction algorithm, but at high energies absorption is negligible. Furthermore, absorption and beam damage are intimately connected and a reduction of X-ray absorption allows studies of more radiation sensitive specimens. Additionally, the high energies allow mapping of scattering to a very high momentum transfer, making PDF based analysis17 possible. An additional advantage of high energy DSCT is that it affords a large distance between the sample and the detector thus giving space for complex sample environments facilitating in situ and in operando studies.
3.2.2 Comments on the speed of measurements
DSCT suffers from relatively long scanning times. This is exacerbated in the case of high resolution images as the spatial resolution in the reconstructed slices is directly dependent on the beam size. It is necessary to measure the signal over the full width of the sample and a small beam size thus increases the number of points across the sample. The ideal number of projection angles (Mproj) follows the number of points per projection (Npoints) through the Nyquist sampling ratio, Mproj = Npoints × π/2,22 though typically research studies have used Mproj ≈ Npoints. Assuming the exposure time is constant, this results in a fourfold increase in the scanning time if the number of points across the sample is doubled. Moreover, the exposure time necessary to obtain sufficient counting statistics can increase with resolution since less material is probed and because of the reduced beam intensity, which typically follows the focusing to a smaller beam. The large amounts of data produced with area detectors places great demands on data read out and transfer efficiency. In order to reduce the overhead from the readout of the detector a continuous rotation and measurement procedure has been implemented resulting in significantly more efficient data collection.21 With this implementation a slice of a 1 × 1 mm2 sample can be imaged with a resolution of 30 μm and an exposure time of two seconds in slightly over one hour.
3.2.3 Extracting information
The raw data from a DSCT experiment is M × N 2D diffractograms. These are corrected for variations in incoming flux and detector gain and (typically) azimuthally integrated to give 1D diffraction data. This results in M × N diffraction patterns covering an identical scattering angle range. As a first step, integrated intensities of selected diffraction peaks in the diffractogram are usually selected allowing for reconstruction based on the intensity of a diffraction peak from one phase in the sample. A more detailed analysis follows from the use of the full diffraction pattern. In this approach, a reconstruction is produced for the intensity in each scattering angle detector bin. This gives as many reconstructed images as scattering bins. The intensity in each voxel can be plotted as a function of the scattering bin from which it was reconstructed resulting in full 1D diffractograms in each imaged volume element. This analysis can be extended to incorporate orientation information by dividing the raw data into azimuthal bins before integration and analysing individual parts.23,24 Thereby it is possible to obtain full XRD patterns in each voxel inside the material.
4 Examples
Diffraction tomography has found use across materials science. Several recent applications will be discussed in this section. They have been selected to illustrate the types of information that diffraction tomography can provide rather than being completely comprehensive.
4.1 Overview of studies performed
Harding et al. (1987) performed the first DSCT study of which the authors are aware. They demonstrated X-ray scattering tomography on a low contrast CT phantom using a tube X-ray source.25 Kleuker et al. (1998) performed scattering tomography on a lamb chop and demonstrated that scattering patterns could be separated into components from fat, muscles and bones and the spatial distribution of each phase could be reconstructed with good sensitivity.26 Other scattering tomography studies include those on hierarchically structured natural materials,27 on brain and brain tumor tissue,28,29 simulation on phantoms representing structures that might be encountered in clinical imaging,30 and on high-pressure injection molding polyethylene rods.31,32 Mineralized tissue studies with diffraction tomography include a very simple synthetic hydroxylapatite bone phantom,33 rabbit cortical bone,34 calcite and aragonite in a mineralized byssus,21,35 enamel and dentin domains of a tooth23,36 and crystallographic texture mapping in neighboring cortical and trabecular bone.37 There have been studies on spatial distribution of phases in cement38–42 and on deformation of related structures43,44 or reinforcing phases.45 Diffraction tomography has also been shown to be particularly valuable in the study of dilute distributions of “minor” phases such as those encountered in catalysis8,24,46–50 as well as various carbon materials.51–53 Energy-dispersive diffraction tomography54 has also been performed to track sulfate attack of Portland cement55 and to study Ti alloys.56
4.2 Carbon based materials
Carbon based materials have attracted significant interest due to their technological importance and rich chemistry when subjected to high temperatures and pressures. The study of such materials by regular techniques remains challenging due to the similar composition and density of the constituent materials, and, therefore, DSCT provides a powerful tool to improve the understanding of such systems. The use of DSCT to study the (trans)formation of several types of carbon materials has been pioneered by Hodeau et al.51–53 These authors typically used moderate energies that allowed easier access to highly focused beams (<10 μm). This in turn enabled differences in the material composition to be probed on the relevant length scale and by using diffraction as a contrast mechanism they were capable of differentiating and locating phases with concentrations as low as 0.1 wt%, an impressive order of magnitude better than in normal ensemble powder diffraction where one averages over the bulk material.
Samples of C60 fullerenes subjected to high pressures (P = 20 GPa)51,53 or high temperature and pressure (P = 5 GPa, T = 1100 K)52 were mapped using DSCT. In order to study intermediate stages in the formation of diamond from compression of C60 the sample was quenched during transformation. Thereby, it was possible to extract important information on reaction routes by DSCT. Fig. 2 shows a reconstructed slice through a specimen of C60 treated at non-uniform high pressure. The sample was imaged at 21 keV and a beam size of 2.3 × 1.6 μm2. By selective reconstruction of scattering signals from different carbon allotropes, it was possible to localize the spatial distribution of materials. 3D-DSCT images of the allotrope distribution inside the sample were created by sequential scanning at different heights in the sample showing differences in reaction routes between crystalline and amorphous precursors.53
Fig. 2.
Spatial phase-selective scattering analysis of a slice through a C60 fullerene specimen. (a) 1D projected patterns (top) and Rietveld calculations (bottom) for cubic diamond, compressed graphite, sp2-graphite-like carbon and sp3-like amorphous carbon. (b) Zoom on a region of interest (corresponding to white rectangles of Fig. 1 in ref. 53) showing the phase coexistence and interpenetrating morphology in the outer shell of the sample. Adapted from ref. 53.
Texture analysis of the sample was performed by reconstructing phases using only selected azimuthal intervals of the diffraction signal. Using this it was possible to obtain information on the orientation relationship between different domains of the sample. The precise nature of this relationship was then established by combining the DSCT texture analysis with information obtained through dark field TEM imaging.52 Thus, by combining DSCT with the existing techniques, it can serve as a tool to create a model for the transformation processes in advanced hybrid materials.
Additionally, by combining the technique with fluorescence the group has performed dual-mode collection of both fluorescence and diffraction signals. This is however only possible if the energy used is compatible with absorption edges.
4.3 Biological materials
Biological materials are intrinsically heterogeneous in nature. They often contain several phases with very similar attenuation coefficients that are organized in complex structural hierarchies. Probing these structures on the molecular scale by diffraction, nano-scale by peak profile analysis or small angle scattering and sub-micro to micrometer resolution is hence highly desirable. The properties of these materials depend not only on the identity of the constituent phases but also their 3D arrangements. The ability of DSCT to gain information on the distribution of the different phases, and in the case of crystalline phases even chemical and microstructural details, makes it an indispensable tool for fully understanding these materials.
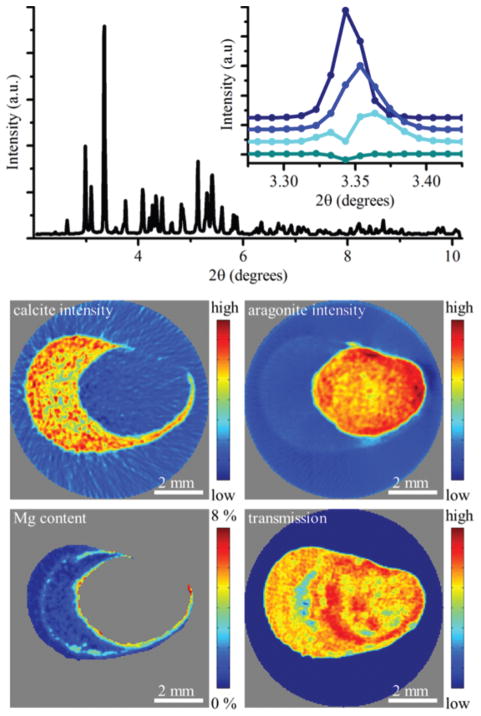
One example of a biological material where diffraction tomography has proven to be an essential analysis tool is the mineralized attachment system of the mussel Anomia simplex. The animal uses an organ known to consist of more than 90 wt% CaCO3 to maintain a permanent underwater attachment. The mineral exists in the form of crystalline aragonite and calcite containing varying degrees of Mg substitution.35,57–59 From reconstruction of integrated intensities of specific diffraction peaks originating from the two CaCO3 polymorphs they were found to be located in distinctly different regions of the structure with little to no overlap. As the Mg substitution into the calcite lattice gives rise to a known shift in the lattice parameters, analysis on the profile of the calcite (104) peak from reconstructed diffractograms revealed the distribution and degree of Mg substitution. The highly substituted Mg-calcite was located in bands within the calcite structure with the most pronounced band near the interface between the calcitic and aragonitic regions (Fig. 3).35 This information is not accessible in 3D by any other technique and the results suggest that the magnesium substitutions is an important material property tightly controlled by the animal.
Fig. 3.
Phase distribution and magnesium substitution in the calcified attachment system (byssus) of the marine bivalve Anomia simplex, which is a model for underwater attachment systems. The top panel shows a reconstructed diffractogram displaying peaks of both aragonite and calcite. The inset compares the calcite (104) from four different positions showing Mg-substitution induced shifts in the scattering angle. The middle panel shows reconstructions of calcite (left) and aragonite (right) in a slice through the byssus. The sample morphology can be seen from the bottom right panel that shows the absorption in the specimen with high signals signifying large absorption. The Mg-content was determined by peak position analysis and is shown in the bottom left panel.
Other crystalline biological materials that have been successfully analysed using diffraction tomography include bone and teeth.23,34,36 Here diffraction tomography enabled mapping the spatial distribution of similar phases. This was done either from the intensities of diffraction peaks originating from specific phases34 or from changes in the background profile, indicating the amount of decayed enamel.23 Further analysis of fully reconstructed diffractograms revealed distributions in the peak widths and positions which correlate with variations in the crystallite sizes and chemical composition of the phases, respectively. Very recently, DSCT was used to map nanocrystals in dentine using 120 nm X-ray beams. The data were analysed as a function of azimuthal scattering angle and peak positions as well as intensities were analysed. This allowed showing how mineral concentrations vary over the dentine sub-micro structure and that there are variations in crystalline properties coupled to the organic framework in teeth.36 Technically, this important study opens a new technical frontier of sub-micron DSCT. Other studies have directly extracted microstrain fluctuations from Rietveld refined diffraction tomography data by subsequent strain reconstruction.43,44 Such microstrain fluctuations are of great importance for biomaterials performance; in this case the mechanical properties and influence of heat treatment of a zirconia tooth implant.
Even if the phases of interest do not show long range ordering, diffraction tomography has been shown to greatly enhance the contrast in tomographic images. In this case the small angle X-ray scattering (SAXS) signal is used in the analysis. Different disordered phases or tissues give different SAXS data and can hence be distinguished by mapping characteristic features, such as the intensity in specific q-ranges, from the fully reconstructed spectra. This enables specific tissue types indistinguishable from the bulk material by absorption, such as a brain tumor, to be mapped with high precision.28,29
4.4 Inorganic nanomaterials
The characterization of modern inorganic materials can greatly benefit from DSCT. These classes of materials are often heterogeneous on a variety of length scales and composed of multiple phases. The noninvasive nature of the technique makes it optimal for in situ and in operando studies of functional nanomaterials.
4.4.1 Catalysis
A number of important industrial chemical catalysis processes are based on porous supports decorated with metals and metal oxides. The activity of the catalytic process is heavily dependent on the spatial distribution of the catalytic bodies, and particle sizes and crystal phases of the components. The structure and phase evolution during the formation and operation of metal based heterogeneous catalysts have been studied by DSCT.49,60 The authors show that the formation of the catalytic active phase is a complex, multistep process and that the active phase is highly stable during operation. The phase sensitivity of the DSCT enables detection of even weakly scattering precursor phases and the spatial distribution of nine individual crystal phases has been extracted from the data. In the in operando study the DSCT has been combined with absorption μCT offering a strong way to distinguish voids from areas composed of weakly scattering materials and relating high resolution imaging with the diffraction signals, this way revealing inactive parts of the catalyst body.5,49,60
4.4.2 Construction materials
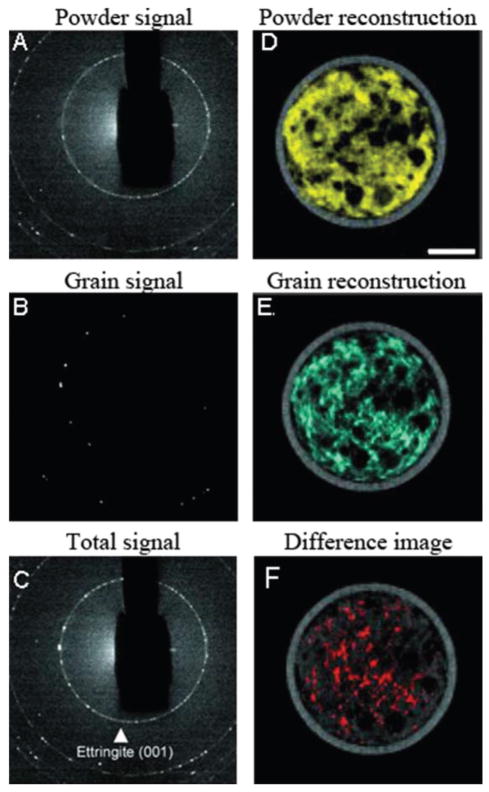
Construction materials such as cement are highly heterogeneous in terms of composition, crystallinity and microstructure. These parameters play a key role in permeability, thermoelastic and mechanical properties of the formed material and are therefore essential determinants of material performance. Cementitious materials have been studied in several DSCT experiments.39–42 Cement hydration has been studied by in situ DSCT.42 The quantitative spatial distribution of a number of crystalline phases as well as amorphous materials was mapped. During cement formation, highly hydrated phases such as ettringite, Ca6Al2-(SO4)3(OH)12·26H2O form both as small and larger crystallites resulting in a mixture of ettringite powder and larger crystals. By imaging the same slice in the sample at different time points the authors were able to follow the distributions of all phases during curing in a quantitative manner. A challenge in DSCT is the presence of highly textured or large-grained phases. This was addressed by the authors by applying a filtering procedure to separate powder-like distributions from single grain distribution as shown in Fig. 4. By selectively filtering the raw diffraction signal, Fig. 4C, into a powder signal, Fig. 4A, and a grain signal, Fig. 4B, the authors could selectively reconstruct the grainy and powder signals, Fig. 4D and E. The difference between the two images, Fig. 4F, highlights where the largest ettringite grains are found. Thus, the authors were able to provide a route to the qualitative analysis of crystallite size distribution in this highly complex material.42
Fig. 4.
DSCT used to separate powder-like and grain-like components of ettringite in a cement. The left column (A–C) displays details of the low-2θ region containing the 001 diffraction ring of ettringite (C) and the separation of the powder-like signal (fine ettringite) (A) from the large-grains signal (coarse ettringite) (B). In the right column (D–F), the spatial distribution maps of the finer (D) and coarser (E) ettringite are plotted. The difference between E and D shown in F highlights where the largest ettringite grains are located. Adapted from ref. 42.
5 Some emerging developments
Diffraction tomography has by the time of writing emerged as a technique that is well poised to provide novel insights into a broad range of materials. With high energy implementation, the method is ideally suited for investigating materials in complicated sample environments. This may include for example in situ mechanical deformation, heating/cooling or in situ phase transformation e.g. by illumination. Technical developments in X-ray instrumentation mean that DSCT data collection will become much more rapid in the coming years. This includes both developments of storage rings (with upgrades of synchrotrons taking place currently and/or over the coming years) that will result in improved X-ray sources. Improved insertion devices will also lead to improved flux. Thereby it will be feasible to conduct DSCT with beams in the 100 nm range as demonstrated recently.36
Improvements in X-ray detection and data acquisition, storage and processing technologies will lead to strong improvements in measurement speed. The scene will be set for minute scale measurements that may be even further reduced by smart measurement schemes including reduced angular sampling combined with improved reconstruction techniques, matching beam shape to sample resolution needs or using flux preserving focussing. Hence it can be expected that DSCT will be able to probe dynamics on times scales relevant for real-life materials applications.
Improvements in data analyses procedures are also emerging. There is a strong potential for optimizing reconstruction schemes as has been demonstrated for μ-CT.61 This will lead to strongly improved reconstructed data sets and hence enhances the scope for applying DSCT to ever more advanced questions. DSCT generates large data sets. Fully exploiting the diffraction information necessitates automated procedures for iterative Rietveld refinements; one such scheme from our laboratory has recently been shown to drastically facilitate data analyses.62
6 Conclusions
DSCT provides detailed insights into complex multicomponent nanomaterials. Current and expected near future developments indicate that DSCT has the potential to provide important insights into complex functional nanomaterials even under external manipulation. Thus DSCT is a tool of broad relevance for addressing complex structural problems in the study of complex nanoscale materials.
Acknowledgments
We gratefully acknowledge support from the staff of beamline 1-ID of the APS and ID-15 of the ESRF in particular Jon Almer (APS), Peter Kenesei (APS), Jun Sang Park (APS), and Marco Di Michiel (ESRF). We thank the European Synchrotron Radiation Facility for providing synchrotron radiation facilities. We thank the Advanced Photon Source for beamtime; use of the Advanced Photon Source, an Office of Science User Facility operated for the U.S. Department of Energy (DOE) Office of Science by Argonne National Laboratory, was allowed by the U.S. DOE under Contract no. DE-AC02-06CH11357. We gratefully acknowledge funding from the Human Frontiers Science Program, DANSCATT, the Danish Research Councils, and (SRS) US NICDR grant no. DE001374.
Biographies

Mie Elholm Birkbak, MSc, is a PhD student in Henrik Birkedal’s group at Aarhus University. She has received several distinctions including the Zonta Denmark 2015 prize for a female PhD student in science and technology as well as the Aarhus University’s Science and Technology Talent Award. Mie Birkbak’s research interests are centered around X-ray imaging and scattering techniques and their application to biological materials, in particular, bone.
Hanna Leemreize, PhD, did her graduate work in Henrik Birkedal’s group at Aarhus University, Denmark, and is currently a postdoc at the Max Planck Institute of Colloids and Interfaces, Department of Biomaterials funded by the Lundbeck Foundation. Hanna Leemreize is interested in the formation and structure of complex biomaterials and how these affect the material properties. To this end she uses a range of synchrotron X-ray based techniques.

Simon Frølich, MSc, is a PhD student in Henrik Birkedal’s group at Aarhus University. He is a recipient of a prestigious Eliteforsk travel stipend from the Danish Council for Independent Research. Simon Frølich’s research interests include the relationship between the structure and mechanical performance of biological and bioinspired materials and in this connection he is an avid user of synchrotron X-ray imaging, fluorescence and scattering techniques.

Stuart R. Stock has been doing research with X-ray diffraction since 1978 and with X-ray tomography since 1985. His current research focusses on mineralized tissue.
Henrik Birkedal, PhD is an associate professor at Aarhus University, Department of Chemistry and iNANO, where he heads a research group working on biological and bioinspired materials with special focus on methods for their structural characterization using synchrotron radiation imaging and scattering techniques accompanied by a battery of other techniques.
Notes and references
- 1.Dunlop JWC, Fratzl P. Annu Rev Mater Res. 2010;40:1–24. [Google Scholar]
- 2.Meyers MA, Chen PY, Lin AYM, Seki Y. Prog Mater Sci. 2008;53:1–206. [Google Scholar]
- 3.Meyers MA, McKittrick J, Chen PY. Science. 2013;339:773–779. doi: 10.1126/science.1220854. [DOI] [PubMed] [Google Scholar]
- 4.Studart AR. Adv Funct Mater. 2013;23:4423–4436. [Google Scholar]
- 5.Grunwaldt JD, Wagner JB, Dunin-Borkowski RE. ChemCatChem. 2013;5:62–80. [Google Scholar]
- 6.Finega DP, Scheel M, Robinson JB, Tjaden B, Hunt I, Mason TJ, Millichamp J, Di Michiel M, Offer GJ, Hinds G, Brett DJL, Shearing PR. Nat Commun. 2015;6:6924. doi: 10.1038/ncomms7924. [DOI] [PMC free article] [PubMed] [Google Scholar]
- 7.Beale AM, Jacques SDM, Gibson EK, Di Michiel M. Coord Chem Rev. 2014;277–278:208–223. [Google Scholar]
- 8.Álvarez-Murga M, Bleuet P, Hodeau JL. J Appl Crystallogr. 2012;45:1109–1124. [Google Scholar]
- 9.Stock SR. MicroComputed Tomography: Methodology and Applications. CRC Press; Boca Raton, FL: 2008. [Google Scholar]
- 10.Momose A, Takeda T, Itai Y, Hirano K. Nat Med. 1996;2:473–475. doi: 10.1038/nm0496-473. [DOI] [PubMed] [Google Scholar]
- 11.Cloetens P, Ludwig W, Baruchel J, Van Dyck D, Van Landuyt J, Guigay JP, Schlenker M. Appl Phys Lett. 1999;75:2912. [Google Scholar]
- 12.Langer M, Pacureanu A, Suhonen H, Cloetens GQP, Peyrin F. PLoS One. 2012;7:e35691. doi: 10.1371/journal.pone.0035691. [DOI] [PMC free article] [PubMed] [Google Scholar]
- 13.Chen B, Guizar-Sicairos M, Xiong G, Shemilt L, Diaz A, Nutter J, Burdet N, Huo S, Mancuso J, Monteith A, Vergeer F, Burgess A, Robinson I. Sci Rep. 2013;3:1177. doi: 10.1038/srep01177. [DOI] [PMC free article] [PubMed] [Google Scholar]
- 14.Dierolf M, Menzel A, Thibault P, Schneider P, Kewish CM, Wepf R, Bunk O, Pfeiffer F. Nature. 2010;467:436–439. doi: 10.1038/nature09419. [DOI] [PubMed] [Google Scholar]
- 15.Esmaeili M, Fløystad JB, Diaz A, Høydalsvik K, Guizar-Sicairos M, Andreasen JW, Breiby DW. Macromolecules. 2013;46:434–439. [Google Scholar]
- 16.Trtik P, Diaz A, Guizar-Sicairos M, Menzel A, Bunk O. Cem Concr Compos. 2013;36:71–77. [Google Scholar]
- 17.Jacques SDM, Di Michiel M, Kimber SAJ, Yang X, Cernik RJ, Beale AM, Billinge SJL. Nat Commun. 2013;4:2536. doi: 10.1038/ncomms3536. [DOI] [PubMed] [Google Scholar]
- 18.Ludwig W, Reischig P, King A, Herbig M, Lauridsen EM, Johnson G, Marrow TJ, Buffère JY. Rev Sci Instrum. 2009;80:033905. doi: 10.1063/1.3100200. [DOI] [PubMed] [Google Scholar]
- 19.de Jonge MD, Holzner C, Baines SB, Twining BS, Ignatyev K, Diaz J, Howards DL, Legnini D, Miceli A, McNulty I, Jacobsen CJ, Vogt S. Proc Natl Acad Sci U S A. 2010;107:15676–15680. doi: 10.1073/pnas.1001469107. [DOI] [PMC free article] [PubMed] [Google Scholar]
- 20.Mayence A, Wang D, Salazar-Alvarez G, Oleynikov P, Bergström L. Nanoscale. 2014;6:13803–13808. doi: 10.1039/c4nr04156a. [DOI] [PubMed] [Google Scholar]
- 21.Leemreize H, Birkbak M, Frølich S, Kenesei P, Almer JD, Stock SR, Birkedal H. Proc SPIE-Int Soc Opt Eng. 2014:9212. [Google Scholar]
- 22.Kak AC, Slaney M. Principles of Computerized Tomo-graphic Imaging. Society of Industrial and Applied Mathematics; Philadelphia, USA: 2001. [Google Scholar]
- 23.Egan CK, Jacques SDM, Di Michiel M, Cai B, Zandbergen MW, Lee PD, Beale AM, Cernik RJ. Acta Biomater. 2013;9:8337–8345. doi: 10.1016/j.actbio.2013.06.018. [DOI] [PubMed] [Google Scholar]
- 24.Álvarez-Murga M, Bleuet P, Marques L, Lepoittevin C, Boudet N, Gabarino G, Mezouar M, Hodeau JL. J Appl Crystallogr. 2011;44:163–171. [Google Scholar]
- 25.Harding G, Kosanetzky J, Neitzel U. Med Phys. 1987;14:515–525. doi: 10.1118/1.596063. [DOI] [PubMed] [Google Scholar]
- 26.Kleuker U, Suorrti P, Weyrich W, Spanne P. Phys Med Biol. 1998;43:2911–2923. doi: 10.1088/0031-9155/43/10/017. [DOI] [PubMed] [Google Scholar]
- 27.Kuhlmann M, Feldkamp JM, Roth SV, Schroer CG. 2008 IEEE Nuclear Science Symposium Conference Record; 2008; pp. 570–573. [Google Scholar]
- 28.Jensen TH, Bech M, Bunk O, Menzel A, Bouchet A, Le Duc G, Feidenhanśl R, Pfeiffer F. NeuroImage. 2011;57:124–129. doi: 10.1016/j.neuroimage.2011.04.013. [DOI] [PubMed] [Google Scholar]
- 29.Jensen TH, Bech M, Bunk O, Thomsen M, Menzel A, Bouchet A, Le Duc G, Feidenhanśl R, Pfeiffer F. Phys Med Biol. 2011;56:1717–1726. doi: 10.1088/0031-9155/56/6/012. [DOI] [PubMed] [Google Scholar]
- 30.Cong W, Wang G. J X-Ray Sci Technol. 2011;19:219–227. doi: 10.3233/XST-2011-0288. [DOI] [PubMed] [Google Scholar]
- 31.Schroer CG, Kuhlmann M, Roth SV, Gehrke R, Stribeck N, Almendarez-Camarillo A, Lengeler B. Appl Phys Lett. 2006;88:164102. [Google Scholar]
- 32.Stribeck N, Almendarez-Camarillo A, Nöchel U, Schroer C, Kuhlmann M, Roth SV, Gehrke R, Bayer RK. Macromol Chem Phys. 2006;207:1139–1149. [Google Scholar]
- 33.Barroso RC, Lopes RT, de Jesus EFO, Oliveira LF. Nucl Instrum Methods Phys Res, Sect A. 2001;471:75–79. [Google Scholar]
- 34.Stock SR, De Carlo F, Almer JD. J Struct Biol. 2008;161:144–150. doi: 10.1016/j.jsb.2007.10.001. [DOI] [PubMed] [Google Scholar]
- 35.Leemreize H, Almer JD, Stock SR, Birkedal H. J R Soc Interface. 2013;10:20130319. doi: 10.1098/rsif.2013.0319. [DOI] [PMC free article] [PubMed] [Google Scholar]
- 36.Forien JB, Fleck C, Cloetens P, Duda G, Fratzl P, Zolotoyabko E, Zaslansky P. Nano Lett. 2015;15:3729–3734. doi: 10.1021/acs.nanolett.5b00143. [DOI] [PubMed] [Google Scholar]
- 37.Xiao X, Stock SR. In: Biomineralization Sourcebook -Characterization of Biominerals and Biomimetic Materials. Gower L, DiMasi E, editors. CRC Press; 2014. pp. 233–248. [Google Scholar]
- 38.Artioli G, Cerulli T, Cruciani G, Dalconi MC, Ferrari G, Parisatto M, Rack A, Tucoulou R. Anal Bioanal Chem. 2010;397:2131–2136. doi: 10.1007/s00216-010-3649-0. [DOI] [PubMed] [Google Scholar]
- 39.Valentini L, Dalconi MC, Parisatto M, Cruciani G, Artioli G. J Appl Crystallogr. 2011;44:272–280. [Google Scholar]
- 40.Artioli G, Dalconi MC, Parisatto M, Valentini L, Voltolini M, Ferrari G. Int J Mater Res. 2012;103:145–150. [Google Scholar]
- 41.Artioli G, Valentini L, Dalconi MC, Parisatto M, Voltolini M, Russo V, Ferrari G. Int J Mater Res. 2014;105:628–631. [Google Scholar]
- 42.Voltolini M, Dalconi MC, Artioli G, Parisatto M, Valentini L, Russo V, Bonnin A, Tucoulou R. J Appl Crystallogr. 2013;46:142–152. [Google Scholar]
- 43.Korsunsky AM, Baimpas N, Song X, Belnoue J, Hofmann F, Abbey B, Xie M, Andrieux J, Buslaps T, Neo TK. Acta Mater. 2011;59:2501–2513. [Google Scholar]
- 44.Korsunsky AM, Vorster WJJ, Zhang SY, Dini D, Latham D, Golshan M, Liu J, Kyriakoglou Y, Walsh MJ. Acta Mater. 2006;54:2101–2108. [Google Scholar]
- 45.Stock SR, Almer JD. J Appl Crystallogr. 2012;45:1077–1083. [Google Scholar]
- 46.Bleuet P, Welcomme E, Dooryhée E, Susini J, Hodeau JL, Walter P. Nat Mater. 2008;7:468–472. doi: 10.1038/nmat2168. [DOI] [PubMed] [Google Scholar]
- 47.Jacques SDM, Pile K, Barnes P, Lai X, Roberts KJ, Williams RA. Cryst Growth Des. 2005;5:395–397. [Google Scholar]
- 48.Palancher H, Tucoulou R, Bleuet P, Bonnin A, Welcomme E, Cloetens P. J Appl Crystallogr. 2011;44:1111–1119. [Google Scholar]
- 49.O’Brien MG, Jacques SDM, Di Michiel M, Barnes P, Weckhuysen BM, Beale AM. Chem Sci. 2012;3:509–523. [Google Scholar]
- 50.Álvarez-Murga M, Bleuet P, Garbarino G, Salamat A, Mezouar M, Hodeau JL. Phys Rev Lett. 2012;109:025502. doi: 10.1103/PhysRevLett.109.025502. [DOI] [PubMed] [Google Scholar]
- 51.Bleuet P, Welcomme E, Dooryhee E, Susini J, Hodeau JL, Walter P. Nat Mater. 2008;7:468–472. doi: 10.1038/nmat2168. [DOI] [PubMed] [Google Scholar]
- 52.Alvarez-Murga M, Bleuet P, Marques L, Lepoittevin C, Boudet N, Gabarino G, Mezouar M, Hodeau JL. J Appl Crystallogr. 2011;44:163–171. [Google Scholar]
- 53.Alvarez-Murga M, Bleuet P, Garbarino G, Salamat A, Mezouar M, Hodeau JL. Phys Rev Lett. 2012;109:025502. doi: 10.1103/PhysRevLett.109.025502. [DOI] [PubMed] [Google Scholar]
- 54.Hall R, Barnes P, Cockcroft JK, Colston SL, Häusermann D, Jacques SDM, Jupe AC, Kunz M. Nucl Instrum Methods Phys Res, Sect B. 1998;140:2553–2257. [Google Scholar]
- 55.Jupe AC, Stock SR, Lee PL, Naik NN, Kurtis KE, Wilkinson AP. J Appl Crystallogr. 2004;37:967–976. [Google Scholar]
- 56.Cernik RJ, Hansson CCT, Martin CM, Preuss M, Attalah M, Korsunsky AM, Belnoue JP, Jun TS, Barnes P, Jacques S, Sochi T, Lazzari O. J Appl Crystallogr. 2011;44:150–157. [Google Scholar]
- 57.Leemreize H, Eltzholtz JR, Birkedal H. Eur J Mineral. 2014;26:517–522. [Google Scholar]
- 58.Birkedal H, Frølich S, Leemreize H, Stallbohm R, Tseng Y-H. In: Biological and Biomimetic Adhesives Challenges and Opportunities. Santos R, Aldred N, Gorb S, Flammang P, editors. RSC Publishing; Cambridge, UK: 2013. pp. 16–25. [Google Scholar]
- 59.Eltzholtz JR, Birkedal H. J Adhes. 2009;85:590–600. [Google Scholar]
- 60.Jacques SDM, Di Michiel M, Beale AM, Sochi T, O’Brien MG, Espinosa-Alonso L, Weckhuysen BM, Barnes P. Angew Chem, Int Ed. 2011;50:10148–10152. doi: 10.1002/anie.201104604. [DOI] [PubMed] [Google Scholar]
- 61.Gürsoy D, De Carlo F, Xiao X, Jacobsen C. J Synchrotron Radiat. 2014;21:1188–1193. doi: 10.1107/S1600577514013939. [DOI] [PMC free article] [PubMed] [Google Scholar]
- 62.Frølich S, Birkedal H. J Appl Crystallogr. 2015 submitted. [Google Scholar]


