Abstract
Objective
B lymphocytes are generally considered to be activators of the immune response, However recent findings have shown that a subtype of B-lymphocytes, regulatory B lymphocytes (Bregs) play a role in attenuating the immune response. Bronchiolitis obliterans (BO) remains the major limitation to modern day lung transplantation. Bregs role in BO has not been elucidated. We hypothesized that Bregs play a role in the attenuation of BO.
Methods
A standard heterotopic tracheal transplant model (HTT) model we performed. Tracheas from Balb/c were transplanted into C57BL/6 recipients. Rapamycin treatment and DMSO control groups each treated for the first 14 days after the transplant. Tracheas were collected on Days 7, 14, and 28 post-transplantation. Luminal obliteration was evaluated by HE staining and picrosirius red staining. Immune cell infiltration and characteristics, secretion of IL-10 and TGF-β1 were accessed by immunohistochemistry. Cytokines and TGF-β1 were measured using luminex assay.
Results
The results revealed that intraperitoneal injection of rapamycin for 14 days after tracheal transplantation significantly reduced luminal obliteration on days 28 when compared with DMSO control group (97.78% ±3.63% Vs 3.02% ±2.14%, P<0.001). Rapamycin treatment markedly induced Breg (B220+IgM+IgG- IL-10+TGF- β1+) cells when compared with DMSO controls. Rapamycin treatment inhibited IL-1β, -6, -13 and -17 at day 7 and 14. Furthermore, rapamycin also greatly increased IL-10 and TGF-β1 production in B cells and Treg infiltration on day 28.
Conclusions
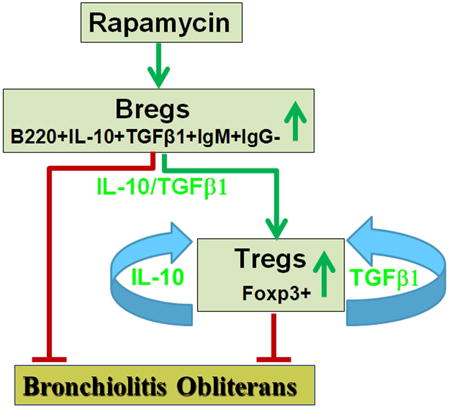
mTOR inhibition decreases BO development via inhibition of pro-inflammatory cytokines and increasing Breg cell infiltration, which subsequently produce anti-inflammatory cytokines and upregulate Treg cells.
Graphical abstract
Introduction
Lung transplantation is currently recognized as the preferred treatment for patients with end-stage pulmonary diseases. The long term mortality of lung recipients is highest among all solid organs transplanted. The Achilles' heel of lung transplantation remains chronic allograft rejection (1-3). Histologically, chronic lung allograft rejection is seen as small airway obliteration known as bronchiolitis obliterans [BO, (3-5)]. Since BO is difficult to detect post-lung transplantation on transbronchial biopsies, it is commonly referred to as a syndrome characterized in the recipient as a progressively decline in pulmonary function. Most patients die of respiratory failure within 5 years of onset.
We and others have used a preclinical well-described mouse heterotopic tracheal transplant (HTT) model to better understand the mechanisms involved in BO (6-9). Our previous reports showed that short course treatment of rapamycin, a macrocyclic triene antibiotic pro-drug, prevented development of BO through two different mechanisms in a HTT model: 1) reducing fibrocyte recruitment to the tracheal allografts(10); 2) protects against airway epithelium loss and promotes epithelial progenitor cells(11). During these studies, we appreciated that despite rapamycin significantly reduced BO development-; it simultaneously increased cell infiltration into the allografts. This surprising finding leads us to ask the following questions: 1) What are these infiltrated cells? 2) What is the function of these cells?
It is known that rapamycin is a clinically-utilized immunosuppressant that inhibits the activity of T, B, and Natural Killer cells. B cells can activate the immune system through producing antigen specific antibodies and inducing optimal T cell activation (12, 13). B cell activation has been reported (12, 13) the cause of antibody-mediated rejection post organ transplantation, also known as hyperacute rejection. Thus, B cells have been linked to decreased allograft survival. However, accumulated data suggest that B cells can also down regulate the immune response. This down-regulation is a result of production of anti-inflammatory cytokines.(14-22). Although much remains unknown about the role of Bregs play in suppression of the immune response, it is broadly accepted these cells exist and contribute to the immune response attenuation(23, 24). Among the variety of Breg subsets that have been described, IL-10-producing Breg cells (B10 cells) are the most widely studied Breg cell subset(22, 23, 25). In addition, Bregs may increase regulatory T cells (Tregs) differentiation through secretion of anti-inflammatory cytokine, IL-10 and TGF-β1 (26). We hypothesize that the suppressive effects of rapamycin are at least partly attributed to Breg infiltration into the allograft and subsequently increase Tregs to prevent BO development. This may provide a previously unknown mechanism of action of rapamycin in lung transplantation rejection.
In this study we show that intraperitoneal injection of rapamycin significantly increased Breg cell (B220+IgM+IgG- IL-10+TGF- β1+) and Foxp3+Treg infiltration into the allografts in a mouse HTT model. The results indicates that both these type of cells infiltrating into the grafts results in prevention of BO development. Therefore, understanding how Bregs infiltrate into allografts and their potential functions may provide novel ways to prevent BO and improve lung transplant success.
Materials and Methods
Animals
Balb/c and C57BL6 male mice were purchased from Jackson Laboratory, Bar Harbor, ME. All the experimental mice received humane care in accordance with “Principles of Laboratory Animal Care,” formulated by the National Society for Medical Research and The Guide for the Care and Use of Laboratory Animals prepared by the National Academy of Science and published by NIH. The study protocol was fully reviewed and approved by the Animal Care and Use Committee at the University of Virginia before experimentation.
Mouse model of heterotopic tracheal transplant
The mouse HTT model of BO was performed according to our previously publications (6, 7, 27, 28). Briefly, an MHC class I- and class II-mismatch was produced by transplanting Balb/c (H-2d) trachea into the C57BL/6 mice (H-2b).
Experimental group design
Experimental mice were divided into four groups
1) Balb/c tracheas transplanted into C57BL/6, treated with rapamycin at dosage of 5mg/kg/day for the first two weeks; 2) Balb/c tracheas transplanted into C57BL/6, treated with rapamycin at dosage of 10mg/kg/day for the first two weeks; 3) Balb/c tracheas transplanted into C57BL/6, treatment with DMSO for the first two weeks serving as controls; 4) C57BL/6 tracheas transplanted into C57BL/6 serving as isograft controls. In all groups, 4 donor tracheas were transplanted into one recipient, 6 recipients were used in each group and each timepoints. On days 7, 14, and 28 days post transplantation the isograft and allografts were collected for histology, Luminex assay and immunohistochemical staining.
Histology
The transplanted trachea were collected and immediately fixed in 4% Zinc-formalin, After 24 hours they were embedded in paraffin, sectioned and stained with hematoxylin & eosin (HE) or underwent immunohistchemical staining.
Immunohistochemical staining of macrophages and neutrophils
Macrophages and neutrophils were detected by immunohistochemical analysis as described previously (6, 7, 27, 28). Briefly, rat anti-mouse neutrophil (AbD Serotec, Raleigh, NC) and rat anti-mouse macrophage (Mac-2, Accurate Chem, Westbury, NY) antibodies were used as primary antibodies. Alkaline phosphatase - conjugated anti-rat IgG (Sigma, St Louis MO) were employed as secondary antibody. Fast-Red (Sigma, St Louis MO) was used as substrate. Purified normal rat IgG (eBioscience Inc, San Diego, CA) was used as a negative control. The sections were counterstained lightly with hematoxylin for viewing negatively stained cells.
Immunohistochemical staining of CD3+ T cell, B cells, Bregs and Tregs
The staining was performed according to our previous publications(6, 7, 27, 28). Briefly, the slides were deparaffinized, dehydrated antigen unmasked and blocked. Then the following primary antibodies were applied: Goat anti-mouse CD3ε antibody (Santa Cruz Biotechnology) for T cells, rat anti-mouse B220 (BD Pharmingen) for B cells, rat anti-mouse IL-10 (BioLegend), rabbit anti-mouse TGF-β1(LSBio), rabbit anti-mouse forkhead box protein 3 (Foxp3, Abcam Inc, Cambridge, MA). After incubation with an avidin-biotin complex, immunoreactivity was visualized by incubatingthe sections with 3, 3-diaminobenzidine tetrahydrochloride (DAKO Corp) to produce a brown precipitate, and then counterstained with hematoxylin. The number of positive staining cells per high power field was assessed by Photoshop counting tool, and at least 5 fields were counted per trachea by blinded observers. The average cell number was used for statistical analysis.
Double immunofluorescence staining of IgM and IgG
The slides were prepared as described above. The primary antibodies are goat anti-mouse IgM (Acris) and Alexa Fluor 488 conjugated rabbit anti-mouse IgG (Invitrogen). The secondary antibody for IgM is alkaline phosphatase - conjugated donkey anti goat IgG (Sigma, St Louis MO). The substrate is Fast Red (Sigma, St Louis MO). Purified pre-immune IgGs from the same animal species were used as negative controls. The cell nucleus was stained with 4,6-diamidine-2-phenylindole dihydrochloride (DAPI; RocheDiagnostics,Mannheim, Germany). Images were viewed and saved using an Olympus BX51 microscope equipped with an Olympus DP70 digital camera (Minneapolis, Minn).
Measurement of the luminal obliteration
The degree of luminal obliteration on day 28 post transplantation was evaluated according to our previous publications.(6, 7, 27, 28). Briefly, allografts were photographed at 4× magnification and the area of the obliterated lumen and the total area of lumen were measured using the Image-Pro Plus software. The percent of the obliteration was calculated by the area of the fibrosis divided by the total area of lumen. Eight to ten allografts were measured in each group. The data was used for statistical analysis.
Protein extraction and Bio-Plex cytokine analysis
The allografts and isografts were weighed and trimmed by scissors. After being mixed with 10 volumes of 1XPBS buffer, the mixture were loaded into Lysing Matrix D tubes and homogenized in a MP fast prep machine for 30 second twice. Then the samples were centrifuged at 3,000rpm at 4˚C for 10 minutes. The supernatant was collected for Bio-Plex cytokine analysis. The Cytokine analysis was performed according to the manufacture's instruction in the Bio-Plex 200 system (Bio-RAD, Hercules, CA) using a Bio-Plex Pro mouse cytokines standard 23-Plex, Group I kit and Bio-Plex Pro TGF-β Standard 3-Plex kit.
Statistical analysis
Data are presented as the mean ± SEM. The B cells, Bregs, and Treg cells were compared using one-way ANOVA followed by the Student's t test for unpaired data with Bonferroni correction. Square roots of tissue cell counts were compared using one-way ANOVA. A P<0.05 was considered significant.
Results
Rapamycin treatment significantly reduced tracheal luminal obliterations, but increased cell infiltration
Using a mouse HTT model (Balb/C trachea as donor and wild type C57BL/6), we were able to observe the effects of rapamycin on the histological kinetics of allografts post-transplantation from the different groups and different time points. The results revealed that rapamycin at two different concentrations (5mg/kg/day and 10mg/kg/day) significantly inhibited luminal obliterations when compared to DMSO control groups on day 28 post tracheal transplantation (Figure 1A). However, the two drug dosages did not show significant difference between one another. These results indicate that the lower dosage (5mg/kg/day) was sufficient for luminal obliteration. Interestingly, rapamycin (both dosages) treatment also increased cell infiltration into the allografts when compared with DMSO control groups on days 14 and 28 post tracheal transplantation (Figure 1B). The infiltrated cells were found in various forms, they could distribute evenly or cluster together (Figures 1B, 2).
Figure 1. Rapamycin (Rapa) treatment reduces luminal obliteration, but increases cell infiltration.
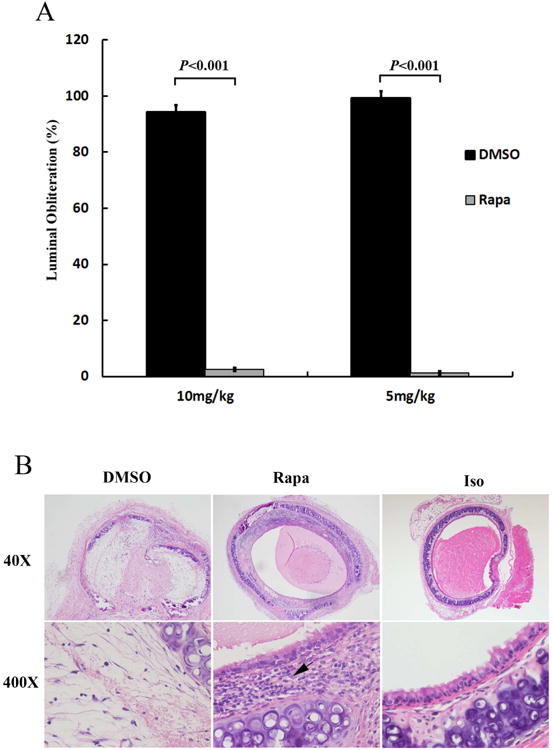
A Intraperitoneal injection of Rapa significantly reduced luminal obliteration of the allografts on day 28 post tracheal transplantation. Data shown are the mean ± SE, n=6. B Representative pictures of cellular infiltration in the allografts and isograft (Iso) controls from 28 days post-transplantation. The magnification of all the pictures was 40× and 400×. Black arrow indicates infiltrated cells. The donors are Balb/c mice and the recipients are C57BL/6 mice. C57BL/6 to C57BL/6 isograft controls are also performed.
Figure 2. Immunohistochemical staining of macrophages, neutrophils, CD3+ T cells, and B220+ B cells in the rapamycin (10mg/kg/day) treated allografts on day 28 post tracheal transplantation.
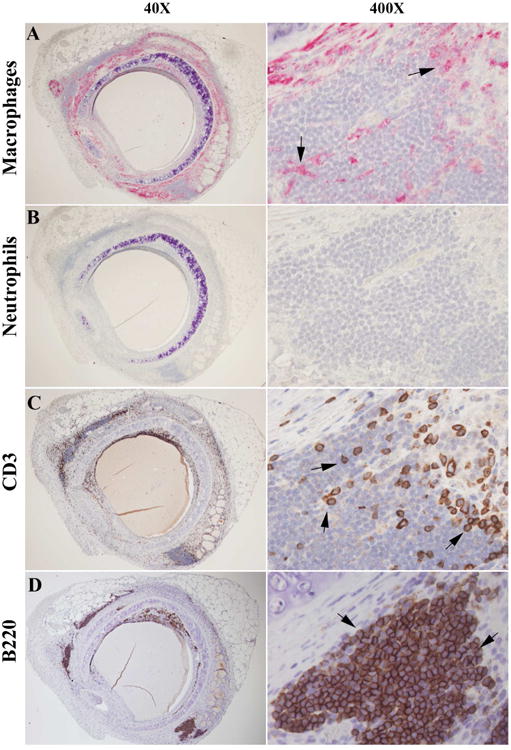
A, B, C, and D are representative immunostaining picture of macrophage, neutrophils, CD3+ T cells, and B220+ B cells, respectively. Red color/solid arrows indicate positive staining cells in A and B. Brown/dark brown/solid arrows indicate T and B cells in C and D. All sections were counterstained lightly with hematoxylin for viewing negatively stained cells. The magnifications are indicated in the pictures.
The major infiltrated cells were B cells
To better characterize these infiltrated cells, immunohistochemical staining with antigen specific antibodies was employed. Among these cells, neutrophils were not identified at all; only very small portion were Mac-2+ macrophages and CD3+ T cells (Figure 2A-2C). Surprisingly, we found that the majority of the infiltrated cells were B220+ B cells (Figure 2D). After counting the B220+ B cells in the rapamycin (10mg/kg/day) treated group, DMSO control group and isograft controls, we confirmed that B cells were markedly elevated in the rapamycin treated groups (Figure 3A and 3B). The lower dosage rapamycin (5mg/kg/day) treatment also significantly elevated B cells when compared with DMSO controls (196.3 ± 50.0 vs. 2.4 ± 1.7).
Figure 3. Increasing of B220+ B cells in rapamycin (Rapa) treated allografts on day 28 post transplantation.
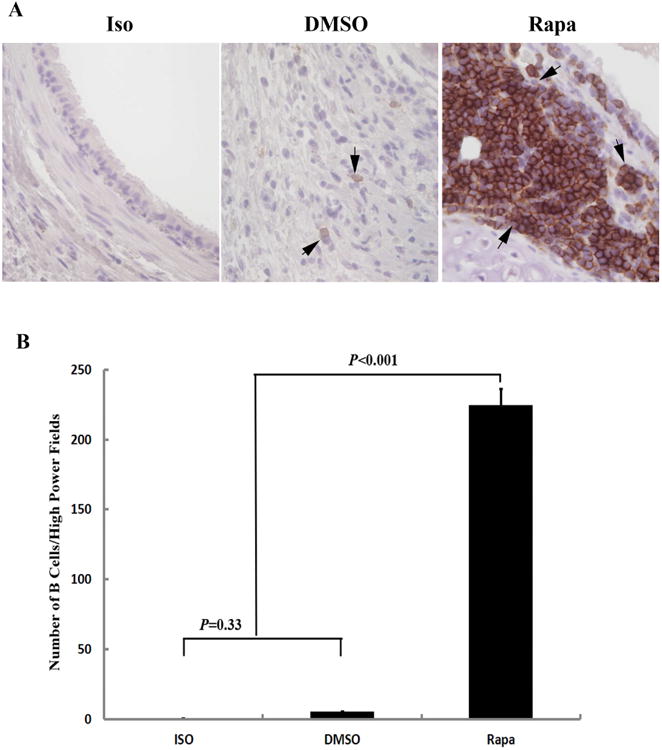
A Representative pictures of B220 staining in the allografts and isograft (Iso) controls from 28 days post-transplantation. Brown color/Solid arrows indicate B220+ cells. The magnification is 400×. B Comparison of B220+ B cell infiltration in the Rapa treated allograft with the isograft (Iso) and DMSO control allografts on day 28 post transplantation. Data shown are the mean ± SD *, n=6.
Majority of the infiltrated B cells were IgM+IgG-IL-10+TGF-β1+ regulatory B cells (Bregs)
To further determine the subset of these infiltrated B cells, conventional immunohistochemistry and double immunofluorescence staining were used. The results showed that almost all the B cells were IgM+ cells, while none of them produced IgG (Figure 4A). Majority of these cells were also IL-10+ and TGF-β1+ cells (Figure 4B), which suggested that these cells were B220+IgM+IgG-IL-10+TGF- β1+ Bregs. Statistical analysis showed that rapamycin significantly increased IL-10+ cells when compared with DMSO controls (P<0.001, Figure 5A). While TGF-β1 positive cells showed no significant difference between the rapamycin treatment and DMSO controls (P=0.147, Figure 5B). Our study also showed that TGF-β1 was mainly expressed in the B cells in the rapamycin treated grafts, but extensively expressed in fibrotic cells in the entire lumen of DMSO controls (Suppl Figure 1). We suggest that these Bregs (at least partially) are derived from the spleens of these animals comes from the following findings that: 1) the size of the rapamycin treated spleens was much smaller; 2) the numbers of Breg in the rapamycin treated spleens were decreased (Suppl Figure 2).
Figure 4. Identification of B220, IL-10, IgM and TGF-b1 positive regulatory B cells (Bregs) in the Rapa treated allografts on day 28 post transplantation.
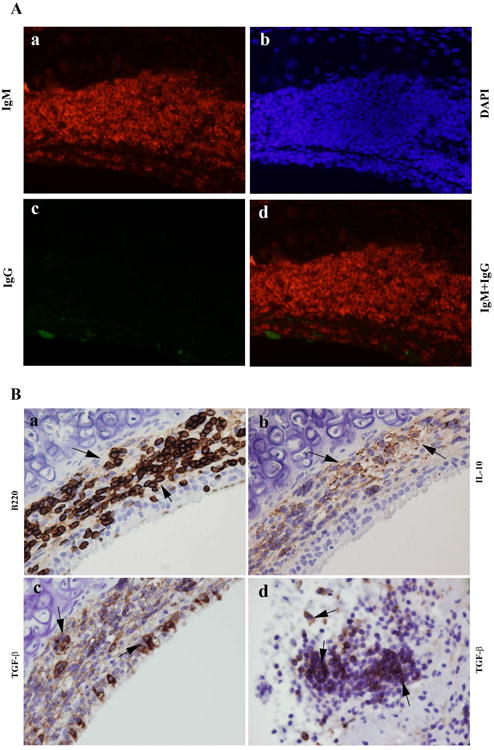
A Double immunofluorescence staining of IgM and IgG in the Rapa treated allografts on day 28. Red indicates IgM positive B cells in A-a and A-d. Green indicates IgG positive B cells in A-c and A-d. Blue is DAPI staining for viewing negative staining cells in A-b and A-d. B Representative immunohistochemical staining of B220, IL-10 and TGF-β1 in the Rapa treated allografts. Cells stained brown indicate positive staining cells. The arrows indicated B220+ cells in B-a, IL-10 + cells in B-b, TGF- β1+ cells in B-c and -d. The magnifications were 400× in all pictures.
Figure 5. Comparison of Effects of Rapa on IL-10+ (A) and TGF-β1+ (B) cells in the allografts with DMSO controls on day 28.
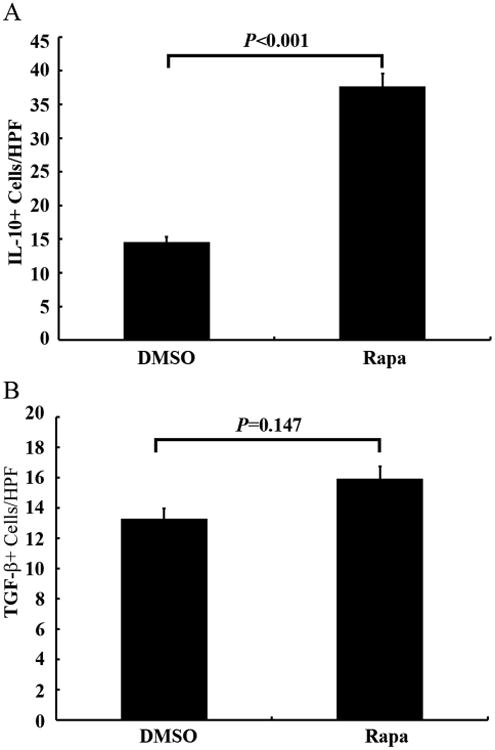
The number of positive staining cells per high power field (HPF) was assessed by Photoshop counting tool, and at least 5 fields were counted per trachea. Data shown are the mean ± SD, n=6.
Bioplex assay of cytokines
The luminex assay showed that rapamycin treatment significantly inhibited pro-inflammatory cytokines, including IL-1β, IL-6, IL-13, and IL-17, when compared with DMSO controls at day 7 and 14. Furthermore, rapamycin also greatly increased the levels of anti-inflammatory cytokines, IL-10 and IL-4, in the allografts on Day 28 (Figure 6A and 6B). The activated TGF-β1 production in the rapamycin treated groups was decreased when compared with DMSO controls (18034.5±1978pg/ml vs 37405.0±3012pg/ml), while increased when compared with isograft groups (18034.5±1978pg/ml vs 8599±1453pg/ml) on day 28 (Suppl Figure 3).
Figure 6. The Levels of IL-10 (A) and IL-4 (B) in the allografts and isografts on day 28.
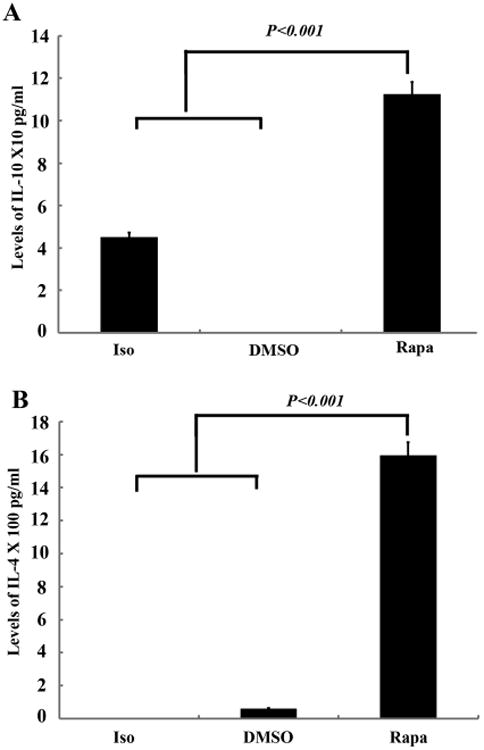
Luminex assay was performed using the Bio-Plex 200 system with standard controls. The concentration is pg/ml. Data shown are the mean ± SD, n=6.
FoxP3+regulatory T cells (Tregs) were significantly elevated in the Rapamycin treated groups
Since Bregs secret anti-inflammatory cytokine IL-10 and TGF-β1, which subsequently stimulate Tregs generation(26), we further tested Tregs in our experimental groups. The results showed that rapamycin treatment (both dosages) significant increase Tregs when compared with DMSO controls (Figure 7).
Figure 7. Comparison of Effects of Rapa on FoxP3+ regulatory T cells (Tregs) in the allografts with DMSO controls on day 28.
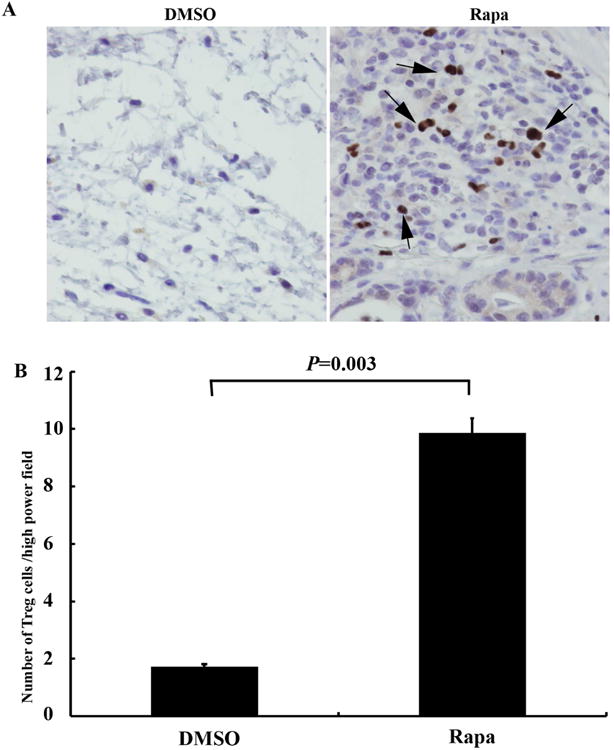
A Representative immunohistochemical staining of FoxP3+ Tregs in the treated allografts. Cells stained brown indicate positive staining cells (marked by arrows). The magnifications are 400×. B Statistical analysis of Tregs cells in Rapa treated and DMSO control in the allografts. The number of positive staining cells per high power field (400×) was assessed by Photoshop counting tool, and at least 5 fields were counted per trachea. Data shown are the mean ± SD, n=6.
Discussion
The mouse HTT model of BO described in this study displays several features that are similar to human BO (5, 29) and is a well-established research model. Heterotopic tracheas transplanted into human leukocyte antigens mismatched recipients develop injury that can be divided into an acute phase (days 1 to 3), a later phase (days 4 to 12) and a fibro-obliteration phase (days 13 to 28). The current studies in our laboratory have focused on the role played by fibrocytes (early progenitor cells) in the development of BO. We have found (through CXCR4-CXCL12 pathways) rapamycin prevents the influx of fibrocytes into the allografts and attenuates BO development. As a result of these studies we found other immune cells concentrating in the allografts of these treated animals. Majority of these cells were subsequently determined to be Breg cells. To our knowledge this is the first report of Bregs's role in BO attenuation.
Rapamycin is a relatively new immunosuppressant drug that functions as a serine/threonine kinase inhibitor to prevent rejection in organ transplantation. The full mechanism of rapamycin's immunosuppression is still under exploration. When we study the effects of rapamycin on BO development through inhibiting fibrocytes recruitment (10) and promoting epithelial progenitor cell regeneration(11), an unexpected finding was seen that rapamycin significantly reduced luminal obliteration, but markedly increased cellular infiltration in the allografts on days 14 and 28. We and others have reported previously that the cellular infiltration was peaked on day 7, then the inflammatory cells gradually decreased to base levels (6, 7, 27, 28). In this study we discovered that rapamycin prevented luminal obliteration post tracheal transplantation and that Bregs infiltrated into the allografts indicating their involvement in BO attenuation. This finding suggests new mechanisms of BO development and prevention. Breg-targeted therapy may open a new window for BO treatment.
In organ transplantation, the composition of the B-cell compartment is increasingly identified as an important determinant for graft outcome. Naïve and transitional B cells have been correlated with long-term allograft survival and operational tolerance, while the memory B cells have been linked to decreased allograft survival(30). It is known that B cells are involved in regulating the immune responses through producing antibodies and inducing optimal T cell activation (12, 13). The antibody-mediated rejection in post lung transplantation has been well investigated and recently reviewed by McManigle W et al(31). Multiple studies have demonstrated that Bregs, a distinct subset of B cells, exert significant immunoregulatory functions (14-17, 19-22). For mouse Bregs, even though the molecular marks to definite the Bregs is still controversy, the two most widely accepted are Claudia Mauri's definition of Bregs as a subset of the transitional 2 (T2) B cells, defined as CD19+CD21hiCD23hiIgMhiCD24hi (21) and Thomas Tedder's description of B10 cells as CD19+CD5+CD1dhi (22). Another obvious marker for the Bregs is the production of the immunosuppressive cytokine IL-10 and TGF-β1 (14, 18, 20-24, 26). In our current study, we identified that rapamycin treatment not only significantly elevated B220+IgM+IgG- B cells (Figures 2-4), but markedly spared IL-10+ and TGF- β1+ B cells in the allografts on days 14 and 28 post tracheal transplantation (Figures 4-5). The luminex assay confirmed that IL-10 level was highly increased in the rapamycin treated allografts when compared with the DMSO controls (Figure 6). These results strongly indicate that rapamycin may attenuate BO through secretion of anti-inflammatory cytokine IL-10 and TGF-β1.
Even though rapamycin elevated TGF-β1 production in the infiltrated B cells populations, the total TGF-β+ cell counts had no significant difference between the rapamycin treated allografts and DMSO controls (Figure 5B) on day 28. Furthermore, the luminex assay results revealed that the total latent form of TGF-β1 had no significant difference between rapamycin treatment group and DMSO control groups on day 28. While the both active forms of TGF-β1 and TGF-β2 were significantly decreased. The TGF data from the luminex assay seemed controversy to our immunohistochemical staining data. Our additional experimental data demonstrated that the high levels of TGF-β1 in DMSO controls was originated from the various of fibrotic cells, while the main source of the TGF-β1 in rapamycin treated allografts was mainly from the B220+ B cells. No fibrotic tissues were observed in the rapamycin treated allografts, while few B220+ B cells were identified in the DMSO control allografts. These results suggest that the total levels of TGF-β1 may not as important as the origination cells of this molecule. It is quite possible that the same TGF-β1 molecule from different originations, in different locations, and in different environments, may act differently. For examples, Liu et al reported TGF-β1 promoted the production of alpha smooth muscle protein and transformation of fibroblasts into myofibroblasts through the Smad3 dependent signal pathway, thus resulting in the development of bronchiolitis obliterans (32). While Schliesser et al. demonstrated that TGF-β1 led to increasing of CD25(+)Foxp3(+)-expressing Tregs (33), which are well-known inhibitory regulatory cells to immune response and results in allograft tolerance and long-term graft survival. Lung transplantation patients were normally treated with immunosuppressive agents, such as Sirolimus, cyclosporine A, Tacrolimus or azathioprine for successful outcomes (2, 34). Based on these findings, we proposed that the total level of TGF-β1 could not be used as a biomarker to monitor the process of BO development post lung transplantation, but the B220+IGM+IgG-TGF-β1+ cells can be served as a useful cellular marker for prognosis and treatment of BO.
We found that rapamycin not only elevated B22+IgM+IgG-IL-10+TGF-β1+ Bregs, but also significantly increased Foxp3+ Tregs, which is a subset of CD4+CD25+Foxp3+ lymphocytes, have the functional ability to suppress immune responses in vitro and in vivo. Our current findings are consistent with the previous reports that rapamycin administration was also associated with an increase in Tregs (35-39). It is notable that Breg cells can not only inhibit Th1/Th17-mediated immune responses but also convert effector T cells into Tregs (39-42), The promotion effects of Bregs on the Tregs, was mediated by IL-10 and TGF-b1 (26, 33, 41, 42). In addition, Schliesser et al. proved that addition of TGF-β+retinoic acid or Rapa resulted in an increase of CD25(+)Foxp3(+)-expressing T cells, but addition of TGF-β+retinoic acid seems to be superior over rapamycin in stabilizing the phenotype and functional capacity of Tregs (33). Thus, we suggest the possible mechanism for rapamycin-induced Tregs elevation is that rapamycin increases Bregs, which subsequently secreted IL-10 and TGF-β1. Then these two molecules stimulate the conversion of T cells into Tregs in our mouse HTT model.
This study has limitations in the following aspects: 1) The heterotopic tracheal transplant model of bronchiolitis obliterans is a large airway model, while it is a small airway disease in humans; 2) The transplanted tracheas are neither aerated nor surgically revascularized. Recent reports showed other murine models of BO, such as the orthotopic tracheal transplant model and the lung transplant model (43, 44). However, these other models do not generate airway obliteration as consistently as the HTT model, and are more difficult to reproduce technically. Therefore, the HTT model remains the most reliable model of BO. In addition, because the current results were obtained in mouse BO model, it may be not applicable exactly in clinics.
In conclusion our results indicate that Breg infiltration is a possible mechanism that prevents OB in rapamycin treated animals. Rapamycin spare B220+IgM+IgG-IL-10+TGF-β1+ Bregs, which subsequently release anti-inflammatory IL-10 and TGF-β1. These two important molecules lead to the increasing of Tregs. These results suggest that Bregs, Tregs, IL-10 (both total levels and cellular) and cellular TGF-β1 (not the total level of TGF-β1) could be used a serial markers for prognosis and monitoring parameters during immunosuppressive treatment of BO patients after lung transplantation. These cells and molecules could be potential combinational targeted treatment of BO patient post lung transplantation.
Supplementary Material
Supplementary Figure 1. Representative immunostaining picture of TGF-β1+ cells in the allografts with DMSO controls on day 28. Brown/dark brown indicate TGF-β1+ cells. All sections were counterstained lightly with hematoxylin for viewing negatively stained cells. The magnifications are indicated in the pictures. The solid arrows in the top panel indicate the amplified area in the bottom panel. The solid arrows in the bottom panel indicate the TGF-β1 positive cells.
Supplementary Figure 2. Immunohistochemical staining of B220+ and IL-10+ B cells in the spleens of recipients on day 28 post tracheal transplantation. A Representative immunostaining picture of B220+ and IL-10+ B cells in the spleen of DMSO treated recipients. Representative immunostaining picture of B220+ and IL-10+ B cells in the spleen of DMSO treated recipients. B Representative immunostaining picture of B220+ and IL-10+ B cells in the spleen of Rapa treated recipients. Brown/dark brown indicate B220 or IL-10 +B cells. All sections were counterstained lightly with hematoxylin for viewing negatively stained cells. The magnifications are indicated in the pictures.
Supplementary Figure 3. The Levels of active TGF-β1 in the allografts and isografts on day 28. Luminex assay was performed using the Bio-Plex 200 system with standard controls. The concentration is pg/ml. Data shown are the mean ± SD, n=6.
Acknowledgments
CLL is supported by a grant sponsored by the National Heart, Lung, and Blood Institute (1K08HL094704-01) and The Advancing Research in Transplantation Science (ARTS) 2011 Grant Program from Pfizer. ILK is supported by T32HL007849
A Glossary of Abbreviations
- ANOVA
Analysis of variance
- BO
Bronchiolitis obliterans
- Bregs
Regulatory B lymphocytes
- CD
Cluster of differentiation
- DAPI
4,6-diamidine-2-phenylindole dihydrochloride
- DMSO
Dimethyl sulfoxide
- Foxp3
Forkhead box P3
- HE
Hematoxylin & eosin
- HTT
Heterotopic tracheal transplant
- IgG/M
Immunoglobulin G/M
- IL
Interleukin
- SEM
Standard error of the mean
- TGF-β1
Transforming growth factor beta 1
- Tregs
Regulatory T lymphocytes
Footnotes
Disclosure: There is no conflict of interest to disclose.
Publisher's Disclaimer: This is a PDF file of an unedited manuscript that has been accepted for publication. As a service to our customers we are providing this early version of the manuscript. The manuscript will undergo copyediting, typesetting, and review of the resulting proof before it is published in its final citable form. Please note that during the production process errors may be discovered which could affect the content, and all legal disclaimers that apply to the journal pertain.
References
- 1.Granton J. Update of early respiratory failure in the lung transplant recipient. Curr Opin Crit Care. 2006;12:19–24. doi: 10.1097/01.ccx.0000198995.44943.63. [DOI] [PubMed] [Google Scholar]
- 2.Bhorade SM, Stern E. Immunosuppression for lung transplantation. Proc Am Thorac Soc. 2009;6:47–53. doi: 10.1513/pats.200808-096GO. [DOI] [PubMed] [Google Scholar]
- 3.Chan A, Allen R. Bronchiolitis obliterans: an update. Curr Opin Pulm Med. 2004;10:133–141. doi: 10.1097/00063198-200403000-00008. [DOI] [PubMed] [Google Scholar]
- 4.Jaramillo A, Naziruddin B, Zhang L, Reznik SI, Smith MA, Aloush AA, Trulock EP, Patterson GA, Mohanakumar T. Activation of human airway epithelial cells by non-HLA antibodies developed after lung transplantation: a potential etiological factor for bronchiolitis obliterans syndrome. Transplantation. 2001;71:966–976. doi: 10.1097/00007890-200104150-00023. [DOI] [PubMed] [Google Scholar]
- 5.McDyer JF. Human and murine obliterative bronchiolitis in transplant. Proc Am Thorac Soc. 2007;4:37–43. doi: 10.1513/pats.200605-107JG. [DOI] [PMC free article] [PubMed] [Google Scholar]
- 6.Zhao Y, LaPar DJ, Steidle J, Emaminia A, Kron IL, Ailawadi G, Linden J, Lau CL. Adenosine signaling via the adenosine 2B receptor is involved in bronchiolitis obliterans development. J Heart Lung Transplant. 2010;29:1405–1414. doi: 10.1016/j.healun.2010.07.005. [DOI] [PMC free article] [PubMed] [Google Scholar]
- 7.Lau CL, Zhao Y, Kron IL, Stoler MH, Laubach VE, Ailawadi G, Linden J. The role of adenosine A2A receptor signaling in bronchiolitis obliterans. Ann Thorac Surg. 2009;88:1071–1078. doi: 10.1016/j.athoracsur.2009.06.032. [DOI] [PMC free article] [PubMed] [Google Scholar]
- 8.Nusair S, Or R, Junadi S, Amir G, Breuer R. Simultaneous donor marrow cell transplantation with reduced intensity conditioning prevents tracheal allograft obliteration in a bronchiolitis obliterans murine model. Chest. 2005;128:4024–4029. doi: 10.1378/chest.128.6.4024. [DOI] [PubMed] [Google Scholar]
- 9.Lama VN, Harada H, Badri LN, Flint A, Hogaboam CM, McKenzie A, Martinez FJ, Toews GB, Moore BB, Pinsky DJ. Obligatory role for interleukin-13 in obstructive lesion development in airway allografts. Am J Pathol. 2006;169:47–60. doi: 10.2353/ajpath.2006.050975. [DOI] [PMC free article] [PubMed] [Google Scholar]
- 10.Gillen JR, Zhao Y, Harris DA, Lapar DJ, Stone ML, Fernandez LG, Kron IL, Lau CL. Rapamycin blocks fibrocyte migration and attenuates bronchiolitis obliterans in a murine model. Ann Thorac Surg. 2013;95:1768–1775. doi: 10.1016/j.athoracsur.2013.02.021. [DOI] [PMC free article] [PubMed] [Google Scholar]
- 11.Gillen JR, Zhao Y, Harris DA, Lapar DJ, Kron IL, Lau CL. Short-course rapamycin treatment preserves airway epithelium and protects against bronchiolitis obliterans. Ann Thorac Surg. 2013;96:464–472. doi: 10.1016/j.athoracsur.2013.04.068. [DOI] [PMC free article] [PubMed] [Google Scholar]
- 12.LeBien TW, Tedder TF. B lymphocytes: how they develop and function. Blood. 2008;112:1570–1580. doi: 10.1182/blood-2008-02-078071. [DOI] [PMC free article] [PubMed] [Google Scholar]
- 13.DiLillo DJ, Hamaguchi Y, Ueda Y, Yang K, Uchida J, Haas KM, Kelsoe G, Tedder TF. Maintenance of long-lived plasma cells and serological memory despite mature and memory B cell depletion during CD20 immunotherapy in mice. J Immunol. 2008;180:361–371. doi: 10.4049/jimmunol.180.1.361. [DOI] [PubMed] [Google Scholar]
- 14.Fillatreau S, Sweenie CH, McGeachy MJ, Gray D, Anderton SM. B cells regulate autoimmunity by provision of IL-10. Nat Immunol. 2002;3:944–950. doi: 10.1038/ni833. [DOI] [PubMed] [Google Scholar]
- 15.Matsushita T, Yanaba K, Bouaziz JD, Fujimoto M, Tedder TF. Regulatory B cells inhibit EAE initiation in mice while other B cells promote disease progression. J Clin Invest. 2008;118:3420–3430. doi: 10.1172/JCI36030. [DOI] [PMC free article] [PubMed] [Google Scholar]
- 16.Fillatreau S, Gray D, Anderton SM. Not always the bad guys: B cells as regulators of autoimmune pathology. Nat Rev Immunol. 2008;8:391–397. doi: 10.1038/nri2315. [DOI] [PubMed] [Google Scholar]
- 17.Mizoguchi A, Bhan AK. A case for regulatory B cells. J Immunol. 2006;176:705–710. doi: 10.4049/jimmunol.176.2.705. [DOI] [PubMed] [Google Scholar]
- 18.Mizoguchi A, Mizoguchi E, Takedatsu H, Blumberg RS, Bhan AK. Chronic intestinal inflammatory condition generates IL-10-producing regulatory B cell subset characterized by CD1d upregulation. Immunity. 2002;16:219–230. doi: 10.1016/s1074-7613(02)00274-1. [DOI] [PubMed] [Google Scholar]
- 19.Mauri C, Ehrenstein MR. The ‘short’ history of regulatory B cells. Trends Immunol. 2008;29:34–40. doi: 10.1016/j.it.2007.10.004. [DOI] [PubMed] [Google Scholar]
- 20.Lund FE. Cytokine-producing B lymphocytes-key regulators of immunity. Curr Opin Immunol. 2008;20:332–338. doi: 10.1016/j.coi.2008.03.003. [DOI] [PMC free article] [PubMed] [Google Scholar]
- 21.Bouaziz JD, Yanaba K, Tedder TF. Regulatory B cells as inhibitors of immune responses and inflammation. Immunol Rev. 2008;224:201–214. doi: 10.1111/j.1600-065X.2008.00661.x. [DOI] [PubMed] [Google Scholar]
- 22.Yanaba K, Bouaziz JD, Haas KM, Poe JC, Fujimoto M, Tedder TF. A regulatory B cell subset with a unique CD1dhiCD5+ phenotype controls T cell-dependent inflammatory responses. Immunity. 2008;28:639–650. doi: 10.1016/j.immuni.2008.03.017. [DOI] [PubMed] [Google Scholar]
- 23.Mauri C, Bosma A. Immune regulatory function of B cells. Annu Rev Immunol. 2012;30:221–241. doi: 10.1146/annurev-immunol-020711-074934. [DOI] [PubMed] [Google Scholar]
- 24.DiLillo DJ, Matsushita T, Tedder TF. B10 cells and regulatory B cells balance immune responses during inflammation, autoimmunity, and cancer. Ann N Y Acad Sci. 2010;1183:38–57. doi: 10.1111/j.1749-6632.2009.05137.x. [DOI] [PubMed] [Google Scholar]
- 25.Pistoia V. Production of cytokines by human B cells in health and disease. Immunol Today. 1997;18:343–350. doi: 10.1016/s0167-5699(97)01080-3. [DOI] [PubMed] [Google Scholar]
- 26.Yang M, Rui K, Wang S, Lu L. Regulatory B cells in autoimmune diseases. Cell Mol Immunol. 2013;10:122–132. doi: 10.1038/cmi.2012.60. [DOI] [PMC free article] [PubMed] [Google Scholar]
- 27.Zhao Y, Gillen JR, Harris DA, Kron IL, Murphy MP, Lau CL. Treatment with placenta-derived mesenchymal stem cells mitigates development of bronchiolitis obliterans in a murine model. J Thorac Cardiovasc Surg. 2014;147:1668–1677 e1665. doi: 10.1016/j.jtcvs.2013.09.041. [DOI] [PMC free article] [PubMed] [Google Scholar]
- 28.Zhao Y, Steidle JF, Upchurch GR, Kron IL, Lau CL. Prevention of the second stage of epithelial loss is a potential novel treatment for bronchiolitis obliterans. J Thorac Cardiovasc Surg. 2013;145:940–947. doi: 10.1016/j.jtcvs.2012.07.098. [DOI] [PMC free article] [PubMed] [Google Scholar]
- 29.Sato M, Keshavjee S, Liu M. Translational research: animal models of obliterative bronchiolitis after lung transplantation. Am J Transplant. 2009;9:1981–1987. doi: 10.1111/j.1600-6143.2009.02770.x. [DOI] [PubMed] [Google Scholar]
- 30.Heidt S, Hester J, Shankar S, Friend PJ, Wood KJ. B cell repopulation after alemtuzumab induction-transient increase in transitional B cells and long-term dominance of naive B cells. Am J Transplant. 2012;12:1784–1792. doi: 10.1111/j.1600-6143.2012.04012.x. [DOI] [PMC free article] [PubMed] [Google Scholar]
- 31.McManigle W, Pavlisko EN, Martinu T. Acute cellular and antibody-mediated allograft rejection. Semin Respir Crit Care Med. 2013;34:320–335. doi: 10.1055/s-0033-1348471. [DOI] [PubMed] [Google Scholar]
- 32.Liu HX, Li Y, Zhao CH, Liu Y, Zhang QG, Cong W, Lan XG, Xu S, Han LB, Zhang L. The role of transforming growth factor-beta1/Smad3 signaling in bronchiolitis obliterans following lung transplantation. Zhonghua Yi Xue Za Zhi. 2007;87:2069–2073. [PubMed] [Google Scholar]
- 33.Schliesser U, Chopra M, Beilhack A, Appelt C, Vogel S, Schumann J, Panov I, Vogt K, Schlickeiser S, Olek S, et al. Generation of highly effective and stable murine alloreactive Treg cells by combined anti-CD4 mAb, TGF-beta, and RA treatment. Eur J Immunol. 2013;43:3291–3305. doi: 10.1002/eji.201243292. [DOI] [PubMed] [Google Scholar]
- 34.Sacher VY, Fertel D, Srivastava K, Panos A, Nguyen D, Baxter T, Shafazand S, Pham SM. Effects of prophylactic use of sirolimus on bronchiolitis obliterans syndrome development in lung transplant recipients. Ann Thorac Surg. 2014;97:268–274. doi: 10.1016/j.athoracsur.2013.07.072. [DOI] [PubMed] [Google Scholar]
- 35.Chen JF, Gao J, Zhang D, Wang ZH, Zhu JY. CD4+Foxp3+ regulatory T cells converted by rapamycin from peripheral CD4+CD25(-) naive T cells display more potent regulatory ability in vitro. Chin Med J (Engl) 2010;123:942–948. [PubMed] [Google Scholar]
- 36.Prevel N, Allenbach Y, Klatzmann D, Salomon B, Benveniste O. Beneficial role of rapamycin in experimental autoimmune myositis. PLoS One. 2013;8:e74450. doi: 10.1371/journal.pone.0074450. [DOI] [PMC free article] [PubMed] [Google Scholar]
- 37.Singh AK, Seavey CN, Horvath KA, Mohiuddin MM. Ex-vivo expanded baboon CD4+ CD25 Hi Treg cells suppress baboon anti-pig T and B cell immune response. Xenotransplantation. 2012;19:102–111. doi: 10.1111/j.1399-3089.2012.00697.x. [DOI] [PubMed] [Google Scholar]
- 38.Knechtle SJ. Immunoregulation and tolerance. Transplant Proc. 2010;42:S13–15. doi: 10.1016/j.transproceed.2010.07.039. [DOI] [PubMed] [Google Scholar]
- 39.Blair PA, Chavez-Rueda KA, Evans JG, Shlomchik MJ, Eddaoudi A, Isenberg DA, Ehrenstein MR, Mauri C. Selective targeting of B cells with agonistic anti-CD40 is an efficacious strategy for the generation of induced regulatory T2-like B cells and for the suppression of lupus in MRL/lpr mice. J Immunol. 2009;182:3492–3502. doi: 10.4049/jimmunol.0803052. [DOI] [PMC free article] [PubMed] [Google Scholar]
- 40.Walters S, Webster KE, Sutherland A, Gardam S, Groom J, Liuwantara D, Marino E, Thaxton J, Weinberg A, Mackay F, et al. Increased CD4+Foxp3+ T cells in BAFF-transgenic mice suppress T cell effector responses. J Immunol. 2009;182:793–801. doi: 10.4049/jimmunol.182.2.793. [DOI] [PubMed] [Google Scholar]
- 41.Carter NA, Vasconcellos R, Rosser EC, Tulone C, Munoz-Suano A, Kamanaka M, Ehrenstein MR, Flavell RA, Mauri C. Mice lacking endogenous IL-10-producing regulatory B cells develop exacerbated disease and present with an increased frequency of Th1/Th17 but a decrease in regulatory T cells. J Immunol. 2011;186:5569–5579. doi: 10.4049/jimmunol.1100284. [DOI] [PubMed] [Google Scholar]
- 42.Ray A, Basu S, Williams CB, Salzman NH, Dittel BN. A novel IL-10-independent regulatory role for B cells in suppressing autoimmunity by maintenance of regulatory T cells via GITR ligand. J Immunol. 2012;188:3188–3198. doi: 10.4049/jimmunol.1103354. [DOI] [PMC free article] [PubMed] [Google Scholar]
- 43.Genden EM, Boros P, Liu J, Bromberg JS, Mayer L. Orthotopic tracheal transplantation in the murine model. Transplantation. 2002;73:1420–1425. doi: 10.1097/00007890-200205150-00010. [DOI] [PubMed] [Google Scholar]
- 44.Okazaki M, Krupnick AS, Kornfeld CG, Lai JM, Ritter JH, Richardson SB, Huang HJ, Das NA, Patterson GA, Gelman AE, et al. A mouse model of orthotopic vascularized aerated lung transplantation. Am J Transplant. 2007;7:1672–1679. doi: 10.1111/j.1600-6143.2007.01819.x. [DOI] [PubMed] [Google Scholar]
Associated Data
This section collects any data citations, data availability statements, or supplementary materials included in this article.
Supplementary Materials
Supplementary Figure 1. Representative immunostaining picture of TGF-β1+ cells in the allografts with DMSO controls on day 28. Brown/dark brown indicate TGF-β1+ cells. All sections were counterstained lightly with hematoxylin for viewing negatively stained cells. The magnifications are indicated in the pictures. The solid arrows in the top panel indicate the amplified area in the bottom panel. The solid arrows in the bottom panel indicate the TGF-β1 positive cells.
Supplementary Figure 2. Immunohistochemical staining of B220+ and IL-10+ B cells in the spleens of recipients on day 28 post tracheal transplantation. A Representative immunostaining picture of B220+ and IL-10+ B cells in the spleen of DMSO treated recipients. Representative immunostaining picture of B220+ and IL-10+ B cells in the spleen of DMSO treated recipients. B Representative immunostaining picture of B220+ and IL-10+ B cells in the spleen of Rapa treated recipients. Brown/dark brown indicate B220 or IL-10 +B cells. All sections were counterstained lightly with hematoxylin for viewing negatively stained cells. The magnifications are indicated in the pictures.
Supplementary Figure 3. The Levels of active TGF-β1 in the allografts and isografts on day 28. Luminex assay was performed using the Bio-Plex 200 system with standard controls. The concentration is pg/ml. Data shown are the mean ± SD, n=6.


