

Abstract
Background and Purpose
The respective impact and interplay between ABC (P‐glycoprotein/P‐gp/Abcb1a, BCRP/ABCG2, MRP/ABCC) and SLC transporter functions at the blood–brain barrier (BBB) and blood–retinal barriers (BRB) are incompletely understood.
Experimental Approach
We measured the initial cerebral and retinal distribution of selected ABC substrates by in situ carotid perfusion using P‐gp/Bcrp knockout mice and chemical ABC/SLC modulation strategies. P‐gp, Bcrp, Mrp1 and Mrp4 were studied by confocal retina imaging.
Key Results
Chemical or physical disruption of P‐gp increased [3H]‐verapamil transport by ~10‐fold at the BBB and ~1.5‐fold at the BRB. [3H]‐Verapamil transport involved influx‐mediated by an organic cation clonidine‐sensitive/diphenhydramine‐sensitive proton antiporter at both barriers; this effect was unmasked when P‐gp was partially or fully inhibited/disrupted at the BBB. Studies of [3H]‐mitoxantrone and [3H]‐zidovudine transport suggested, respectively, that Bcrp efflux was less involved at the BRB than BBB, whereas Mrps were significantly and similarly involved at both barriers. Confocal imaging showed that P‐gp and Bcrp were expressed in intra‐retinal vessels (inner BRB/iBRB) but absent from the blood/basal membrane of cells of the retinal pigment epithelium (outer BRB/oBRB/RPE) where, in contrast, Mrp1 and Mrp4 were localized.
Conclusions and Implications
P‐gp, Bcrp, Mrp1 and Mrp4 are differentially expressed at the outer and inner BRB, resulting in an altered ability to limit substrate distribution at the retina as compared with the BBB. [3H]‐Verapamil distribution is not P‐gp‐specific and involves a proton antiporter at both the BBB and BRB. However, this transport is concealed by P‐gp at the BBB, but not at the BRB, where P‐gp activity is reduced.
Abbreviations
- ABC
ATP‐binding cassette
- BBB
blood–brain barrier
- BRB
blood–retina barrier
- CV
choroidal vessels
- DPH
diphenhydramine; Elac, elacridar
- iBRB
inner blood–retina barrier
- KO
knockout
- oBRB
outer blood–retina barrier
- PD
pharmacodynamics
- P‐gp
P‐glycoprotein
- pHe
extracellular/vascular pH
- pHi
intracellular pH
- PK
pharmacokinetics
- RPE
retinal pigment epithelial cells
- SLC
solute carrier
- TKO
triple knockout [Abcb1a−/−, Abcb1b−/−, Abcg2−/−] mice
- WT
wild type
Tables of Links
| TARGETS | |
|---|---|
| ABCB1 (P‐gp; Abcb1a) | MRP4 (ABCC4) |
| ABCC (MRP) | OATP2 |
| ABCG2 (BCRP; Abcg2) | OCT (SLC22A1‐3) |
| MATE1 (SLC47A1) | OCTN (SLC22A4‐5) |
| MRP1 (ABCC1) | SLC family |
These Tables list key protein targets and ligands in this article which are hyperlinked to corresponding entries in http://www.guidetopharmacology.org, the common portal for data from the IUPHAR/BPS Guide to PHARMACOLOGY (Pawson et al., 2009) and are permanently archived in the Concise Guide to PHARMACOLOGY 2013/14 (Alexander et al., 2013).
Introduction
The distribution of compounds into the brain and the retina is controlled by the similar features of key interfaces designed as barriers. They are formed by the tight‐junctional linking of endothelial cells in nervous tissue, constituting the blood–brain barrier (BBB) and the inner blood–retina barrier (iBRB), or of epithelial cells that form the brain‐CSF barrier and the outer BRB (oBRB) (Abbott et al., 2010; Newman, 2013). These barriers exert selective control on molecular exchanges through the expression of transporters, which are now recognized as key elements of drug pharmacokinetics (PK). The determination of transporter expression at these key interfaces is the first important step in understanding their potential implication in PK and pharmacodynamics (PD). The functional evaluation of the in vivo contribution of transporters to drug distribution is, however, quite complex, because the permeability of these barriers to drugs involves multiple processes (e.g. passive and/or carrier‐mediated transport). In addition, substrates can be transported by a combination of carrier‐mediated mechanisms, possibly working in opposite directions and expressed at different levels depending on the cell type.
The ATP‐binding cassette (ABC) family of transporters (e.g. P‐gp/ABCB1, BCRP/ABCG2 and MRPs/ABBC) consists of unidirectional transporters that allow the exit of substrates from the luminal surface of the cell into the blood, whatever the direction of the concentration‐gradient flux for these substrates across the luminal membrane of the BBB (Abbott et al., 2010: Tournier et al., 2011a). ABC transporters increase the efflux of their substrates, also called efflux enhancement, when the outward ABC flux matches the substrate concentration‐gradient flux. The opposite situation (i.e. when ABC transporters work against the concentration gradient) corresponds to an ABC transporter that reduces the influx of its substrates, called influx hindrance (Ambudkar et al., 1997; Syvanen et al., 2006). These two distinct molecular abilities of ABC transporters to impact their substrate fluxes have been shown to be quantitatively dissimilar. ABC efflux enhancement has been shown to be greater than the rate (or V max) of influx hindrance, leading to dissimilar and therefore asymmetric rates (Ambudkar et al., 1997; Stein et al., 1994). However, the most effective PK–PD ABC effects are mainly dependent on their influx hindrance abilities, which impact the PK distribution of substrates and their concentration level in tissues (Syvanen et al., 2006).
Evidence has also emerged for the expression of drug transporters from the solute carrier (SLC) superfamily at several body interfaces (Giacomini et al., 2010; Ronaldson and Davis, 2013; Roth et al., 2012). The SLC drug transporters, unlike the ABC transporters, are mainly bidirectional, and their resulting fluxes of transport match the most favourable force flux of the organic or inorganic substrate. A bidirectional proton antiporter of the SLC family that primarily mediates cationic drug flux has recently been functionally established to control at least the uptake/distribution phase of drugs such as diphenhydramine (DPH), clonidine, cocaine, nicotine or oxycodone at the BBB and/or the BRB (Andre et al., 2009; Chapy et al., 2015a, 2014; Cisternino et al., 2013; Okura et al., 2008).
These diverse molecular transporter properties combined with tissue specific parameters (e.g. localization and expression levels of the transporters) make it difficult to predict their overall PK effect. The complex interplay between some ABC transporters expressed on the same (blood‐facing) side of the cell membrane (i.e. the luminal BBB) has been illustrated for several dual substrates (Agarwal and Elmquist, 2012a; de Vries et al., 2007; Giacomini et al., 2010; Lin et al., 2013; Polli et al., 2009). However, less is known about the consequences of the functional interactions between ABC and SLC superfamily members that share a common substrate. Verapamil is a validated carbon‐11 PET probe for the study of P‐gp function at the human BBB (Romermann et al., 2013; Syvanen and Eriksson, 2013). Although verapamil transport does not involve other ABC proteins (e.g. Bcrp and Mrp) at the BBB (Romermann et al., 2013), it has been identified as a substrate for members of the SLC family such as OCTN1 (Yabuuchi et al., 1999), as well as for a molecularly unidentified SLC clonidine/proton antiporter, as suggested by its influence on clonidine transport at the mouse BRB (Chapy et al., 2015a) and by in vitro studies with BRB cell lines (Han et al., 2001; Kubo et al., 2013).
In the present study, we hypothesized that differences in ABC‐transporter expression/function at the BBB and the BRB may differentially impact the distribution of their substrates to the brain and the retina. We also tested the presence of a carrier‐mediated influx for verapamil, a prototypical P‐gp substrate, to elucidate the interplay between influx and unidirectional ABC export processes at both the BBB and the BRB. Therefore, we used the in situ carotid perfusion method and selective substrates of P‐gp (verapamil), Bcrp (mitoxantrone) and Mrp (zidovudine) to provide quantitative measure for drug influx/distribution to the brain and the retina. The localization of ABC transporters at the BRB was then studied using immunohistochemistry to allow for comparison with the expression of transporters at the BBB and clarify the functional data.
Methods
Animals and ethical statements
In vivo experiments were performed with male Fvb mice [wild type (WT)] (Janvier, Genest, France), and triple knockout (TKO) P‐gp and Bcrp [Abcb1a−/−, Abcb1b−/−, Abcg2−/−] originally obtained from the Dr A. H. Schinkel laboratory (Netherlands Cancer Institute, Amsterdam, The Netherlands). The 300 Fvb mice used for this study (25–30 g, 7–11 weeks) were housed in a controlled environment (22 ± 3°C; 55 ± 10% relative humidity) and a 12 h dark/light cycle, with access to food and tap water ad libitum. All studies involving animals are reported in accordance with ARRIVE guidelines for reporting experiments involving animals (Kilkenny et al., 2010; McGrath et al., 2010) and complied with the ethical rules of the European directive (210/63/EU) for experimentation with laboratory animals; they were approved by the ethics review committee of Paris Descartes University (approval no. 12‐183/12‐2012).
In situ carotid perfusion
Surgical procedure and perfusion
Transport of [3H]‐verapamil, [3H]‐mitoxantrone or [3H]‐zidovudine at the luminal BRB and BBB was measured by in situ carotid perfusion (Cattelotte et al., 2008; Takasato et al., 1984). With this method, vascular composition of the brain and the eye is totally substituted by an artificial fluid whose constitution can be modified. Mice were anaesthetized with ketamine–xylazine (140–8 mg∙kg−1, i.p.), and a catheter was inserted into the right carotid artery after ligation of the appropriate vessels. Just before perfusion, the heart was cut. Perfusion started immediately at a constant flow rate of 2.5 mL∙min−1. Each mouse was perfused with [3H]‐verapamil (0.011 MBq∙mL−1, ~4 nmol∙L−1), [3H]‐mitoxantrone (0.011 MBq∙mL−1, ~71 nmol∙L−1) or [3H]‐zidovudine (0.011 MBq∙mL−1, ~26 nmol∙L−1) and a vascular marker [14C]‐sucrose (0.0037 MBq∙mL−1), with or without unlabelled selected compound. Perfusion was terminated by decapitating the mouse after 60 s for [3H]‐verapamil, and 120 s for [3H]‐mitoxantrone and [3H]‐zidovudine. The right eye (without optic nerve) and the right cerebral hemisphere were removed from the skull and dissected out on a freezer pack. The time course of linear accumulation of 3H‐compounds in the eye and the brain showed that no equilibrium was reached at the selected perfusion times (data not shown). The anterior and posterior segments of the eye and the vitreous humour were dissected out in some experiments, but radioactivity counted was at the background level in the vitreous humour and anterior tissues (data not shown) due to the short perfusion time and low amount of radioactivity used. The whole right eye without the optic nerve was digested in all other experiments. The tissues and aliquots of perfusion fluid were weighted, digested (Solvable®; Perkin Elmer) and mixed with Ultima‐gold XR® (Perkin Elmer). Dual‐label counting was carried out in a Tri‐Carb 2810TR (Perkin Elmer) to measure disintegrations per minute (dpm).
Perfusion fluid
The perfusion fluid was Krebs carbonate‐buffered physiological saline (mmol∙L−1): 128 NaCl, 24 NaHCO3, 4.2 KCl, 2.4 NaH2PO4, 1.5 CaCl2, 0.9 MgSO4 and 9 D‐glucose, warmed to 37°C and gassed with 95% O2/5% CO2 to bring pH to 7.40, unless otherwise specified. For the butyrate perfusion fluid, sodium chloride was replaced by sodium butyrate (100 mmol∙L−1). Hydrochloric acid was added in some experiments to bring the pH to 5.40 or 6.40. The fluid pH (pHe) was checked and adjusted with a digital pH meter (±0.05 pH units) immediately before perfusion.
[3H]‐Verapamil, [3H]‐mitoxantrone and [3H]‐zidovudine transport study
Tissue accumulation of 3H compounds was measured under trans‐influx zero to determine the kinetic conditions required to measure transport solely across the membrane separating the sucrose (vascular) from the non‐sucrose (tissue parenchyma) space. The perfusion time adopted ensured that the tissue distribution of the drugs was that of the initial linear part of the distribution kinetics. The first membrane (luminal/vascular) delimiting the sucrose space is the only kinetic interface that affected the distribution of the measured compound parameters.
Apparent initial tissue distribution volume and transport parameters
Calculations were performed as described previously (André et al., 2012; Cattelotte et al., 2008). The brain and eye tissue ‘vascular’ volume was estimated using the [14C]‐sucrose distribution volume (Vv; μL∙g−1):
| (1) |
where X * (dpm∙g−1) is the amount of [14C]‐sucrose in the right brain hemisphere or right eye and C * perf (dpm∙μL−1) is the [14C]‐sucrose concentration in the perfusion fluid. The data for any mouse whose V v was above the normal value (Cattelotte et al., 2008) were excluded from the study.
The apparent tissue distribution volume (V tissue, μL∙g−1) was calculated as:
| (2) |
where X tissue (dpm∙g−1) is the calculated tissue amount of [3H]‐drug and C perf (dpm∙μL−1) is the concentration in the perfusion fluid:
| (3) |
where X tot (dpm∙g−1) is the total quantity of 3H‐drug measured in the sample tissue. The amount of 3H‐drug in the vascular ‘[14C]‐sucrose’ space (V v C perf) was calculated and subtracted from the total (X tot) (Equation (3)).
The initial transport rate also called brain/eye clearance, expressed as a K in (μL∙s−1∙g−1), was calculated from the following:
| (4) |
where T is the perfusion time (s).
Extraction E (%) is given by the following:
| (5) |
where F (μL∙s−1∙g−1) is the perfusion flow measured with [3H]‐diazepam (eye: 19.2 μL∙s−1∙g−1; brain: 42.3 μL∙s−1∙g−1) (Cattelotte et al., 2008).
The export/exit ratio ER B corresponds to the impact of the ABC transporter on the distribution phase (i.e. influx hindrance ability) when transporter flux is in opposition to the concentration gradient flux (known in vitro as A‐to‐B transport). It can be measured before the establishment of equilibrium as the ratio of the compound's initial transport rate, when the transporter is chemically or molecularly inhibited/invalidated, divided by the initial transport rate of the substrate when the transporter is fully functional (Kalvass and Pollack, 2007). The export ratio ER A or efflux enhancement corresponds to impact in the opposite situation (or B to A) when the outward P‐gp flux matches the concentration gradient flux.
Confocal imaging of eye cryosections
The following primary antibodies were used: mouse IgG1 anti‐P‐gp C219 (ALX‐801‐002) diluted 1/50 and rat IgG2a anti‐Bcrp (ALX‐801‐036) diluted 1/50 (Enzo Life Sciences, Villeurbanne, France), mouse IgG2a anti‐Mrp1 (ab24102) diluted 1/100 and goat IgG anti‐Mrp4 (ab77184) diluted 1/100 (Abcam, Cambridge, UK) and rabbit anti‐Laminin (L9393) diluted 1/200 (Sigma). Appropriate goat or donkey AlexaFluor 488‐conjugated and AlexaFluor 555‐conjugated secondary antibodies were diluted 1/300 (Fisher Scientific, Illkirch, France).
Anaesthetized Fvb mice were transcardially perfused with cold fixative (4% paraformaldehyde in 0.1 mol∙L−1 phosphate buffer, pH 7.4). Eyeballs were excised, post‐fixed for 4 h at 4°C, rinsed in PBS and immersed in sucrose (30% in PBS) for 48 h before being frozen in Tissue‐Tek. Sagittal cryosections (20 μm) were cut and affixed on SuperFrost glass slides (Menzel‐Gläser, Braunschweig, Germany). Eye sections were treated in ethanol/acetic acid (2/1:v/v) for 10 min at −20°C, washed extensively in PBS and incubated for 1 h in PBS containing 1% BSA, 10% goat or donkey serum and 0.1% Triton X‐100. Staining was performed by incubation in primary antibodies diluted in PBS (overnight at 4°C), followed by incubation in secondary antibodies diluted in PBS (2 h at room temperature). Cell nuclei were counterstained using TOPRO‐3 (Fisher Scientific), and sections were mounted in 90% glycerol (v/v in PBS). Images (1024 × 1024 pixels) were recorded on a confocal microscope (TCS‐SP2; Leica, Nanterre, France) equipped with an X40 oil‐immersion objective (NA = 1.00). Pixel physical size ranged between 55 and 183 nm depending on the electronic zoom value while the diffraction‐limited resolution was 345 nm according to Rayleigh criteria at 565 nm. P‐gp and Bcrp staining specificity was assessed by labelling eye sections from TKO mice. Mrp1 and Mrp4 staining specificity was assessed by omitting primary antibody in the labelling procedure. Images shown are representative of three independent experiments performed in three animals (n = 3).
Data analysis
The data are means ± SD. One way anova and post hoc test (Dunnett) were used to identify significant differences, unless specified otherwise. Student's two‐tailed unpaired t‐test or anova was used to identify significant differences between groups when appropriate. Statistical significance was set at P < 0.05.
Drugs and chemicals
[3H](±)‐Verapamil (3.1012 Bq∙mmol−1) and [14C]‐sucrose (16.103 Bq∙mmol−1) were purchased from Perkin Elmer (Courtaboeuf, France). [3H]‐Zidovudine (48.1010 Bq∙mmol−1) and [3H]‐mitoxantrone (175.1010 Bq∙mmol−1) were obtained from Moravek (Brea, CA, USA). Elacridar (GF120918) (GSK, Collegeville, PA, USA) and valspodar (PSC833) (Novartis, Basel, Switzerland) were generously provided. All other chemicals were from Sigma (Saint Quentin‐Fallavier, France).
Results
ABC‐transporter‐mediated transport of [3H]‐verapamil, [3H]‐mitoxantrone and [3H]‐zidovudine at the BBB and BRB
At the BBB, the baseline entry rate of [3H]‐verapamil (2.5 ± 0.9 μL∙s−1∙g−1) was significantly increased after pharmacological P‐gp inhibition using in WT mice either elacridar 5 or 10 μmol∙L−1, or valspodar 10 μmol∙L−1. This increase was also observed in TKO mice (Figure 1A). The ER B was respectively 5.6, 9.7, 8.4 and 10.3 (Figure 1). At the BRB, the transport of [3H]‐verapamil was significantly increased by ~1.5‐fold after P‐gp inhibition using elacridar or valspodar, and by 1.3‐fold in TKO mice as compared with control WT mice (Figure 1). Studies of the transport rate of [3H]‐mitoxantrone in WT, elacridar treated (10 μmol∙L−1) and TKO mice revealed that the chemical or molecular disruption of Bcrp at the BBB significantly increased the [3H]‐mitoxantrone entry rate, with an ER B value of ~3.3 (P < 0.001) (Figure 2). In contrast, no significant effect of Bcrp disruption on the [3H]‐mitoxantrone entry rate was observed at the BRB (Figure 2). The ER B of [3H]‐zidovudine using the broad‐spectrum MRP inhibitor MK571 (100 μmol∙L−1) was 2.0 and 1.4 at the BBB and BRB respectively (Figure 2). The rates of [3H]‐zidovudine transport in WT mice co‐perfused with elacridar (5 μmol∙L−1) at the BBB (110 ± 15%; n = 4) and BRB (92 ± 17%; n = 4) were not statistically different from rates in control WT mice at the BBB (100 ± 16%; n = 7) and BRB (100 ± 17%; n = 7). Similarly, there was no significant effect of P‐gp/Bcrp on [3H]‐zidovudine at the BBB and BRB in TKO mice as compared with WT mice (Figure 2).
Figure 1.
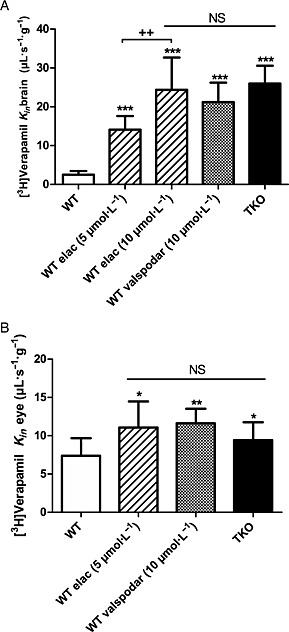
Transport of [3H]‐verapamil and effect of the modulation of P‐glycoprotein at the mouse BBB (A) and BRB (B). [3H]‐Verapamil transport was measured at the BBB (A) and at the BRB (B) by in situ carotid perfusion for 60 s in WT mice with or without co‐perfusion of elacridar (5 or 10 μmol L−1) or valspodar (10 μmol L−1), and in TKO [Abcb1a−/−, Abcb1b−/−, Abcg2−/−] mice. Data represent means ± SD of 7–11 animals. (A) *P < 0.05, **P < 0.01, ***P < 0.001 for comparisons with WT mice and ++ P < 0.001 between elacridar 5 and 10 μmol L−1 groups. (B) NS, non‐significant and *P < 0.05, **P < 0.01, ***P < 0.001 for comparisons with the WT group.
Figure 2.
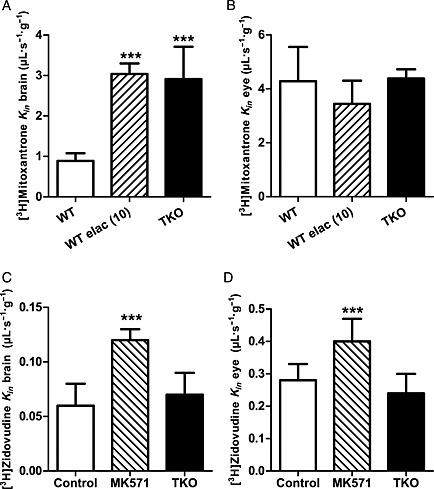
Involvement of Bcrp (A and B) and Mrp (C and D) transporters at the BBB and BRB. The transport of [3H]‐mitoxantrone at the BBB (A) and the BRB (B) evaluated by in situ carotid perfusion for 120 s, in WT mice with or without elacridar (elac, 10 μmol L−1) and in TKO [Abcb1a−/−, Abcb1b−/−, Abcg2−/−] mice. Data represent means ± SD (n = 5 mice except TKO n = 4). ***P < 0.001 for comparisons between control, elacridar and TKO groups. Transport of [3H]‐zidovudine at the BBB (C) and BRB (D) of WT mice evaluated by in situ carotid perfusion for 120 s with or without MK571 (100 μmol L−1), and TKO mice. Data represent means ± SD (n = 5–8 mice). ***P < 0.001 for comparisons with control.
Involvement of an influx transporter component in [3H]‐verapamil transport at the BRB and the BBB
The effects of the cis‐inhibition of selected compounds on brain and retinal [3H]‐verapamil transport in P‐gp/Bcrp‐deficient mice was compared with WT mice to study the potential influence of carrier‐mediated [3H]‐verapamil uptake. Prototypical compounds known to inhibit the function of SLC transporters were co‐perfused during the in situ carotid perfusion experiments to establish an inhibition profile for [3H]‐verapamil uptake (Chapy et al., 2015b). The lack of inhibition by tetraethylammonium, ergothioneine and choline at the BBB and BRB suggests that [3H]‐verapamil transport does not involve the SLC carriers Oct (Slc22a1‐3), Mate1 (SLC47A1) or Octn (SLC22A4‐5) at these barriers (Table 1). Verapamil significantly inhibited [3H]‐verapamil transport at both the BBB and the BRB in TKO mice, suggesting a carrier‐mediated influx process (Table 1).
Table 1.
Effects of selected compounds on [3H]‐verapamil transport in WT (A) and TKO (B) at the BBB and BRB
| A | |||
|---|---|---|---|
| Compound | Concentration (mmol L−1) | BBB [3H]‐verapamil transport (K in; μL s−1 g−1) (WT mice) | BRB [3H]‐verapamil transport (K in; μL s−1 g−1) (WT mice) |
| Control | – | 2.5 ± 0.9 | 7.4 ± 2.3 |
| Ergothioneine | 2 | 3.2 ± 0.9 | 9.2 ± 3.2 |
| TEA | 15 | 3.3 ± 1.4 | 7.6 ± 1.8 |
| Choline | 15 | 1.9 ± 0.3 | 6.9 ± 2.9 |
| B | |||
| Compound | Concentration (mmol L−1) | BBB [3H]‐verapamil transport (K in; μL s−1 g−1) (TKO mice) | BRB [3H]‐verapamil transport (K in; μL s−1 g−1) (TKO mice) |
| Control | – | 26.0 ± 4.6 | 9.8 ± 2.0 |
| TEA | 15 | 27.0 ± 2.0 | 8.6 ± 2.0 |
| Verapamil | 0.5 | 18.0 ± 2.9 ** | 6.4 ± 1.1 * |
| Clonidine | 10 | 18.1 ± 3.5 ** | 4.1 ± 0.6 *** |
| DPH | 0.05 | 13.6 ± 2.1 *** | 6.8 ± 1.1 * |
| DPH | 0.5 | 12.4 ± 2.3 *** | 3.9 ± 1.0 *** |
| DPH | 5 | 11.9 ± 3.2 *** | 4.0 ± 1.0 *** |
The effect of selected compounds on BBB and BRB luminal transport of [3H]‐verapamil (~4 nmol L−1) was measured by in situ brain co‐perfusion (cis‐inhibition) in Krebs carbonate perfusion fluid (pHe 7.40) for 60 s in WT (A) and TKO [Abcb1a−/−, Abcb1b−/− and Abcg2−/−] (B) mice. Data are expressed as means ± SD (n = 5–8 mice per condition except clonidine n = 4).
P < 0.05,
P < 0.01,
P < 0.001 compared with the control group.
WT, wild type; TKO, triple knockout; BBB, blood–brain barrier; BRB, blood–retina barrier; TEA, tetraethylammonium; DPH, diphenhydramine.
In WT mice, DPH (50 μmol∙L−1) did not impact the rate of [3H]‐verapamil transport into the brain but decreased the transport rate of [3H]‐verapamil to the retina by 1.4‐fold (P < 0.01) (Figure 3). At this DPH concentration, there was a significant (P < 0.001) 1.9‐fold and 1.5‐fold reduction of [3H]‐verapamil transport at the BBB and the BRB, respectively, in TKO mice (Table 1), suggesting that P‐gp deficiency is needed to unmask verapamil BBB influx or that the influx transporter is lacking at the BBB in WT mice. However, when half the P‐gp‐transport capacity at the BBB was inhibited by elacridar (5 μmol∙L−1) co‐perfused with 30 mmol∙L−1 DPH in WT mice, there was a significant 1.5‐fold decrease (P < 0.05) in the transport rate of [3H]‐verapamil at the BBB as compared with the transport rate in WT mice perfused with elacridar (5 μmol∙L−1) alone (Figure 3). When WT mice were perfused with elacridar (10 μmol∙L−1), that is, when P‐gp‐transport capacity at the BBB was completely inhibited chemically, in the presence of DPH (30 mmol∙L−1), the transport rate of [3H]‐verapamil decreased 1.85‐fold at the BBB (Figure 3; P < 0.01) as compared with the transport rate in WT mice perfused with elacridar (10 μmol∙L−1) alone. This 1.85‐fold decrease in [3H]‐verapamil transport by complete P‐gp inhibition was similar in magnitude to the 1.9‐fold maximal influx decrease measured in TKO mice perfused with DPH (Table 1). The co‐perfusion of DPH (0.1; 5 or 30 mmol∙L−1) with elacridar (5 μmol∙L−1) significantly decreased the BRB transport rate of [3H]‐verapamil from 1.5‐fold to 2.2‐fold as compared with the [3H]‐verapamil transport rate measured in WT mice perfused with elacridar alone at 5 μmol∙L−1 (Figure 3).
Figure 3.
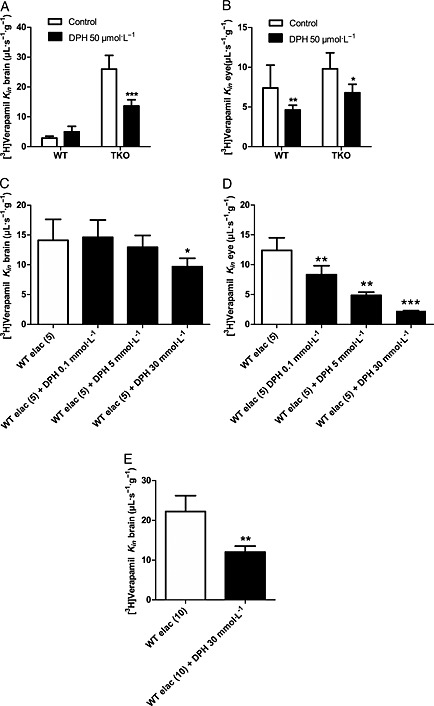
Effect of DPH on [3H]‐verapamil transport in WT mice with or without half or full inhibition of P‐gp with elacridar (elac, 5 or 10 μmol L−1), and in TKO [Abcb1a−/−, Abcb1b−/−, Abcg2−/−] mice. [3H]‐Verapamil transport at the BBB (A, C and E) and at the BRB (B and D) was measured by in situ carotid perfusion for 60 s. [3H]‐Verapamil transport with or without DPH (50 μmol L−1) in WT and TKO mice (A and B). [3H]‐Verapamil transport in WT mice perfused with elacridar (elac, 5 or 10 μmol L−1) alone (control) or with the addition of DPH (0.1, 5 or 30 mmol L−1) (C, D and E). Data represent means ± SD (n = 5–8 mice). *P < 0.05; **P < 0.01; ***P < 0.001 for comparisons between conditions with and without DPH.
According to the experiment with DPH at 5 mmol∙L−1 (Table 1) in TKO mice, we can approximate the passive diffusion rate for [3H]‐verapamil to ~12 μL∙s−1∙g−1 at the BBB and ~4 μL∙s−1∙g−1 at the BRB, which correspond to a tissue extraction rate (Equation (5)) of ~28% at the BBB and ~21% at the BRB. These suggest that about 54 and 59%, respectively, of the [3H]‐verapamil transport measured in the brain and retina of TKO mice can be attributed to a carrier‐mediated influx process.
pH dependency of [3H]‐verapamil transport
The in situ carotid method completely replaces blood by an artificial perfusate fluid that can be set up to study the effect of inhibitors, substrate concentrations or electrolytes under conditions that could also never be observed physiologically. These experiments help to characterize better the transport properties and functional/biochemical features of the diffusion processes involved. To better assess the proton dependency of [3H]‐verapamil transport, transport was assessed under conditions of non‐physiological vascular or intracellular pH modifications.
Modulation of vascular/perfusion fluid pHe
Verapamil is a basic drug (pKa ~ 9.8), leaving more than 99.6% of [3H]‐verapamil in a cationic form at pH 7.4. Brain perfusion of TKO mice with a fluid set to yield a pH of 5.40, 6.40 or 7.40 revealed a significant increase of [3H]‐verapamil transport by 4.3‐fold and 13.7‐fold at pH 6.40 and 7.40 respectively (P < 0.001), compared with pH 5.40 (Figure 4). Similar observations were made regarding the BRB [3H]‐verapamil transport rate, with a significant 2.5‐fold and 4.2‐fold increase at pH 6.40 and 7.40, respectively, compared with pH 5.40 in TKO mice. In situ carotid perfusion of WT mice with a fluid set to yield a pH of 5.40 or 7.40 revealed a significant increase in [3H]‐verapamil transport by 6.9‐fold and 3.4‐fold at BBB and BRB, respectively (P < 0.001), at pH 7.40 compared with pH 5.40 (Figure 4).This increase measured in WT or TKO mice could be related to a higher neutral [3H]‐verapamil fraction at pH 7.4 versus acidic pH and/or to a modulation of the transport rate according to the extracellular/vascular proton concentration.
Figure 4.
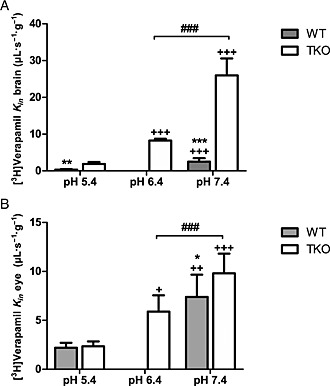
Effect of extracellular pH modulation (pHe) on [3H]‐verapamil transport at the BBB (A) and BRB (B) in TKO [Abcb1a−/−, Abcb1b−/−, Abcg2−/−] and WT mice. Effects of the Krebs carbonate perfusion fluid at a pHe of 5.40, 6.40 or 7.40 on [3H]‐verapamil transport (K in; μL s−1 g−1), measured by in situ mouse carotid perfusion for 60 s. Data represent means ± SD (n = 5–7 mice except pHe 6.4 n = 4). ++ P < 0.01 and +++ P < 0.001 compared with the pH 5.40 in the same mice strain (WT or TKO). ***P < 0.001, **P < 0.01 and *P < 0.05 for comparisons with TKO and WT at pHe 7.4 or 5.4 and ### P < 0.001 for comparisons at pHe 6.40 and 7.40 in TKO.
Alteration of intracellular pH (pHi)
To limit the confounding interpretation of pHe modulation experiments due to changes in the proportion of the neutral form of verapamil and assess the involvement of a proton‐dependent mechanism, [3H]‐verapamil transport at pHe 7.40 was evaluated with a NH4Cl (30 mmol∙L−1) or butyrate (100 mmol∙L−1) co‐perfusion protocol, leading to an acute increase or decrease of the pHi respectively (Chapy et al., 2015a). NH4Cl co‐perfusion in TKO mice reduced the BBB transport rate of [3H]‐verapamil significantly by 1.9‐fold (P < 0.001; Figure 5). At the BRB, the pHi increase following NH4Cl co‐perfusion led to a significant 2.0‐fold decrease of the [3H]‐verapamil transport rate in TKO mice (Figure 5). At the BRB, co‐perfusion with butyrate, which decreased the pHi, significantly increased (1.5‐fold; P < 0.001) the BRB entry rate of [3H]‐verapamil (Figure 5). These results suggest a role for a verapamil/proton antiporter at the BBB and BRB in P‐gp‐deficient mice. Conversely, the increase of the intracellular pH by NH4Cl (30 mM) in WT mice did not alter the BBB transport rate of [3H]‐verapamil (Figure 5). However, at the BRB, the pHi increase led to a significant and similar ~2.2‐fold (P < 0.01) decrease of the [3H]‐verapamil transport rate in both TKO and WT mice (Figure 5).
Figure 5.
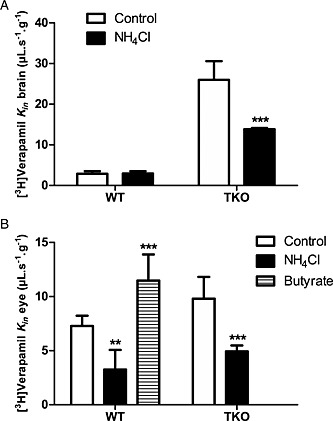
Effect of intracellular pH (pHi) acidification or alkalinization on [3H]‐verapamil transport in TKO [Abcb1a−/−, Abcb1b−/−, Abcg2−/−] and WT mice. [3H]‐Verapamil transport at the BBB (A) and at the BRB (B) measured by in situ carotid perfusion for 60 s without (control) or with NH4Cl (30 mmol L−1) or butyrate (100 mmol L−1) co‐perfusion. Data represent means ± SD (n = 5–6 mice except ‘NH4Cl’ in WT mice n = 4). ***P < 0.001 for comparisons (Student's t‐test) between conditions with and without NH4Cl (30 mmol L−1).
Immunodetection of the ABC transporters P‐gp, Bcrp, Mrp1 and Mrp4 at the BRB
The expression of P‐gp, Bcrp, Mrp1 and Mrp4 proteins was assessed at the BRB of WT mice by immunolabelling and confocal imaging of retina cryosections (Figure 6). Laminin costaining allowed us to delineate the basal lamina of retinal vessels and the choroid. P‐gp labelling gave a strong signal in retinal vessels (arrows, Figure 6) and a patchy intracellular staining in retinal pigment epithelial (RPE) cells forming the oBRB (arrowheads, Figure 6). However, control experiments in Fvb TKO revealed that only the signal in retinal vessels (iBRB) was specific, while the signal at the RPE resulted from a non‐specific binding of the anti‐P‐gp antibody (Supporting Information Figure S1A). Bcrp staining was detected in retinal (arrows, Figure 6) and fenestrated choroidal vessels (cv, Figure 6) but not at the RPE (arrowheads, Figure 6). This staining was specific because Bcrp labelling in Fvb TKO retina sections yielded no significant signal (Supporting Information Figure S1B). Mrp4 was undetectable in retinal vessels (arrows, Figure 6) but was detected in the RPE as a thin pattern located between the nuclei of RPE cells and the laminin‐positive choroid (arrowheads, Figure 6). This pattern is consistent with this transporter being expressed in the basal (blood‐facing) membrane of RPE cells. Similar results were observed for Mrp1 which was undetectable in retinal vessels (arrows, Figure 6) but expressed in the basal aspect of the RPE (arrowheads, Figure 6). Apart from blood–retina interfaces, a faint expression of Mrp1 and Mrp4 was also found in retinal cells. Control experiments, in which anti‐Mrp4 and anti‐Mrp1 primary antibodies were omitted, yielded no significant signal in the retina (Supporting Information Figure S2). Altogether, these experiments suggest that P‐gp and Bcrp but not Mrp1, nor Mrp4, are expressed in retinal vessels (iBRB). Conversely, Mrp1 and Mrp4 but not P‐gp, nor Bcrp, appear to be expressed in the basal (blood‐facing) membrane of the RPE.
Figure 6.
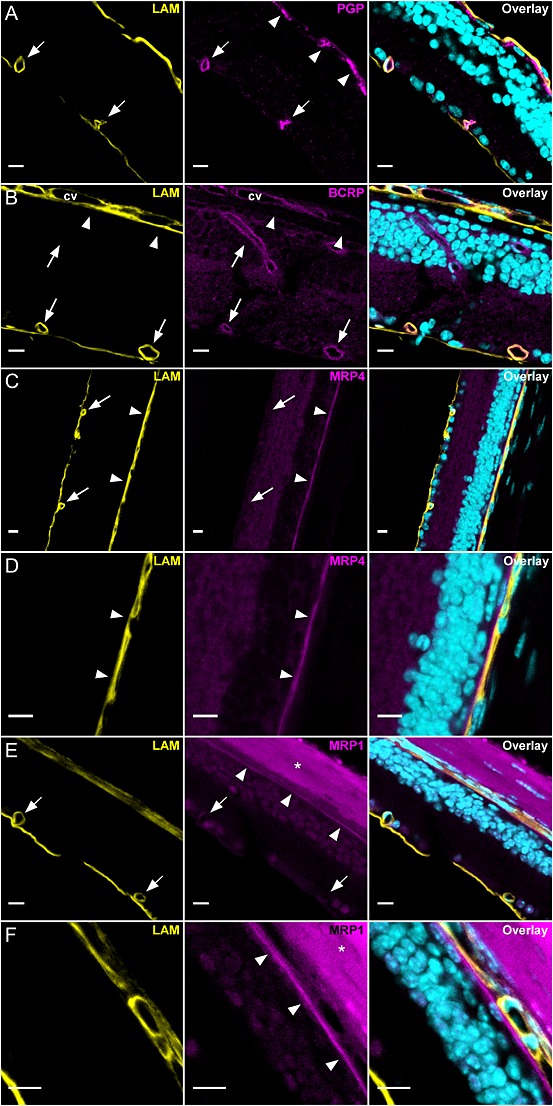
Confocal imaging of P‐gp, Bcrp, Mrp1 and Mrp4 in the retina of Fvb mice (n = 3). Retina cryosections were stained for each transporter (magenta) along with laminin (yellow) and nuclei DNA (cyan). In all panels laminin staining (yellow) allowed us to delineate the basal lamina of tight retinal vessels and the fenestrated choroidal vessels (cv). (A) P‐gp was expressed in retinal capillaries (arrows) forming the iBRB but undetectable at the RPE cells forming the oBRB (arrowheads). The intracellular patchy staining in RPE cells was non‐specific as demonstrated in Fvb TKO [Abcb1a−/−, Abcb1b−/−, Abcg2−/−] mice (see text and Supporting Information Figure S1A). (B) Bcrp was expressed in retinal capillaries (arrows) and choroidal vessels (cv) but undetectable at the RPE/oBRB (arrowheads). (C, D, E and F) Mrp4 and Mrp1 were undetectable in retinal vessels (iBRB) (arrows) but expressed at the RPE/oBRB (arrowheads) showing a thin staining pattern between the nuclei of RPE cells and the laminin‐positive choroid. Apart from the RPE, Mrp1 and Mrp4 appeared to be faintly expressed in retinal cells. When sclera was present, it bound secondary antibodies giving a strong non‐specific background (asterisk and Supporting Information Figure S2B,C). Scale bars: 10 μm.
Discussion and Conclusions
Diverse standardized PK conditions have been used to determine the impact of P‐gp on the transport of chemical entities. ER B, ER A and ER α, respectively, represent the diverse abilities of P‐gp/ABC to limit the influx, enhance the efflux and affect the equilibrium of these entities (Ambudkar et al., 1997; Kalvass and Pollack, 2007; Syvanen et al., 2006). In the present study, we observed that the ability of P‐gp and Bcrp to limit drug influx/distribution (i.e. ER B) was lower at the retina than at the brain. These discrepancies are in accordance with the absence of P‐gp and Bcrp expression at the oBRB blood side membrane observed by immunohistochemistry. Conversely, the magnitude of the impact of Mrp on zidovudine efflux was similar at the BRB and the BBB, and Mrp1 and Mrp4 were both shown to be expressed at the blood side of the oBRB. Besides, verapamil permeability was not exclusively controlled by P‐gp and involved a carrier‐mediated uptake at both the BBB and BRB, through the clonidine /DPH‐sensitive proton antiporter. We showed that verapamil influx was concealed by P‐gp function at the BBB but not at the BRB, thus unveiling a tissue‐specific interplay between these transporters.
At the mouse BBB, the molecular disruption or chemical inhibition of P‐gp led to a similar maximal ER B potency, corresponding to a ~10‐fold increase in the [3H]‐verapamil transport rate, demonstrating that chemical inhibition had the mechanistic ability to fully block P‐gp. In in situ carotid perfusion, the transporter is exposed to the inhibitor directly at selected unbound vascular concentrations, thus avoiding inappropriate PK variability and allowing full or partial P‐gp inhibition to be achieved. Indeed, full P‐gp inhibition in vivo requires an optimized administration protocol with a PK(–PD) that overlaps with the critical PK phases of the target/victim drug to maximize P‐gp interaction (Kreisl et al., 2015).
[11C]‐Verapamil is a useful PET tracer to study P‐gp function, but not an ideal one. Its drawbacks include its extensive metabolism and its low basal brain distribution, which may be improved by the partial chemical inhibition of P‐gp during the PET session (Syvanen and Eriksson, 2013). Thus, [11C]‐verapamil PET kinetic modelling after i.v. administration is based only on the first 5–15 min of data acquisition, when radiometabolites account for less than 5% of the total (Ikoma et al., 2006; Romermann et al., 2013). This method allows the reliable estimation of the BBB influx rate constant, K 1. Under these conditions, the impact of P‐gp on the K 1 of [11C]‐verapamil can be rigorously compared with the ER B measured in rodents using the in situ brain perfusion method. PET imaging with [11C]‐verapamil reveals an ER B ratio of 4 at the human BBB and 12 in the rat (Bankstahl et al., 2008). It has been pointed out that the impact of P‐gp in mice could be over 30‐fold, which is considered many times higher than that reachable in humans (Kalvass et al., 2013). Comparing loperamide brain transport in P‐gp‐deficient and WT mice, Dagenais et al. (2004) observed an ER B of 10.4, which, along with the ER B of norbuprenorphine (ER B = 12; Alhaddad et al., 2012), is one of the highest ER B values measured by in situ mouse brain perfusion that we know of. In the same mouse strains, a 65‐fold P‐gp‐effect for loperamide has been observed by measuring the in vivo brain‐to‐blood concentration ratio at 4 h (Kalvass et al., 2004). Standardized in vivo measurements of the P‐gp effect should explore steady state in the drug fate or multiple time points of the overall brain and plasma drug PK, allowing the AUC of these tissues and their ratio in WT and P‐gp‐deficient mice (e.g. ER α) to be measured and compared. However, the steady state is not always the most relevant moment in the PD of psychoactive drugs, including at least several drugs of abuse, for which brain entry rate/distribution is more critical than overall/extent drug brain presence in defining their addictive properties (Gorelick, 2012; Minogianis et al., 2013; Volkow et al., 2012). These large P‐gp magnitude in rodents or in in vitro studies could be more readily reached when the PK of the substrate also includes the elimination phase, allowing the measurement of efflux enhancement abilities (ER A, ER α), which are known to be even higher than the ER B (Ambudkar et al., 1997; Stein et al., 1994). Regarding verapamil, the P‐gp ER B at the BBB is then only 2.5‐ and 3.0‐fold higher in mice (this study) and rats, respectively, than the human ER B reported using PET, assuming complete P‐gp inhibition. The ~2‐fold higher P‐gp expression measured at the mouse BBB as compared with the human BBB by proteomic studies may explain this discrepancy in scaling data from rodents to humans (Shawahna et al., 2011; Uchida et al., 2011b).
Although the impact of ABC transporters has been explored to some extent at the BBB, less is known regarding the BRB in vivo. Chemical or physical P‐gp disruption led to a significant ~1.5‐fold increase in [3H]‐verapamil transport at the BRB, which was already fully inhibited by elacridar at 5 μmol∙L−1, whereas BBB transport was only half inhibited at this concentration. The 6.3‐fold lower [3H]‐verapamil ER B at the BRB as compared with the BBB also suggests that P‐gp efflux is less important at the retina. A previous study using P‐gp‐deficient rats to evaluate [3H]‐verapamil distribution in the eye using the retinal uptake index method shows a similar 1.5‐fold ER B effect (Fujii et al., 2014). In contrast to the BBB, chemical or physical Bcrp disruption was insufficient to reveal any impact on the ER B measured using [3H]‐mitoxantrone in the whole retina. Indeed, whole tissue studies could overlook small regional or cellular effects, and Bcrp function could locally protect the iBRB and nonetheless impact retinal ER A and/or ER α substrate kinetics. The ability of Mrps to impact [3H]‐zidovudine transport (Jorajuria et al., 2004) was measured by a chemical inhibition strategy using MK571. This led to an ER B of 2.0 and 1.4 at the BBB and BRB, respectively, suggesting similar Mrp expression/density and function at these blood–neural tissue barriers.
One possible explanation for the ER B discrepancies between the brain and the retina is that ABC expression/localization along the two retinal barriers is different. Vessels forming the iBRB are heterogeneously distributed across the retina, whereas the oBRB covers the entire posterior side of the retina, strengthening its overall importance. Many regions of the retina are capillary/iBRB free, particularly the high‐visual‐acuity macula area, and the retina of some mammals (e.g. horse and rabbit) has no iBRB (Steuer et al., 2005). It has been estimated in the mouse that the blood surface of the iBRB represents ~4 mm2, and ~19 mm2 for a plane basal/blood oBRB membrane (Chikaraishi et al., 2007; Zhou and Williams, 1999). These histological elements are in agreement with the biochemical fact that the high metabolic needs of retinal photoreceptors are satisfied mainly by the fenestrated choroidal vasculature through the oBRB (Newman, 2013). Based on these data, therefore, it is most probable that the retina entry of a compound mainly reflects the permeability of the oBRB to it, although it is not possible to distinguish whether a compound enters through the iBRB or the oBRB simply by sampling the retina.
Similar to the BBB, P‐gp and Bcrp are expressed at the iBRB (Asashima et al., 2006; Greenwood, 1992; Shen et al., 2003; Tagami et al., 2009). However, studies regarding their presence at the RPE forming the oBRB are few and contradictory (Mannermaa et al., 2009; Steuer et al., 2005). Bcrp has also not been evidenced in human or bovine primary RPE cells or in the mouse RPE (Asashima et al., 2006; Mannermaa et al., 2009). Together with the differential P‐gp and Bcrp expression at the iBRB and oBRB and their absence at the basal (side facing blood) oBRB membrane, the greater surface area covered by the oBRB could explain the significantly lower involvement of P‐gp/Bcrp in global retinal substrate distribution as compared with the BBB. The lack of P‐gp and Bcrp expression at the basal oBRB raises questions about protection mechanisms against xenobiotics at this barrier. Interestingly, PK protection at the oBRB may also be completed by other ABC proteins, such as the Mrps, as suggested functionally using [3H]‐zidovudine and by the detection of Mrp1 and Mrp4 at the blood/basal oBRB. MRP1, MRP4 and MRP5 have been especially evidenced at the human BRB, although MRP4/Mrp4 and not MRP1/Mrp1 has been shown at the BBB (Agarwal et al., 2012b; Dahlin et al., 2013; Mannermaa et al., 2009; Shawahna et al., 2011; Uchida et al., 2011b; Zhang et al., 2008).
Along with P‐gp, our studies reveal the involvement of an influx transporter in the brain and retinal distribution of [3H]‐verapamil. This influx mechanism was not sensitive to known cationic transporter inhibitors, excluding the involvement of Oct/Octn or Mate transporters. The influx process was, however, sensitive to inhibition by verapamil, clonidine or DPH at the BBB and the BRB in TKO and/or WT mice. Protocols for proton modulation suggest a role for a DPH‐sensitive verapamil/proton antiporter, as shown in previous studies of verapamil transport in the RPE cell lines ARPE‐19 and RPE/Hu (Han et al., 2001). In contrast, a study using a retinal vascular endothelial cell line (TR‐iBRB2) has shown a verapamil influx process insensitive to proton modulation but with a similar drug‐inhibition profile (Kubo et al., 2013). The verapamil/proton antiporter described in our study presents common features with the previously described DPH or clonidine/proton antiporter at the mouse BBB (André et al., 2009), and verapamil has been shown to trans‐stimulate clonidine transport at the BRB, reinforcing the hypothesis of a common proton‐antiporter mechanism (Chapy et al., 2015a).
Interestingly, unveiling the verapamil influx transporter at the mouse BBB was achievable when P‐gp activity was half or fully inhibited or disrupted. Conversely, a retinal verapamil/proton antiporter was evidenced regardless of P‐gp disruption/inhibition, suggesting that the proton antiporter is not co‐expressed with P‐gp (i.e. at the oBRB) and/or that the relative expression level of both transporters on the same side of the membrane establishes a different kinetic pattern than that revealed at the BBB. We suggest that verapamil transport by P‐gp at the BBB is so important that the influx transporter is overwhelmed by P‐gp function. [11C]‐Verapamil PET results should be carefully interpreted in light of this potential misleading effect at the BBB (Pike, 2009; Tournier et al., 2011b). Indeed, the modulation of the relative amount of each transporter and the partial P‐gp inhibition protocol used to enhance basal PET signal could possibly bias this PET evaluation. Moreover, estimation of the translational P‐gp effect and the potential for drug–drug interactions at the human BBB should be preferentially carried out using another PET radioligand, as P‐gp dominance/interplay with the verapamil (SLC) proton antiporter could result in a different kinetic pattern in humans than that evidenced at the mouse BBB.
Similar observations have been made at the BBB regarding the interplay between diverse ABC transporters, such as the unveiling of Bcrp function for some dual substrates when P‐gp is absent (Agarwal and Elmquist, 2012a). Taking the example of DPDPE, a dual P‐gp‐OATP2 substrate, its influx by Oatp2/Slc21a6 transport is unmasked in P‐gp‐deficient mice (Dagenais et al., 2001), suggesting the need for P‐gp inhibition/negation to detect SLC influx (Ronaldson and Davis, 2013). In contrast, fentanyl (opioid agonist) has been shown to be a P‐gp substrate, and its P‐gp efflux is negated by an influx/uptake transporter in primary bovine BBB cell cultures, while verapamil has also been suggested to be a substrate of this fentanyl uptake transporter (Henthorn et al., 1999). These observations suggest that no general rule regarding P‐gp dominance over SLC can be established, and that other substrate properties such as the K m and V max for the respective transport processes involved and/or transporter cell amounts could help to better predict these effects according to the tissue studied (Uchida et al., 2011a). Molecular mechanisms that explain the functional interplay of P‐gp with other ABC or SLC transporters are poorly understood. Although PK modelling is assumed to compute the ‘synergistic’ effect shown for some dual P‐gp/Bcrp substrates (Kalvass et al., 2013), the identification of critical subcellular compartments linked to substrate‐binding and substrate‐release sites, in addition to other biochemical features (e.g. inhibition sites), appears critical to improve its prediction of the impact/interplay of transporters in the kinetics of multiple substrates (Litman et al., 2003; Zamek‐Gliszczynski et al., 2013).
In conclusion, the low P‐gp and Bcrp impact on the distribution of their substrates into the retina and the similar impact of Mrps on the retina as compared with the brain could be related more to their localization at the vascular side of the oBRB, revealing the presence of Mrp1 and Mrp4 and the lack of P‐gp and Bcrp. Our results confirm a role for a verapamil (SLC) influx transporter that could involve the functionally known DPH/clonidine/proton antiporter at the BRB and BBB. Unlike the BRB, where P‐gp has been shown to be lacking/less active, influx mediated by the verapamil/proton antiporter at the luminal BBB was unmasked when P‐gp transport was reduced. This transporter interplay makes the identification of SLC/ABC transporters and the assessment of their respective roles in the brain distribution of drugs challenging and represents a conceivable cause/mechanism for the conflicting conclusions obtained when comparing kinetics for multiple/dual substrates between species, models or tissues as illustrated for verapamil at the BRB and the BBB in vivo.
Author contributions
H. C., B. S., N. T., F. B., F. B‐C., X. D., J. M.S. and S. C. designed the research study and approved the manuscript. H. C., B. S. and S. C. performed the research. H. C., B. S. and S. C. analysed the data. H. C. and S. C. wrote the paper.
Conflict of interest
None.
Supporting information
Figure S1A P‐gp and BCRP immunostaining in Fvb triple knockout (TKO) [Abcb1a−/−, Abcb1b−/−, Abcg2−/−] mice (n = 3). Retina cryosections were stained for P‐gp/ABCB1a or BCRP/ABCG2 (magenta) along with laminin (yellow) and nuclei DNA (cyan). In all panels laminin staining (yellow) allow to delineate the basal lamina of retinal vessels and the choroidal vessels. (A) Anti‐P‐gp antibody gave a non‐specific intracellular patchy staining in RPE cells/oBRB (arrowheads) and a diffuse background in the sclera (asterisk). However no staining was detected in retinal capillaries. (B) Anti‐BCRP antibody gave only a very faint diffuse staining with no labelling of retinal capillaries. Scale bars: 10 μm.
Figure S1B Non‐specific immunostaining by the secondary antibodies used to detect goat anti‐MRP4 and mouse anti‐MRP1 in Fvb wild‐type (WT) mice (n = 3). Retina cryosections were stained with AF555‐conjugated secondary antibodies (magenta) along with laminin (yellow) and nuclei DNA (cyan). In all panels laminin staining (yellow) allow to delineate the basal lamina of retinal vessels and the choroidal vessels. (A) AF555‐conjugated donkey anti‐goat (DaGAF555) gave virtually no staining in the retina. (B, C) AF555‐conjugated donkey anti‐mouse (DaM‐AF555) gives a background staining in the sclera but no detectable staining in the retina. Scale bars: 10 μm.
Supporting info item
Acknowledgements
We thank Dr Alfred H. Schinkel for supplying the knockout mice, GSK for generously supplying elacridar and Novartis for generously supplying valspodar. We thank the cellular and molecular confocal imaging facility of UMS US025 INSERM, 3612 CNRS. We thank Dr S. Rasika for editing the English text. We thank the Paris Descartes University Foundation and Servier Laboratories for the financial support granted to H. C. S. C. received a grant from the University Paris Descartes – Sorbonne Paris Cité (appel d'offres 2012 de projets de recherche collaboratifs intersites).
Chapy, H. , Saubaméa, B. , Tournier, N. , Bourasset, F. , Behar‐Cohen, F. , Declèves, X. , Scherrmann, J.‐M. , and Cisternino, S. (2016) Blood–brain and retinal barriers show dissimilar ABC transporter impacts and concealed effect of P‐glycoprotein on a novel verapamil influx carrier. British Journal of Pharmacology, 173: 497–510. doi: 10.1111/bph.13376.
References
- Abbott NJ, Patabendige AA, Dolman DE, Yusof SR, Begley DJ (2010). Structure and function of the blood–brain barrier. Neurobiol Dis 37: 13–25. [DOI] [PubMed] [Google Scholar]
- Agarwal S, Elmquist WF (2012a). Insight into the cooperation of P‐glycoprotein (ABCB1) and breast cancer resistance protein (ABCG2) at the blood–brain barrier: a case study examining sorafenib efflux clearance. Mol Pharm 9: 678–684. [DOI] [PMC free article] [PubMed] [Google Scholar]
- Agarwal S, Uchida Y, Mittapalli RK, Sane R, Terasaki T, Elmquist WF (2012b). Quantitative proteomics of transporter expression in brain capillary endothelial cells isolated from P‐glycoprotein (P‐gp), breast cancer resistance protein (Bcrp), and P‐gp/Bcrp knockout mice. Drug Metab Dispos 40: 1164–1169. [DOI] [PMC free article] [PubMed] [Google Scholar]
- Alexander SPH, Benson HE, Faccenda E, Pawson AJ, Sharman JL, Spedding M, et al. (2013). The concise guide to PHARMACOLOGY 2013/14: transporters. Br J Pharmacol 170: 1706–1796. [DOI] [PMC free article] [PubMed] [Google Scholar]
- Alhaddad H, Cisternino S, Decleves X, Tournier N, Schlatter J, Chiadmi F, et al. (2012). Respiratory toxicity of buprenorphine results from the blockage of P‐glycoprotein‐mediated efflux of norbuprenorphine at the blood–brain barrier in mice. Crit Care Med 40: 3215–3223. [DOI] [PubMed] [Google Scholar]
- Ambudkar SV, Cardarelli CO, Pashinsky I, Stein WD (1997). Relation between the turnover number for vinblastine transport and for vinblastine‐stimulated ATP hydrolysis by human P‐glycoprotein. J Biol Chem 272: 21160–21166. [DOI] [PubMed] [Google Scholar]
- André P, Debray M, Scherrmann JM, Cisternino S (2009). Clonidine transport at the mouse blood–brain barrier by a new H+ antiporter that interacts with addictive drugs. J Cereb Blood Flow Metab 29: 1293–1304. [DOI] [PubMed] [Google Scholar]
- André P, Saubamea B, Cochois‐Guegan V, Marie‐Claire C, Cattelotte J, Smirnova M, et al. (2012). Transport of biogenic amine neurotransmitters at the mouse blood–retina and blood–brain barriers by uptake1 and uptake2. J Cereb Blood Flow Metab 32: 1989–2001. [DOI] [PMC free article] [PubMed] [Google Scholar]
- Asashima T, Hori S, Ohtsuki S, Tachikawa M, Watanabe M, Mukai C, et al. (2006). ATP‐binding cassette transporter G2 mediates the efflux of phototoxins on the luminal membrane of retinal capillary endothelial cells. Pharm Res 23: 1235–1242. [DOI] [PubMed] [Google Scholar]
- Bankstahl JP, Kuntner C, Abrahim A, Karch R, Stanek J, Wanek T, et al. (2008). Tariquidar‐induced P‐glycoprotein inhibition at the rat blood–brain barrier studied with (R)‐11C‐verapamil and PET. J Nucl Med 49: 1328–1335. [DOI] [PMC free article] [PubMed] [Google Scholar]
- Cattelotte J, André P, Ouellet M, Bourasset F, Scherrmann JM, Cisternino S (2008). In situ mouse carotid perfusion model: glucose and cholesterol transport in the eye and brain. J Cereb Blood Flow Metab 28: 1449–1459. [DOI] [PubMed] [Google Scholar]
- Chapy H, André P, Decleves X, Scherrmann J, Cisternino C (2015a). Polyspecific drug proton‐antiporter mediates diphenhydramine and clonidine transport at the mouse blood–retina barrier. Br J Pharmacol. doi:10.1111/bph.13246. [DOI] [PMC free article] [PubMed] [Google Scholar]
- Chapy H, Goracci L, Vayer P, Parmentier Y, Carrupt PA, Decleves X, et al. (2015b). Pharmacophore‐based discovery of inhibitors of a novel drug proton‐antiporter in human brain endothelial hCMEC/D3 cell line. Br J Pharmacol . doi:10.1111/bph.13258. [DOI] [PMC free article] [PubMed] [Google Scholar]
- Chapy H, Smirnova M, André P, Schlatter J, Chiadmi F, Couraud P, et al. (2014). Carrier‐mediated cocaine transport at the blood–brain barrier as a putative mechanism in addiction liability. Int J Neuropsychopharmacol 18. doi:10.1093/ijnp/pyu001. [DOI] [PMC free article] [PubMed] [Google Scholar]
- Chikaraishi Y, Shimazawa M, Hara H (2007). New quantitative analysis, using high‐resolution images, of oxygen‐induced retinal neovascularization in mice. Exp Eye Res 84: 529–536. [DOI] [PubMed] [Google Scholar]
- Cisternino S, Chapy H, André P, Smirnova M, Debray M, Scherrmann JM (2013). Coexistence of passive and proton antiporter‐mediated processes in nicotine transport at the mouse blood–brain barrier. AAPS J 15: 299–307. [DOI] [PMC free article] [PubMed] [Google Scholar]
- Dagenais C, Ducharme J, Pollack GM (2001). Uptake and efflux of the peptidic delta‐opioid receptor agonist. Neurosci Lett 301: 155–158. [DOI] [PubMed] [Google Scholar]
- Dagenais C, Graff CL, Pollack GM (2004). Variable modulation of opioid brain uptake by P‐glycoprotein in mice. Biochem Pharmacol 67: 269–276. [DOI] [PubMed] [Google Scholar]
- Dahlin A, Geier E, Stocker SL, Cropp CD, Grigorenko E, Bloomer M, et al. (2013). Gene expression profiling of transporters in the solute carrier and ATP‐binding cassette superfamilies in human eye substructures. Mol Pharm 10: 650–663. [DOI] [PMC free article] [PubMed] [Google Scholar]
- de Vries NA, Zhao J, Kroon E, Buckle T, Beijnen JH, van Tellingen O (2007). P‐glycoprotein and breast cancer resistance protein: two dominant transporters working together in limiting the brain penetration of topotecan. Clin Cancer Res 13: 6440–6449. [DOI] [PubMed] [Google Scholar]
- Fujii S, Setoguchi C, Kawazu K, Hosoya KI (2014). Impact of P‐glycoprotein on blood–retinal barrier permeability: comparison of blood–aqueous humor and blood–brain barrier using mdr1a knockout rats. Invest Ophthalmol Vis Sci 55: 4650–4658. [DOI] [PubMed] [Google Scholar]
- Giacomini KM, Consortium IT, Huang SM, Tweedie DJ, Benet LZ, Brouwer KL, et al. (2010). Membrane transporters in drug development. Nat Rev Drug Discov 9: 215–236. [DOI] [PMC free article] [PubMed] [Google Scholar]
- Gorelick DA (2012). Pharmacokinetic strategies for treatment of drug overdose and addiction. Future Med Chem 4: 227–243. [DOI] [PMC free article] [PubMed] [Google Scholar]
- Greenwood J (1992). Characterization of a rat retinal endothelial cell culture and the expression of P‐glycoprotein in brain and retinal endothelium in vitro. J Neuroimmunol 39: 123–132. [DOI] [PubMed] [Google Scholar]
- Han YH, Sweet DH, Hu DN, Pritchard JB (2001). Characterization of a novel cationic drug transporter in human retinal pigment epithelial cells. J Pharmacol Exp Ther 296: 450–457. [PubMed] [Google Scholar]
- Henthorn TK, Liu Y, Mahapatro M, Ng KY (1999). Active transport of fentanyl by the blood–brain barrier. J Pharmacol Exp Ther 289: 1084–1089. [PubMed] [Google Scholar]
- Ikoma Y, Takano A, Ito H, Kusuhara H, Sugiyama Y, Arakawa R, et al. (2006). Quantitative analysis of 11C‐verapamil transfer at the human blood–brain barrier for evaluation of P‐glycoprotein function. J Nucl Med 47: 1531–1537. [PubMed] [Google Scholar]
- Jorajuria S, Dereuddre‐Bosquet N, Becher F, Martin S, Porcheray F, Garrigues A, et al. (2004). ATP binding cassette multidrug transporters limit the anti‐HIV activity of zidovudine and indinavir in infected human macrophages. Antivir Ther 9: 519–528. [PubMed] [Google Scholar]
- Kalvass JC, Graff CL, Pollack GM (2004). Use of loperamide as a phenotypic probe of mdr1a status in CF‐1 mice. Pharm Res 21: 1867–1870. [DOI] [PubMed] [Google Scholar]
- Kalvass JC, Pollack GM (2007). Kinetic considerations for the quantitative assessment of efflux activity and inhibition: implications for understanding and predicting the effects of efflux inhibition. Pharm Res 24: 265–276. [DOI] [PubMed] [Google Scholar]
- Kalvass JC, Polli JW, Bourdet DL, Feng B, Huang SM, Liu X, et al. (2013). Why clinical modulation of efflux transport at the human blood–brain barrier is unlikely: the ITC evidence‐based position. Clin Pharmacol Ther 94: 80–94. [DOI] [PubMed] [Google Scholar]
- Kilkenny C, Browne W, Cuthill IC, Emerson M, Altman DG (2010). Animal research: reporting in vivo experiments: the ARRIVE guidelines. Br J Pharmacol 160: 1577–1579. [DOI] [PMC free article] [PubMed] [Google Scholar]
- Kreisl WC, Bhatia R, Morse CL, Woock AE, Zoghbi SS, Shetty HU, et al. (2015). Increased permeability‐glycoprotein inhibition at the human blood–brain barrier can be safely achieved by performing PET during peak plasma concentrations of tariquidar. J Nucl Med 56: 82–87. [DOI] [PMC free article] [PubMed] [Google Scholar]
- Kubo Y, Kusagawa Y, Tachikawa M, Akanuma S, Hosoya K (2013). Involvement of a novel organic cation transporter in verapamil transport across the inner blood–retinal barrier. Pharm Res 30: 847–856. [DOI] [PubMed] [Google Scholar]
- Lin F, Marchetti S, Pluim D, Iusuf D, Mazzanti R, Schellens JH, et al. (2013). Abcc4 together with abcb1 and abcg2 form a robust cooperative drug efflux system that restricts the brain entry of camptothecin analogues. Clin Cancer Res 19: 2084–2095. [DOI] [PubMed] [Google Scholar]
- Litman T, Skovsgaard T, Stein WD (2003). Pumping of drugs by P‐glycoprotein: a two‐step process? J Pharmacol Exp Ther 307: 846–853. [DOI] [PubMed] [Google Scholar]
- McGrath J, Drummond G, McLachlan E, Kilkenny C, Wainwright C (2010). Guidelines for reporting experiments involving animals: the ARRIVE guidelines. Br J Pharmacol 160: 1573–1576. [DOI] [PMC free article] [PubMed] [Google Scholar]
- Mannermaa E, Vellonen KS, Ryhanen T, Kokkonen K, Ranta VP, Kaarniranta K, et al. (2009). Efflux protein expression in human retinal pigment epithelium cell lines. Pharm Res 26: 1785–1791. [DOI] [PubMed] [Google Scholar]
- Minogianis EA, Levesque D, Samaha AN (2013). The speed of cocaine delivery determines the subsequent motivation to self‐administer the drug. Neuropsychopharmacology 38: 2644–2656. [DOI] [PMC free article] [PubMed] [Google Scholar]
- Newman EA (2013). Functional hyperemia and mechanisms of neurovascular coupling in the retinal vasculature. J Cereb Blood Flow Metab 33: 1685–1695. [DOI] [PMC free article] [PubMed] [Google Scholar]
- Okura T, Hattori A, Takano Y, Sato T, Hammarlund‐Udenaes M, Terasaki T, et al. (2008). Involvement of the pyrilamine transporter, a putative organic cation transporter, in blood–brain barrier transport of oxycodone. Drug Metab Dispos 36: 2005–2013. [DOI] [PubMed] [Google Scholar]
- Pawson AJ, Sharman JL, Benson HE, Faccenda E, Alexander SP, Buneman OP, Davenport AP, McGrath JC, Peters JA, Southan C, Spedding M, Yu W, Harmar AJ; NC‐IUPHAR. (2014) The IUPHAR/BPS Guide to PHARMACOLOGY: an expert‐driven knowledgebase of drug targets and their ligands. Nucl. Acids Res. 42 (Database Issue): D1098‐106. [DOI] [PMC free article] [PubMed] [Google Scholar]
- Pike VW (2009). PET radiotracers: crossing the blood–brain barrier and surviving metabolism. Trends Pharmacol Sci 30: 431–440. [DOI] [PMC free article] [PubMed] [Google Scholar]
- Polli JW, Olson KL, Chism JP, John‐Williams LS, Yeager RL, Woodard SM, et al. (2009). An unexpected synergist role of P‐glycoprotein and breast cancer resistance protein on the central nervous system penetration of the tyrosine kinase inhibitor lapatinib (N‐{3‐chloro‐4‐[(3‐fluorobenzyl)oxy]phenyl}‐6‐[5‐({[2‐(methylsulfonyl)ethyl]amino}methyl)‐2‐furyl]‐4‐quinazolinamine; GW572016). Drug Metab Dispos 37: 439–442. [DOI] [PubMed] [Google Scholar]
- Romermann K, Wanek T, Bankstahl M, Bankstahl JP, Fedrowitz M, Muller M, et al. (2013). (R)‐[(11)C]verapamil is selectively transported by murine and human P‐glycoprotein at the blood–brain barrier, and not by MRP1 and BCRP. Nucl Med Biol 40: 873–878. [DOI] [PMC free article] [PubMed] [Google Scholar]
- Ronaldson PT, Davis TP (2013). Targeted drug delivery to treat pain and cerebral hypoxia. Pharmacol Rev 65: 291–314. [DOI] [PMC free article] [PubMed] [Google Scholar]
- Roth M, Obaidat A, Hagenbuch B (2012). OATPs, OATs and OCTs: the organic anion and cation transporters of the SLCO and SLC22A gene superfamilies. Br J Pharmacol 165: 1260–1287. [DOI] [PMC free article] [PubMed] [Google Scholar]
- Shawahna R, Uchida Y, Decleves X, Ohtsuki S, Yousif S, Dauchy S, et al. (2011). Transcriptomic and quantitative proteomic analysis of transporters and drug metabolizing enzymes in freshly isolated human brain microvessels. Mol Pharm 8: 1332–1341. [DOI] [PubMed] [Google Scholar]
- Shen J, Cross ST, Tang‐Liu DD, Welty DF (2003). Evaluation of an immortalized retinal endothelial cell line as an in vitro model for drug transport studies across the blood–retinal barrier. Pharm Res 20: 1357–1363. [DOI] [PubMed] [Google Scholar]
- Stein WD, Cardarelli C, Pastan I, Gottesman MM (1994). Kinetic evidence suggesting that the multidrug transporter differentially handles influx and efflux of its substrates. Mol Pharmacol 45: 763–772. [PubMed] [Google Scholar]
- Steuer H, Jaworski A, Elger B, Kaussmann M, Keldenich J, Schneider H, et al. (2005). Functional characterization and comparison of the outer blood–retina barrier and the blood–brain barrier. Invest Ophthalmol Vis Sci 46: 1047–1053. [DOI] [PubMed] [Google Scholar]
- Syvanen S, Eriksson J (2013). Advances in PET imaging of P‐glycoprotein function at the blood–brain barrier. ACS Chem Neurosci 4: 225–237. [DOI] [PMC free article] [PubMed] [Google Scholar]
- Syvanen S, Xie R, Sahin S, Hammarlund‐Udenaes M (2006). Pharmacokinetic consequences of active drug efflux at the blood–brain barrier. Pharm Res 23: 705–717. [DOI] [PubMed] [Google Scholar]
- Tagami M, Kusuhara S, Honda S, Tsukahara Y, Negi A (2009). Expression of ATP‐binding cassette transporters at the inner blood–retinal barrier in a neonatal mouse model of oxygen‐induced retinopathy. Brain Res 1283: 186–193. [DOI] [PubMed] [Google Scholar]
- Takasato Y, Rapoport SI, Smith QR (1984). An in situ brain perfusion technique to study cerebrovascular transport in the rat. Am J Physiol 247 (3 Pt 2): H484–H493. [DOI] [PubMed] [Google Scholar]
- Tournier N, Decleves X, Saubamea B, Scherrmann JM, Cisternino S (2011a). Opioid transport by ATP‐binding cassette transporters at the blood–brain barrier: implications for neuropsychopharmacology. Curr Pharm Des 17: 2829–2842. [DOI] [PubMed] [Google Scholar]
- Tournier N, Valette H, Peyronneau MA, Saba W, Goutal S, Kuhnast B, et al. (2011b). Transport of selected PET radiotracers by human P‐glycoprotein (ABCB1) and breast cancer resistance protein (ABCG2): an in vitro screening. J Nucl Med 52: 415–423. [DOI] [PubMed] [Google Scholar]
- Uchida Y, Ohtsuki S, Kamiie J, Terasaki T (2011a). Blood–brain barrier (BBB) pharmacoproteomics: reconstruction of in vivo brain distribution of 11 P‐glycoprotein substrates based on the BBB transporter protein concentration, in vitro intrinsic transport activity, and unbound fraction in plasma and brain in mice. J Pharmacol Exp Ther 339: 579–588. [DOI] [PubMed] [Google Scholar]
- Uchida Y, Ohtsuki S, Katsukura Y, Ikeda C, Suzuki T, Kamiie J, et al. (2011b). Quantitative targeted absolute proteomics of human blood–brain barrier transporters and receptors. J Neurochem 117: 333–345. [DOI] [PubMed] [Google Scholar]
- Volkow ND, Wang GJ, Fowler JS, Tomasi D (2012). Addiction circuitry in the human brain. Annu. Rev Pharmacol Toxicol 52: 321–336. [DOI] [PMC free article] [PubMed] [Google Scholar]
- Yabuuchi H, Tamai I, Nezu J, Sakamoto K, Oku A, Shimane M, et al. (1999). Novel membrane transporter OCTN1 mediates multispecific, bidirectional, and pH‐dependent transport of organic cations. J Pharmacol Exp Ther 289: 768–773. [PubMed] [Google Scholar]
- Zamek‐Gliszczynski MJ, Lee CA, Poirier A, Bentz J, Chu X, Ellens H, et al. (2013). ITC recommendations for transporter kinetic parameter estimation and translational modeling of transport‐mediated PK and DDIs in humans. Clin Pharmacol Ther 94: 64–79. [DOI] [PMC free article] [PubMed] [Google Scholar]
- Zhang T, Xiang CD, Gale D, Carreiro S, Wu EY, Zhang EY (2008). Drug transporter and cytochrome P450 mRNA expression in human ocular barriers: implications for ocular drug disposition. Drug Metab Dispos 36: 1300–1307. [DOI] [PubMed] [Google Scholar]
- Zhou G, Williams RW (1999). Eye1 and Eye2: gene loci that modulate eye size, lens weight, and retinal area in the mouse. Invest Ophthalmol Vis Sci 40: 817–825. [PubMed] [Google Scholar]
Associated Data
This section collects any data citations, data availability statements, or supplementary materials included in this article.
Supplementary Materials
Figure S1A P‐gp and BCRP immunostaining in Fvb triple knockout (TKO) [Abcb1a−/−, Abcb1b−/−, Abcg2−/−] mice (n = 3). Retina cryosections were stained for P‐gp/ABCB1a or BCRP/ABCG2 (magenta) along with laminin (yellow) and nuclei DNA (cyan). In all panels laminin staining (yellow) allow to delineate the basal lamina of retinal vessels and the choroidal vessels. (A) Anti‐P‐gp antibody gave a non‐specific intracellular patchy staining in RPE cells/oBRB (arrowheads) and a diffuse background in the sclera (asterisk). However no staining was detected in retinal capillaries. (B) Anti‐BCRP antibody gave only a very faint diffuse staining with no labelling of retinal capillaries. Scale bars: 10 μm.
Figure S1B Non‐specific immunostaining by the secondary antibodies used to detect goat anti‐MRP4 and mouse anti‐MRP1 in Fvb wild‐type (WT) mice (n = 3). Retina cryosections were stained with AF555‐conjugated secondary antibodies (magenta) along with laminin (yellow) and nuclei DNA (cyan). In all panels laminin staining (yellow) allow to delineate the basal lamina of retinal vessels and the choroidal vessels. (A) AF555‐conjugated donkey anti‐goat (DaGAF555) gave virtually no staining in the retina. (B, C) AF555‐conjugated donkey anti‐mouse (DaM‐AF555) gives a background staining in the sclera but no detectable staining in the retina. Scale bars: 10 μm.
Supporting info item