Abstract
HIV-1 infection and the associated disease AIDS are a major cause of human death worldwide with no vaccine or cure available. The trafficking of HIV-1 RNAs from sites of synthesis in the nucleus, through the cytoplasm, to sites of assembly at the plasma membrane are critical steps in HIV-1 viral replication, but are not well characterized. Here we present a broadly accessible microscopy method that captures multiple focal planes simultaneously, which allows us to image the trafficking of HIV-1 genomic RNAs with high precision. This method utilizes a customization of a commercial multichannel emission splitter that enables high-resolution 3D imaging with single-macromolecule sensitivity. We show with high temporal and spatial resolution that HIV-1 genomic RNAs are most mobile in the cytosol, and undergo confined mobility at sites along the nuclear envelope and in the nucleus and nucleolus. These provide important insights regarding the mechanism by which the HIV-1 RNA genome is transported to the sites of assembly of nascent virions.
Keywords: HIV-1, Three-dimensional microscopy, Multiple Imaging, Diffractive optics, Fluorescence microscopy, RNA, Diffusion, Transport, Cytoplasm
Introduction
Fast and accurate methods to study three-dimensional (3D) dynamic movements in live cells remain a major problem in biological microscopy. Most 3D imaging methods, including wide-field microscopy, light-sheet microscopy, spinning disc confocal microscopy and laser-scanning confocal microscopy, rely upon the sequential acquisition of focal planes. Sequential acquisition of focal planes leads to two problems in live cells: 1) When different planes are not acquired simultaneously, it is problematic to attribute loss of molecules in one plane with appearance of molecules in another. Thus, molecules are lost in the tracking process. 2) Deconvolution assumes all sources of fluorescence are fixed in position. In a living system, objects move between the acquisitions of different planes resulting in a deconvolution that may be corrupted.
More recently, other methods, such as multifocus microscopy have been applied to biological systems to yield enhanced temporal and positional accuracy of 3D data acquisition (1). While this method offers a great deal of promise, it is not yet commercially available and it currently requires a custom microscopy set-up including both hardware nanofabrication and technically-advanced alignment of hardware for proper image acquisition.
Here we present a method for simultaneous 3D imaging that utilizes the convenience of a commercial image-splitter that will connect to standard epifluorescence microscopes and cameras. A custom insert which places lenses at positions typically occupied by emission filters, allows for simultaneous acquisition of four focal planes for tracking of single macromolecules, such as an HIV-1 RNA genome, at high temporal and spatial resolution. Thus, our method is relatively inexpensive, broadly accessible, and simple to implement.
Historically, studying the transit of single mRNAs from the nucleus to the cytoplasm has been technically challenging. Several methods have been developed for indirectly tagging mRNA. In one method, chemically labeled RNAs are microinjected into the nucleus. Another method utilizes binding of a fluorescently-tagged protein directly to the RNA sequence of interest (2). Alternatively, RNAs can be visualized by expressing a fluorescently-tagged protein that specifically recognizes short RNA sequences that can be inserted into the RNA of interest (3–5). Each method has strengths and limitations, either due to the binding of large fluorescent proteins to the RNA of interest or by introduction of an RNA that was synthesized externally. For this study, we expressed an RNA that was tagged with stem loops that bind specifically to a fluorescently-labeled MS2 bacteriophage coat protein.
We selected cells that were stably expressing the MS2-mCherry protein containing a nuclear localization signal (NLS) at a low level (6). Using this multifocus imaging method we were able to simultaneously image single RNA molecules in the nucleus, nucleolus, at the nuclear envelope, and in the cytoplasm, but this imaging method could be applied to imaging RNA or proteins labeled with any of these labeling methods.
The transit of HIV-1 genomic RNA from sites of synthesis in the nucleus to sites of assembly at the plasma membrane is essential for HIV-1 replication. Much remains unknown regarding how the RNA is transported out of the nucleus and arrives at sites of viral assembly. Our studies on single HIV-1 genomic RNAs are consistent with a model in which the RNAs: are confined while they are transcribed in the nucleolus; are generally confined throughout the nucleoplasm and at sites along the nuclear envelope, possibly in macromolecular complexes; following transport through nuclear pores, exhibit diffusive movement in the cytoplasm.
Results and Discussion
Simultaneous Acquisition of Focal Stacks with a Customized Insert for a Commercial Beam Splitter
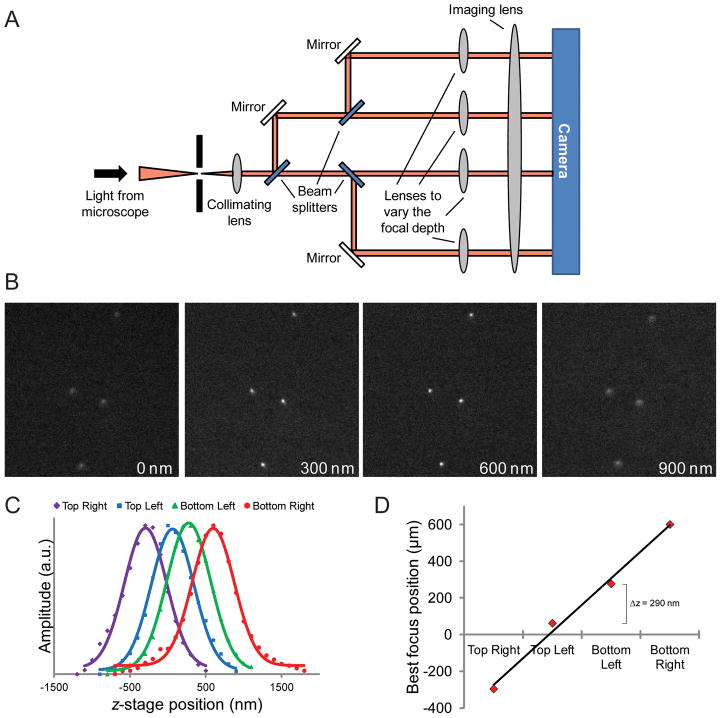
For tracking of individual HIV-1 RNAs, we desired a method to capture different focal planes simultaneously, side-by-side on the same camera chip. Commercial tools which allow simultaneous, side-by-side imaging of different colors are currently available. Our approach was to replace the emission filters (which separate the light based on wavelength) with lenses that focus the light from different focal planes. By using a custom-built insert for a Quad-view image splitter (Photometrics/Optical Insights, Arizona, USA) that utilizes such lenses which differed in their focal distance (the data shown here was done with focal steps of 300 nm, but inserts can be easily exchanged to enable imaging at other focal distances), we can simultaneously image four different planes of focus (Fig. 1). This allows us to track labeled RNAs with more accuracy as it allows determination of the movement of the RNA in three dimensions instead of the more typical methods which can only account for movement in two dimensions.
Fig. 1.
Simultaneous acquisition of multiple focal planes. (A) Schematic depicting how a 3D sample is imaged using a modified commercial Quad-view image splitter to generate a simultaneous 3D focal stack. (B) Example multifocus image of 500 nm fluorescent beads. The images have been aligned and intensity corrected. The relative approximate depth in z is indicated at the bottom of each image. Images are 18.5 μm × 18.5 μm. (C) Gaussian curves fitted to the bead signal of each plane at different z positions of the stage. (D) Plot of the best focus position of each plane.
To establish the accuracy of our imaging system, 500 nm fluorescent beads mounted on a slide (TetraSpeck Fluorescent Microspheres Size Kit, T14792, Invitrogen) were imaged as the objective was moved relative to the sample via the microscope drive motor in 100 nm steps (Fig. 1). Following alignment and adjustment for intensity changes between the focal planes, a focal stack from the simultaneously acquired images can be built for each stage position. Bead positions were identified for each focal plane as the objective was moved by fitting the fluorescence of the bead to a 2D Gaussian function with a custom Labview program. The peaks of the intensity of the beads were then fit to a 1D Gaussian curve as a function of the z-stage position. The best focus position of each focal plane was estimated by the maximum of the fitted curve. A plot of the best focus position of each plane is relatively linear (r2 = 0.99) which verifies that there is a consistent focus step, ≈300 nm, between the planes.
Images of the beads were also used to determine a transformation matrix to enable the focal planes to be superimposed to one another adjusting for rotation, translation, stretching and intensity differences between the subimages. A new transformation matrix was determined from bead images each time when we acquired biological samples.
Imaging of HIV-1 Genomic RNAs
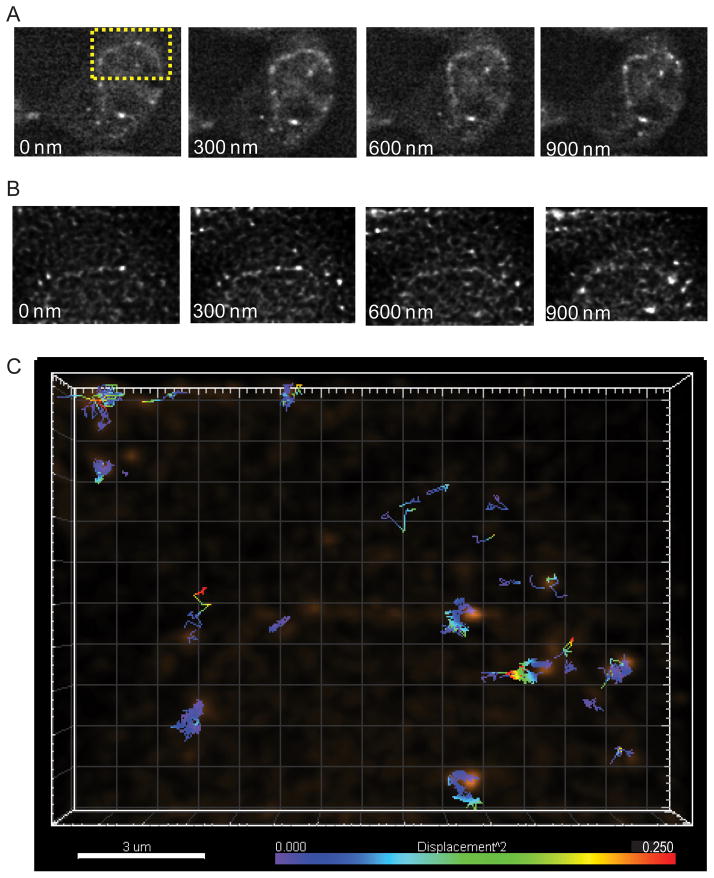
HIV-1 genomic RNAs were visualized using a derivative of the HIV-1 genome, V1B-MS2 (6), that is tagged with stem loops that bind specifically to the coat protein of the bacteriophage MS2 (3–5) and can be imaged in live cells with fluorescence microscopy. To enable imaging of RNAs in the cytosol, we expressed the fluorescently-tagged MS2 in the nucleus (MS2-NLS-mCherry) in clonal cell lines that stably express MS2-NLS-mCherry at levels low enough to visualize discrete labeled RNAs in the nucleus. When V1B-MS2 and Gag are transfected into a similarly generated MS2-NLS-GFP stable HeLa cell line, nascent HIV-1 RNAs bind to the fluorescent MS2 in the nucleus, can be visualized in the cytosol, and remain bound at sites of assembly on the plasma membrane (6). V1B-MS2-tagged RNA genomes are packaged into virions which retain infectivity (6). Following transfection of V1B-MS2 and Gag:Gag-mEGFP (5:1 ratio) into the stable HeLa MS2-NLS-mCherry cell line, individual RNA puncta were visualized as discrete spots in the nucleolus, nucleus, at the nuclear envelope and in the cytoplasm (Fig. 2A, Supplemental Fig. 1). Movies of the dynamic movements of HIV-1 genomic RNAs in four focal planes were acquired simultaneously using the custom Quad-view insert for multifocus imaging and streaming acquisition with camera integration times of 50 ms per image. Focal stacks of HIV-1 genomic RNAs were assembled from the streaming acquisition using the transformation matrix determined by imaging beads.
Fig. 2.
Multifocus imaging of HIV-1 genomic RNAs. (A) Multifocus fluorescence images of HIV-1 genomic RNAs (V1B-MS2) in HeLa MS2-NLS-mCherry cells. Images are 29.2 μm × 24.1 μm. (B) Multifocus images of HIV-1 genomic RNAs after deconvolution and alignment (images are the projection of the sum of intensity over 10 time points). Images are 14.7 μm × 10.4 μm. (C) A 3D multifocus image depicting individual tracks color-coded to represent the single step squared displacement of HIV-1 genomic RNAs.
Deconvolution of Simultaneously Acquired Focal Planes
The stack was subjected to a mathematical postprocessing method that reassigns out-of-focus light (deconvolution). Since all planes in the stack were acquired simultaneously, this reduces the ambiguity in assignment of photons. The deconvolution utilized an experimental PSF determined by imaging beads (Huygens software, Scientific Volume Imaging). The signal was much sharper from single HIV-1 genomic RNA macromolecular complexes after background and out-of-focus fluorescence were reassigned following deconvolution (Fig. 2B).
Tracking of HIV-1 Genomic RNAs in Different Subcellular Compartments
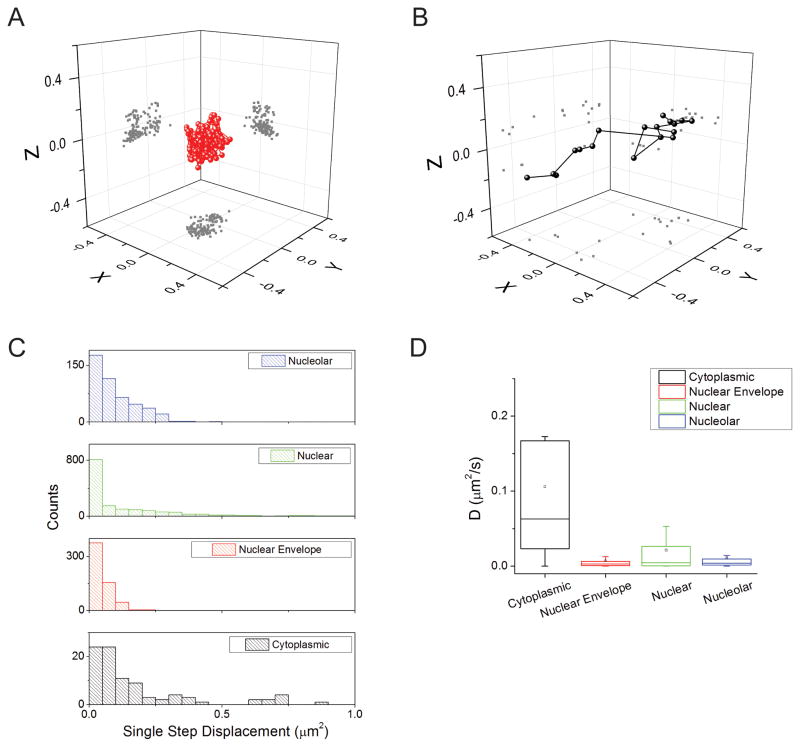
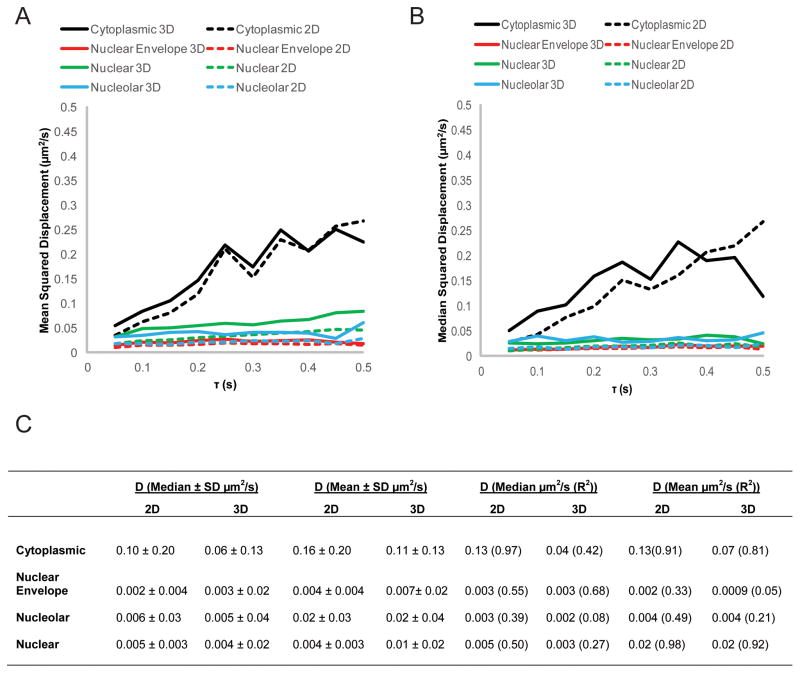
HIV-1 genomic RNAs were tracked by analyzing deconvolved stacks taken over time with particle tracking algorithms in Imaris (Bitplane) software (Fig. 2C). Tracks were classified as either belonging to cytoplasmic, nuclear envelope, nuclear or nucleolar sub-compartments of the cell (Fig. 3A,B, Supplemental Fig. 1). Mean squared displacement (MSD) plots were generated for each individual RNA track. Apparent diffusion coefficients were calculated by taking the slope of the first ten points from the MSD plots (Fig. 3D). The median apparent diffusion coefficient was calculated to describe the average dynamic movement of HIV-1 RNAs in each subcellular compartment. HIV-1 RNAs moved fastest in the cytoplasm and displayed very confined mobility in the nucleolus, nucleus, and at the nuclear envelope (Table 1). We find that mean and median apparent diffusion coefficients using 3D imaging are not statistically different from those determined for individual tracks using the RNA locations in a 2D plane (Fig. 4, Mann-Whitney test at the P<0.05).
Fig. 3.
Single-molecule tracking of HIV-1 genomic RNAs. (A,B) Examples of individual trajectories of HIV-1 genomic RNAs (V1B-MS2) in HeLa MS2-NLS-mCherry cells at the nuclear envelope (A) and in the cytoplasm (B). The projections of the positions in two dimensions are shown as gray dots in the relevant planes. (C) Histograms of the speed (single step squared displacement) for HIV-1 genomic RNAs in the cytoplasm (black), at the nuclear envelope (red), in the nucleus (green), and in the nucleolus (blue). (D) Graph of the calculated diffusion coefficients of HIV-1 genomic RNAs in the cytoplasm (black), at the nuclear envelope (red), in the nucleus (green), and in the nucleolus (blue).
Table 1.
Statistical Values (median ± SD (n)) of HIV-1 RNA Mobility.*
| Squared Displacement (μm2/s) | Displacement Length (μm) | D (μm2/s) | |
|---|---|---|---|
| Cytoplasmic | 0.08 ± 0.24 (92) 2,3,4 | 0.42 ± 0.22 (11) 2,4 | 0.06 ± 0.13 2,3,4 |
| Nuclear Envelope | 0.03 ± 0.04 (581) 1,3,4 | 0.15 ± 0.11 (22) 1 | 0.003 ± 0.02 1 |
| Nucleolar | 0.07 ± 0.08 (466) 1,2,4 | 0.27 ± 0.07 (12) | 0.004 ± 0.02 1 |
| Nuclear | 0.04 ± 0.16 (1464) 1,2,3 | 0.20 ± 0.23 (44) 1 | 0.005 ± 0.04 1 |
Denotes statistically significant difference at P<0.05 between the indicated measurement and the
cytoplasmic,
nuclear envelope,
nucleolar, or
nuclear measurement (Mann-Whitney Test).
Fig. 4.
Apparent diffusion coefficients of HIV-1 genomic RNAs. (A,B) Cumulative mean (A) or median (B) squared displacement plots of HIV-1 genomic RNAs (V1B-MS2) in HeLa MS2-NLS-mCherry cells calculated based on either 2D or 3D trajectories. (C) Table of the values for the apparent diffusion coefficient (D) of HIV-1 genomic RNAs either calculated by taking the median or mean value when D is calculated for each trace, or by calculating D from the cumulative mean or median squared displacement plots.
The diffusion of HIV-1 RNAs in the cytoplasm was consistent with a recent report analyzing mobility from one focal plane (7). Similarly, we determined the jump distance traveled by RNAs between each ≈50 ms image acquisition of a time lapse movie by measuring the single step squared displacement between successive time points in each of the RNA traces. Within individual RNA traces, we found a range of both ‘slow’ (a jump distance ≈0.07 μm2) and ‘fast’ speeds (a jump distance ≈0.50 μm2) (Fig. 3C).
The mobility of HIV-1 RNAs, as measured by the MSD analysis, is fastest in the cytoplasm. We find that the maximum speed determined for single RNA tracks at the nuclear envelope is significantly lower than in other cellular compartments measured and that these tracks also have a significantly lower standard deviation (Table 2). We also find that RNAs in the cytoplasm have a significantly higher mean and minimum track speed, and that the tracks are significantly straighter than those in other cellular compartments (Table 2, Mann-Whitney test at P<0.05).
Table 2.
Statistical Values of HIV-1 RNA Track Speed (μm2/s) and Straightness.*
| Track Speed Max (μm2/s) | Track Speed Mean (μm2/s) | Track Speed Min (μm2/s) | Track Speed StdDev (μm2/s) | Track Speed Variation (μm2/s) | Track Straightness | |
|---|---|---|---|---|---|---|
| Cytoplasmic | 0.29 ± 0.15 (11)2 | 0.20 ± 0.04 (11) 2,3,4 | 0.04 ± 0.02 (11) 2,3,4 | 0.08 ± 0.06 (11) 2 | 0.57 ± 0.19 (11) | 0.24 ± 0.18 (11) 2,3,4 |
| Nuclear Envelope | 0.14 ± 0.05 (22)1,3,4 | 0.09 ± 0.03 (22) 1,3 | 0.01 ± 0.02 (22) 1 | 0.03 ± 0.02 (22) 1,3,4 | 0.60 ± 0.18 (22) | 0.08 ± 0.15 (22) 1 |
| Nucleolar | 0.23 ± 0.07 (12)2 | 0.12 ± 0.03 (12) 1,2 | 0.01 ± 0.02 (12) 1 | 0.06 ± 0.02 (12) 2 | 0.70 ± 0.18 (12) | 0.10 ± 0.14 (12) 1 |
| Nuclear | 0.22 ± 0.14 (44)2 | 0.11 ± 0.05 (44) 1 | 0.01 ± 0.02 (44) 1 | 0.05 ± 0.04 (44) 2 | 0.62 ± 0.27 (44) | 0.14 ± 0.16 (44) 1 |
Denotes statistically significant difference at P<0.05 between the indicated measurement and the
cytoplasmic,
nuclear envelope,
nucleolar, or
nuclear measurement (Mann-Whitney Test).
HIV-1 RNA mobility is highly confined in the nucleus, nucleolus and at the nuclear envelope. This data is consistent with a model that HIV-1 RNAs in the nucleus and nucleolus may be involved in very large complexes, possibly those involved in RNA processing (8). It should be noted that the apparent diffusion coefficient we find for HIV-1 RNA in the nucleus is slower than what would be expected for the diffusion of a naked RNA and is more consistent with a model in which the RNAs are attached to macromolecular complexes (8,9).
We present a convenient, broadly accessible and simple to apply method of acquiring four focal planes simultaneously during imaging experiments. We applied this method to image HIV-1 genomic RNAs, and find that the mobility differs between the nucleoplasm, nucleolus, at the nuclear envelope and in the cytoplasm.
Materials and Methods
Cells, Plasmids, and Transfection
A HeLa cell line stably expressing MS2-NLS-mCherry was generated as previously described (6). Plasmids for the expression of HIV-1 Gag, Gag-mEGFP, and the HIV-1 genome (SynGag, SynGag-mEGFP and V1B-MS2) were described previously (6, 10). HeLa cells were transfected using Lipofectamine 2000 (Invitrogen) according to manufacturer’s recommendations.
Sample Preparation and Image Acquisition
One day prior to imaging, cells were plated on glass-bottom MatTek dishes. Cells were transfected with plasmids (V1B-MS2 and SynGag) and imaged between 6 and 30 hours post transfection. Nucleoli were fluorescently stained using Nucleolar-ID Green detection kit for microscopy (Enzo, ENZ-51009-500) according to manufacturer’s instructions. Immediately prior to imaging, the media on the cells was changed to Cell Imaging Media (HBSS + 10 mM sodium HEPES buffered at pH 7.4 + 1% FBS).
For imaging HIV-1 RNA the ‘stream’ mode of acquisition was used with images acquired with 50 ms integration times controlled by Olympus’ cellSens software.
Microscope Setup
All experiments were performed using an Olympus IX83 microscope, a UPLSAPO 60× 1.3 NA silicone oil objective, Olympus Silicone Immersion Oil with refractive index of 1.406 (SIL300CS-30CC), a Hamamatsu Orca-ER CCD digital camera, and an Optical Insights (Tuscon, AZ) Quad-view apparatus with a custom modified cassette. The final effective pixel size of the camera was ≈110.7 nm (between 108 – 112 nm depending on total magnifications). The modified cassette combines all the necessary optics into a single modular piece. The microscope was pre-warmed to 37°C prior to imaging and temperature was maintained during imaging.
Image Reconstruction
3D reconstruction and 4D particle tracking was performed with Imaris software (Bitplane, Imaris 8.0.2). To reconstruct the 3D imaging volume from the multifocus image, the four focal planes were aligned on top of one another using calibration data obtained with 500 nm fluorescent beads (TetraSpeck Fluorescent Microspheres Size Kit, T14792, Invitrogen) mounted on a slide (1). We recorded a focal series by scanning the bead sample along the z axis using the microscope objective lens drive motor (Fig. 1). During this process, the beads were successively focused in each of the four subimages. We then performed a 2D Gaussian fit on the z projection of each focal plane to locate the beads in the different subimages with a custom Labview (National Instruments) protocol. Using cropped images to reduce rotation, translation and stretching differences between the subimages, we determined a transformation matrix enabling the focal planes to be superimposed with the accuracy of one pixel. The transformation matrix was subsequently used on the biological data to reconstruct the 3D volume for each time frame using Fiji (http://fiji.sc/Fiji). The calibration data were also used to estimate and correct the small differences in transmitted intensities between images. Deconvolution of the 4D stacks was performed with an experimental PSF determined by imaging the TetraSpeck Microspheres with Huygens software.
Particle Tracking
To generate traces the following parameters were used: estimated xy diameter = 0.500 μm, z diameter = 0.800 μm, background subtraction = on, tracking algorithm = autoregressive motion, max distance = 0.700 μm, max gap size = 2, no filling gaps, and track duration >0.7 s. Tracks were classified by hand into groups pertaining to cytoplasmic, nuclear envelope, nuclear and nucleolar subcellular compartments by comparison to a phase image or Nucleolar-ID signal. Imaris generated values for the squared displacement per step, overall displacement length, the average, mean, minimum, maximum, and standard deviation of track speeds, track speed variation and track straightness. Traces were analyzed using Kehl, a fast (no loop) Matlab (Maxime Deforet, MathWorks) method to calculate mean squared displacements (MSDs) as a function of time, τ. The slopes of the first ten points of these plots were used to calculate apparent diffusion coefficients according to MSD = 6Dτ in Microsoft Excel for 3D diffusion. The x- and y-coordinates were then used to determine the apparent diffusion of the same particles in 2D. For 2D analysis, the slopes of the MSD curves were used to calculate apparent diffusion coefficients according to MSD = 4Dτ. For both MSD curves, the intercepts are non-zero as previously described (11).
Supplementary Material
Assignment of HIV-1 RNAs to subcellular compartments. (A) Nucleolar-ID green detection reagent signal and (B) HIV-1 genomic RNAs (V1B-MS2) in a HeLa MS2-NLS-mCherry cell. (C) Overlay of (A) and (B). The blue, green and red arrows indicate RNAs that are associated with the nucleolus, nucleus, and nuclear envelope, respectively. The scale bar represents 5 μm.
Acknowledgments
Image analysis using Huygens deconvolution and the Imaris 8 Software was performed at the Bio-Imaging Resource Center at The Rockefeller University. We would like to thank Nolwenn Jouvenet (Pasteur Institute) and Paul Bieniasz (The Rockefeller University and Howard Hughes Medical Institute) for generating the HeLa MS2-NLS-mCherry cell line. We would also like to thank Rachel Belote (The Rockefeller University) for help with the deconvolution analysis. This work was supported by NIH P50GM103297 (M.B., D.S.J. and S.M.S.).
Footnotes
The authors declare no conflict of interest.
References
- 1.Abrahamsson S, Chen J, Hajj B, Stallinga S, Katsov AY, Wisniewski J, Mizuguchi G, Soule P, Mueller F, Dugast Darzacq C, Darzacq X, Wu C, Bargmann CI, Agard DA, Dahan M, et al. Fast multicolor 3D imaging using aberration-corrected multifocus microscopy. Nat Methods. 2013;10(1):60–63. doi: 10.1038/nmeth.2277. [DOI] [PMC free article] [PubMed] [Google Scholar]
- 2.Paige JS, Wu KY, Jaffrey SR. RNA mimics of green fluorescent protein. Science. 2011;333(6042):642–646. doi: 10.1126/science.1207339. [DOI] [PMC free article] [PubMed] [Google Scholar]
- 3.Fusco D, Accornero N, Lavoie B, Shenoy SM, Blanchard JM, Singer RH, Bertrand E. Single mRNA molecules demonstrate probabilistic movement in living mammalian cells. Curr Biol. 2003;13(2):161–167. doi: 10.1016/s0960-9822(02)01436-7. [DOI] [PMC free article] [PubMed] [Google Scholar]
- 4.Bertrand E, Chartrand P, Schaefer M, Shenoy SM, Singer RH, Long RM. Localization of ASH1 mRNA particles in living yeast. Mol Cell. 1998;2(4):437–445. doi: 10.1016/s1097-2765(00)80143-4. [DOI] [PubMed] [Google Scholar]
- 5.Shav-Tal Y, Darzacq X, Shenoy SM, Fusco D, Janicki SM, Spector DL, Singer RH. Dynamics of single mRNPs in nuclei of living cells. Science. 2004;304(5678):1797–1800. doi: 10.1126/science.1099754. [DOI] [PMC free article] [PubMed] [Google Scholar]
- 6.Jouvenet N, Simon SM, Bieniasz PD. Imaging the interaction of HIV-1 genomes and Gag during assembly of individual viral particles. Proc Natl Acad Sci U S A. 2009;106(45):19114–19119. doi: 10.1073/pnas.0907364106. [DOI] [PMC free article] [PubMed] [Google Scholar]
- 7.Chen J, Grunwald D, Sardo L, Galli A, Plisov S, Nikolaitchik OA, Chen D, Lockett S, Larson DR, Pathak VK, Hu WS. Cytoplasmic HIV-1 RNA is mainly transported by diffusion in the presence or absence of Gag protein. Proc Natl Acad Sci U S A. 2014;111(48):E5205–5213. doi: 10.1073/pnas.1413169111. [DOI] [PMC free article] [PubMed] [Google Scholar]
- 8.Politz JC, Tuft RA, Pederson T, Singer RH. Movement of nuclear poly(A) RNA throughout the interchromatin space in living cells. Curr Biol. 1999;9(6):285–291. doi: 10.1016/s0960-9822(99)80136-5. [DOI] [PubMed] [Google Scholar]
- 9.Boulon S, Basyuk E, Blanchard JM, Bertrand E, Verheggen C. Intra-nuclear RNA trafficking: insights from live cell imaging. Biochimie. 2002;84(8):805–813. doi: 10.1016/s0300-9084(02)01438-4. [DOI] [PubMed] [Google Scholar]
- 10.Bleck M, Itano MS, Johnson DS, Thomas VK, North AJ, Bieniasz PD, Simon SM. Temporal and spatial organization of ESCRT protein recruitment during HIV-1 budding. Proc Natl Acad Sci U S A. 2014;111(33):12211–12216. doi: 10.1073/pnas.1321655111. [DOI] [PMC free article] [PubMed] [Google Scholar]
- 11.Dietrich C, Yang B, Fujiwara T, Kusumi A, Jacobson K. Relationship of lipid rafts to transient confinement zones detected by single particle tracking. Biophys J. 2002;82(1 Pt 1):274–284. doi: 10.1016/S0006-3495(02)75393-9. [DOI] [PMC free article] [PubMed] [Google Scholar]
Associated Data
This section collects any data citations, data availability statements, or supplementary materials included in this article.
Supplementary Materials
Assignment of HIV-1 RNAs to subcellular compartments. (A) Nucleolar-ID green detection reagent signal and (B) HIV-1 genomic RNAs (V1B-MS2) in a HeLa MS2-NLS-mCherry cell. (C) Overlay of (A) and (B). The blue, green and red arrows indicate RNAs that are associated with the nucleolus, nucleus, and nuclear envelope, respectively. The scale bar represents 5 μm.


