Abstract
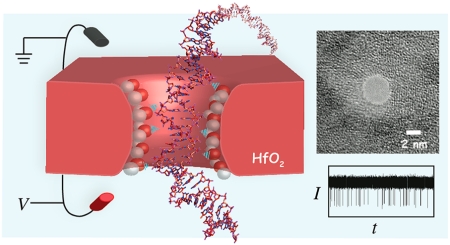
We present a study of double- and single-stranded DNA transport through nanopores fabricated in ultrathin (2–7 nm thick) free-standing hafnium oxide (HfO2) membranes. The high chemical stability of ultrathin HfO2 enables long-lived experiments with <2 nm diameter pores that last several hours, in which we observe >50 000 DNA translocations with no detectable pore expansion. Mean DNA velocities are slower than velocities through comparable silicon nitride pores, providing evidence that HfO2 nanopores have favorable physicochemical interactions with nucleic acids that can be leveraged to slow down DNA in a nanopore.
Keywords: single-molecule, translocations, DNA sequencing, atomic layer deposition
Natural and synthetic nanopores are increasingly popular tools for characterizing various biomolecules and their complexes at the single-molecule level.1–3 Pioneered by the demonstration of voltage-driven, single-file transport of DNA molecules through a lipid-embedded α-hemolysin protein channel,4 nanopore research has been fueled by new potential applications for genomic analysis and DNA sequencing.5–7 In this method, electrochemical bias applied across a nanopore in aqueous electrolyte medium generates highly localized electrophoretic forces that are used to drive biopolymers through the nanopore. Discrete fluctuations in the ion current as a function of time yield information about biopolymer size, sequence, and concentration. Nanopores are attractive apparatuses for mapping8,9 and quantifying10–14 interactions within biomolecular complexes. Fabrication of synthetic nanopores by irradiation using electron beams,15 ion beams,16 and He beams17 has gained popularity due to a more flexible pore geometry that accommodates various-sized biopolymers, as well as the intriguing potential to explore various biopolymer/materials interfaces.
A significant hurdle for nanopore-based analysis of DNA, RNA, and protein molecules has been that the reported translocation speeds are too fast relative to the speed at which current is detected using conventional patch-clamp amplifiers.2 Various systematic explorations of biomolecular transport through synthetic nanopores suggest that biopolymer detection requires a combination of nanopores with optimal geometry (diameter and thickness),18–23 surface properties,24–26 and improved temporal resolutions.23,27 While nanopores in silicon oxide28 and silicon nitride (SiNx) membranes with various geometries have been thoroughly studied, their physical stability is compromised by unavoidable chemical damage during29,30 and after31 pore fabrication. This material instability has set a practical limit on membrane thicknesses that can be used for SiNx membranes (~5–10 nm).20,23,32,33 This limitation compromises the durability and performance of ultrathin and ultrasmall solid-state nanopores, which invites the exploration of biomolecular transport through other membrane materials, for example, aluminum oxide,34 graphene,35–37 boron nitride,38 and, lately, DNA origami.39–41 However, while each of these alternative materials presents unique advantages, none have the combined benefits of hydrophilicity, low-leakage, chemical resistance to strong cleaning acids, robust mechanical stability, and a simple means of fabrication.
Hafnium oxide (HfO2) is a wide band gap high-dielectric insulator with excellent chemical resistance42 and comparable strength to SiNx.42–44 While SiNx is as strong, it is plagued by a problem of stability at the nanoscale: the oxide of silicon is chemically favored over its nitride. This tendency of nitrides to oxidize is exemplified by the standard enthalpy of formations of Si3N4 (−198 kcal/mol),45 SiO2 (−217 kcal/mol),46 HfN (88.2 kcal/mol),47 and HfO2 (−266 kcal/mol).47 Therefore, while SiNx is normally a robust material, in an oxygen-rich environment the nitride surface is an evolving mixture of nitrogen and oxygen, the proportion of which can vary during nanopore fabrication29 and following cleaning using oxygen-rich agents (e.g., O2 plasma and hot piranha solution). In contrast, the chemical form of HfO2 is stable, which can improve reliability and reproducibility during nanopore experiments and, in principle, offer a well-regulated interaction of the pore walls with biomolecules. Finally, the isoelectric point of ~7 for HfO248 renders its surface near-neutral under physiological pH, which suggests compatibility of solid-state nanopores with studying transport of negatively charged biomolecules such as nucleic acids. Recently, Shim et al. demonstrated DNA translocations through a graphene/HfO2 pore, demonstrating the viability of this material for nanopore devices.49
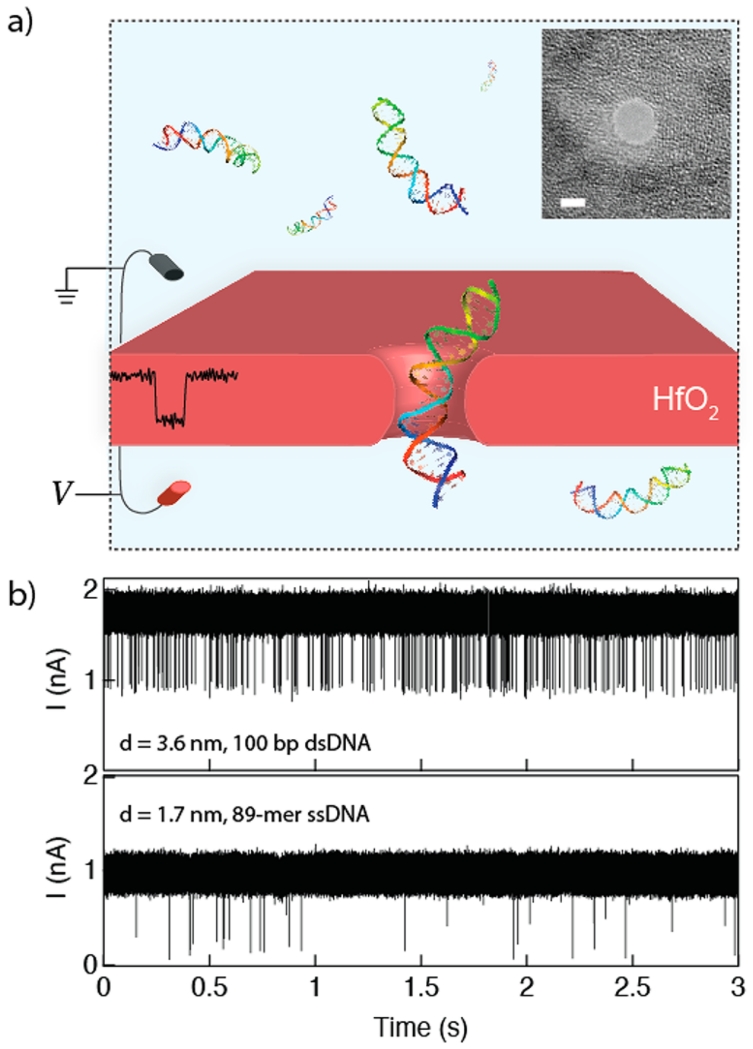
In this article we investigate single-stranded and double-stranded DNA transport through nanopores in ultrathin HfO2 membranes at high temporal resolution. Figure 1a shows the scheme of our nanopore setup, as well as typical traces during experiments with (b) double-stranded and (c) single-stranded DNA. First, we present the fabrication details of ultrathin HfO2 membranes and nanopores in such membranes. Next, we show that transport speeds of single-stranded and double-stranded DNA are slower than for SiNx pores of equivalent geometries, and we argue that this slowing down is due to coordinative interaction of the DNA backbone phosphates with the HfO2 surface. Finally, we show for the first time that HfO2 pores with diameters as small as 1.4 nm are stable in size for several hours of continuous DNA translocation experiments, during which an estimated 50 000 DNA molecules are “flossed” through the pore without any detectable erosion of the pore walls. These results suggest that HfO2 is a superior material to SiNx for nanopore biosensors.
Figure 1.
Hafnium oxide nanopores. (a) Cartoon schematic of the experiment. A sample of DNA is placed on the negatively charged electrode side, and ion current through the pore is monitored. Electrophoretic transport of a DNA molecule produces a single spike. Inset shows a transmission electron microscope (TEM) image of a 3.6 nm diameter HfO2 nanopore (scale bar = 2 nm). (b) Continuous 3 s current traces of 100 bp dsDNA (top) and 89-mer ssDNA (bottom) translocating through HfO2 pores at respective biases of V = +175 mV and +150 mV (pore diameters d indicated in the figure).
RESULTS AND DISCUSSION
HfO2 Nanopore Fabrication
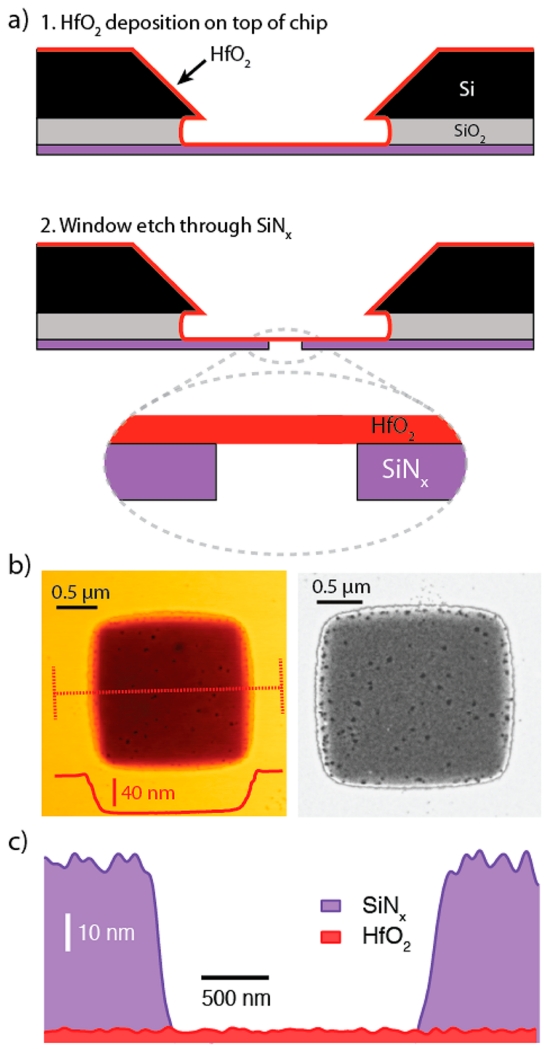
We present a three-step fabrication process for HfO2 pores in Figure 2a. First, atomic-layer deposition (ALD) was used to deposit a 4.5 nm thickness of HfO2 film onto a free-standing low-stress SiNx window (see Supporting Information).50 Next, electron-beam resist was spun on the membrane, and a <2 μm square portion of the SiNx window was irradiated using e-beam lithography and subsequently developed, after which the entire thickness of the exposed SiNx was etched using an SF6 reactive ion etch (RIE) plasma. We have found that RIE overetching of the SiNx layer did not remove the HfO2 film. The membrane’s elemental composition was investigated using energy dispersive X-ray spectroscopy (EDS) with a transmission electron microscope. Figure 2b shows a dark-field scanning TEM (STEM) image in which stark contrast between the thick SiNx support and the free-standing HfO2 membrane is visible. In addition, an atomic force microscope (AFM) scan of the same area is shown, in which the removed thickness of the SiNx layer is confirmed. Hafnium and oxygen were present throughout the image in similar amounts, while the signals for silicon and nitrogen were virtually absent in the etched area. By combining a map of the integrated EDS spectra (see Supporting Information) with AFM topography data, a reconstructed thickness map of the membrane layers is presented in Figure 2c. We note that noise of the signal in the height map arises from instrumental noise and actual roughness of the deposited SiNx and HfO2 films. Finally, since both the ALD and lithography steps are scalable to a whole wafer, these steps were carried out in parallel to produce a large number of HfO2 membranes for experiments.
Figure 2.
Freestanding HfO2 membrane fabrication. (a) 1. Atomic layer deposition is used to deposit a 3–8 nm thick HfO2 layer onto the trench side of a freestanding silicon nitride (SiNx) window. 2. Reactive ion etching of a predefined window to expose the freestanding HfO2. (b) Atomic force microscopy (AFM) topograph (left) and dark-field scanning transmission electron micrograph (right) of a freestanding HfO2 region. Dashed red line represents line scan that confirms the 50 nm etch step height. (c) Energy dispersive spectroscopy (EDS)-based thickness map of SiNx and HfO2 (thickness estimated from AFM).
The third and final fabrication step was nanopore drilling using a transmission electron microscope. Hard irradiation (2.5 × 10⁸ e/nm2) of a ~2 × 2 nm2 region of the membrane resulted in slow formation of a nanopore, the kinetics of which are ~10 times slower than for similar thickness silicon nitride membranes.51 In contrast to SiNx, soft electron-beam irradiation of free-standing HfO2 using 200 kV electrons (106 e/nm2) for 40–60 s leads to a phase transition from an amorphous to a polycrystalline state (see Supporting Information), as previously observed for Al2O334 and HfO2/graphene nanopores.49 While we were able to produce pores in these crystallized HfO2 nanodomains, their ionic conductance was always larger than anticipated. We hypothesize that these pores are unstable as a result of mechanical failure of the crystalline domain due to strain mismatch with the amorphous membrane.
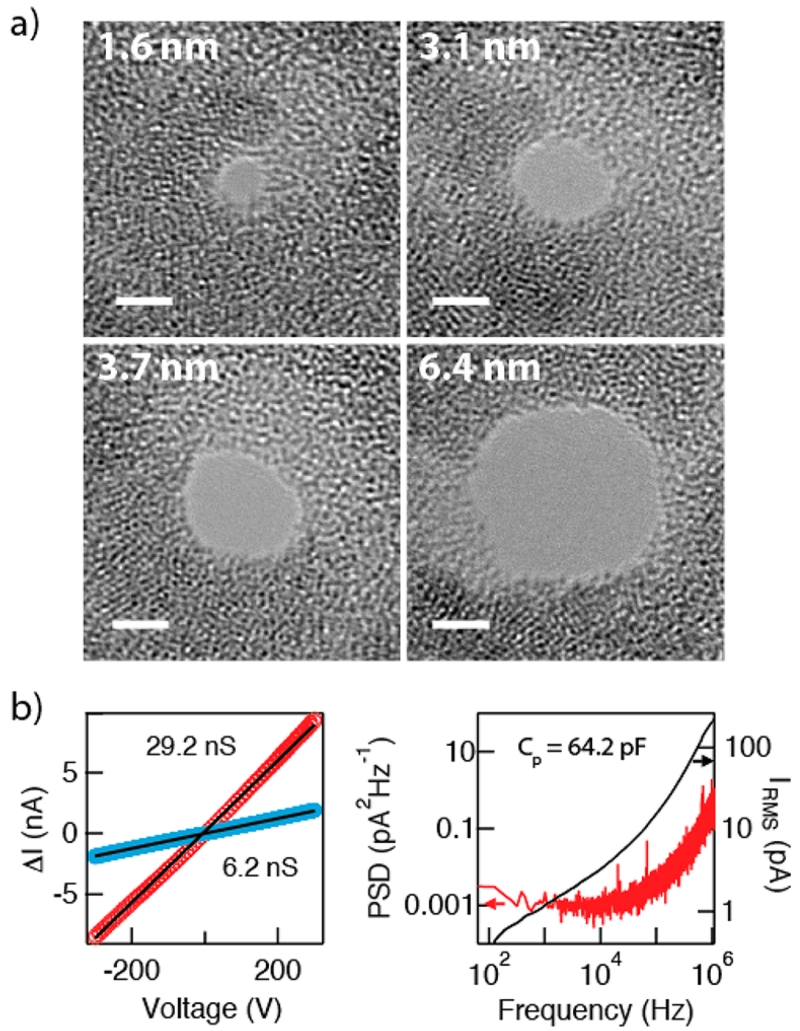
Example bright-field TEM images of nanopores in the diameter range of 1.4–6.5 nm are shown in Figure 3a. Contrasting patches in the image correspond to thickness variations in the semicrystallized HfO2 film, which are clearly induced by extended e-beam irradiation. Following nanopore fabrication, the devices were cleaned in hot piranha and then rinsed copiously in hot deionized water, and after vacuum drying they were immediately assembled in a custom PTFE cell. Current–voltage curves were used to measure the pore conductance, as shown in Figure 3b for a 5.9 nm and a 2.0 nm pore fabricated in 4.5 nm thick HfO2 membranes. Linearity of the current–voltage curves was consistent with a symmetric and/or weakly charged pore surface. For a given batch of HfO2 membranes we found a good agreement between pore conductance and diameter, although the pore thickness varied by as much as 50%, as determined by sizing from DNA translocation experiments (see Supporting Information). The pores exhibited low noise, as shown in Figure 3c by the power spectral density (PSD) and integrated current noise for a 4.0 nm diameter pore at an applied voltage of 250 mV. By painting most of the chip surface with an elastomer gasket52 we were able to reduce the capacitance of our chips to the range 60–150 pF, which is sufficient to enable measurements at wide signal bandwidths (≥200 kHz).
Figure 3.
Pore characterization. (a) Bright-field TEM images of nanopores of diameters 1.6–6.4 nm, drilled in a HfO2 membrane. Contrast in the membrane portion of the image is due to thickness variations, a result of e-beam-induced crystallization of the HfO2 film. (b) Current–voltage curves of two HfO2 pores in 1 M KCl buffer, pH 8.0 (d = 5.9 nm, d = 2.0 nm), showing linear conductance. (c) Noise power spectral density (PSD, left axis) and integrated noise (right axis) of a d = 4.0 nm pore at an applied bias of V = 250 mV (range 60–106 Hz). On the basis of the noise spectrum of this pore, we estimate a membrane capacitance of Cp = 64.2 pF.
Double-Stranded DNA Transport
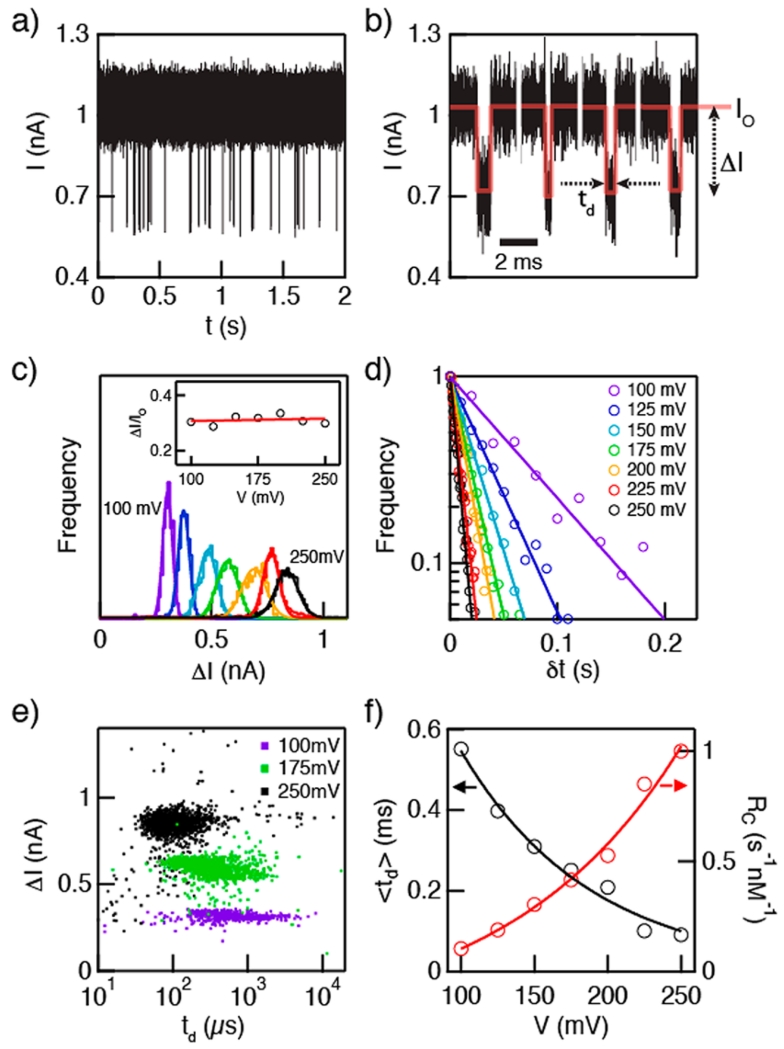
We first characterize the voltage-driven transport of double-stranded DNA (dsDNA) through our HfO2 pores. While a good correspondence is found between the TEM-measured pore size and the observed conductance, quoted pore sizes throughout the paper were independently assessed from the blocked current level during DNA translocation experiments.20 In Figure 4a, a representative two-second current trace is shown of a 3.6 nm diameter pore at V = 100 mV following the addition of 150 nM of 100 bp dsDNA to the negatively biased cis chamber. For each experiment, >60 s of data similar to what is shown in Figure 4a was analyzed offline using Open-Nanopore, an open source translocation data analysis package from the Radenovic Lab at EPFL.53 Open-Nanopore fits all detected single-level spikes from the trace with rectangular pulses, as illustrated in Figure 4b (multilevel events were rare and as such they were ignored). The duration of the pulse corresponds to the dwell time (td), while the amount of reduction in the baseline current from the open-pore level (Io) is referred to as ΔI. The molecule’s arrival time, δt, is the wait time between consecutive event beginnings.
Figure 4.
Transport of 150 nM 100 bp double-stranded DNA (dsDNA) through a d = 3.6 nm HfO2 nanopore. (a) Continuous two-second current trace at V = 100 mV. (b) Representative concatenated events following analysis using OpenNanopore53 software. Each event is defined by its mean current amplitude (ΔI) and dwell time (td). Red line represents square wave fit to each event. (c) Histograms of ΔI at different voltages in the range V = 100–250 mV, showing a regular increase in ΔI with increasing voltage. Inset shows the fractional blockage, ΔI/Io, which is found to be independent of voltage. (d) Distributions of event interarrival times at different voltages (δt). Lines are fits to the distributions, from which the capture rates Rc are extracted. (e) Scatter plots of ΔI vs td for selected voltages. The decrease in spread of td values with increasing voltages exemplifies the transition from diffusion-dominated to drift-dominated transport. (f) Peak td (left axis) and Rc (right axis) values as a function of voltage (see Supporting Information), showing exponential dependence for both parameters (see text).
Figure 4c plots histograms of ΔI for each experimental voltage. We see that ΔI increases linearly with voltage (as does Io, not shown). However, as shown in the inset to the figure, the fractional blockade (〈ΔI〉/Io) is independent of voltage in the range 100–250 mV. As mentioned above, the pore diameter can be characterized based on the fractional blockade value, assuming a dsDNA cross-sectional diameter of 2.2 nm.20 Assuming that the current blocked is entirely due to a fractional excluded volume of DNA from the pore, we use measured Io and ΔI values to determine the pore diameter d and its effective height heff:20,21
where V is the applied voltage and σ = 0.096 S/cm is the measured specific conductance of the buffer at 25 °C. For the pore in the experiment shown in Figure 4, we find heff = 7 nm (the highest pore thickness we observed) and d = 3.6 nm. Further, we determine the capture rate Rc from each experiment by fitting the arrival time distributions to a first arrival time process P(t) = A exp(−Rct), as seen in Figure 4d.54 The inverse time constant of each fit corresponds to the event rate. In small pores, DNA capture rates are limited by an energetic penalty of DNA confinement within the pore, and the event rate is expected to depend exponentially on voltage,54 whereas in large pores capture is limited by arrival time to the pore mouth (Smoluchowski limit), in which case capture rate is linearly dependent on voltage.55 We indeed observe exponential capture rate dependence with voltage (plotted on the left axis of Figure 4f), as previously observed for similar-diameter pores.19 While a quantitative comparison was not pursued here, we find that the capture rates in our HfO2 pores are higher than or similar to those in prior studies.19,56
Scatter plots of ΔI vs td for selected voltages in the range 100–250 mV are displayed in Figure 4e. Upon increasing the applied voltage, a noticeable decrease of the spread in td distributions is observed, coupled to an increase in ΔI spread. We attribute this reduction in the spread of td to a transition from diffusion-dominated transport to drift-dominated transport: at low bias values (100–150 mV), DNA transport is hindered by interactions with the pore walls and hydrodynamic interactions that present a barrier for transport, whereas at high bias values (200–250 mV) electrophoretic forces dominate DNA transport.57 In order to obtain the most likely dwell times, we have plotted log-normal distributions (see Supporting Information) and extracted the peak positions, which are plotted in Figure 4f (left y-axis). As seen in the plot, the characteristic dwell times in the voltage range 100–250 mV correspond to average DNA velocities of 5.5–1 μs/bp, respectively. The minimum characteristic velocity we obtained (V = 100 mV, 181 bp/ms) compares favorably with other works, as seen in a recent compilation by Venkatesan et al.2 Comparison of our measured DNA average velocity with a similar-diameter SiNx pore shows a steeper dependence on voltage for HfO2, which may be due to the stronger interactions of DNA with the HfO2 pore walls (see Supporting Information). Although the exact mechanism of this interaction is not clear, prior studies of a series of M(IV) oxides such as ZrO2, TiO2, and HfO2 indicate a reasonable affinity toward phosphate groups,58–61 which may mediate DNA slowing by increasing frictional forces with the pore walls during the translocation process.
Single-Stranded DNA Transport
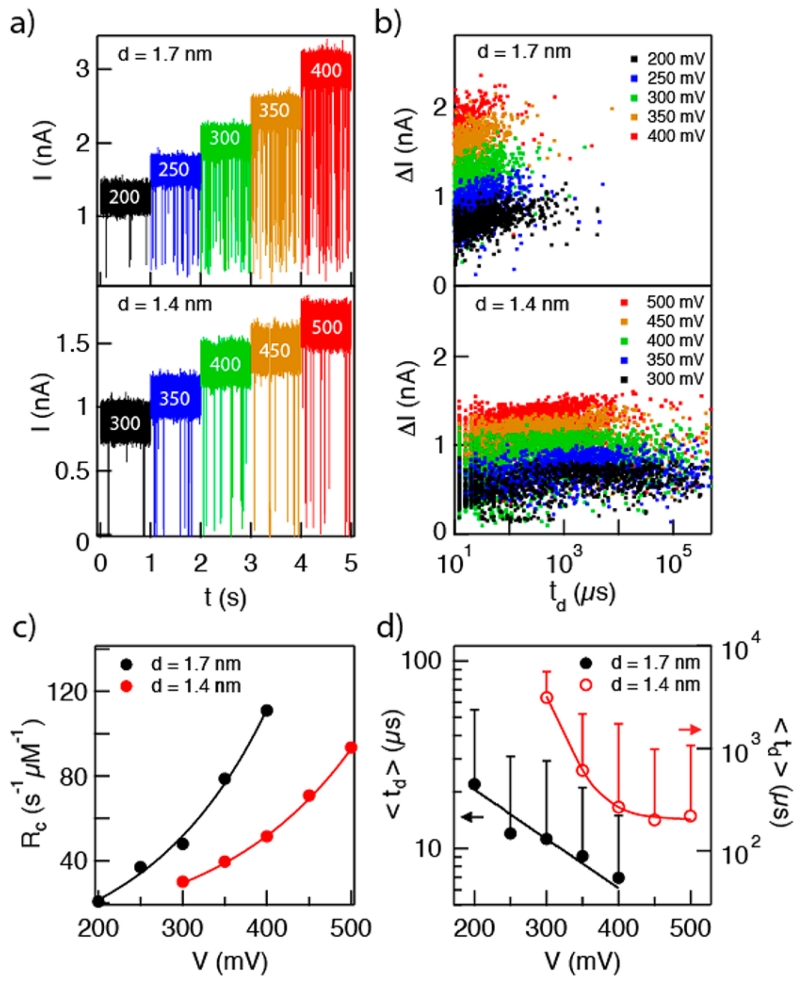
Nanopore detection of single-stranded DNA (ssDNA) has been studied extensively as a potential technology for DNA sequencing.4,5,62 To show that HfO2 nanopores are compatible with single-stranded DNA experiments, we evaluated the transport kinetics of an 89-mer single-stranded DNA molecule through two different HfO2 pores with diameters of 1.4 and 1.7 nm. Representative one-second snapshots of the traces collected for both pores at different voltages are shown in Figure 5a. The traces show events with very deep blockages for both pores. Specifically, for the 1.4 nm pore the mean fractional blockade is 83%, while for the 1.7 nm pore the mean fractional blockade is 70%. These fractional blockades are close in magnitude to α-hemolysin (αHL), for which we have independently measured a 〈ΔI〉/Io value of 80% (see Supporting Information). It is noteworthy to remark that while αHL nanopores do not exhibit efficient capture from the β-barrel (trans) side of the membrane without a vestibule,63 capture of molecules into both HfO2 pore sizes was at least as efficient as capture into the vestibule (cis) side of RHL. At 200 mV, we measure a rate of ~20 s−1 μM−1 for HfO2 ~, while previous experiments have measured 7 s−1 μM−1 for αHL at 200 mV.54
Figure 5.
Transport of 89-mer single-stranded DNA (ssDNA) through HfO2 pores with d = 1.4 and 1.7 nm. (a) Continuous current traces at various voltages (indicated in white text on traces). Deep fractional blockades are observed; ΔI/Io = 83% for d = 1.4 nm and 70% for d = 1.7 nm pore. (b) Scatter plots of ΔI vs td demonstrate the impact of a 0.3 nm pore diameter reduction on the spread of dwell times. This strong dependence is evidence of strong interactions between the ssDNA molecule and the HfO2 pore. (c) Normalized capture rates as a function of voltage. Both pores exhibit exponential dependence of event rate on voltage, owing to an energetic barrier for capture into the pores (error bars smaller than markers). (d) Mean dwell times for 1.7 nm pore (left axis) and 1.4 nm pore (right axis). Evidence of strong interactions is seen by the orders of magnitude longer dwell times and wider spread of the distributions (see Supporting Information), as well as the superexponential dependence of dwell times on voltage for the 1.4 nm pore.
Similarly to dsDNA, a ssDNA molecule experiences strong interactions with the HfO2 pore walls, which causes an enormous distribution of dwell times. In Figure 5b, scatter plots of fractional current blockades vs dwell times are shown for the same 89-mer ssDNA sample transported through 1.7 and 1.4 nm diameter pores. It is striking that a ~0.3 nm reduction in pore diameter increases the most likely dwell times by ~30 and the spread in dwell times by ~100. This large variance in dwell time can be attributed to strong interactions between the ssDNA molecule and the walls of the HfO2 pore, which may cause stick–slip motion of the ssDNA through the pore. In addition to phosphate backbone interactions, we cannot rule out interactions of the HfO2 surface with specific nucleobases.61 While not dynamically controllable as in other proposed devices,64 this enhanced interaction of DNA with HfO2 pores can be useful for slowing DNA motion through the pore. Upon fitting the dwell time data to log-normal distributions (see Supporting Information), the dependence of the most likely dwell time (〈td〉) on voltage is shown in Figure 5d. In the figure, one-sided error bars represent the long-tail variance of the distributions. While exponential dependence is observed for the 1.7 nm diameter pore (left axis), we find superexponential behavior of 〈td〉 for the 1.4 nm pore (right axis). Recent Langevin dynamics simulations of a strongly interacting pore find a superexponential relationship between driving force and dwell time,65 which produce remarkably similar behavior to our experiments. Though further investigation is required, two non-exclusive mechanisms can explain this behavior: (1) the pore we have used is too small to allow unhindered passage of ssDNA nucleobases, resulting in steric-dominated stick–slip motion through the pore,66 and (2) chemical interactions between ssDNA and the HfO2 surface are responsible for this observed friction.61
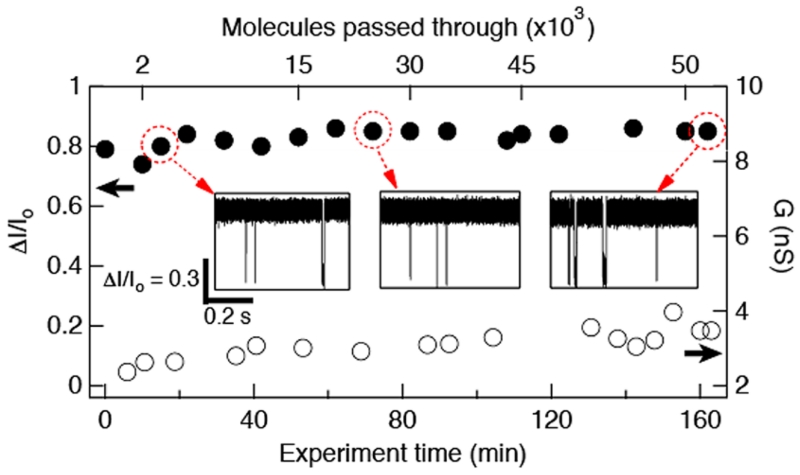
Finally, since the properties of synthetic nanopores are more susceptible to change over the course of an experiment than those of protein pores,31 we investigated the abrasion resistance of a sub-2 nm HfO2 pore during a multihour experiment. In Figure 6, we plot the fractional current blockade (ΔI/Io) as a function of experiment time for a 1.4 nm diameter pore at V = 350 mV (closed circles, left axis). The pore conductance ΔG over time is also plotted (open circles, right axis). During this experiment, >50 000 ssDNA molecules have been passed through the pore, and yet the unchanged ΔI/Io indicates that the pore diameter remains constant; the minor <10% conductance change is merely the result of water evaporation from the buffer. Given the strong interactions of ssDNA with the 1.4 nm pore, one would expect the pore to clog easily. Counterintuitively, these pores simultaneously demonstrate strong pore–analyte interactions and resistance to clogging. We attribute this to the pore thinness, which serves to both confine the region of strongest interaction and increase the electric field (i.e., driving force) within the pore. This result exemplifies the strong chemical and mechanical stability of the HfO2 membrane.
Figure 6.
Time stability data for a 1.4 nm diameter HfO2 pore. Plot shows the fractional current blockade ΔI/Io (left axis) as a function of the ~2.5 h experiment time. The pore conductance as a function of time is shown on the right axis. Insets show current traces at different times of the experiment (V = 350 mV). Top axis shows the estimated number of molecules passed through the pore.
CONCLUSIONS
In conclusion, we have demonstrated that HfO2 is a viable alternative to SiNx for solid-state nanopore sensors. Fabrication of a wafer-full of HfO2 membranes and nanopore fabrication in these membranes using a TEM are straightforward. HfO2 pores are hydrophilic, stable, and have nearly neutral surface charge in physiological conditions. By studying voltage-driven transport of DNA molecules, we have shown that 3.6 nm diameter HfO2 pores efficiently admit dsDNA molecules at lower bias voltages than SiNx pores, while transport is slower than for SiNx pores of similar geometry. Likewise, with 1.4 nm diameter pores we have measured much longer and more spread out ssDNA transport time statistics than with a 1.7 nm diameter pore, suggesting very strong interactions between the material and the nucleic acid molecules. The combined experiments point to interaction between the DNA backbone and HfO2, which we posit comes from phosphate/HfO2 interactions. Finally, the pores exhibit a remarkable stability over time, which enables the fabrication of small pores in thin membranes that are usable for hours of continuous measurements. Further studies of the interactions between DNA and HfO2 in the context of voltage-driven or enzyme-driven DNA translocation67 may improve the detection of DNA polymers through solid-state nanopores,23 enable a more controlled transport through nanopores equipped with transverse electrodes,68–70 enable high-resolution studies of DNA/protein interactions via rupturing forces,66,71 and be used in conjunction with small graphene pores for a further reduction of DNA velocity,22,72 as well as for other nanopore-based applications.
MATERIALS AND METHODS
Substrates for nanopore fabrication were 5 × 5 mm2 Si chips with a 50 nm thick SiNx film deposited on a 2.5 μm thick thermal SiO2 layer, which helps to reduce electrical noise. HfO2 films were deposited at 150 °C using a GEMSTAR benchtop ALD system (Arradiance), with tetrakis(ethylmethylamino)hafnium and H2O used as a precursor and oxidizer, respectively.50 AFM- and ellipsometry-calibrated thicknesses of SiNx were etched in a Technics Micro-RIE Series 800 etcher using sulfur hexafluoride (SF6) at 300 mTorr and 150 W. SiNx was protected with a 950 PMMA etch mask, and a small region was exposed using Nabity NPGS e-beam writing software on a Hitachi S-4800 scanning electron microscope. Exposed PMMA was developed with 3:1 isopropyl alcohol and methyl isobutylketone, and following SiNx thinning PMMA was removed using acetone.20 Nanopores were fabricated and imaged at Northeastern University using a JEOL 2010FEG transmission electron microscope at 200 kV.
Nanopore chips were cleaned using hot piranha followed by hot water. After vacuum drying, the chips were mounted in a PTFE cell using a quick-curing elastomer gasket (Smooth-On EcoFlex 5). Cell chambers were filled with 1 M KCl buffer solution (pH 8.3, 10 mM Tris, 1 mM EDTA), and Ag/AgCl electrodes were inserted into each chamber. Current data were collected at 4 MS/s and digitally low-pass filtered using a Chimera Instruments VC100 amplifier system23 unless otherwise indicated. Before addition of a DNA sample, a current–voltage curve and a several second current trace at constant bias were collected to ensure a steady open pore current. Sample molecules were then thoroughly mixed with the buffer in the chamber using a pipet to achieve a final desired concentration. Molecules and concentrations were as follows: for ssDNA experiments, a 30–100 nM 89-mer solution was used (see Supporting Information). For dsDNA experiments, a 150 nM solution of 100 bp Fermentas NoLimits DNA fragment was used (Thermo Scientific).
Supplementary Material
Acknowledgment
The authors acknowledge financial support from The National Human Genome Research Institute grant number R21 HG006873. The authors thank Cohavit Gil and Baram Sosis for help in atomic layer deposition calibration, Andrey Ivankin for α-hemolysin translocation data, and Carolyn Shasha for adaptation of the OpenNanopore source code to our data. The authors acknowledge the Center for Nanoscale Systems (CNS) at Harvard University, a part of the National Nanotechnology Infrastructure Network, where EDS data were acquired. The authors thank Murugappan Muthukumar for fruitful discussions.
Footnotes
Conflict of Interest: The authors declare the following competing financial interest(s): J.K.R. is a principal in Chimera Instruments.
Supporting Information Available: Membrane characterization details, raw traces, analysis details, and comparison with other pores. This material is available free of charge via the Internet at http://pubs.acs.org.
REFERENCES AND NOTES
- 1.Howorka S, Siwy Z. Nanopore Analytics: Sensing of Single Molecules. Chem. Soc. Rev. 2009;38:2360–2384. doi: 10.1039/b813796j. [DOI] [PubMed] [Google Scholar]
- 2.Venkatesan BM, Bashir R. Nanopore Sensors for Nucleic Acid Analysis. Nat. Nanotechnol. 2011;6:615–624. doi: 10.1038/nnano.2011.129. [DOI] [PubMed] [Google Scholar]
- 3.Haque F, Li JH, Wu HC, Liang XJ, Guo PX. Solid-State and Biological Nanopore for Real-Time Sensing of Single Chemical and Sequencing of DNA. Nano Today. 2013;8:56–74. doi: 10.1016/j.nantod.2012.12.008. [DOI] [PMC free article] [PubMed] [Google Scholar]
- 4.Kasianowicz JJ, Brandin E, Branton D, Deamer DW. Characterization of Individual Polynucleotide Molecules Using a Membrane Channel. Proc. Natl. Acad. Sci. U.S.A. 1996;93:13770–13773. doi: 10.1073/pnas.93.24.13770. [DOI] [PMC free article] [PubMed] [Google Scholar]
- 5.Branton D, Deamer DW, Marziali A, Bayley H, Benner SA, Butler T, Di Ventra M, Garaj S, Hibbs A, Huang XH, et al. The Potential and Challenges of Nanopore Sequencing. Nat. Biotechnol. 2008;26:1146–1153. doi: 10.1038/nbt.1495. [DOI] [PMC free article] [PubMed] [Google Scholar]
- 6.Zwolak M, Di Ventra M. Colloquium: Physical Approaches to DNA Sequencing and Detection. Rev. Mod. Phys. 2008;80:141–165. [Google Scholar]
- 7.Schneider GF, Dekker C. DNA Sequencing with Nanopores. Nat. Biotechnol. 2012;30:326–328. doi: 10.1038/nbt.2181. [DOI] [PubMed] [Google Scholar]
- 8.Singer A, Rapireddy S, Ly DH, Meller A. Electronic Barcoding of a Viral Gene at the Single-Molecule Level. Nano Lett. 2012;12:1722–1728. doi: 10.1021/nl300372a. [DOI] [PMC free article] [PubMed] [Google Scholar]
- 9.Kowalczyk SW, Hall AR, Dekker C. Detection of Local Protein Structures along DNA Using Solid-State Nanopores. Nano Lett. 2010;10:324–328. doi: 10.1021/nl903631m. [DOI] [PubMed] [Google Scholar]
- 10.Bates M, Burns M, Meller A. Dynamics of DNA Molecules in a Membrane Channel Probed by Active Control Techniques. Biophys. J. 2003;84:2366–2372. doi: 10.1016/S0006-3495(03)75042-5. [DOI] [PMC free article] [PubMed] [Google Scholar]
- 11.Tropini C, Marziali A. Multi-Nanopore Force Spectroscopy for DNA Analysis. Biophys. J. 2007;92:1632–1637. doi: 10.1529/biophysj.106.094060. [DOI] [PMC free article] [PubMed] [Google Scholar]
- 12.Dudko OK, Mathe J, Szabo A, Meller A, Hummer G. Extracting Kinetics from Single-Molecule Force Spectroscopy: Nanopore Unzipping of DNA Hairpins. Biophys. J. 2007;92:4188–4195. doi: 10.1529/biophysj.106.102855. [DOI] [PMC free article] [PubMed] [Google Scholar]
- 13.Tabard-Cossa V, Wiggin M, Trivedi D, Jetha NN, Dwyer JR, Marziali A. Single-Molecule Bonds Characterized by Solid-State Nanopore Force Spectroscopy. ACS Nano. 2009;3:3009–3014. doi: 10.1021/nn900713a. [DOI] [PMC free article] [PubMed] [Google Scholar]
- 14.Soni GV, Dekker C. Detection of Nucleosomal Substructures Using Solid-State Nanopores. Nano Lett. 2012;12:3180–3186. doi: 10.1021/nl301163m. [DOI] [PubMed] [Google Scholar]
- 15.Storm AJ, Chen JH, Ling XS, Zandbergen HW, Dekker C. Fabrication of Solid-State Nanopores with Single-Nanometre Precision. Nat. Mater. 2003;2:537–540. doi: 10.1038/nmat941. [DOI] [PubMed] [Google Scholar]
- 16.Li J, Stein D, McMullan C, Branton D, Aziz MJ, Golovchenko JA. Ion-Beam Sculpting at Nanometre Length Scales. Nature. 2001;412:166–169. doi: 10.1038/35084037. [DOI] [PubMed] [Google Scholar]
- 17.Yang JJ, Ferranti DC, Stern LA, Sanford CA, Huang J, Ren Z, Qin LC, Hall AR. Rapid and Precise Scanning Helium Ion Microscope Milling of Solid-State Nanopores for Biomolecule Detection. Nanotechnology. 2011;22:285310. doi: 10.1088/0957-4484/22/28/285310. [DOI] [PubMed] [Google Scholar]
- 18.Aksimentiev A, Heng JB, Cruz-Chu ER, Timp G, Schulten K. Microscopic Kinetics of DNA Translocation through Synthetic Nanopores. Biophys. J. 2005;88:352a–352a. doi: 10.1529/biophysj.104.042960. [DOI] [PMC free article] [PubMed] [Google Scholar]
- 19.Wanunu M, Sutin J, McNally B, Chow A, Meller A. DNA Translocation Governed by Interactions with Solid-State Nanopores. Biophys. J. 2008;95:4716–4725. doi: 10.1529/biophysj.108.140475. [DOI] [PMC free article] [PubMed] [Google Scholar]
- 20.Wanunu M, Dadosh T, Ray V, Jin JM, McReynolds L, Drndic M. Rapid Electronic Detection of Probe-Specific Micrornas Using Thin Nanopore Sensors. Nat. Nanotechnol. 2010;5:807–814. doi: 10.1038/nnano.2010.202. [DOI] [PubMed] [Google Scholar]
- 21.Kowalczyk SW, Grosberg AY, Rabin Y, Dekker C. Modeling the Conductance and DNA Blockade of Solid-State Nanopores. Nanotechnology. 2011;22:315101. doi: 10.1088/0957-4484/22/31/315101. [DOI] [PubMed] [Google Scholar]
- 22.Garaj S, Liu S, Golovchenko JA, Branton D. Molecule-Hugging Graphene Nanopores. Proc. Natl. Acad. Sci. U.S.A. 2013;110:12192–12196. doi: 10.1073/pnas.1220012110. [DOI] [PMC free article] [PubMed] [Google Scholar]
- 23.Venta K, Shemer G, Puster M, Rodriguez-Manzo JA, Balan A, Rosenstein JK, Shepard K, Drndic M. Differentiation of Short, Single-Stranded DNA Homopolymers in Solid-State Nanopores. ACS Nano. 2013;7:4629–4636. doi: 10.1021/nn4014388. [DOI] [PMC free article] [PubMed] [Google Scholar]
- 24.Kim YR, Min J, Lee IH, Kim S, Kim AG, Kim K, Namkoong K, Ko C. Nanopore Sensor for Fast Label-Free Detection of Short Double-Stranded DNAs. Biosens. Bioelectron. 2007;22:2926–2931. doi: 10.1016/j.bios.2006.12.003. [DOI] [PubMed] [Google Scholar]
- 25.Wei RS, Gatterdam V, Wieneke R, Tampe R, Rant U. Stochastic Sensing of Proteins with Receptor-Modified Solid-State Nanopores. Nat Nanotechnol. 2012;7:257–263. doi: 10.1038/nnano.2012.24. [DOI] [PubMed] [Google Scholar]
- 26.Anderson BN, Muthukumar M, Meller A. pH Tuning of DNA Translocation Time through Organically Functionalized Nanopores. ACS Nano. 2013;7:1408–1414. doi: 10.1021/nn3051677. [DOI] [PMC free article] [PubMed] [Google Scholar]
- 27.Rosenstein JK, Wanunu M, Merchant CA, Drndic M, Shepard KL. Integrated Nanopore Sensing Platform with Sub-Microsecond Temporal Resolution. Nat. Methods. 2012;9:487–492. doi: 10.1038/nmeth.1932. [DOI] [PMC free article] [PubMed] [Google Scholar]
- 28.Storm AJ, Storm C, Chen JH, Zandbergen H, Joanny JF, Dekker C. Fast DNA Translocation through a Solid-State Nanopore. Nano Lett. 2005;5:1193–1197. doi: 10.1021/nl048030d. [DOI] [PubMed] [Google Scholar]
- 29.Wu MY, Krapf D, Zandbergen M, Zandbergen H, Batson PE. Formation of Nanopores in a SiN/SiO2 Membrane with an Electron Beam. Appl. Phys. Lett. 2005;87:113106. [Google Scholar]
- 30.Liebes Y, Hadad B, Ashkenasy N. Effects of Electrons on the Shape of Nanopores Prepared by Focused Electron Beam Induced Etching. Nanotechnology. 2011;22:285303. doi: 10.1088/0957-4484/22/28/285303. [DOI] [PubMed] [Google Scholar]
- 31.van den Hout M, Hall AR, Wu MY, Zandbergen HW, Dekker C, Dekker NH. Controlling Nanopore Size, Shape and Stability. Nanotechnology. 2010;21:115304. doi: 10.1088/0957-4484/21/11/115304. [DOI] [PubMed] [Google Scholar]
- 32.Kuan AT, Golovchenko JA. Nanometer-Thin Solid-State Nanopores by Cold Ion Beam Sculpting. Appl. Phys. Lett. 2012;100:1–4. doi: 10.1063/1.4719679. [DOI] [PMC free article] [PubMed] [Google Scholar]
- 33.Niedzwiecki DJ, Iyer R, Borer PN, Movileanu L. Sampling a Biomarker of the Human Immunodeficiency Virus across a Synthetic Nanopore. ACS Nano. 2013;7:3731–3731. doi: 10.1021/nn400125c. [DOI] [PMC free article] [PubMed] [Google Scholar]
- 34.Venkatesan BM, Dorvel B, Yemenicioglu S, Watkins N, Petrov I, Bashir R. Highly Sensitive, Mechanically Stable Nanopore Sensors for DNA Analysis. Adv. Mater. 2009;21:2771–2776. doi: 10.1002/adma.200803786. [DOI] [PMC free article] [PubMed] [Google Scholar]
- 35.Garaj S, Hubbard W, Reina A, Kong J, Branton D, Golovchenko JA. Graphene as a Subnanometre Trans-Electrode Membrane. Nature. 2010;467:190–193. doi: 10.1038/nature09379. [DOI] [PMC free article] [PubMed] [Google Scholar]
- 36.Merchant CA, Healy K, Wanunu M, Ray V, Peterman N, Bartel J, Fischbein MD, Venta K, Luo ZT, Johnson ATC, et al. DNA Translocation through Graphene Nanopores. Nano Lett. 2010;10:2915–2921. doi: 10.1021/nl101046t. [DOI] [PubMed] [Google Scholar]
- 37.Schneider GF, Kowalczyk SW, Calado VE, Pandraud G, Zandbergen HW, Vandersypen LMK, Dekker C. DNA Translocation through Graphene Nanopores. Nano Lett. 2010;10:3163–3167. doi: 10.1021/nl102069z. [DOI] [PubMed] [Google Scholar]
- 38.Liu S, Lu B, Zhao Q, Li J, Gao T, Chen Y, Zhang Y, Liu Z, Fan Z, Yang F, et al. Boron Nitride Nanopores: Highly Sensitive DNA Single-Molecule Detectors. Adv. Mater. 2013 doi: 10.1002/adma.201301336. 10.1002/adma.201301336. [DOI] [PubMed] [Google Scholar]
- 39.Wei RS, Martin TG, Rant U, Dietz H. DNA Origami Gatekeepers for Solid-State Nanopores. Angew. Chem., Int. Ed. 2012;51:4864–4867. doi: 10.1002/anie.201200688. [DOI] [PubMed] [Google Scholar]
- 40.Langecker M, Arnaut V, Martin TG, List J, Renner S, Mayer M, Dietz H, Simmel FC. Synthetic Lipid Membrane Channels Formed by Designed DNA Nanostructures. Science. 2012;338:932–936. doi: 10.1126/science.1225624. [DOI] [PMC free article] [PubMed] [Google Scholar]
- 41.Bell NAW, Engst CR, Ablay M, Divitini G, Ducati C, Liedl T, Keyser UF. DNA Origami Nanopores. Nano Lett. 2012;12:512–517. doi: 10.1021/nl204098n. [DOI] [PubMed] [Google Scholar]
- 42.Nielsen RH, Wilfing G. Ullmann’s Encyclopedia of Industrial Chemistry. Wiley-VCH Verlag GmbH & Co. KGaA; 2000. Hafnium and Hafnium Compounds. [Google Scholar]
- 43.Chuang WH, Luger T, Fettig RK, Ghodssi R. Mechanical Property Characterization of LPCVD Silicon Nitride Thin Films at Cryogenic Temperatures. J. Microelectromech. S. 2004;13:870–879. [Google Scholar]
- 44.Tapily K, Jakes JE, Stone DS, Shrestha P, Gu D, Baumgart H, Elmustafa AA. Nanoindentation Investigation of HfO2 and Al2O3 Films Grown by Atomic Layer Deposition. J. Electrochem. Soc. 2008;155:H545–H551. [Google Scholar]
- 45.O’Hare PAG, Tomaszkiewicz I, Beck ICM, Seifert HJ. Thermodynamics of Silicon Nitride. I. Standard Molar Enthalpies of Formation Δfhmo at the Temperature 298.15 K of A-Si3N4 and B-Si3N4. J. Chem. Thermodyn. 1999;31:303–322. [Google Scholar]
- 46.Zumdahl SS. Chemical Principles. 6th Houghton Miffin Company; 2009. p. A22. [Google Scholar]
- 47.Humphrey GL. Heats of Formation of Hafnium Oxide and Hafnium Nitride. J. Am. Chem. Soc. 1953;75:2806–2807. [Google Scholar]
- 48.Kosmulski M. Attempt to Determine Pristine Points of Zero Charge of Nb2O5, Ta2O5, and HfO2. Langmuir. 1997;13:6315–6320. [Google Scholar]
- 49.Shim J, Rivera JA, Bashir R. Electron Beam Induced Local Crystallization of HfO2 Nanopores for Biosensing Applications. Nanoscale. 2013 doi: 10.1039/c3nr02608f. 10.1039/C3NR02608F. [DOI] [PMC free article] [PubMed] [Google Scholar]
- 50.Hausmann DM, Kim E, Becker J, Gordon RG. Atomic Layer Deposition of Hafnium and Zirconium Oxides Using Metal Amide Precursors. Chem. Mater. 2002;14:4350–4358. [Google Scholar]
- 51.Kim MJ, Wanunu M, Bell DC, Meller A. Rapid Fabrication of Uniformly Sized Nanopores and Nanopore Arrays for Parallel DNA Analysis. Adv. Mater. 2006;18:3149–3155. [Google Scholar]
- 52.Tabard-Cossa V, Trivedi D, Wiggin M, Jetha NN, Marziali A. Noise Analysis and Reduction in Solid-State Nanopores. Nanotechnology. 2007;18:305505. [Google Scholar]
- 53.Raillon C, Granjon P, Graf M, Steinbock LJ, Radenovic A. Fast and Automatic Processing of Multi-Level Events in Nanopore Translocation Experiments. Nanoscale. 2012;4:4916–4924. doi: 10.1039/c2nr30951c. [DOI] [PubMed] [Google Scholar]
- 54.Meller A, Branton D. Single Molecule Measurements of DNA Transport through a Nanopore. Electrophoresis. 2002;23:2583–2591. doi: 10.1002/1522-2683(200208)23:16<2583::AID-ELPS2583>3.0.CO;2-H. [DOI] [PubMed] [Google Scholar]
- 55.Chen P, Gu JJ, Brandin E, Kim YR, Wang Q, Branton D. Probing Single DNA Molecule Transport Using Fabricated Nanopores. Nano Lett. 2004;4:2293–2298. doi: 10.1021/nl048654j. [DOI] [PMC free article] [PubMed] [Google Scholar]
- 56.Wanunu M, Morrison W, Rabin Y, Grosberg AY, Meller A. Electrostatic Focusing of Unlabelled DNA into Nanoscale Pores Using a Salt Gradient. Nat. Nanotechnol. 2010;5:160–165. doi: 10.1038/nnano.2009.379. [DOI] [PMC free article] [PubMed] [Google Scholar]
- 57.Lubensky DK, Nelson DR. Driven Polymer Translocation through a Narrow Pore. Biophys. J. 1999;77:1824–1838. doi: 10.1016/S0006-3495(99)77027-X. [DOI] [PMC free article] [PubMed] [Google Scholar]
- 58.Sun LF, Carr PW. Mixed-Mode Retention of Peptides on Phosphate-Modified Polybutadiene-Coated Zirconia. Anal. Chem. 1995;67:2517–2523. doi: 10.1021/ac00111a004. [DOI] [PubMed] [Google Scholar]
- 59.Hofer R, Textor M, Spencer ND. Alkyl Phosphate Monolayers, Self-Assembled from Aqueous Solution onto Metal Oxide Surfaces. Langmuir. 2001;17:4014–4020. [Google Scholar]
- 60.Yildirim O, Yilmaz MD, Reinhoudt DN, Blank DHA, Rijnders G, Huskens J. Electrochemical Stability of Self-Assembled Alkylphosphate Monolayers on Conducting Metal Oxides. Langmuir. 2011;27:9890–9894. doi: 10.1021/la200925v. [DOI] [PubMed] [Google Scholar]
- 61.Fahrenkopf NM, Rice PZ, Bergkvist M, Deskins NA, Cady NC. Immobilization Mechanisms of Deoxyribonucleic Acid (DNA) to Hafnium Dioxide (HfO2) Surfaces for Biosensing Applications. ACS Appl. Mater. Interfaces. 2012;4:5360–5368. doi: 10.1021/am3013032. [DOI] [PubMed] [Google Scholar]
- 62.Wanunu M. Nanopores: A Journey Towards DNA Sequencing. Phys. Life Rev. 2012;9:125–158. doi: 10.1016/j.plrev.2012.05.010. [DOI] [PMC free article] [PubMed] [Google Scholar]
- 63.Henrickson SE, Misakian M, Robertson B, Kasianowicz JJ. Driven DNA Transport into an Asymmetric Nanometer-Scale Pore. Phys. Rev. Lett. 2000;85:3057–3060. doi: 10.1103/PhysRevLett.85.3057. [DOI] [PubMed] [Google Scholar]
- 64.Luan BQ, Martyna G, Stolovitzky G. Characterizing and Controlling the Motion of ssDNA in a Solid-State Nanopore. Biophys. J. 2011;101:2214–2222. doi: 10.1016/j.bpj.2011.08.038. [DOI] [PMC free article] [PubMed] [Google Scholar]
- 65.Luo KF, Ala-Nissila T, Ying SC, Bhattacharya A. Translocation Dynamics with Attractive Nanopore-Polymer Interactions. Phys. Rev. E. 2008;78:061918. doi: 10.1103/PhysRevE.78.061918. [DOI] [PubMed] [Google Scholar]
- 66.Mirsaidov U, Comer J, Dimitrov V, Aksimentiev A, Timp G. Slowing the Translocation of Double-Stranded DNA Using a Nanopore Smaller Than the Double Helix. Nanotechnology. 2010;21:395501. doi: 10.1088/0957-4484/21/39/395501. [DOI] [PMC free article] [PubMed] [Google Scholar]
- 67.Cherf GM, Lieberman KR, Rashid H, Lam CE, Karplus K, Akeson M. Automated Forward and Reverse Ratcheting of DNA in a Nanopore at 5-Angstrom Precision. Nat. Biotechnol. 2012;30:344–348. doi: 10.1038/nbt.2147. [DOI] [PMC free article] [PubMed] [Google Scholar]
- 68.Ivanov AP, Instuli E, McGilvery CM, Baldwin G, McComb DW, Albrecht T, Edel JB. DNA Tunneling Detector Embedded in a Nanopore. Nano Lett. 2011;11:279–285. doi: 10.1021/nl103873a. [DOI] [PMC free article] [PubMed] [Google Scholar]
- 69.Tsutsui M, Matsubara K, Ohshiro T, Furuhashi M, Taniguchi M, Kawai T. Electrical Detection of Single Methylcytosines in a DNA Oligomer. J. Am. Chem. Soc. 2011;133:9124–9128. doi: 10.1021/ja203839e. [DOI] [PubMed] [Google Scholar]
- 70.Menard LD, Mair CE, Woodson ME, Alarie JP, Ramsey JM. A Device for Performing Lateral Conductance Measurements on Individual Double-Stranded DNA Molecules. ACS Nano. 2012;6:9087–9094. doi: 10.1021/nn303322r. [DOI] [PMC free article] [PubMed] [Google Scholar]
- 71.Shim J, Humphreys GI, Venkatesan BM, Munz JM, Zou XQ, Sathe C, Schulten K, Kosari F, Nardulli AM, Vasmatzis G, et al. Detection and Quantification of Methylation in DNA Using Solid-State Nanopores. Sci. Rep. 2013;3:1389. doi: 10.1038/srep01389. [DOI] [PMC free article] [PubMed] [Google Scholar]
- 72.Venkatesan BM, Estrada D, Banerjee S, Jin XZ, Dorgan VE, Bae MH, Aluru NR, Pop E, Bashir R. Stacked Graphene-Al2O3 Nanopore Sensors for Sensitive Detection of DNA and DNA-Protein Complexes. ACS Nano. 2012;6:441–450. doi: 10.1021/nn203769e. [DOI] [PMC free article] [PubMed] [Google Scholar]
Associated Data
This section collects any data citations, data availability statements, or supplementary materials included in this article.


