Abstract
Erythropoietin (Epo) is produced by renal Epo-producing cells (REPs) in a hypoxia-inducible manner. The conversion of REPs into myofibroblasts and coincident loss of Epo-producing ability are the major cause of renal fibrosis and anemia. However, the hypoxic response of these transformed myofibroblasts remains unclear. Here, we used complementary in vivo transgenic and live imaging approaches to better understand the importance of hypoxia signaling in Epo production. Live imaging of REPs in transgenic mice expressing green fluorescent protein from a modified Epo-gene locus revealed that healthy REPs tightly associated with endothelium by wrapping processes around capillaries. However, this association was hampered in states of renal injury-induced inflammation previously shown to correlate with the transition to myofibroblast-transformed renal Epo-producing cells (MF-REPs). Furthermore, activation of hypoxia-inducible factors (HIFs) by genetic inactivation of HIF-prolyl hydroxylases (PHD1, PHD2, and PHD3) selectively in Epo-producing cells reactivated Epo production in MF-REPs. Loss of PHD2 in REPs restored Epo-gene expression in injured kidneys but caused polycythemia. Notably, combined deletions of PHD1 and PHD3 prevented loss of Epo expression without provoking polycythemia. Mice with PHD-deficient REPs also showed resistance to LPS-induced Epo repression in kidneys, suggesting that augmented HIF signaling counterbalances inflammatory stimuli in regulation of Epo production. Thus, augmentation of HIF signaling may be an attractive therapeutic strategy for treating renal anemia by reactivating Epo synthesis in MF-REPs.
Keywords: anemia, chronic kidney disease, erythropoietin, fibrosis, hypoxia, Pathophysiology of Renal Disease and Progression
All chronic nephropathies progress through a final common pathologic pathway characterized by tubulo-interstitial fibrosis, independent of their etiology.1,2 The progression of fibrosis leads to excessive accumulation of the extracellular matrix, destruction of the parenchymal architecture, compromised tissue oxygen availability, and ultimately organ failure.2–4 This process is accompanied by erythropoietin (Epo)-deficiency anemia5 and increased cardiovascular morbidity and mortality, known as cardio-renal anemia syndrome.6,7
Since the relationship between declining renal function and tubulo-interstitial fibrosis was first described, considerable efforts have focused on elucidating the origin of major matrix-producing cells in injured kidneys, i.e., myofibroblasts.8–11 Recently, we and others have identified capillary-surrounding fibroblasts with inherent Epo-producing ability or renal Epo-producing cells (REPs)12–16 as the major source of the myofibroblast pool in injured kidneys.17–20 The dysfunction and transformation of REPs lead to loss of their Epo-producing ability even when faced with the severe anemic stimuli. Fibrosis and anemia in CKD therefore share a common mechanism.17,18,21 The myofibroblast-transformed renal Epo-producing cells (MF-REPs) possess a certain degree of plasticity in responding to microenvironmental cues, indicating therapeutics that target REPs have potential for both anemia and fibrosis.17
Epo production is induced under oxygen-depleted conditions (hypoxia) at the gene transcription level, which is mainly regulated by hypoxia-inducible factors (HIFs).13–15,22,23 HIFs are heterodimeric complexes composed of α and β subunits, and three independent genes for HIF-α isoforms (HIF1α, HIF2α, and HIF3α) have been identified.24–27 In normal oxygen states (normoxia), HIF-α proteins are hydroxylated by HIF-prolyl-hydroxylase domain-containing proteins (PHDs; PHD1, PHD2, and PHD3), leading to their proteasomal degradation through von Hippel Lindau protein (pVHL)-mediated ubiquitination.24–27 Under hypoxic conditions, PHDs are inactivated, and HIF-α proteins escape degradation. The stabilized HIF-α proteins dimerize with the HIF-β subunit, and the HIF complexes bind to hypoxia responsive elements in gene regulatory regions to activate the expression of the target genes including Epo.16,22,24–28
Systemic knockout studies in mice have identified PHD2 and HIF2α as the most important factors in renal Epo production.29–31 Under normal conditions, most fibroblasts in the cortex and outer medulla possess Epo-producing ability but do not produce Epo (OFF-REPs).14,17 When oxygen supplies decline or oxygen demands increase, the OFF-REPs start to produce Epo through HIF-mediated Epo-gene transcription (ON-REPs). As a result, total Epo synthesis in the kidney is substantially increased, leading to stress erythropoiesis in the bone marrow and in the spleen in rodents and to the re-establishment of oxygen homeostasis.13,14,17,32,33
The coordinated HIF-induced responses are crucial for cells to adapt to hypoxic or anemic milieus.24,26 It is therefore not surprising that augmenting the hypoxic response by inhibiting oxygen sensors has been attracting attention as a novel therapeutic strategy for ischemic and inflammatory disease, including kidney diseases.34,35 In that regard, a clinical trial has successfully reported that pharmacological activation of HIF signaling can augment Epo-production in ESRD.36 However, the hypoxic response of REPs during disease is largely unstudied, and the mechanisms underlying the re-establishment of Epo synthesis in fibrotic kidneys are unclear. We hypothesized that the HIF-mediated hypoxic response might be insufficient or deteriorated in MF-REPs in injured kidneys and that augmenting their hypoxic response might reactivate their physiologic function.
In this study, we conducted in vivo transgenic and live imaging approaches to better understand the importance of hypoxia signaling in injured kidneys. We analyzed the adequacy of hypoxia signaling, dynamic morphologic changes of myofibroblast transformation of REPs, and the isoform-specific functions of PHDs and HIFs in REPs under health and disease conditions. Through these analyses, we discovered that the augmentation of HIF signaling in MF-REPs reactivates the Epo synthesis without worsening of fibrosis or inflammation. Our results indicate that HIF signaling activators are attractive therapeutic reagents for restoring the Epo-producing ability of REPs and treating cardio-renal anemia syndrome.
Results
Morphologic Changes of REPs by Kidney Injury
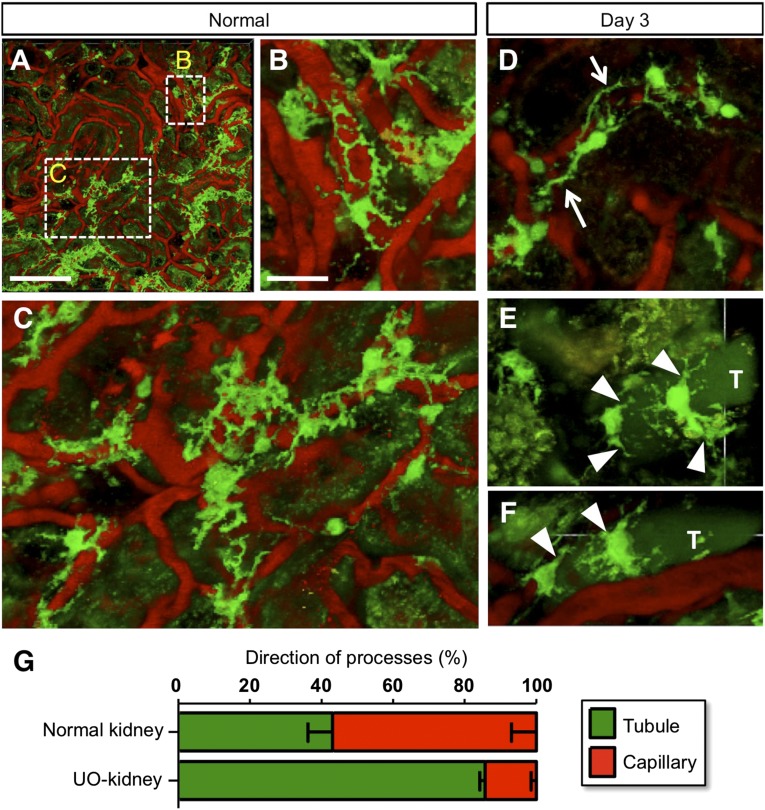
To examine phenotypic changes of REPs in damaged kidneys, we performed live imaging of REPs using inherited super anemic mice (ISAM), in which the REPs express bright green fluorescence from the modified Epo-gene locus.14,17 REPs retain a number of processes in healthy kidneys, and their processes form networks surrounding capillaries (Figure 1A). High-magnification images further demonstrate that the processes are tightly interconnected and are wrapping the capillaries (Figure 1, B and C). This observation suggests that REPs and renal pericytes may be largely overlapping cellular populations.37
Figure 1.
Phenotypic changes of REPs upon injury. (A–F) Live imaging of REPs in the ISAM kidneys before (A–C) and 3 days after (D–F) ureteral obstruction (UO). Under a two-photon microscope, REPs and peritubular capillaries were detected with GFP expression (green) and rhodamine B-conjugated 70-kD dextran (red), respectively (B and C; high magnification views of A). Note that many processes from the cell body of REPs were attached along with the capillary walls at baseline (B and C), whereas some of the processes detached from the capillary wall (arrows in D) and attached to the tubular wall (arrowheads in E and F). Tubules (T) were visualized by the auto-fluorescence from the urine. (G) Quantification of the process directions of REPs. Numbers of directions either toward capillaries or toward tubules were counted. The data (mean±SD, n=3) indicate that the direction of the primary process of REPs changes toward the tubular side upon 3 days of UO. The number of process was not changed by the UUO procedure (normal REPs: 4.8±0.2 versus UUO-treated REPs: 5.3±0.4).
Upon unilateral ureteral obstruction (UUO) for 3 days, a model for inducing fibrogenic milieu,17 the processes of REPs started to detach from their associated capillaries in the ureteral-obstructed kidneys (UO-kidneys; Figure 1D). Instead, the processes started to associate with the adjacent tubules (Figure 1, E and F); approximately 60% of the processes were associated with the capillaries in normal kidneys, but more than 80% of the processes were associated with or in juxtaposition of tubules in UO-kidneys (Figure 1G). These results indicate that the deterioration of renal milieu alters the morphology of REPs and the direction of their processes, concomitant with the transformation of REPs into myofibroblast.
Exacerbated Hypoxia in Injured Kidneys
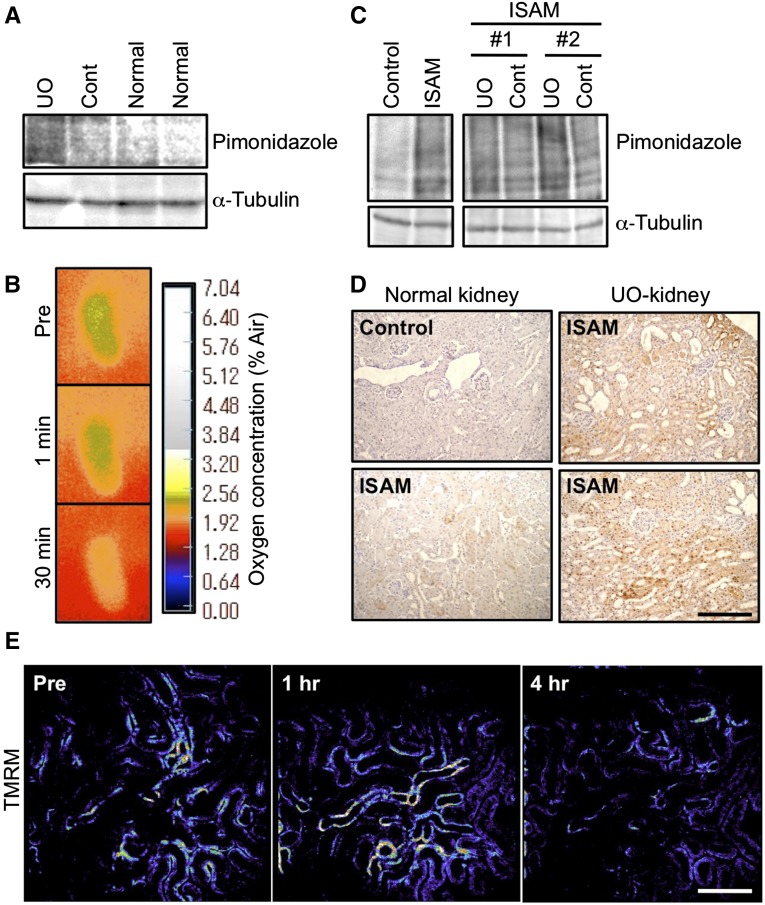
It has been suggested that kidney injuries and subsequent fibrosis disrupt the oxygen delivery through vascular rarefactions and the excessive accumulation of extracellular matrix.2–4 Tissue hypoxia was assessed by the accumulation of pimonidazole, which forms adducts in hypoxic cells with PO2<10 mmHg.4 UO-kidneys at day 2 of UUO exhibited marked accumulation of pimonidazole-adducted proteins compared with the contralateral kidneys and normal uninjured kidneys (Figure 2A). Oxygen supply to the UO-kidneys was also measured by using an oxygen-sensor foil VisiSens system,38 showing that the oxygen tension on the kidney surface was significantly decreased at 30 minutes after UUO (Figure 2B).
Figure 2.
Kidney injury augments the hypoxic milieu. (A) Pimonidazole immunoblotting of whole kidney lysates. Pimonidazole-conjugated proteins were more abundantly accumulated in the injured kidneys by ureteral obstruction (UO) for 2 days than in the contralateral (Cont) or normal kidneys. α-Tubulin was used as a loading control. (B) Surface oxygen tension of UO-kidneys. Note that kidney surface oxygen tensions were reduced rapidly by UO. Green color indicates higher oxygen concentration than orange. (C) Pimonidazole immunoblotting of whole kidney lysates from ISAM (EpoGFP/GFP::TgEpo3′) and control littermates (EpoGFP/wt::TgEpo3′). Pimonidazole-conjugated proteins were accumulated in the kidney of ISAM due to the anemia, and the accumulation was enhanced by UO for 2 days compared with the contralateral kidneys (Cont). Labels #1 and #2 indicate different samples. α-Tubulin was used as a loading control. (D) Pimonidazole immunostaining of kidney sections. Hypoxic areas (brown, positive for pimonidazole adducts) of the ISAM kidney were widely spread throughout the cortical area after UO for 2 days (UO-kidney, right panels). Scale bar, 200 μm. (E) Mitochondrial membrane potential in injured kidneys of ISAM. TMRM, an indicator of mitochondrial membrane potential, was injected at each time indicated in the panels, and the fluorescent intensity (pseudo color) was measured by two-photon microscopy. The TMRM fluorescence in the tubular epithelial cells was high (orange to white) before obstruction (Pre), and the signals were decreased (dark blue to black) 4 hours after obstruction. Scale bar, 50 μm.
We then investigated the effects of injury in the setting of chronic hypoxia/anemia by utilizing ISAM, as a model of chronic anemia.14,17 ISAM kidneys showed marked accumulation of pimonidazole-conjugated proteins compared with the control littermate kidneys (Figure 2C). In ISAM kidneys, cortical pimonidazole immunoreactivity was observed, indicating that the hypoxic area was widespread in the ISAM kidneys (Figure 2D), in contrast to the selective medullary hypoxia observed in control littermate kidneys.14,17 The pimonidazole immunoreactivity was enhanced by ureteral obstruction-induced injury (Figure 2, C and D), indicating deterioration of the hypoxic milieu in the UO-kidneys.
To determine the functional consequence of injury superimposed on anemia, we utilized in vivo live imaging and measured mitochondrial membrane potentials using tetramethylrhodamine methyl ester (TMRM) in ISAM kidneys. TMRM was rapidly distributed in the mitochondria of tubular cells (Supplemental Figure 1) and showed bright fluorescence (Figure 2E). The fluorescent intensity of TMRM was markedly decreased at 4 hours after UUO. These results indicate that mitochondrial activity of UO-kidneys was severely damaged, confirming the notion that oxygen availability in injured kidneys is compromised.2,4,34,39
Disrupted Hypoxic Response in Injured Kidneys
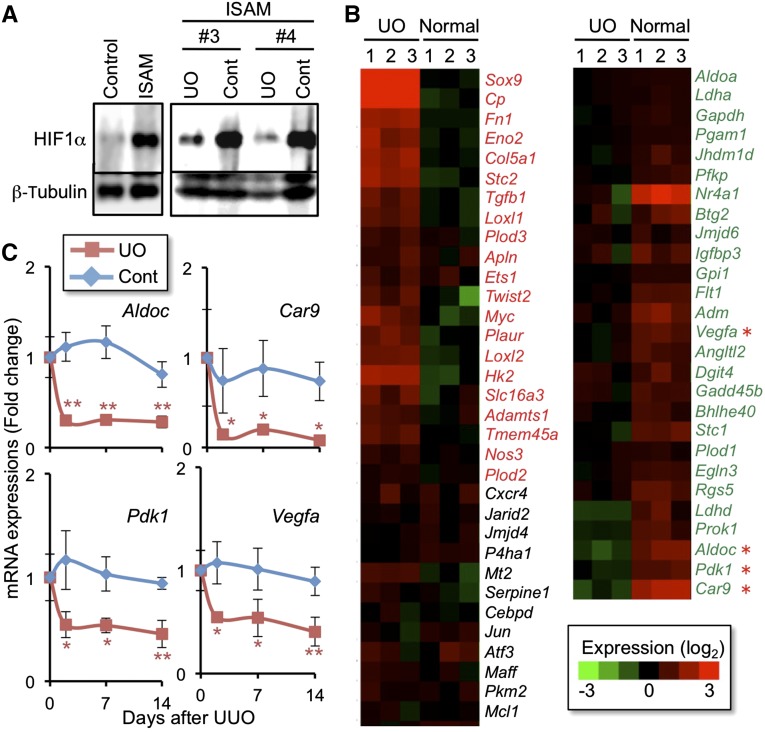
In order to examine the hypoxia response of the injured kidneys superimposed on anemia, we then explored the HIF-mediated hypoxia response using ISAM kidneys with UUO. While control ISAM kidneys showed a robust accumulation of HIF1α proteins compared with the kidneys of the control littermates, the level of HIF1α accumulation was reduced in the injured kidneys at 2 days after UUO despite the worsening hypoxia (Figure 3A). This result suggests that the kidney injuries disturb the hypoxia-responsive pathway.
Figure 3.
Hypoxic response is insufficient in injured kidneys. (A) HIF1α immunoblotting of whole kidney lysates from ISAM and the control littermates (EpoGFP/wt::TgEpo3′ genotype). HIF1α protein was accumulated in the kidney of ISAM due to the anemia, and the accumulation was reduced by ureteral obstruction for 2 days (UUO) compared with the contralateral kidneys (Cont). Labels #3 and #4 indicate different individual ISAM. β-Tubulin was used as a loading control. HIF2α was undetectable due to the technical difficulties. (B) Heat map diagram showing the changes of HIF-target gene expressions in the obstructed (UO-kidney) and normal kidneys of ISAM (from the microarray analyses; n=3). Red and green letters indicate genes upregulated and downregulated by UUO, respectively. (C) RT-qPCR analyses of the HIF target gene expressions in the obstructed (UO) and contralateral (Cont) kidneys of UUO-treated ISAM. The expression levels of the indicated genes (red asterisks in B) were measured 2, 7, and 14 days after UUO. Data from the sham-treated group were used as the starting point (0 day) and set as 1 (mean±SD). *P<0.05, **P<0.01 compared with the sham-treated group (n=3–5; one-way ANOVA with Tukey–Kramer test for multiple comparisons).
To explore the consequences of defects in the hypoxia-responsive HIF accumulation, the mRNA levels of HIF target genes, which were identified based on the literature,25,27,40,41 were examined using our previous microarray data from injured and normal ISAM kidneys.17 Of the 67 HIF target genes identified a priori, 21 were upregulated more than 1.5-fold by ureteral obstruction for 2 days, whereas 28 were downregulated more than 1.5-fold (Figure 3B). The remaining 18 genes were unchanged. Similar to the case of the Epo-GFP gene, the indicator of the endogenous Epo-gene activity,17 the HIF target genes, such as Aldoc, Pdk1, Car9, and Vegfa, were continuously repressed by the ureteral obstruction-induced injury throughout the 2-week experimental period (Figure 3C, Supplemental Figure 2). These results demonstrate that HIF signaling in the kidneys is deteriorated upon injuries and becomes insufficient to support the hypoxic response.
Selective Deletion of PHD Isoforms in REPs Causes Polycythemia
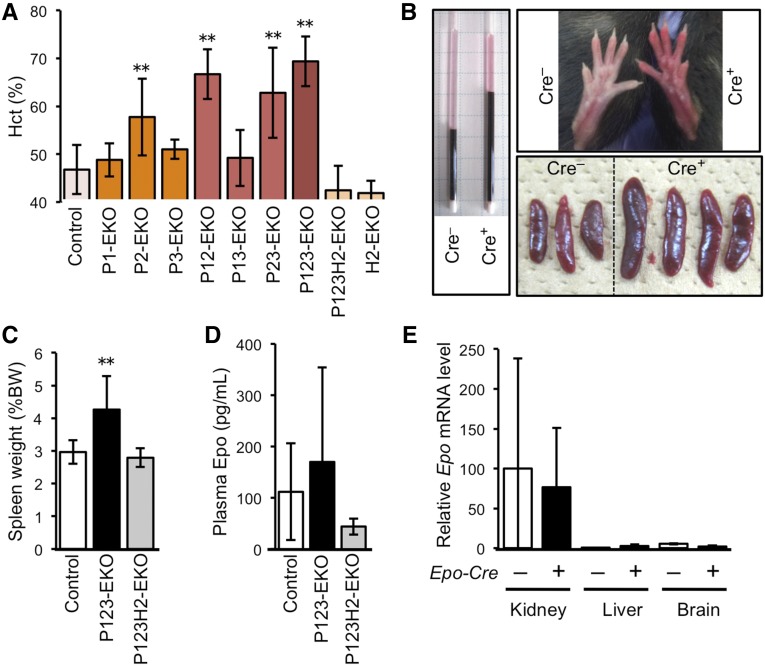
We further investigated the functional roles of the hypoxia-responsive pathway in REPs by using genetically modified mouse lines. We deleted genes for PHDs and/or HIF2α selectively in Epo-producing cells by using the Epo-Cre transgene (herein referred to as Epo-Cre-mediated knockout (EKO) mice).14,17 The Epo-Cre mice were crossbred with mice bearing conditional knockout alleles of Egln1, Egln2, Egln3, and Epas1 (encoding PHD2, PHD1, PHD3, and HIF2α; Supplemental Figure 3). A single knockout of Egln1 (P2-EKO) or the combined deletion of Egln1 and other genes for PHDs in Epo-producing cells (P12-EKO, P23-EKO, and P123-EKO) resulted in polycythemia (Figure 4A). In contrast, combined deletion of PHD1 and PHD3 (P13-EKO) did not give rise to polycythemia.
Figure 4.
Deficiency of PHDs in Epo-producing cells leads to polycythemia. (A) Hct levels of mice harboring Epo-producing cell-specific deletion of the genes for PHD1, PHD2, PHD3, and/or HIF2α. Mice in which the Egln1 gene (encoding PHD2) was deleted in Epo-producing cells (P2-, P12-, P23-, P123-EKO) exhibited higher Hct levels than their control littermate mice (**P<0.01; n=4–17 for each genotype), and the polycythemic phenotype was abolished by deletion of the Epas1 gene (encoding HIF2α) in Epo-producing cells (P123H2-EKO). (B) Gross view of P123-EKO (Cre+) and the control (Cre–) littermate mice. Red cell mass (Hct) is shown in capillaries after centrifugation of the peripheral blood (left panel). P123-EKO mice exhibited red hind limbs (upper right panel) and larger spleens (lower right panel) compared with those of the control mice. (C–E) Spleen weight (C), plasma Epo levels (D), and Epo mRNA levels by RT-qPCR (E) were measured in the indicated genotype mice. Data from the contralateral kidneys of control mice were set as 100 in (E). *P<0.05, **P<0.01 compared with the Cre– controls (mean±SD, n=4–21 in each group; one-way ANOVA with Tukey–Kramer test for multiple comparisons).
The increased hematocrit level (Hct) and size of spleens in the PHD-deficient mice (Figure 4B) were completely counteracted by the concomitant deletion of the Epas1 gene (P123H2-EKO in Figure 4, A and C), demonstrating the functional dependence on HIF2α in these phenotypes. Surprisingly, the plasma Epo levels in P123-EKO mice were not significantly different from the control littermates (Figure 4D), suggesting that the sustained unregulated secretion of Epo, which was not repressed by the increased Hct, is responsible for the observed polycythemia (Figure 4, A–D).
There are two major Epo-producing organs, kidney and liver. Additionally, brain also produces Epo to some extent.13–15,28 Of these organs, kidney was the major source of Epo in the P123-EKO model (Figure 4E). Whereas it has been reported that Epo synthesis was activated in hepatocytes23,42,43 and glial cells44 by the deletion of PHDs or pVHL, we did not observe a marked elevation of Epo synthesis in the liver and brain of P123-EKO mice. This observation may be explained by the low efficiency of the PHD deletions in these cells, as the expression levels of the Epo-Cre transgene were lower in these cells than in REPs (Supplemental Figure 4).
Epo-gene Expression in Injured Kidneys Is Restored by The Loss of PHDs
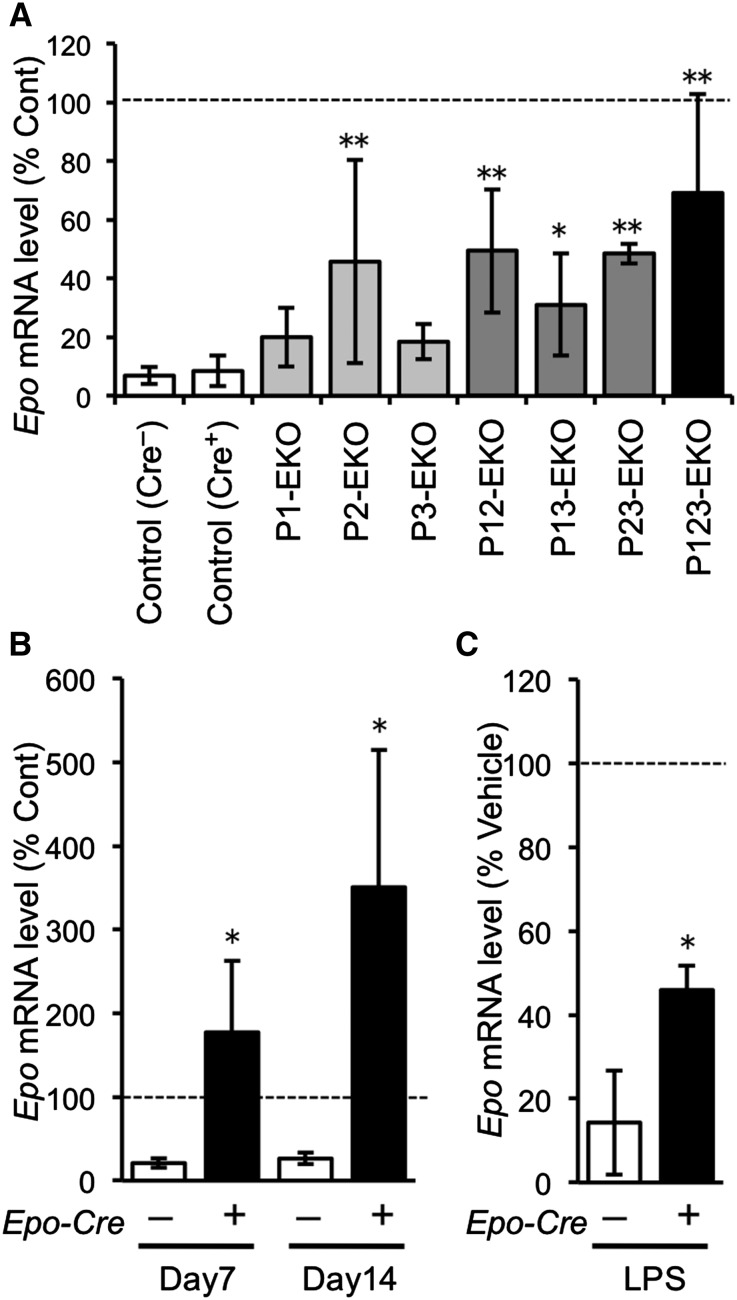
To define the role of each PHD upon kidney injury in vivo, we applied UUO to PHD-EKO mice. In control littermates, the ureteral obstruction-induced injury repressed Epo mRNA expression to less than 10% of the contralateral uninjured kidneys at 2 days after UUO (Figure 5A). Notably, the UO-kidneys with deletion of the Egln1 gene alone (P2-EKO) and in combination with Egln2 and/or Egln3 (P12-EKO, P23-EKO, and P123-EKO) showed higher Epo mRNA levels than the UO-kidneys of control mice, indicating that PHD2-deficiency protected Epo production in damaged REPs. The UO-kidneys of P123-EKO mice showed the highest Epo mRNA levels (Figure 5A), but the protective effects of PHD deletions were not additive, suggesting that each PHD might perform redundant functions in diseased REPs. Importantly, the combined deficiency of PHD1 and PHD3 in REPs, which did not provoke polycythemia, showed a similar level of resistance to Epo repression compared with P2-EKO mice (Figure 5A).
Figure 5.
PHD deficiency confers resistance to the loss of Epo-producing potential of REPs in injured kidneys. (A) RT-qPCR analyses of the Epo gene in kidneys of the indicated genotype mice at 2 days after UUO. Percentages of Epo mRNA levels in the obstructed kidneys compared with the contralateral kidneys (Cont) were calculated in each mouse after normalization with rRNA expression levels, and are shown as the mean±SD (n=4–8 in each group). *P<0.05, **P<0.01 compared with the control (Cre–) group (one-way ANOVA with Tukey–Kramer test for multiple comparisons). (B) High-level Epo mRNA expression in UO-kidneys of P123-EKO in later stages of fibrosis (UUO for 7 and 14 days). Epo mRNA levels were higher in the injured kidneys than in the contralateral healthy kidneys (Cont) in P123-EKO mice (Cre+). Data presentation is the same as described in (A). *P<0.05 compared with Cre– group (n=3–4 in each group). (C) Epo mRNA expressions of PHD-deficient kidneys (Cre+) underwent LPS challenge for 6 hours. Epo mRNA levels were analyzed by RT-qPCR. Declines of Epo mRNA level were compared with the vehicle-treated groups and shown as the mean±SD. *P<0.05 compared with the Cre– group (n=4, unpaired t test).
Next, we examined the effect of PHD deficiency on later stages of kidney injury. The Epo-gene expression in the UO-kidneys in the control mice was reduced to almost 20% of the contralateral kidneys at 7 and 14 days after UUO (Figure 5B). Surprisingly, the Epo mRNA levels in the UO-kidneys of P123-EKO mice were 2- and 4-fold higher than in the contralateral kidneys at 7 and 14 days after UUO, respectively (Figure 5B). This overactive Epo synthesis in fibrotic kidneys might be due to the proliferation of myofibroblast-transformed REPs with preserved Epo-producing potentials and the enrichment of these cells by the reduction of tubular cells (Supplemental Figure 5).17
We previously reported that LPS treatment suppresses renal Epo mRNA expressions through activation of inflammatory signaling.17 Whereas the Epo-gene expression was reduced to 14% at 6 hours after LPS injection in the control genotype mice, the Epo-gene expression in P123-EKO mice was only reduced to 46%, protected from the LPS-mediated suppression (Figure 5C).
The PHD-deficient MF-REPs Synthesize Epo
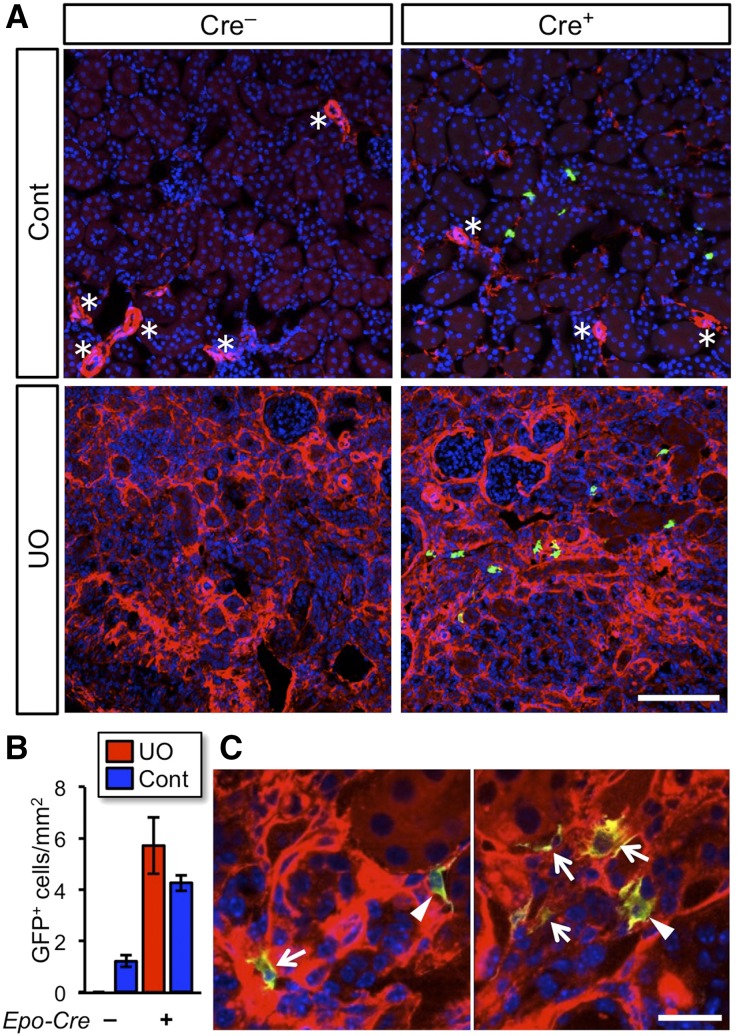
To validate the notion that the PHD-deficient MF-REPs synthesize Epo, we generated EpoGFP/wtP123-EKO mice by crossbreeding P123-EKO mice with EpoGFP/wt mice. In control EpoGFP/wt mice (Cre–; Figure 6A), UUO for 14 days destructed renal structure and completely abolished GFP expression. However, GFP+ cells were observed in the UO-kidneys of EpoGFP/wtP123-EKO mice (Cre+; Figure 6, A and B).
Figure 6.
Activation of the Epo-gene transcription in PHD-deficient myofibroblasts. (A) Immunohistochemical detection of Epo-gene expressing cells in kidneys of EpoGFP/wt P123-EKO (Cre+; Egln2f/f::Egln1f/f::Egln3f/f::EpoGFP/wt::TgEpo-Cre genotype) and control (Cre–; Egln2f/f::Egln1f/f::Egln3f/f::EpoGFP/wt genotype) mice at 14 days after UUO. Frozen sections of the obstructed (UO) and contralateral (Cont) kidneys were stained with GFP (green: indicating transcriptional activity of the Epo-gene locus) and αSMA (red: marker for vascular smooth muscle cells [*] and myofibroblasts) antibodies, followed by 4',6-diamidino-2-phenylindole nuclear staining (blue). Original magnifications, x20. (B) Quantification of the number of Epo-GFP-positive cells in kidney sections. Data show mean±SD (n=3 in each genotype). Original magnifications, x100. (C) Higher magnification of A. GFP+ cells are present in the injured kidney of EpoGFP/wtP123-EKO mice and express αSMA at high (arrows) or low (arrowheads) levels. Scale bars, 100 μm in (A) and 20 μm in (B).
Interestingly, the GFP+ cells expressed α-smooth muscle actin (αSMA), a myofibroblast marker, in different expression levels in UO-kidneys of EpoGFP/wtP123-EKO mice (Figure 6C). This observation indicates that the Epo synthesis is maintained in both fully myofibroblast-transformed and myofibroblast-transitioning REPs with PHD deficiency. These data clearly demonstrate that the Epo-gene expression is restored by PHD deficiency in MF-REPs.
REP-specific Deletion of PHDs Does Not Affect Progression of Renal Fibrosis
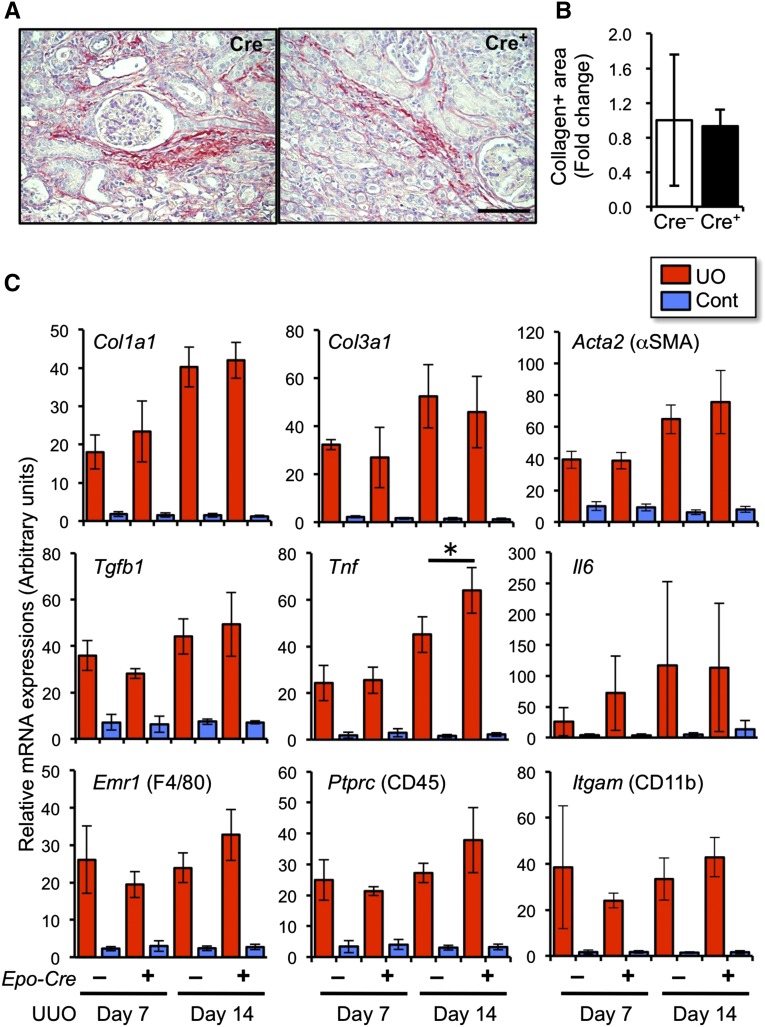
To determine the effects of REP-specific deficiency of PHDs on renal fibrosis, we evaluated the collagen accumulation in injured kidneys. Picrosirius-red staining showed a similar level of accumulated collagens in the kidneys of P123-EKO mice to the levels in the controls upon UUO for 14 days (Figure 7, A and B). The mRNA expression levels of genes for collagen (Col1a1 and Col3a1), αSMA (encoded by Acta2), and fibrogenic and inflammatory cytokines (Tgfb1, Tnfa, and Il6) were not affected by the PHD deficiency on day 7 and day 14 of UUO (Figure 7C). Furthermore, the expression levels of cellular markers for infiltrating leukocytes (F4/80, CD45, and CD11b) were also in similar levels (Figure 7C). These results indicate that the activation of hypoxia signal selectively in REPs restores the Epo-gene expression, but does not affect pathologic fibrogenic and inflammatory responses.
Figure 7.
Renal inflammatory and fibrogenic response are not affected by PHD deficiency in REPs. (A) Picrosirius-red staining of the kidneys from P123-EKO (Cre+) and littermate control (Cre–) mice at 14 days after UUO. Note that collagen accumulation is stained in red. Scale bar, 100 μm. (B) Quantification of picrosirius-red positive area of (A). Data from the Cre– kidneys were set as 1 (mean±SD, n=3 in each group). (C) Expression profiles of fibrosis- and inflammation-related genes in the kidneys from P123-EKO (Cre+) and the littermate control (Cre–) mice upon UUO for 7 and 14 days. Data (mean±SD, 3 or 4 mice in each group) from RT-qPCR analyses were normalized with rRNA expression levels. *P<0.05 compared with the Cre– group (one-way ANOVA with Tukey–Kramer test for multiple comparisons).
Discussion
REPs are the major Epo-producing cells in adults, maintaining tissue oxygen homeostasis by supporting erythropoiesis. In disease, REPs become the major source of myofibroblasts, contributing to a final common pathway of CKD, i.e., renal fibrosis.17 Although REPs lose their Epo-producing ability by myofibroblastic transformation, injured REPs recover their original features, including Epo production, after resolution of the fibrogenic inflammatory stimuli.17 These findings led us to hypothesize that the signals evoked in fibrogenic milieu inhibit transcriptional activation of the Epo gene in MF-REPs. Here we demonstrate that the regulatory system for the hypoxia-inducible genes is impaired in injured kidneys despite their severe hypoxic milieu, leading to insufficient HIF-mediated cellular responses. Deletion of the PHD isoforms in REPs results in the reactivation of the Epo-gene expression in MF-REPs. Moreover, the analyses of compound conditional knockout mice show that the PHD2-HIF2α axis is the major regulatory cascade for hypoxia-inducible Epo-gene expression in REPs, in both health and disease.
We have analyzed the physiologic role of PHD isoforms in REPs using REP-specific PHD knockout mice. Consistent with the systemic knockout studies,29,31 the single and combinatorial PHD2 deletion leads to uncontrolled Epo-gene expression and results in polycythemia, which is abolished by HIF2α deficiency. This observation indicates that HIF2α, but not HIF1α, is the major transcriptional activator of the Epo gene in REPs and that PHD2, rather than the other PHD isoforms, mainly catalyzes oxygen-dependent hydroxylation of HIF2α proteins. Indeed, the expression level of HIF2α is higher in REPs than the other kidney cells, whereas HIF1α is expressed primarily in tubular cells.15,45 This specific PHD usage for the Epo-gene regulation in REPs is unique compared with the situation in hepatocytes in which PHD1 and PHD3 are as important as PHD2, thereby requiring the deletion of all PHDs to induce uncontrolled HIF2α-mediated polycythemia.29–31,46
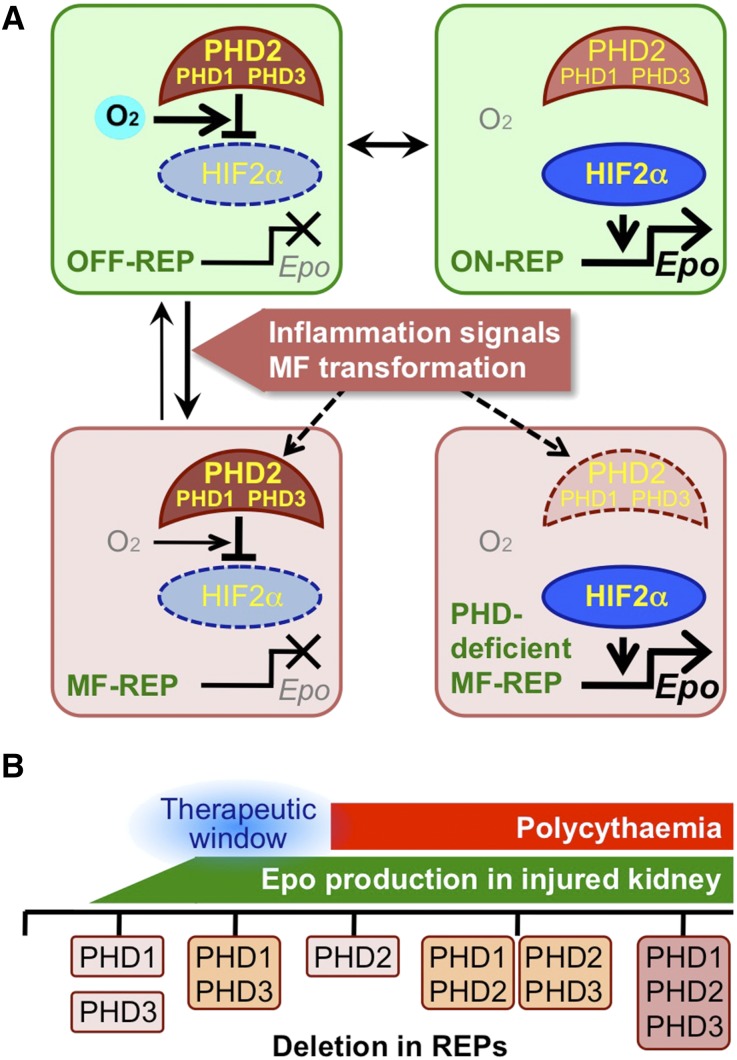
Epo-deficiency anemia is a most frequently observed complication of CKD. We have shown that the loss of the Epo-producing ability of MF-REPs is a critical component of its pathogenesis.17,18 However, the roles of PHDs and HIFs for the regulation of Epo gene in MF-REPs have been poorly understood. Through the analyses of conditional PHD knockout mice lines, we show that that the loss of PHDs in REPs reactivates Epo-gene expression in MF-REPs, suggesting that inflammatory and/or fibrogenic signals suppress HIFs through the overactivation of PHDs even under pathologic hypoxic conditions (Figure 8A).
Figure 8.
Augmentation of HIF signaling restores the Epo-producing ability of renal myofibroblasts. (A) Schematic model of the Epo-gene regulation in REPs. Expression of the Epo gene is mainly regulated by the PHD2-HIF2α axis in REPs. Epo-gene transcription is inactive under normal oxygen (O2) conditions (OFF-REP). In REPs sensing hypoxia (ON-REP), oxygen-dependent PHD activity is blocked; thereby HIF2α is stabilized for activation of the Epo-gene transcription. Kidney injuries induce myofibroblastic transformation of REPs through the activation of inflammatory and fibrogenic signals17 and inactivate HIF2α through PHDs in spite of their worsened hypoxic milieus. Therefore, the inactivation of PHDs in MF-REPs leads to reactivation of Epo-gene expression. (B) Summary of the results from deletion of genes for PHD isoforms in REPs. This study proposes a therapeutic window (blue, around double deletion of PHD1 and PHD3) for inducing Epo production from diseased kidneys without polycythemic complications caused by PHD2 deletion.
To test this hypothesis, we have assessed the renal Epo-gene expression of P123-EKO mice under LPS-induced inflammation. The PHD deletion in REPs attenuates the LPS-induced Epo-gene suppression, indicating that inflammatory signaling accelerates PHD-mediated HIF degradation. Although the mechanism underlying how PHDs inactivate HIFs in hypoxic MF-REPs needs future studies, we propose that Epo expression in MF-REPs is regulated by the activity of PHDs in the balance of hypoxia-induced inhibition and inflammation-induced activation. Tipping the balance toward HIF activation through inactivation of PHDs in MF-REPs is important for maintaining or reactivating Epo synthesis in diseased kidneys.
Strategies to treat kidney diseases by augmenting HIF signaling have been rigorously studied using both genetic and pharmacological tools. The activation of HIF signaling in different kidney cell types produces different consequences for renal inflammation and fibrosis.3 The deletion of the gene for pVHL in podocytes47 and proximal tubular cells48 result in worsening kidney disease, whereas deletions in myeloid cells, endothelial cells, and the whole body improve renal inflammation and fibrosis.49,50 Our results show that HIF activation in anemic injured kidneys is insufficient, thereby augmenting HIF signaling is an attractive therapeutic strategy. However, overactivation of HIFs has been raised a concern regarding undesired complications.31,35,51 Therefore, identifying the most appropriate way to re-activate HIF-signaling is urgently needed.
To this end, we compared the effects of the loss of each PHD isoform in REPs in diseased and healthy kidneys, and found that mice with a combined deficiency of PHD1 and PHD3 in REPs exhibited resistance to Epo repression in the event of renal injury, but did not exhibit polycythemia. We propose that inhibitors that selectively target PHD1 and PHD3 are attractive for further drug development, as they would minimize the complications of overactive HIF signaling (Figure 8B). Indeed, PHD1 and PHD3 have been in the spotlight as target molecules for protecting other organs (e.g., liver52 and muscle,53 and so on) without polycythemic effects, which supports our findings.
In summary, we show that attenuated HIF signaling in myofibroblast-transformed REPs is a major cause of renal anemia. Augmentation of HIF signaling by inhibiting PHDs is an attractive therapeutic strategy for renal anemia and for halting the vicious cycle of cardio-renal anemia syndrome by re-activating Epo synthesis from damaged and transformed REPs.
Concise Methods
Mice
Mice were maintained in a specific pathogen-free facility. All experimental procedures have been approved by the Animal Care Committee at Tohoku University. Mice bearing Epo-producing cell-specific knockout alleles of genes for PHDs and HIF2α were generated by breeding Epo-Cre (TgEpo-Cre) mice (see Supplemental Figure 6 explaining the expression profile of the Epo-Cre transgene)14,17 with conditional knockout mice of Egln1, Egln2, Egln3, and Epas1 genes (encoding PHD2, PHD1, PHD3, and HIF2α, respectively; see Supplemental Figure 3).29,46 EpoGFP/wt mice and ISAM (EpoGFP/GFP::TgEpo3′ genotype) established in house were also used.14,17 Rosa26R-STOP-tdTomato (R26T) mice and Alb-Cre transgenic mice were obtained from The Jackson Laboratory (Stock no. 007980 and 003574, respectively; Bar Harbor, ME).54,55 The mouse genotypes were determined by PCR of tail DNA with the primers listed in Supplemental Table 1. Littermate mice with a mixed genetic background were used for comparisons in the analyses.
Surface Tissue PO2 Measurement
Mice were anesthetized with pentobarbital, and the left kidney was exposed. Then, the kidney was covered by the oxygen sensor foil (PreSens GmbH, Regensburg, Germany), and the surface oxygen tension was measured by a Visisens A1 detector camera with imaging software (PreSens GmbH).
Pimonidazole Treatment
To detect hypoxic areas, mice were intraperitonealy injected with 60-mg/kg pimonidazole (Hypoxyprobe Inc., Burlington, MA) and sacrificed 1 hour after the injection. Kidneys were used for immunoblotting and immunohistochemistry. The rabbit polyclonal antibody (for immunoblotting) and the FITC-conjugated mouse monoclonal antibody (for immunohistochemistry) were used.
UUO Model
UUO model was generated as we previously described.17 The left ureter was exposed by a flank incision and ligated. To evaluate the Epo-producing potential, the Epo mRNA expressions were quantified in comparison with those of the contralateral (Cont) kidney, which was used to normalize individual differences of Hct levels. Sham operation was performed in the same way except for ligating the ureter.
LPS Treatment
Mice were intraperitonealy injected with 0.1-μg/g body wt LPS (Sigma-Aldrich, St. Louis, MO).17 At six hours after single injection, mice were sacrificed and their kidneys were harvested for RNA isolation. The vehicle-treatment group was used as controls.
Western Blotting
Whole kidney lysates were prepared and transferred to PVDF (polyvinylidene fluoride) membranes after SDS-PAGE. The membranes were immunoblotted with antibodies against HIF1α (Abnova, Taipei, Taiwan), HIF2α (LSBio, Seattle, WA), pimonidazole (Hypoxyprobe, Inc.), α-Tubulin (Sigma-Aldrich, St. Louis, MO), and β-Tubulin (Sigma-Aldrich). To detect signals, horseradish peroxidase-conjugated secondary antibody against rabbit (Dako, Glostrup, Denmark) or goat immunoglobulins (Santa Cruz Biotechnology, Dallas, TX) were used with chemiluminescence staining reagents (GE Healthcare, Little Chalfont, UK).
Real-time PCR Analysis
Isogen (Nippongene, Tokyo, Japan) was used to prepare total RNA. Total RNA (3 μg) was used for reverse transcription using random hexamers and Superscript III polymerase kit (Invitrogen, Waltham, MA). Real-time PCR was then performed with the primers listed in Supplemental Table 1. Gene expression levels were calculated based on the threshold cycle (Ct) values and the efficiency of each primer set, and expressed as relative to 18S rRNA.
Tissue Preparation for Histologic Analysis
To prepare frozen sections, tissues were fixed with 4% paraformaldehyde for 2 hours, washed with 20% sucrose in PBS overnight, and then embedded in OCT compound (Sakura FineTek, Tokyo, Japan). Tissues for paraffin-embedded sections were fixed with 4% paraformaldehyde for 48 hours. Interstitial fibrosis was evaluated by Picrosirius-red staining (Polysciences, Warrington, PA), and the collagen-positive areas were quantified using ImageJ software.
Immunohistochemistry
10-μm frozen sections or 3-μm paraffin sections were used. Paraffin-embedded samples were antigen unmasked by target retrieval solution (Dako; pH 6.0). Sections were blocked and incubated with primary antibodies against FITC-conjugated αSMA (Sigma-Aldrich) or pimonidazole (Hypoxisense, Hypoxyprobe-1 plus kit; Hypoxyprobe, Inc.). Nuclei were stained by 4',6-diamidino-2-phenylindole for fluorescent detection. Fluorescent images were obtained using an LSM510 confocal imaging system (Carl Zeiss, Jena, Germany). For pimonidazole staining, signals were obtained using diaminobenzidine solution (DAB, Dako), and sections were counter stained by hematoxylin.
Live Imaging Using Two-Photon Microscopy
Real-time live imaging of ISAM kidneys was performed through two-photon microscopy using a Leica TCS SP5 multiphoton confocal fluorescence imaging system.56 Briefly, mice were anesthetized with ketamine and xylazine, and the left kidneys were exteriorized and placed on the microscope stage. TMRM (5 μg/kg) and rhodamine B-conjugated 70-kD dextran (for visualizing blood flow) were injected through the jugular vein, and the signal was measured immediately after the each dye injection (0, 1, and 4 hours after UUO; see Supplemental Figure 1). The direction of major processes of more than five REPs were counted in each three-dimensional field.
Statistical Analyses
Data were expressed as mean±SD. Comparisons between groups were performed using one-way ANOVA or an unpaired Student’s t test as appropriate. For multiple comparisons, the Tukey–Kramer test was used. Data were considered statistically significant at P<0.05.
Disclosures
Authors declare no conflict of interests exists in this study.
Supplementary Material
Acknowledgments
The authors thank Ms. Atsuko Konuma (Tohoku University) for technical support. We also thank Dr. Takashi Moriguchi (Tohoku University) and Drs. Davide Cina and Benjamin Thomson (Northwestern University) for the critical reading of an early manuscript. We appreciate technical support provided by the Biomedical Research Core and Centre for Laboratory Animal Research in Tohoku University. This work was supported in part by Grants in aid from MEXT/JSPS KAKENHI (grant numbers 24249015 to M.Y., 26116702 and 25670157 to N.S., 26860623 and 12J07924 to T.S.), the Inamori Foundation (to N.S.), the Takeda Science Foundation (to N.S. and M.Y.), and the Core Research for Evolutional Science and Technology from the Japan Science and Technology Agency (to M.Y.). T.S. is a Japan Society for the Promotion of Science postdoctoral fellow.
Footnotes
Published online ahead of print. Publication date available at www.jasn.org.
This article contains supplemental material online at http://jasn.asnjournals.org/lookup/suppl/doi:10.1681/ASN.2014121184/-/DCSupplemental.
References
- 1.Quaggin SE, Kapus A: Scar wars: mapping the fate of epithelial-mesenchymal-myofibroblast transition. Kidney Int 80: 41–50, 2011 [DOI] [PubMed] [Google Scholar]
- 2.Nangaku M: Chronic hypoxia and tubulointerstitial injury: a final common pathway to end-stage renal failure. J Am Soc Nephrol 17: 17–25, 2006 [DOI] [PubMed] [Google Scholar]
- 3.Haase VH: Hypoxia-inducible factor signaling in the development of kidney fibrosis. Fibrogenesis Tissue Repair 5[Suppl 1 Proceedings of Fibroproliferative disorders: from biochemical analysis to targeted therapiesPetro E Petrides and David Brenner]: S16, 2012 [DOI] [PMC free article] [PubMed] [Google Scholar]
- 4.Nangaku M, Rosenberger C, Heyman SN, Eckardt KU: Regulation of hypoxia-inducible factor in kidney disease. Clin Exp Pharmacol Physiol 40: 148–157, 2013 [DOI] [PubMed] [Google Scholar]
- 5.Koury MJ: Abnormal erythropoiesis and the pathophysiology of chronic anemia. Blood Rev 28: 49–66, 2014 [DOI] [PubMed] [Google Scholar]
- 6.Silverberg DS, Wexler D, Blum M, Schwartz D, Wollman Y, Iaina A: Erythropoietin should be part of congestive heart failure management. Kidney Int Suppl 87: S40–S47, 2003 [DOI] [PubMed] [Google Scholar]
- 7.Ronco C, Haapio M, House AA, Anavekar N, Bellomo R: Cardiorenal syndrome. J Am Coll Cardiol 52: 1527–1539, 2008 [DOI] [PubMed] [Google Scholar]
- 8.Risdon RA, Sloper JC, De Wardener HE: Relationship between renal function and histological changes found in renal-biopsy specimens from patients with persistent glomerular nephritis. Lancet 2: 363–366, 1968 [DOI] [PubMed] [Google Scholar]
- 9.D’Amico G: Tubulointerstitium as predictor of progression of glomerular diseases. Nephron 83: 289–295, 1999 [DOI] [PubMed] [Google Scholar]
- 10.Kriz W, Kaissling B, Le Hir M: Epithelial-mesenchymal transition (EMT) in kidney fibrosis: fact or fantasy? J Clin Invest 121: 468–474, 2011 [DOI] [PMC free article] [PubMed] [Google Scholar]
- 11.Boor P, Floege J: The renal (myo-)fibroblast: a heterogeneous group of cells. Nephrol Dial Transplant 27: 3027–3036, 2012 [DOI] [PubMed] [Google Scholar]
- 12.Maxwell PH, Osmond MK, Pugh CW, Heryet A, Nicholls LG, Tan CC, Doe BG, Ferguson DJP, Johnson MH, Ratcliffe PJ: Identification of the renal erythropoietin-producing cells using transgenic mice. Kidney Int 44: 1149–1162, 1993 [DOI] [PubMed] [Google Scholar]
- 13.Obara N, Suzuki N, Kim K, Nagasawa T, Imagawa S, Yamamoto M: Repression via the GATA box is essential for tissue-specific erythropoietin gene expression. Blood 111: 5223–5232, 2008 [DOI] [PubMed] [Google Scholar]
- 14.Yamazaki S, Souma T, Hirano I, Pan X, Minegishi N, Suzuki N, Yamamoto M: A mouse model of adult-onset anaemia due to erythropoietin deficiency. Nat Commun 4: 1950, 2013 [DOI] [PubMed] [Google Scholar]
- 15.Pan X, Suzuki N, Hirano I, Yamazaki S, Minegishi N, Yamamoto M: Isolation and characterization of renal erythropoietin-producing cells from genetically produced anemia mice. PLoS ONE 6: e25839, 2011 [DOI] [PMC free article] [PubMed] [Google Scholar]
- 16.Suzuki N, Obara N, Yamamoto M: Use of gene-manipulated mice in the study of erythropoietin gene expression. Methods Enzymol 435: 157–177, 2007 [DOI] [PubMed] [Google Scholar]
- 17.Souma T, Yamazaki S, Moriguchi T, Suzuki N, Hirano I, Pan X, Minegishi N, Abe M, Kiyomoto H, Ito S, Yamamoto M: Plasticity of renal erythropoietin-producing cells governs fibrosis. J Am Soc Nephrol 24: 1599–1616, 2013 [DOI] [PMC free article] [PubMed] [Google Scholar]
- 18.Asada N, Takase M, Nakamura J, Oguchi A, Asada M, Suzuki N, Yamamura K, Nagoshi N, Shibata S, Rao TN, Fehling HJ, Fukatsu A, Minegishi N, Kita T, Kimura T, Okano H, Yamamoto M, Yanagita M: Dysfunction of fibroblasts of extrarenal origin underlies renal fibrosis and renal anemia in mice. J Clin Invest 121: 3981–3990, 2011 [DOI] [PMC free article] [PubMed] [Google Scholar]
- 19.LeBleu VS, Taduri G, O’Connell J, Teng Y, Cooke VG, Woda C, Sugimoto H, Kalluri R: Origin and function of myofibroblasts in kidney fibrosis. Nat Med 19: 1047–1053, 2013 [DOI] [PMC free article] [PubMed] [Google Scholar]
- 20.Humphreys BD, Lin SL, Kobayashi A, Hudson TE, Nowlin BT, Bonventre JV, Valerius MT, McMahon AP, Duffield JS: Fate tracing reveals the pericyte and not epithelial origin of myofibroblasts in kidney fibrosis. Am J Pathol 176: 85–97, 2010 [DOI] [PMC free article] [PubMed] [Google Scholar]
- 21.Maxwell PH, Ferguson DJ, Nicholls LG, Johnson MH, Ratcliffe PJ: The interstitial response to renal injury: fibroblast-like cells show phenotypic changes and have reduced potential for erythropoietin gene expression. Kidney Int 52: 715–724, 1997 [DOI] [PubMed] [Google Scholar]
- 22.Haase VH: Hypoxic regulation of erythropoiesis and iron metabolism. Am J Physiol Renal Physiol 299: F1–F13, 2010 [DOI] [PMC free article] [PubMed] [Google Scholar]
- 23.Kim WY, Safran M, Buckley MR, Ebert BL, Glickman J, Bosenberg M, Regan M, Kaelin WG, Jr: Failure to prolyl hydroxylate hypoxia-inducible factor alpha phenocopies VHL inactivation in vivo. EMBO J 25: 4650–4662, 2006 [DOI] [PMC free article] [PubMed] [Google Scholar]
- 24.Ratcliffe PJ: Oxygen sensing and hypoxia signalling pathways in animals: the implications of physiology for cancer. J Physiol 591: 2027–2042, 2013 [DOI] [PMC free article] [PubMed] [Google Scholar]
- 25.Semenza GL: Oxygen homeostasis. Wiley Interdiscip Rev Syst Biol Med 2: 336–361, 2010 [DOI] [PubMed] [Google Scholar]
- 26.Semenza GL: Oxygen sensing, homeostasis, and disease. N Engl J Med 365: 537–547, 2011 [DOI] [PubMed] [Google Scholar]
- 27.Semenza GL: Hydroxylation of HIF-1: oxygen sensing at the molecular level. Physiology (Bethesda) 19: 176–182, 2004 [DOI] [PubMed] [Google Scholar]
- 28.Suzuki N, Obara N, Pan X, Watanabe M, Jishage K, Minegishi N, Yamamoto M: Specific contribution of the erythropoietin gene 3′ enhancer to hepatic erythropoiesis after late embryonic stages. Mol Cell Biol 31: 3896–3905, 2011 [DOI] [PMC free article] [PubMed] [Google Scholar]
- 29.Takeda K, Aguila HL, Parikh NS, Li X, Lamothe K, Duan LJ, Takeda H, Lee FS, Fong GH: Regulation of adult erythropoiesis by prolyl hydroxylase domain proteins. Blood 111: 3229–3235, 2008 [DOI] [PMC free article] [PubMed] [Google Scholar]
- 30.Gruber M, Hu CJ, Johnson RS, Brown EJ, Keith B, Simon MC: Acute postnatal ablation of Hif-2alpha results in anemia. Proc Natl Acad Sci U S A 104: 2301–2306, 2007 [DOI] [PMC free article] [PubMed] [Google Scholar]
- 31.Minamishima YA, Moslehi J, Bardeesy N, Cullen D, Bronson RT, Kaelin WG, Jr: Somatic inactivation of the PHD2 prolyl hydroxylase causes polycythemia and congestive heart failure. Blood 111: 3236–3244, 2008 [DOI] [PMC free article] [PubMed] [Google Scholar]
- 32.Koury ST, Koury MJ, Bondurant MC, Caro J, Graber SE: Quantitation of erythropoietin-producing cells in kidneys of mice by in situ hybridization: correlation with hematocrit, renal erythropoietin mRNA, and serum erythropoietin concentration. Blood 74: 645–651, 1989 [PubMed] [Google Scholar]
- 33.Koury MJ: Erythropoietin: the story of hypoxia and a finely regulated hematopoietic hormone. Exp Hematol 33: 1263–1270, 2005 [DOI] [PubMed] [Google Scholar]
- 34.Shoji K, Tanaka T, Nangaku M: Role of hypoxia in progressive chronic kidney disease and implications for therapy. Curr Opin Nephrol Hypertens 23: 161–168, 2014 [DOI] [PubMed] [Google Scholar]
- 35.Fraisl P, Aragonés J, Carmeliet P: Inhibition of oxygen sensors as a therapeutic strategy for ischaemic and inflammatory disease. Nat Rev Drug Discov 8: 139–152, 2009 [DOI] [PubMed] [Google Scholar]
- 36.Bernhardt WM, Wiesener MS, Scigalla P, Chou J, Schmieder RE, Günzler V, Eckardt KU: Inhibition of prolyl hydroxylases increases erythropoietin production in ESRD. J Am Soc Nephrol 21: 2151–2156, 2010 [DOI] [PMC free article] [PubMed] [Google Scholar]
- 37.Kramann R, Humphreys BD: Kidney pericytes: balancing regeneration and fibrosis. Semin Nephrol 34(4): 374–383, 2014 [DOI] [PMC free article] [PubMed] [Google Scholar]
- 38.Sano H, Ichioka S, Sekiya N: Influence of oxygen on wound healing dynamics: assessment in a novel wound mouse model under a variable oxygen environment. PLoS ONE 7: e50212, 2012 [DOI] [PMC free article] [PubMed] [Google Scholar]
- 39.Mimura I, Nangaku M: The suffocating kidney: tubulointerstitial hypoxia in end-stage renal disease. Nat Rev Nephrol 6: 667–678, 2010 [DOI] [PubMed] [Google Scholar]
- 40.Lendahl U, Lee KL, Yang H, Poellinger L: Generating specificity and diversity in the transcriptional response to hypoxia. Nat Rev Genet 10: 821–832, 2009 [DOI] [PubMed] [Google Scholar]
- 41.Wenger RH, Stiehl DP, Camenisch G: Integration of oxygen signaling at the consensus HRE. Sci STKE 2005: re12, 2005 [DOI] [PubMed] [Google Scholar]
- 42.Rankin EB, Biju MP, Liu Q, Unger TL, Rha J, Johnson RS, Simon MC, Keith B, Haase VH: Hypoxia-inducible factor-2 (HIF-2) regulates hepatic erythropoietin in vivo. J Clin Invest 117: 1068–1077, 2007 [DOI] [PMC free article] [PubMed] [Google Scholar]
- 43.Minamishima YA, Kaelin WG, Jr: Reactivation of hepatic EPO synthesis in mice after PHD loss. Science 329: 407, 2010 [DOI] [PMC free article] [PubMed] [Google Scholar]
- 44.Weidemann A, Kerdiles YM, Knaup KX, Rafie CA, Boutin AT, Stockmann C, Takeda N, Scadeng M, Shih AY, Haase VH, Simon MC, Kleinfeld D, Johnson RS: The glial cell response is an essential component of hypoxia-induced erythropoiesis in mice. J Clin Invest 119: 3373–3383, 2009 [DOI] [PMC free article] [PubMed] [Google Scholar]
- 45.Rosenberger C, Mandriota S, Jürgensen JS, Wiesener MS, Hörstrup JH, Frei U, Ratcliffe PJ, Maxwell PH, Bachmann S, Eckardt KU: Expression of hypoxia-inducible factor-1alpha and -2alpha in hypoxic and ischemic rat kidneys. J Am Soc Nephrol 13: 1721–1732, 2002 [DOI] [PubMed] [Google Scholar]
- 46.Takeda K, Ho VC, Takeda H, Duan LJ, Nagy A, Fong GH: Placental but not heart defects are associated with elevated hypoxia-inducible factor alpha levels in mice lacking prolyl hydroxylase domain protein 2. Mol Cell Biol 26: 8336–8346, 2006 [DOI] [PMC free article] [PubMed] [Google Scholar]
- 47.Ding M, Cui S, Li C, Jothy S, Haase V, Steer BM, Marsden PA, Pippin J, Shankland S, Rastaldi MP, Cohen CD, Kretzler M, Quaggin SE: Loss of the tumor suppressor Vhlh leads to upregulation of Cxcr4 and rapidly progressive glomerulonephritis in mice. Nat Med 12: 1081–1087, 2006 [DOI] [PubMed] [Google Scholar]
- 48.Higgins DF, Kimura K, Bernhardt WM, Shrimanker N, Akai Y, Hohenstein B, Saito Y, Johnson RS, Kretzler M, Cohen CD, Eckardt KU, Iwano M, Haase VH: Hypoxia promotes fibrogenesis in vivo via HIF-1 stimulation of epithelial-to-mesenchymal transition. J Clin Invest 117: 3810–3820, 2007 [DOI] [PMC free article] [PubMed] [Google Scholar]
- 49.Kobayashi H, Gilbert V, Liu Q, Kapitsinou PP, Unger TL, Rha J, Rivella S, Schlöndorff D, Haase VH: Myeloid cell-derived hypoxia-inducible factor attenuates inflammation in unilateral ureteral obstruction-induced kidney injury. J Immunol 188: 5106–5115, 2012 [DOI] [PMC free article] [PubMed] [Google Scholar]
- 50.Kapitsinou PP, Sano H, Michael M, Kobayashi H, Davidoff O, Bian A, Yao B, Zhang MZ, Harris RC, Duffy KJ, Erickson-Miller CL, Sutton TA, Haase VH: Endothelial HIF-2 mediates protection and recovery from ischemic kidney injury. J Clin Invest 124: 2396–2409, 2014 [DOI] [PMC free article] [PubMed] [Google Scholar]
- 51.Moslehi J, Minamishima YA, Shi J, Neuberg D, Charytan DM, Padera RF, Signoretti S, Liao R, Kaelin WG, Jr: Loss of hypoxia-inducible factor prolyl hydroxylase activity in cardiomyocytes phenocopies ischemic cardiomyopathy. Circulation 122: 1004–1016, 2010 [DOI] [PMC free article] [PubMed] [Google Scholar]
- 52.Taniguchi CM, Finger EC, Krieg AJ, Wu C, Diep AN, LaGory EL, Wei K, McGinnis LM, Yuan J, Kuo CJ, Giaccia AJ: Cross-talk between hypoxia and insulin signaling through Phd3 regulates hepatic glucose and lipid metabolism and ameliorates diabetes. Nat Med 19: 1325–1330, 2013 [DOI] [PMC free article] [PubMed] [Google Scholar]
- 53.Aragonés J, Schneider M, Van Geyte K, Fraisl P, Dresselaers T, Mazzone M, Dirkx R, Zacchigna S, Lemieux H, Jeoung NH, Lambrechts D, Bishop T, Lafuste P, Diez-Juan A, Harten SK, Van Noten P, De Bock K, Willam C, Tjwa M, Grosfeld A, Navet R, Moons L, Vandendriessche T, Deroose C, Wijeyekoon B, Nuyts J, Jordan B, Silasi-Mansat R, Lupu F, Dewerchin M, Pugh C, Salmon P, Mortelmans L, Gallez B, Gorus F, Buyse J, Sluse F, Harris RA, Gnaiger E, Hespel P, Van Hecke P, Schuit F, Van Veldhoven P, Ratcliffe P, Baes M, Maxwell P, Carmeliet P: Deficiency or inhibition of oxygen sensor Phd1 induces hypoxia tolerance by reprogramming basal metabolism. Nat Genet 40: 170–180, 2008 [DOI] [PubMed] [Google Scholar]
- 54.Madisen L, Zwingman TA, Sunkin SM, Oh SW, Zariwala HA, Gu H, Ng LL, Palmiter RD, Hawrylycz MJ, Jones AR, Lein ES, Zeng H: A robust and high-throughput Cre reporting and characterization system for the whole mouse brain. Nat Neurosci 13: 133–140, 2010 [DOI] [PMC free article] [PubMed] [Google Scholar]
- 55.Postic C, Shiota M, Niswender KD, Jetton TL, Chen Y, Moates JM, Shelton KD, Lindner J, Cherrington AD, Magnuson MA: Dual roles for glucokinase in glucose homeostasis as determined by liver and pancreatic beta cell-specific gene knock-outs using Cre recombinase. J Biol Chem 274: 305–315, 1999 [DOI] [PubMed] [Google Scholar]
- 56.Nakano D, Kobori H, Burford JL, Gevorgyan H, Seidel S, Hitomi H, Nishiyama A, Peti-Peterdi J: Multiphoton imaging of the glomerular permeability of angiotensinogen. J Am Soc Nephrol 23: 1847–1856, 2012 [DOI] [PMC free article] [PubMed] [Google Scholar]
Associated Data
This section collects any data citations, data availability statements, or supplementary materials included in this article.


