Abstract
Parkinson disease and other progressive neurodegenerative conditions are characterized by the intracerebral presence of Lewy bodies, containing amyloid fibrils of α-synuclein. We used cryo-electron microscopy and scanning transmission electron microscopy (STEM) to study in vitro-assembled fibrils. These fibrils are highly polymorphic. Focusing on twisting fibrils with an inter-crossover spacing of 77 nm, our reconstructions showed them to consist of paired protofibrils. STEM mass per length data gave one subunit per 0.47 nm axial rise per protofibril, consistent with a superpleated β-structure. The STEM images show two thread-like densities running along each of these fibrils, which we interpret as ladders of metal ions. These threads confirmed the two-protofibril architecture of the 77-nm twisting fibrils and allowed us to identify this morphotype in STEM micrographs. Some other, but not all, fibril morphotypes also exhibit dense threads, implying that they also present a putative metal binding site. We propose a molecular model for the protofibril and suggest that polymorphic variant fibrils have different numbers of protofibrils that are associated differently.
Keywords: amyloid, cryo-electron microscopy, fibril, metalloprotein, microscopic imaging, microscopy, cross-β structure, molecular mass measurements, scanning transmission electron microscopy, superpleated β structure
Introduction
α-Synuclein (αS)3 fibrils are a prominent component of intraneuronal protein aggregates called Lewy bodies (1). The presence and extent of Lewy bodies in the brain correlates with the incidence and severity of a variety of chronic neurodegenerative diseases (1–5). For research purposes, recombinant αS has been expressed in and purified from Escherichia coli. Fibrils assembled in vitro from this material resemble fibrils isolated from diseased human brain (6, 7).
αS is a 140-amino acid (14.4-kDa) protein normally expressed in neurons (7, 8). It is unstructured in the cytosol but has the ability to bind and remodel membranes, whereupon αS assumes an α-helical conformation (9, 10). However, the protein may also assume a third conformation that is rich in β-sheets. In a process that appears to involve misfolding, αS assembles into fibrils that exhibit a cross-β structure, as demonstrated by x-ray fiber diffraction and electron diffraction (11). Both techniques detected a strong meridional reflection at a spacing of 0.47 nm, the hallmark of amyloid (12). According to electron paramagnetic resonance studies, the β-sheets are in parallel conformation (13, 14). A high content of β-sheet structure in αS fibrils has also been observed by solid-state NMR spectroscopy (15, 16).
The amino acid sequence of αS contains seven pseudo-repeats between residues 10 and 98 (17), each starting with the consensus sequence KTKEGV followed by mostly hydrophobic residues. Although the issue is somewhat complicated by fibril polymorphism, it is widely accepted that fibrils have an amyloid core flanked by disordered segments. The C-terminal segment, ∼40 amino acids long, is negatively charged (14), and truncations of this region increase the rate of fibril assembly, suggesting that it may inhibit nucleation of the amyloid core (3, 18). There is a shorter disordered region at the N terminus, although its extent is not clear (see “Discussion”).
In this study, we investigated αS fibril structure by cryo-electron microscopy (cryo-EM) supplemented by image processing and scanning transmission electron microscopy. This combination of imaging techniques has not been employed previously in this system, although cryo-EM was used in a recent study focusing mainly on prefibrillar assembly intermediates (19). As in previous studies by others, our fibril preparations were polymorphic. Our cryo-EM analysis focused on a twisting fibril with an axial repeat of 77 nm whose twisting allowed reconstruction of its cross-section. This revealed a substructure in the form of two protofibrils. (We follow the terminology of Shirahama and Cohen (20): fibril (the fully assembled polymer), protofibril (the fibril is a bundle of one or more protofibrils), and protofilament (a fibrillar substructure in the protofibril) (12, 21). An alternative use is favored by some authors, e.g. Refs. 19, 22, in which the term protofibril refers to a prefibrillar assembly intermediate.).
Dark-field STEM microscopy gave a mass-per-length measurement consistent with one αS subunit per 0.47 nm axial rise per protofibril. The STEM data also revealed fine threads of density that we interpret as axial stacking of bound metals. Combining these data led to the formulation of a molecular model for the twisting fibril and a proposed structural basis for fibril polymorphism.
Experimental Procedures
Preparation of Fibrils
Protein preparation and fibril assembly was performed as described previously (14). Briefly, αS expression was induced with 0.5 mm isopropyl-1-thio-β-d-galactopyranoside, overnight at 25 °C, in E. coli BL21(DE3)pLys-S from the plasmid pRK172-αS. Cells were collected by centrifugation and resuspended in lysis buffer. They were subsequently boiled and acid-precipitated. αS in the supernatant was further purified and concentrated by anion exchange chromatography with a 0–1 m NaCl gradient. Fibrils were assembled from 275 μm αS in 10 mm HEPES buffer (pH 7.4), 100 mm NaCl, and 0.1% NaN3 at 37 °C with stirring for 7–10 days.
Cryo-EM
3-μl drops were applied to R1.2/1.3 Quantifoil 400 mesh copper grids (EMS), blotted, and plunge-frozen in liquid ethane using a Reichert KF-80 cryostation (Leica). Data were collected on film at ×50,000 magnification with a Philips CM200-FEG microscope operated at 120 keV. Images were digitized using a Nikon Coolscan 9000, giving a sampling rate of 1.27 Å/pixel.
Image Processing
Processing was done in Bsoft (23). Scanned micrographs were binned to give 2.54-Å pixels. Contrast transfer function effects were corrected by phase-flipping. Fibrils were straightened computationally and then screened to identify fibrils whose diffraction patterns gave at least one well defined layer line. Segment averages were calculated from these fibrils. A custom script was used to calculate and display a series of segment averages calculated with repeats from 50–100 nm, and the maximum contrast image was selected as having the correct repeat length. Fibrils with the same axial repeat were aligned by cross-correlation methods. Widths were measured from transverse density profiles averaged axially over 7.5-nm segments of the contrast transfer function-corrected images. This segment length was chosen as a compromise that would give a reasonable boost in signal-to-noise ratio while minimally lowering resolution as a result of fibril curvature. As the edge detection criterion, we used the points on either side at which the transverse density profile fell to the average background level inside the residual interference fringe of negative density. Although this interference fringe slightly erodes peripheral density, this criterion gives a robust and sharply defined measure of fibril width. Density maps for cross-sections, i.e. two-dimensional reconstructions from the side projections represented in segment averages, were obtained by back projection, assuming that the 154-nm repeat represents a rotation of 360°. The cross-sections were classified using the EMAN2 program e2refine2d (24) and averaged. For figures, structures were low pass-filtered to 30-Å resolution.
Scanning Transmission Electron Microscopy
STEM imaging was performed at Brookhaven National Laboratory (http://www.bnl.gov/biology/stem/), essentially as described (25). Typically, a 2 μl drop of fibrils in 10 mm HEPES buffer, pH 7.4, was adsorbed for 1 min to a thin carbon film-bearing grid to which tobacco mosaic virus had previously been applied. The grid was then washed 10 times with water, blotted, and freeze-dried. Dark-field images were recorded on annular detectors. Data were analyzed using PCmass32 (http://www.bnl.gov/biology/stem/), and histograms were compiled, correcting for mass loss according to the internal standard. Curve-fitting to the histograms with a Gaussian distribution was performed in Kaleidagraph (Synergy Software). For editing micrographs to erase dense threads, these features were erased using the healing tool in Photoshop (Adobe). A 6-pixel (3-nm) diameter selection of the fibril density immediately adjacent to a thread crossover was taken to most closely approximate the density of the fibril. The editing of fibril images to erase scattering from the dense threads was performed on micrographs recorded at the higher magnification (inter-pixel spacing of 0.5 nm compared with the 2.0-nm spacing used for most of the micrographs) because the higher sampling rate made it easier to perform the editing operation.
Results
Cryo-TEM of Twisting and Straight Fibrils
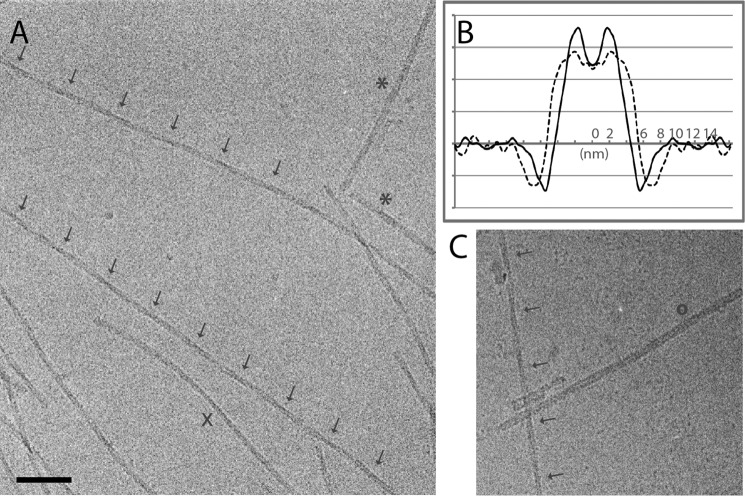
Amyloid fibrils were assembled in vitro from recombinant αS which was expressed, purified, and handled as described previously (14). Cryo-EM revealed a population of gently curving fibrils encompassing at least four polymorphic variants (Fig. 1A). The majority of fibrils (∼74%) showed crossovers with an axial periodicity of ∼77 nm that are indexed with arrows (Fig. 1A) on two examples. We attribute the thinning and thickening of the fibrils in these images to a structure with an oval cross-section, rotating slowly along its axis, and, therefore, refer to it as a twisting fibril (26). The minimum and maximum diameters of these fibrils were 8.0 by 11.0 nm, and their average width was 8.6 ± 0.1 nm (Fig. 1B). The spacing between crossovers (thinnest points) corresponds to a rotation of 180° and twice that (154 nm) to a full revolution of 360°. Minority species include the following: a non-twisting fibril 10.8 ± 0.6 nm wide (9%, e.g. asterisks in Fig. 1A), a 10.4 ± 0.9-nm-wide species with a low-density stripe down its middle (17%, Fig. 1C), and a slowly twisting fibril (>500 nm between crossovers) that is 8.3 nm wide (1%, e.g. the fibril marked with X in Fig. 1A). To our knowledge, the twisting fibril with the 77-nm repeat on which our structural analysis focused has not been described previously (Fig. 1, A and C, arrows).
FIGURE 1.
Cryo-EM of αS fibrils. A, cryo-electron micrograph of αS fibrils. Several fibril morphologies are present. Arrows mark crossovers in two twisting fibrils, asterisks designate two wider fibrils, and X marks a rare fibril with a slow twist. Scale bar = 75 nm. B, transverse density profiles obtained by averaging along and over many fibrils: solid curve, for twisting 77-nm fibrils; dashed curve, for wider non-twisting fibrils. C, cryo-electron micrograph of another morphotype (o) in comparison to a twisting fibril (arrows).
Twisting Fibrils and Segment Averages
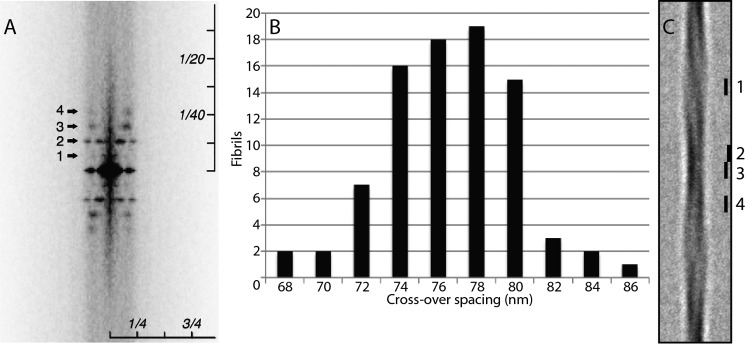
An averaged diffraction pattern calculated from computationally straightened fibrils shows a strong second-order reflection at a meridional spacing of 2 × (1/154) nm−1 (Fig. 2A, 2). The primary reflection at (1/154) nm−1 is very weak because the two 77-nm half-segments are similar, but the distinction between them is affirmed by the intensity of the third-order layer line at 3 × (1/154) nm−1. A fourth-order reflection is also visible.
FIGURE 2.
Analysis of αS fibrils from cryo-electron micrographs. A, averaged diffraction pattern calculated from multiple straightened fibrils (n = 127, including short fibrils), showing four layer lines at meridional spacings of 1, 2, 3, and 4 × (1/154) nm−1. The images of the straightened fibrils had a width of 256 2.54-Å pixels and were extended computationally to a fixed length of 5168 pixels before calculating the Fourier transforms. Therefore, the scaling of the pattern is anisotropic, as indicated. The equatorial reflection relates to the fibril diameter. B, histogram of intercrossover spacings measured from 77 fibrils. They observe a Gaussian-like distribution centered on a spacing of 77 nm. C, global average of 154-nm segments from 33 fibrils with comparable axial repeats. Segments were aligned by cross-correlation. The bars mark 7.5-nm segments used to compute transverse density profiles at points of maximum width (1), bimodal profiles (2 and 4), and points of minimum width (3).
We measured the intercrossover spacing for each fibril in the data set. Because the repeats are long and the reflections in individual diffraction patterns are not sharply defined, this was done in real space. On a given fibril, segment averages were calculated for all spacings between 65 and 85 nm in 1-nm increments, and the repeat was determined as the one that gave the sharpest definition of the crossovers. These data are plotted in Fig. 2B.
154-nm segment averages were calculated from the 33 individual twisting fibrils that showed a 77 (±1)-nm repeat. There were 2–6 (mean, 4.8) segments per fibril. Segment averaging made the asymmetry of the crossovers more apparent. One side is denser, a pattern that alternates regularly along the fibril (Fig. 2C). Because a non-polar fibril would require a symmetric arrangement about the fibril axis, we deduced that these fibrils are polar, i.e. one end is different from the other. This agrees with previous observations (27). These segment averages were then combined. First, they were brought into axial alignment. Each time a new segment average was added into the running total, it was tried in both orientations (up/down), and the orientation chosen was the one that gave the higher correlation coefficient. The globally averaged 154-nm segment came from 33 fibrils with a cumulative length of 24.55 μm (Fig. 2C). Asymmetry is particularly apparent at and near the crossover (Fig. 2C, marker 3 and markers 2 and 4, respectively).
Fibrils with ν-shaped Cross-sections Have Two Asymmetrically Associated Protofibrils
Cross-sections (two-dimensional density maps) were calculated for each fibril in the data set whose diffraction pattern resolved at least one layer line (n = 84). The resulting cross-sections were classified and then averaged within each class. The results of a six class analysis are shown in Fig. 3A. The essential features of the cross-section are common to all, with some variation in fine details; for instance, in the extent to which the two arms of the complex resolve. A similar outcome was obtained with fewer classes. The global average is shown in Fig. 3B, left panel. The twisting fibrils consist of two protofibrils, but they are not disposed symmetrically around the fibril axis. Rather, the cross-section is shaped like the Greek letter nu (ν). Each protofibril has dimensions of ∼7.5 × 2.5 nm. Its cross-section appears to subdivide into two similarly sized, ellipsoidal protofilaments, one proximal to the base of the ν and the other distal to it (Fig. 3B, right panel). The three-dimensional structure of the fibril core was generated by helical extrusion. Its lateral projection (Fig. 3C) reproduces the asymmetric crossovers observed in the segment average (Fig. 2C).
FIGURE 3.
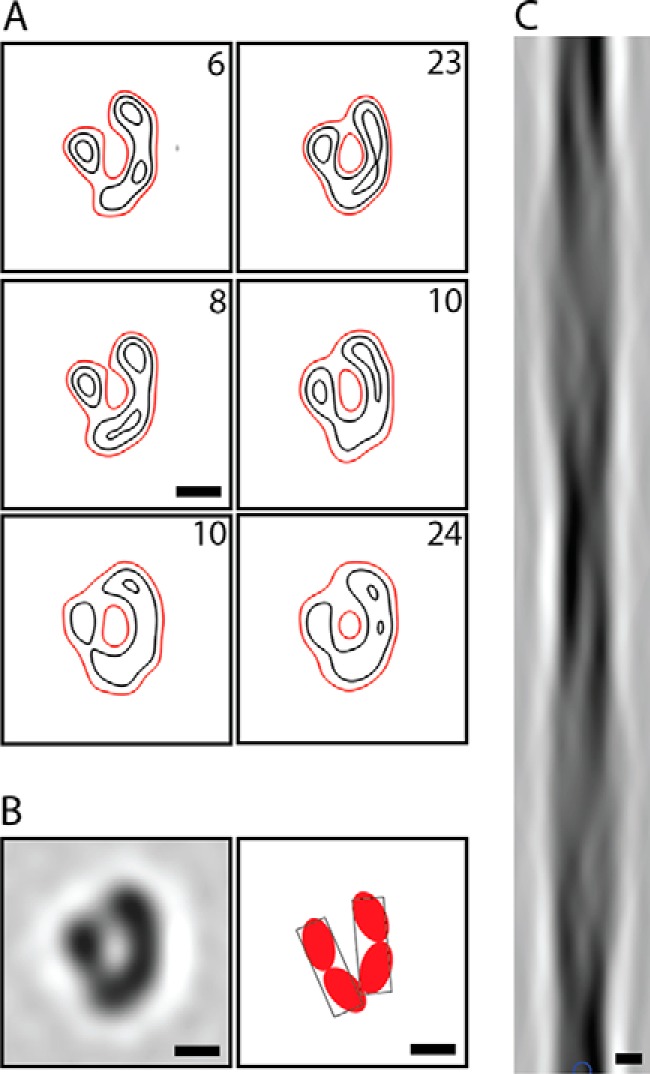
Cross-sections and side projection of twisting fibrils exhibiting the 77-nm repeat. Such fibrils consist of two protofibrils, associated asymmetrically. A, six class averages of two-dimensional reconstructions of individual fibrils, contoured to 1 (red), 2, and 3 σ. The numbers of segments per class are noted at the top right. B, left panel, globally averaged fibril cross-section. Right panel, schematic showing the protofibrils as consisting of two protofilaments each. C, side view of the fibril generated by re-extruding an averaged cross-section. Scale bars = 4 nm.
The resolution of the global average is ∼4 nm. We suspect that it is limited by micropolymorphism, which is also reflected in the respective class average cross-sections and suggests that there is some variability in the way in which protofibrils associate, particularly with respect to the distal protofilaments.
Electron-dense Threads Imaged in Dark-field STEM
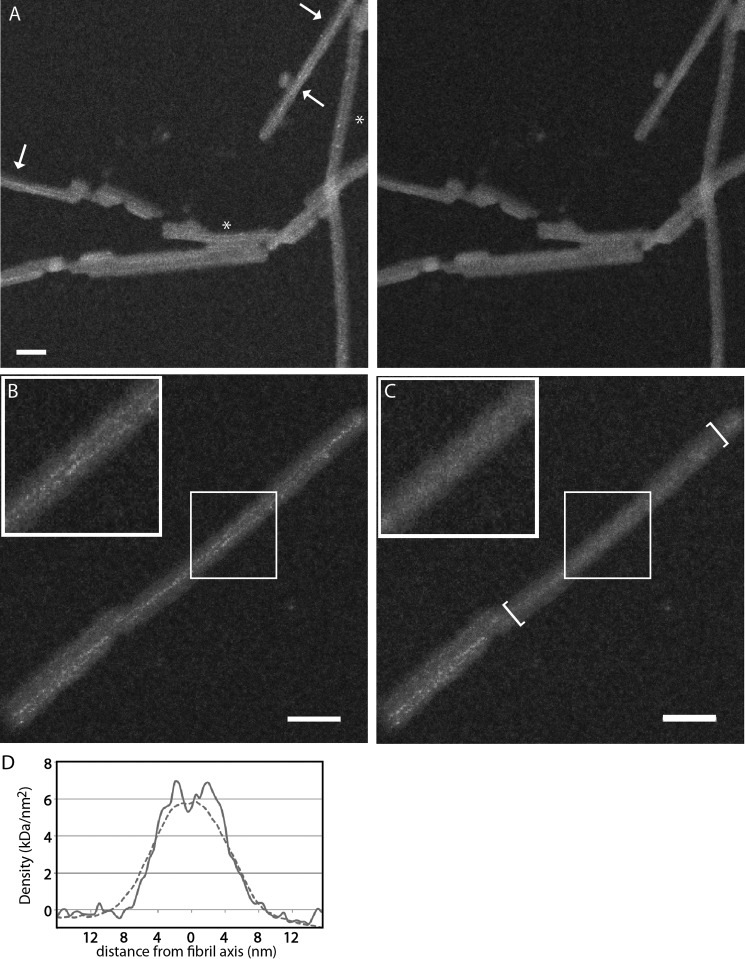
Dark-field STEM yields high-contrast images of unstained biological specimens prepared by freeze-drying. These data can be used to perform mass measurements of individual particles or mass-per-length measurements of filaments (28–30). We applied this technique to our αS fibril preparations using the dedicated STEM at Brookhaven National Laboratory and following a rigorous grid-washing protocol to minimize the risk of residual salt deposits. The resulting micrographs (Figs. 4A and 5, A and B) had clean backgrounds and well preserved tobacco mosaic virus particles (data not shown), which were included to provide an internal mass standard (131.4 kDa/nm). Unexpectedly, the fibrils also showed very thin (∼0.5-nm) electron-dense threads. Strong electron scattering by the threads is apparent, particularly in images from the large-angle annular detector (Fig. 5A, left panel), suggesting that they represent strands of bound metals. Consistent with this interpretation, they are less contrasted in images recorded in parallel from the small-angle detector (compare Fig. 5A, right panel).
FIGURE 4.
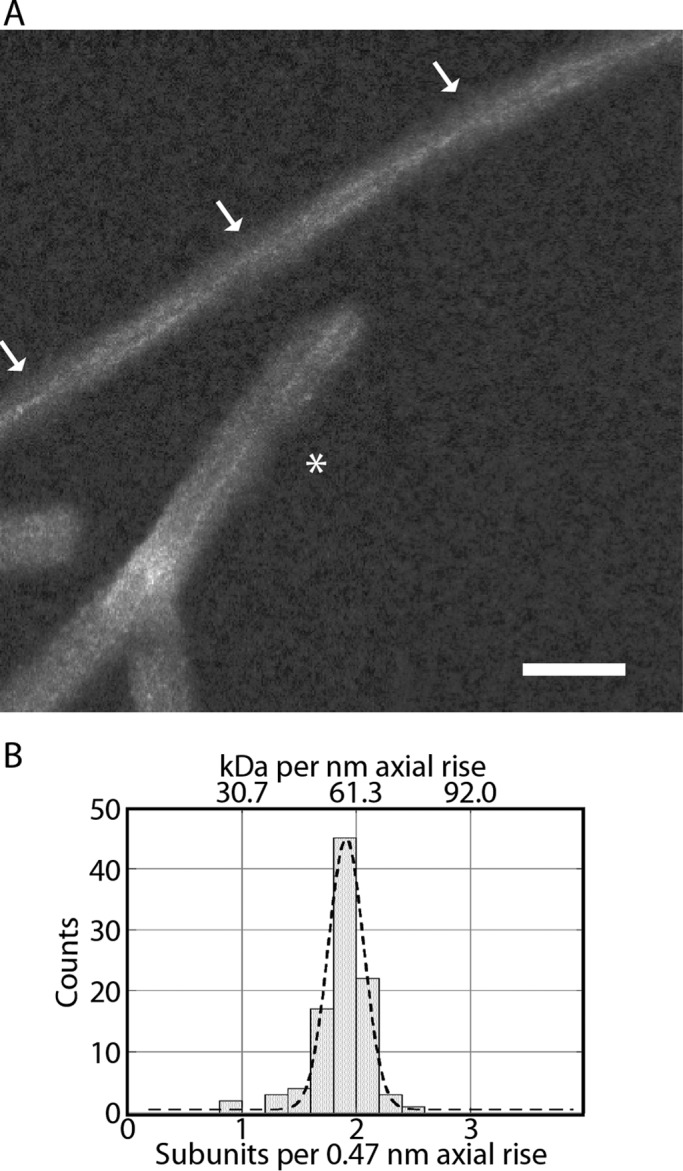
Analysis of STEM micrographs. A, dark-field STEM micrograph of freeze-dried αS fibrils showing dense threads. Arrows indicate points on a twisting fibril at which the threads cross over. The asterisk marks a small bundle of non-twisting fibrils. The grayscale was adjusted to optimize the visibility of the dense threads. B, histogram of mass-per-length measurements and fitted Gaussian distribution (dashed curve). Measurements were converted from mass to subunits using a subunit mass of 14.4 kDa. The Gaussian maximum is at 59.1, and its standard deviation is 7.4 kDa/nm (in round figures, two subunits per 0.47-nm axial rise) (n = 97). Scale bar = 30 nm.
FIGURE 5.
Dense threads visualized in STEM micrographs. A, the threads are apparent in the large-angle dark-field image of αS fibrils (left panel) but much less so in the simultaneously recorded small-angle dark-field image of the same field (right panel). Crossover points in twisting fibrils are marked with arrows, whereas paired threads in non-twisting fibrils maintain constant separation (asterisks). B, original STEM dark-field micrograph of an αS fibril. C, the same micrograph with the thread-like features erased in the bracketed region. A 50 × 50-nm box is enlarged ×2 (top left inset). In A–C, the grayscale was adjusted to promote the visibility of the threads. D, comparison, on a linear density scale, of transverse profiles calculated from the raw data (continuous curve) and the edited data (dashed curve). The profiles were averaged over regions of maximum separation of the two threads. Scale bars = 30 nm.
This feature (dense threads) has not been observed in any amyloid observed previously by STEM (reviewed in Ref. 31). Threads were seen whether the fibrils were bundled together, giving multiple threads, or separate (Fig. 5A). The majority of individual fibrils show a pair of entwined threads that cross over at 77-nm intervals. We conclude that there is one thread per protofibril (above; Fig. 4A, arrows). Other fibrils have pairs of parallel threads (Fig. 5A, asterisk). This feature, discovered fortuitously, allowed us to identify, in STEM micrographs, fibrils that twist with the 77-nm repeat that are otherwise less easy to recognize than in cryo-EM images.
STEM Mass Measurements Give One αS Subunit per 0.47-nm Axial Step per Protofibril
Mass-per-length measurements gave a unimodal distribution (Fig. 4B). A Gaussian distribution fitted to these data had a mean of 59.1 kDa/nm, equivalent to 1.92 subunits per 0.47-nm axial rise. Given the expected margin of error (see “Discussion”), these data are consistent with protofibrils having a linear density corresponding to 1 αS subunit per 0.47-nm axial rise.
To assess how much the dense threads (putatively, bound metals) may have affected the mass data, measurements were also carried out on STEM micrographs on which the threads had been edited out. This operation was performed manually, replacing those pixels with the local average value from a small adjacent patch of fibril (Fig. 5, B and C). To have large enough local patches for this operation, these measurements were performed only on the higher-magnification images in which the 0.3-nm-wide STEM probe sampled the specimen at intervals of 0.5 nm. (For the rest of the data, this interval was 2 nm, giving 16-fold sparser sampling.) The mass-per-length data from this subset were also well described by Gaussian distributions with parameters 1.98 ± 0.13 (for the raw data, not significantly different from the complete data set) and 1.91 ± 0.21 (for the edited data) subunits per 0.47 nm axial rise (n = 38). Therefore, the difference between the raw data and the edited data indicates that the threads add only a small (∼3.5%) increment in mass per length. The respective transverse density profiles, averaged over regions of maximum separation of the two threads, are compared in Fig. 5D.
STEM of Other Polymorphs
As in cryo-EM, other fibril morphotypes were present in the STEM micrographs in addition to the predominant twisting species. As noted above, different morphotypes are harder to distinguish in STEM, but the symmetry and tightness of the mass-per-length distribution (Fig. 4B) suggests that most of the other morphotypes have similar values of mass per length. A well visualized exception is the fibril marked with a diamond in Fig. 6, which had a mass per length of ∼30 kDa/nm, equivalent to one subunit per 0.47 nm, suggesting a single protofibril. Its width is similar to the long dimension of a single protofibril (7.5 nm), but it does not appear to twist. This fibril lacked a dense thread, suggesting that the putative metal binding site was not present. Another rare fibril type yielded a mass per length of ∼45 kDa/nm, equivalent to 1.5 subunits per 0.47 nm (Fig. 6, triangle).
FIGURE 6.
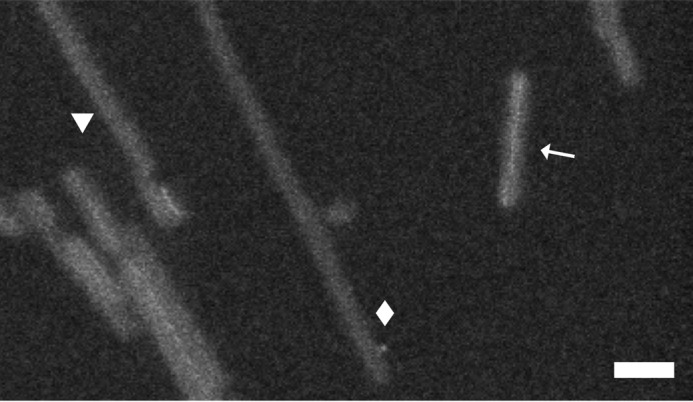
STEM micrograph of three morphotypes. Paired protofibrils with electron-dense threads that cross (arrow). Shown are fibrils with 1 and 1.5 subunits per 0.47 nm (diamond and triangle, respectively). Scale bar = 30 nm.
Discussion
Our goal was to investigate the structure of αS amyloid fibrils. Many previous studies (see “Introduction”) have found αS fibrils to be polymorphic, with variants ranging in reported diameter from 5–18 nm (6, 32) and the fibrils either twisting or straight. Our preparations were also polymorphic. Structural analysis was made on the basis of cryo-electron microscopy, which gives excellent preservation of native structure, and dark-field STEM microscopy of unstained specimens, which yields measurements of mass per length, imposing a tight constraint on the axial packing of subunits.
A Twisting Fibril with Paired Protofibrils, Each with a Metal Binding Site
The fibrils that we analyzed in depth twisted with an intercrossover spacing of 77 nm. Their twisting allowed the fibril cross-section to be reconstructed. The STEM mass-per-length data are well described as a Gaussian distribution with parameters of 1.92 ± 0.24 subunits per 0.47 nm axial rise. Because potential systematic errors limit the analysis to an overall uncertainty of 5–10% (31), we interpret the STEM data as indicating a linear density of 2 subunits per 0.47-nm step.
These observations led to a model of the twisting fibril as consisting of two asymmetrically associated protofibrils, each ∼7.5 by ∼2.5 nm in cross-section, with one αS subunit per 0.47-nm axial rise in a cross-β structure. Their ν-shaped cross-section indicates that the two protofibrils are not equivalent. The dual protofibrils were confirmed by the two entwined “dense threads” per fibril visualized by STEM. We interpret the threads as helical strands of bound metals, scavenged from the trace amounts present in the buffer used. This is supported by the observation of similar threads on fibrils that were intentionally doped with copper but not on the control.4 Metal binding by αS (in some cases with submicromolar affinity) has been documented previously using other techniques (33, 34).
Two earlier papers have proposed models with paired protofibrils. In one, on the basis of atomic force microscopy data, two protofibrils of 4–5 nm in height (6), make up a 10-nm fibril (35). In the other, negative staining EM was used to describe a fibril with two protofibrils, each ∼5 nm in diameter, giving fibril dimensions of 5.5 × 11 nm (36). However, in both cases, the ratio of long axis to short axis in cross-section is not compatible with what we observed by cryo-EM (8.0 × 11.0 nm). Another study, on the basis of atomic force microscopy and proteolytic digests, proposed that four twisting protofibrils form a fibril 13.6 nm in height (37). However, all of these models predict a mass per length that is twice what we observed. This rules them out for the twisting fibrils of this study, but they may apply to other polymorphs.
A Superpleated Model for the Twisting Fibril
In principle, EPR or solid-state NMR can determine the number of strands per subunit and their lengths, and several studies of this kind have been published (13, 15, 16, 36). Although they all envisage readouts of five or six strands per subunit, they differ in terms of which segments form strands. The situation is further complicated by fibril polymorphisms.
In superpleated β-structures (38), the polypeptide chain zig-zags in a planar fashion, giving an array of aligned β-strands connected by turns. Subunits with this fold are stacked in register, with like strands from successive subunits forming a β-sheet. Protofibril models of this kind explicitly have one subunit per 0.47-nm layer and are cross-β structures. These models can vary in the number of strands per subunit (and, therefore, the number of sheets), strand lengths, twist angle, and turn conformation(s). Among other possibilities, Der-Sarkissian et al. (14) have considered a five-sheet model. More recently, Vilar et al. (36) have proposed a five-sheet version of this model; however, it envisages a linear density of double that measured here .
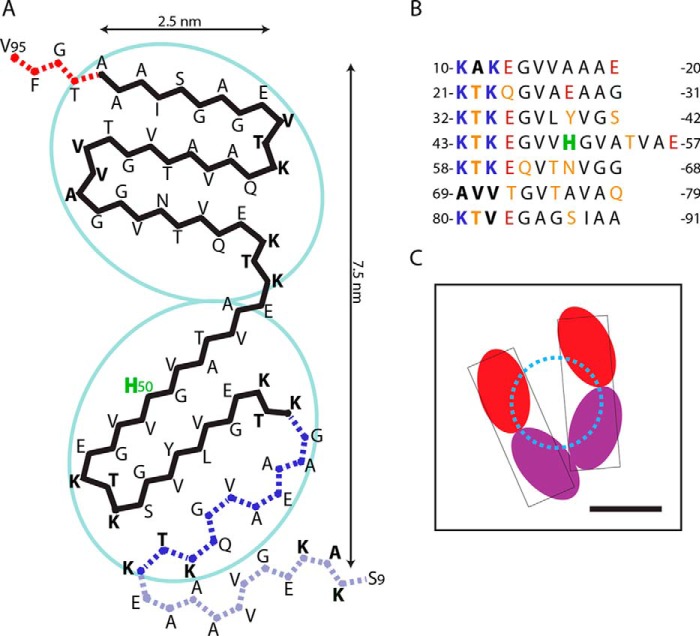
Although current experimental data do not fully specify a structure for these twisting fibrils, our EM observations limit the possibilities. Taking into account the protofibril cross-section and its substructure, the two protofilaments could each accommodate three β-strands from the same subunit. A model of this kind for the fibril core is shown in Fig. 7. (The N-terminal region up to residue 8 and the C-terminal region distal to residue 95 are assumed to be disordered and would not be seen in cryo-EM reconstructions, although they would contribute to the STEM images.) This superpleated β-structure fold, generated with the ArchCandy program (39), has three β-strands in each protofilament, with the charged residues primarily located at the predicted turns. Of note, evidence has been presented that repeats 1 and 2 do not participate in the core and may not be in β-sheet conformation (14, 15, 37). However, given the wide polymorphic variation encountered in αS fibrils, all of the observed constraints may not apply to a given preparation of fibrils. Variations on this theme remain viable candidates.
FIGURE 7.
A superpleated β-structural model for the core region of an αS protofibril. A, the core, shown in cross-section, consists of two ellipsoidal protofilaments, each a three-stranded β-serpentine. Residues in boldface mark the starting sequence of each pseudo-repeat. The position assigned to His-50, a potential metal-binding site, is labeled H50. A possible additional strand toward the N terminus and offset from the core (corresponding to the first pseudo-repeat) is shown as gray dots. The C-terminal region (beyond Val-95) is taken to be disordered and is not shown. In the model, the charged residues are located on the surface of the fibril, and most of the positively charged Lys residues can form salt bridges with negatively charged Glu residues. Lysines that are not involved in ionic bonds can avoid each other by lateral displacements, reducing the electrostatic repulsion. Moreover, insertion of water molecules between charged groups would further reduce the charge repulsion. B, tabulation of the pseudo-repeats. C, an interpretation of the reconstructed fibril cross-section (Fig. 3B) with the two protofilaments per protofibril shown in different colors. The assignment of colors to N-terminal and C-terminal protofilaments is arbitrary because current data are not sufficient to specify. The model predicts that the metal binding site should involve amino acid residue(s) close to the dotted circle.
Asymmetric Association of Protofibrils
The non-equivalent (asymmetric) association of protofibrils in the 77-nm fibril is unusual in protein polymers but not unprecedented (40). Although current data are not sufficient to uniquely define the αS fibril structure and, therefore, the interprotofibril interactions, we can suggest a possible generic mechanism for asymmetry. If we imagine starting with a pair of equivalent protofibrils and then perturbing the superpleated fold of one of them (for instance, by altering a turn or the length of a given strand) in a way that would enable an additional interprotofibril interaction, the result would be an energetically favored asymmetric fibril. One way in which such an arrangement could come about would be for assembly of a second protofibril to nucleate on the side of an existing protofibril and grow out from that site (as discussed by Mizuno et al. (41) for Het-s amyloid fibrils), with the subunit fold in the second protofibril slightly different from that of the original protofibril. In this context, it is well established that subunits adding to a growing amyloid fibril tend to be partly or wholly unfolded prior to assembly and, therefore, amenable to coupled folding and assembly.
A Basis for Fibril Polymorphism
As for the polymorphism exhibited by αS fibrils, we hypothesize that its basis may lie in part in the number of protofibrils coiled into a fibril, the nature of their association, and in relatively subtle differences in the inter-strand turns that may affect the twist (or lack thereof) of a given protofibril. In any case, the initiation event in fibril assembly would appear to be crucial because the growing fibril would be expected to serve as a template from which the same structure is propagated outward. Insofar as various morphotypes may exhibit dense threads, further studies are needed to determine which metals are involved and how their binding may affect fibril morphology.
The polymorphism of αS fibrils is well established, but clarifying how they differ in terms of detailed cross-β structures remains to be done. There have been some indications that different strains give rise to different synucleinopathies (42) and that αS fibrils stimulate inflammation (43). These considerations motivate additional efforts to develop better structural models of αS fibrils and to define their relation to clinical isolates as a basis for understanding the mechanism of disease development.
Author Contributions
J. V. and A. D. D. prepared fibrils. N. C. collected cryo-EM data. J. S. W. collected the STEM data. J. B. H. wrote programs for image processing. A. D. D. processed the data. A. V. K. made the model. A. D. D., R. L., and A. C. S. interpreted the results. A. D. D. and A. C. S. wrote the manuscript with input from the other authors.
This research was supported by the intramural research program of NIAMS/National Institutes of Health (to A. C. S.) and National Institutes of Health Grant 1R01NS084345 (to R. L.). The authors declare that they have no conflicts of interest with the contents of this article. The content is solely the responsibility of the authors and does not necessarily represent the official views of the National Institutes of Health.
The data reported in this paper have been submitted to the EMDB under accession no. EMD-6482.
A. D. Dearborn, J. S. Wall, and A. C. Steven, manuscript in preparation.
- αS
- α-synuclein
- cryo-EM
- cryo-electron microscopy
- STEM
- scanning transmission EM.
References
- 1. Spillantini M. G., Crowther R. A., Jakes R., Hasegawa M., and Goedert M. (1998) α-Synuclein in filamentous inclusions of Lewy bodies from Parkinson's disease and dementia with Lewy bodies. Proc. Natl. Acad. Sci. U.S.A. 95, 6469–6473 [DOI] [PMC free article] [PubMed] [Google Scholar]
- 2. Braak H., Del Tredici K., Rüb U., de Vos R. A., Jansen Steur E. N., and Braak E. (2003) Staging of brain pathology related to sporadic Parkinson's disease. Neurobiol. Aging 24, 197–211 [DOI] [PubMed] [Google Scholar]
- 3. Crowther R. A., Jakes R., Spillantini M. G., and Goedert M. (1998) Synthetic filaments assembled from C-terminally truncated α-synuclein. FEBS Lett. 436, 309–312 [DOI] [PubMed] [Google Scholar]
- 4. Goedert M., Jakes R., Crowther R. A., Hasegawa M., Smith M. J., and Spillantini M. G. (1998) Intraneuronal filamentous tau protein and α-synuclein deposits in neurodegenerative diseases. Biochem. Soc. Trans. 26, 463–471 [DOI] [PubMed] [Google Scholar]
- 5. Lippa C. F., Schmidt M. L., Lee V. M., and Trojanowski J. Q. (1999) Antibodies to α-synuclein detect Lewy bodies in many Down's syndrome brains with Alzheimer's disease. Ann. Neurol. 45, 353–357 [DOI] [PubMed] [Google Scholar]
- 6. Conway K. A., Harper J. D., and Lansbury P. T. Jr. (2000) Fibrils formed in vitro from α-synuclein and two mutant forms linked to Parkinson's disease are typical amyloid. Biochemistry 39, 2552–2563 [DOI] [PubMed] [Google Scholar]
- 7. Jakes R., Spillantini M. G., and Goedert M. (1994) Identification of two distinct synucleins from human brain. FEBS Lett. 345, 27–32 [DOI] [PubMed] [Google Scholar]
- 8. Iwai A., Masliah E., Yoshimoto M., Ge N., Flanagan L., de Silva H. A., Kittel A., and Saitoh T. (1995) The precursor protein of non-A β component of Alzheimer's disease amyloid is a presynaptic protein of the central nervous system. Neuron 14, 467–475 [DOI] [PubMed] [Google Scholar]
- 9. Varkey J., Isas J. M., Mizuno N., Jensen M. B., Bhatia V. K., Jao C. C., Petrlova J., Voss J. C., Stamou D. G., Steven A. C., and Langen R. (2010) Membrane curvature induction and tubulation are common features of synucleins and apolipoproteins. J. Biol. Chem. 285, 32486–32493 [DOI] [PMC free article] [PubMed] [Google Scholar]
- 10. Weinreb P. H., Zhen W., Poon A. W., Conway K. A., and Lansbury P. T. Jr. (1996) NACP, a protein implicated in Alzheimer's disease and learning, is natively unfolded. Biochemistry 35, 13709–13715 [DOI] [PubMed] [Google Scholar]
- 11. Serpell L. C., Berriman J., Jakes R., Goedert M., and Crowther R. A. (2000) Fiber diffraction of synthetic α-synuclein filaments shows amyloid-like cross-β conformation. Proc. Natl. Acad. Sci. U.S.A. 97, 4897–4902 [DOI] [PMC free article] [PubMed] [Google Scholar]
- 12. Sunde M., Serpell L. C., Bartlam M., Fraser P. E., Pepys M. B., and Blake C. C. (1997) Common core structure of amyloid fibrils by synchrotron X-ray diffraction. J. Mol. Biol. 273, 729–739 [DOI] [PubMed] [Google Scholar]
- 13. Chen M., Margittai M., Chen J., and Langen R. (2007) Investigation of α-synuclein fibril structure by site-directed spin labeling. J. Biol. Chem. 282, 24970–24979 [DOI] [PubMed] [Google Scholar]
- 14. Der-Sarkissian A., Jao C. C., Chen J., and Langen R. (2003) Structural organization of α-synuclein fibrils studied by site-directed spin labeling. J. Biol. Chem. 278, 37530–37535 [DOI] [PubMed] [Google Scholar]
- 15. Gath J., Bousset L., Habenstein B., Melki R., Böckmann A., and Meier B. H. (2014) Unlike twins: an NMR comparison of two α-synuclein polymorphs featuring different toxicity. PLoS ONE 9, e90659. [DOI] [PMC free article] [PubMed] [Google Scholar]
- 16. Heise H., Hoyer W., Becker S., Andronesi O. C., Riedel D., and Baldus M. (2005) Molecular-level secondary structure, polymorphism, and dynamics of full-length α-synuclein fibrils studied by solid-state NMR. Proc. Natl. Acad. Sci. U.S.A. 102, 15871–15876 [DOI] [PMC free article] [PubMed] [Google Scholar]
- 17. Miake H., Mizusawa H., Iwatsubo T., and Hasegawa M. (2002) Biochemical characterization of the core structure of α-synuclein filaments. J. Biol. Chem. 277, 19213–19219 [DOI] [PubMed] [Google Scholar]
- 18. Hoyer W., Cherny D., Subramaniam V., and Jovin T. M. (2004) Impact of the acidic C-terminal region comprising amino acids 109–140 on α-synuclein aggregation in vitro. Biochemistry 43, 16233–16242 [DOI] [PubMed] [Google Scholar]
- 19. Zhang H., Griggs A., Rochet J. C., and Stanciu L. A. (2013) In vitro study of α-synuclein protofibrils by cryo-EM suggests a Cu2+-dependent aggregation pathway. Biophys. J. 104, 2706–2713 [DOI] [PMC free article] [PubMed] [Google Scholar]
- 20. Shirahama T., and Cohen A. S. (1967) High-resolution electron microscopic analysis of the amyloid fibril. J. Cell Biol. 33, 679–708 [DOI] [PMC free article] [PubMed] [Google Scholar]
- 21. Khurana R., Ionescu-Zanetti C., Pope M., Li J., Nielson L., Ramírez-Alvarado M., Regan L., Fink A. L., and Carter S. A. (2003) A general model for amyloid fibril assembly based on morphological studies using atomic force microscopy. Biophys. J. 85, 1135–1144 [DOI] [PMC free article] [PubMed] [Google Scholar]
- 22. Walsh D. M., Lomakin A., Benedek G. B., Condron M. M., and Teplow D. B. (1997) Amyloid β-protein fibrillogenesis: detection of a protofibrillar intermediate. J. Biol. Chem. 272, 22364–22372 [DOI] [PubMed] [Google Scholar]
- 23. Heymann J. B. (2001) Bsoft: image and molecular processing in electron microscopy. J. Struct. Biol. 133, 156–169 [DOI] [PubMed] [Google Scholar]
- 24. Tang G., Peng L., Baldwin P. R., Mann D. S., Jiang W., Rees I., and Ludtke S. J. (2007) EMAN2: an extensible image processing suite for electron microscopy. J. Struct. Biol. 157, 38–46 [DOI] [PubMed] [Google Scholar]
- 25. Wall J. S., Simon M. N., Lin B. Y., and Vinogradov S. N. (2008) Mass mapping of large globin complexes by scanning transmission electron microscopy. Methods Enzymol. 436, 487–501 [DOI] [PubMed] [Google Scholar]
- 26. Adamcik J., Jung J. M., Flakowski J., De Los Rios P., Dietler G., and Mezzenga R. (2010) Understanding amyloid aggregation by statistical analysis of atomic force microscopy images. Nat. Nanotechnol. 5, 423–428 [DOI] [PubMed] [Google Scholar]
- 27. Crowther R. A., Daniel S. E., and Goedert M. (2000) Characterisation of isolated α-synuclein filaments from substantia nigra of Parkinson's disease brain. Neurosci Lett. 292, 128–130 [DOI] [PubMed] [Google Scholar]
- 28. Ksiezak-Reding H., and Wall J. S. (1994) Mass and physical dimensions of two distinct populations of paired helical filaments. Neurobiol. Aging 15, 11–19 [DOI] [PubMed] [Google Scholar]
- 29. Thomas D., Schultz P., Steven A. C., and Wall J. S. (1994) Mass analysis of biological macromolecular complexes by STEM. Biol. Cell 80, 181–192 [DOI] [PubMed] [Google Scholar]
- 30. Müller S. A., and Engel A. (2001) Structure and mass analysis by scanning transmission electron microscopy. Micron 32, 21–31 [DOI] [PubMed] [Google Scholar]
- 31. Goldsbury C., Baxa U., Simon M. N., Steven A. C., Engel A., Wall J. S., Aebi U., and Müller S. A. (2011) Amyloid structure and assembly: insights from scanning transmission electron microscopy. J. Struct. Biol. 173, 1–13 [DOI] [PMC free article] [PubMed] [Google Scholar]
- 32. Spillantini M. G., Crowther R. A., Jakes R., Cairns N. J., Lantos P. L., and Goedert M. (1998) Filamentous α-synuclein inclusions link multiple system atrophy with Parkinson's disease and dementia with Lewy bodies. Neurosci. Lett. 251, 205–208 [DOI] [PubMed] [Google Scholar]
- 33. Dudzik C. G., Walter E. D., and Millhauser G. L. (2011) Coordination features and affinity of the Cu2+ site in the α-synuclein protein of Parkinson's disease. Biochemistry 50, 1771–1777 [DOI] [PMC free article] [PubMed] [Google Scholar]
- 34. Santner A., and Uversky V. N. (2010) Metalloproteomics and metal toxicology of α-synuclein. Metallomics 2, 378–392 [DOI] [PubMed] [Google Scholar]
- 35. Conway K. A., Lee S. J., Rochet J. C., Ding T. T., Harper J. D., Williamson R. E., and Lansbury P. T. Jr. (2000) Accelerated oligomerization by Parkinson's disease linked α-synuclein mutants. Ann. N.Y. Acad. Sci. 920, 42–45 [DOI] [PubMed] [Google Scholar]
- 36. Vilar M., Chou H. T., Lührs T., Maji S. K., Riek-Loher D., Verel R., Manning G., Stahlberg H., and Riek R. (2008) The fold of α-synuclein fibrils. Proc. Natl. Acad. Sci. U.S.A. 105, 8637–8642 [DOI] [PMC free article] [PubMed] [Google Scholar]
- 37. Qin Z., Hu D., Han S., Hong D. P., and Fink A. L. (2007) Role of different regions of α-synuclein in the assembly of fibrils. Biochemistry 46, 13322–13330 [DOI] [PubMed] [Google Scholar]
- 38. Kajava A. V., Baxa U., Wickner R. B., and Steven A. C. (2004) A model for Ure2p prion filaments and other amyloids: the parallel superpleated β-structure. Proc. Natl. Acad. Sci. U.S.A. 101, 7885–7890 [DOI] [PMC free article] [PubMed] [Google Scholar]
- 39. Ahmed A. B., Znassi N., Château M. T., and Kajava A. V. (2015) A structure-based approach to predict predisposition to amyloidosis. Alzheimers Dement. 11, 681–690 [DOI] [PubMed] [Google Scholar]
- 40. Sachse C., Fändrich M., and Grigorieff N. (2008) Paired β-sheet structure of an Aβ(1–40) amyloid fibril revealed by electron microscopy. Proc. Natl. Acad. Sci. U.S.A. 105, 7462–7466 [DOI] [PMC free article] [PubMed] [Google Scholar]
- 41. Mizuno N., Baxa U., and Steven A. C. (2011) Structural dependence of HET-s amyloid fibril infectivity assessed by cryoelectron microscopy. Proc. Natl. Acad. Sci. U.S.A. 108, 3252–3257 [DOI] [PMC free article] [PubMed] [Google Scholar]
- 42. Peelaerts W., Bousset L., Van der Perren A., Moskalyuk A., Pulizzi R., Giugliano M., Van den Haute C., Melki R., and Baekelandt V. (2015) α-Synuclein strains cause distinct synucleinopathies after local and systemic administration. Nature 522, 340–344 [DOI] [PubMed] [Google Scholar]
- 43. Gustot A., Gallea J. I., Sarroukh R., Celej M. S., Ruysschaert J. M., and Raussens V. (2015) Amyloid fibrils are the molecular trigger of inflammation in Parkinson's disease. Biochem. J. 471, 323–333 [DOI] [PubMed] [Google Scholar]


