Our results highlight a common tissue sensitivity to multiple sclerosis pathologic changes for intracortical and white matter demyelination that does not manifest exclusively through established anatomical connections.
Abstract
Purpose
To investigate in vivo the spatial specificity of the interdependence between intracortical and white matter (WM) pathologic changes as function of cortical depth and distance from the cortex in multiple sclerosis (MS), and their independent contribution to physical and cognitive disability.
Materials and Methods
This study was institutional review board–approved and participants gave written informed consent. In 34 MS patients and 17 age-matched control participants, 7-T quantitative T2* maps, 3-T T1-weighted anatomic images for cortical surface reconstruction, and 3-T diffusion tensor images (DTI) were obtained. Cortical quantitative T2* maps were sampled at 25%, 50%, 75% depth from pial surface. Tracts of interest were reconstructed by using probabilistic tractography. The relationship between DTI metrics voxelwise of the tracts and cortical integrity in the projection cortex was tested by using multilinear regression models.
Results
In MS, DTI abnormal findings along tracts correlated with quantitative T2* changes (suggestive of iron and myelin loss) at each depth of the cortical projection area (P < .01, corrected). This association, however, was not spatially specific because abnormal findings in WM tracts also related to cortical pathologic changes outside of the projection cortex of the tract (P < .001). Expanded Disability Status Scale pyramidal score was predicted by axial diffusivity along the corticospinal tract (β = 4.6 × 10³; P < .001), Symbol Digit Modalities Test score by radial diffusivity along the cingulum (β = −4.3 × 10⁴; P < .01), and T2* in the cingulum cortical projection at 25% depth (β = −1.7; P < .05).
Conclusion
Intracortical and WM injury are concomitant pathologic processes in MS, which are not uniquely distributed according to a tract-cortex–specific pattern; their association may reflect a common stage-dependent mechanism.
© RSNA, 2015
An earlier incorrect version of this article appeared online. This article was corrected on September 15, 2015.
Introduction
Histopathologic and magnetic resonance (MR) studies established that cortical demyelination is frequent in multiple sclerosis (MS) (1), and may represent the pathologic substrate of disease progression (2–5). Neuropathologic and neuroimaging examinations also observed diffuse pathologic changes in the normal-appearing white matter (WM) (6) that was unrelated to focal WM lesions, associated with progressive axonal injury (7), and strongly correlated with clinical outcome measures (8,9).
Knowledge of the interdependence between cortical and WM injury in MS is elusive. Most in vivo studies that found a relationship between cortical and WM pathologic changes in MS were based on global brain measurements of tissue damage (10,11). A few in vivo studies reported a regional association between WM and gray matter degeneration in MS; however, the spatial specificity of this association was not investigated (12–15). Only one postmortem study found that degeneration in specific cortical areas and underlying normal-appearing WM demyelination followed a tract-specific pattern (16), which suggests that MS pathologic changes could spread across cortex and WM through established anatomic connections.
A reproducible surface-based (17,18) measure of T2* at 7 T (18,19) was recently developed that allows assessment of cortical integrity as a function of cortical depth from the pial surface toward the gray matter–WM boundary. Studies about histopathologic and MR imaging correlations reported increased (ie, longer) T2* in WM and cortical MS lesions, which corresponded to decreased myelin and iron content (20,21). We recently demonstrated, in a heterogeneous MS cohort, that quantitative T2* was increased at different cortical depths throughout stages of MS relative to healthy control participants, and proved to be a marker of neurologic disability more sensitive than cortical tissue loss (22).
In a subset of subjects from this MS cohort, we collected diffusion-tensor imaging (DTI) data to investigate, in vivo, the spatial specificity of the interdependence between intracortical and WM pathologic changes as function of cortical depth and distance from the cortex, and their independent contribution to physical and cognitive disability.
Materials and Methods
Patients and Study Design
All study procedures were approved by the institutional review board of our institution, and patients provided written informed consent to participate in the study. Forty-four patients with MS were prospectively enrolled after screening for inclusion and exclusion criteria between May 2010 and May 2013. Eight patients were excluded because of lack of DTI data, one patient because of the presence of tumor-like lesion, and two patients because of motion artifacts during MR imaging. Thirty-four MS patients (23 women), a subset of a previously published cohort that included 41 patients with MS (22), and included cases with clinically isolated syndrome (n = 2), relapsing remitting (n = 23), and secondary progressive MS (n = 9), and 17 control participants (including nine women) were therefore included in this study. Except for eight patients, patients with MS were on stable treatment (ie, at least 6 months) with disease-modifying therapies. Inclusion criteria were diagnosis of clinically isolated syndrome or clinically defined MS, age between 18 and 60 years, no relapses in the past 3 months, and no steroid treatment in the month before enrollment in the study. Exclusion criteria were significant psychiatric and/or neurologic disease (other than MS for patients), major medical comorbidity, pregnancy, and contraindications for MR imaging.
In patients with MS, we assessed neurologic disability by using the Expanded Disability Status Scale (23) by certified neurologists (R.P.K., J.A.S., M.D.G., A.S.N.) and attention and information processing speed by using the Symbol Digit Modalities Test (SDMT; performed by N.M.) within a week of imaging.
MR Imaging Data Acquisition
All patients underwent two examinations 1 week apart: one examination was performed with a 32-channel-coil 3-T imager (Tim Trio; Siemens, Erlangen, German) and the other was performed with a 32-channel-coil 7-T (Siemens) imager. Sequences acquired at 3 T included a three-dimensional magnetization-prepared rapid acquisition with multiple gradient echoes examination for cortical surface reconstruction and coregistration with 7-T data and a diffusion-weighted spin-echo echo-planar examination. Sequences acquired at 7 T included a multiecho two-dimensional fast low-angle shot T2*-weighted spoiled gradient-echo (GRE) pulse sequence to generate quantitative T2* maps, a single-echo two-dimensional fast low-angle shot T2*-weighted spoiled GRE pulse sequence for WM lesion segmentation, and a T1-weighted three-dimensional magnetization-prepared rapid acquisition gradient echo for coregistration purposes. Specifics of imaging sequences are presented in Appendix E1 (online).
MR Imaging Data Processing
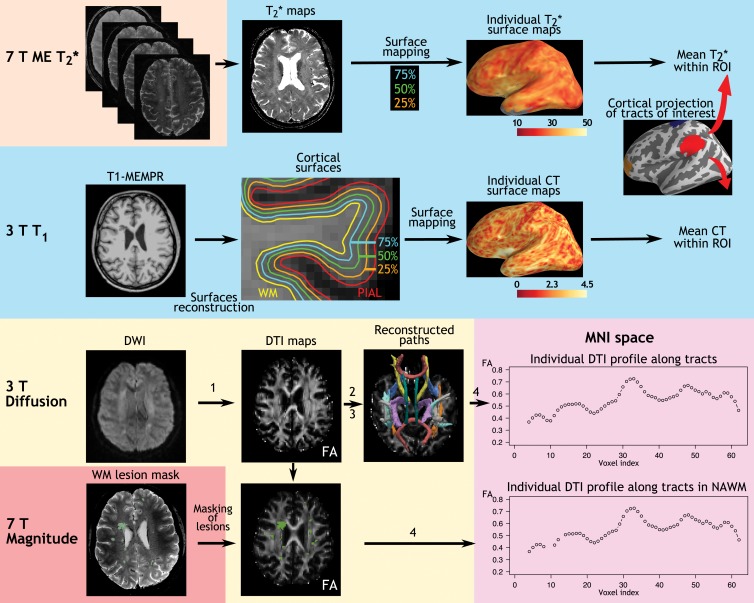
An overview of imaging processing is summarized in Figure 1.
Figure 1:
Imaging analysis pipeline. The 7-T quantitative multiecho (ME) T2* cortical maps were obtained voxel-wise by using Levenberg-Marquardt nonlinear regression analysis. Anatomic 3-T magnetization-prepared rapid acquisition with multiple gradient echo (MEMPR) images were processed by using FreeSurfer to reconstruct cortical surfaces and compute cortical thickness. Quantitative T2* maps were registered to the cortical surfaces, and sampled at 25%, 50%, and 75% depths from the pial surface. Diffusion weighted images (DWIs) were processed through the four steps of Tracts Constrained by Underlying Anatomy pipeline in FreeSurfer to, 1, generate DTI metrics, including fractional anisotropy (FA), radial diffusivity, and axial diffusivity maps; 2, run probabilistic tractography; 3, generate fractional anisotropy, radial diffusivity, and axial diffusivity profiles along WM paths in a patient’s native space; and, 4, to realign paths on the Montreal Neurologic Institute (MNI) template and generate fractional anisotropy, radial diffusivity, axial diffusivity profiles for group statistics. CT = cortical thickness, NAWM = normal-appearing WM, ROI = region of interest.
Cortical metrics.—Intracortical quantitative T2* mapped at different cortical depths and cortical thicknesses were used as measures of cortical integrity.
Pial and WM surfaces and cortical thickness maps were generated by using software (FreeSurfer version 5.3.0; http://surfer.nmr.mgh.harvard.edu/), which was previously detailed (24) in 3-T anatomic examinations. The pipeline for surface reconstruction from 7 T is not optimal because of large B1 inhomogeneities (25). Topologic defects in cortical surfaces because of WM and leukocortical lesions were corrected by using a semiautomated procedure with a lesion inpainting method (performed by C.L., S.T.G., C.G., C.M., with 7, 5, 3, and 15 years of experience in imaging analysis, respectively).
Mean cortical thickness (in millimeters) was estimated for the whole brain and within regions of interest for each hemisphere (the tract cortical projection area, as further described).
Intracortical quantitative T2* maps (in milliseconds) were estimated from 7-T fast low-angle shot multiecho T2* images in each patient and registered onto the corresponding 3 T cortical surfaces as previously detailed (18,19,22). Quantitative T2* was sampled at 25%, 50%, and 75% depth from the pial surface (0% depth) to the gray matter–WM boundary (100% depth) over the entire surface and within regions of interest for each hemisphere (the tract cortical projection area will be further described in this article). We used an equidistant model for sampling quantitative T2* within the cortex because of its excellent reproducibility (18) and because it was comparable to equivolume modeling on in vivo data with spatial resolution similar to that used in our study (26).
WM metrics.—WM lesions were segmented (C.L., C.G.) on magnitude images from 7-T single-echo fast low-angle shot T2* examinations with a semiautomated method (3D Slicer, version 4.2.0; http://www.slicer.org) by using the information of coregistered 3-T T2 images or FLAIR images to check for accuracy of lesion segmentation. WM lesion volume was computed on the whole brain and within tracts of interest by using FMRIB Software Library (FSL, http://fsl.fmrib.ox.ac.uk/fsl/fslwiki/FSL).
DTI images were processed by using Tracts Constrained by Underlying Anatomy tool (FreeSurfer) (27,28), detailed in Appendix E1 (online), to obtain WM and normal-appearing WM diffusion metrics, including fractional anisotropy, axial diffusivity, and radial diffusivity along the following four tracts: the corticospinal tract, the anterior thalamic radiation, the parietal branch of the superior longitudinal fasciculus, and the cingulum.
The identification of cortical projection area of WM tracts is detailed in Appendix E1 (online).
Statistics
Demographics and global MR imaging metrics.—Demographics were compared between patients and controls by using Mann-Whitney U test or χ2 test for sex repartition. We used an analysis of variance controlled for age and sex to compare global cortical thickness and cortical T2* between patients and controls. All statistical analyses were performed with software (R statistical package, version 2.13.1; R Project for Statistical Computing; www.r-project.org). P values < .05 were considered statistically significant.
Surface-based statistics.—A general linear model was used in FreeSurfer to assess vertex-wise differences in cortical thickness and quantitative T2* at each depth from the pial surface (at 25%, 50%, and 75%) between patients and control participants. Before surface-based analyses, we smoothed quantitative T2* surfaces and cortical thickness surfaces by using, respectively, a 5-mm full width at half maximum Gaussian kernel and a 10-mm full width at half maximum Gaussian kernel. Individual surfaces were registered to the surface template “fsaverage” in FreeSurfer. Age and sex were included as adjustment variables in general linear model analyses. We applied a clusterwise correction for multiple comparisons by using a Monte Carlo simulation with 10 000 iterations.
Tract-based statistics.—We used linear regression models for the following reasons: to assess voxel-wise differences in WM axial diffusivity, radial diffusivity, and fractional anisotropy along tracts of interest between patients and controls; and to correlate voxel-wise WM DTI metrics along each tract of interest against markers of cortical integrity (ie, cortical thickness, and quantitative T2* at 25%, 50%, and 75% depth from pial surface) in the corresponding cortical area of projection of the tract. Age, sex, and total motion index, computed for each patient on the basis of the four motion measures from Tracts Constrained by Underlying Anatomy (27), were included as adjustment variables. To assess whether the relationship between cortical and WM pathologic changes was spatially specific, we also investigated the correlation between DTI metrics along all four tracts of interest and markers of cortical integrity in regions on which the tracts did not project.
For tract-based analyses, values from left and right hemispheres were pooled together. P values along the tracts were corrected for multiple comparisons by using false discovery rate (29) and P values less than .05 were indicative of statistical significance.
Relationship between clinical scores and cortical and WM metrics.—The relative contribution of WM and cortical tissue injury to clinical metrics (Expanded Disability Status Scale pyramidal functional subscore and SDMT scores) was assessed with stepwise multilinear regression by using the Akaike Information Criterion (stepAIC function in R statistical package; R Project for Statistical Computing). Univariate analyses were first performed to investigate the relationship between fractional anisotropy, axial diffusivity, radial diffusivity along the corticospinal tract, and cortical thickness and quantitative T2* in corticospinal tract cortical projection area and pyramidal score; and between fractional anisotropy, axial diffusivity, radial diffusivity along the cingulum, and cortical thickness and quantitative T2* in the cingulum projection area and SDMT scores. We focused on the cingulum and its cortical projection (cingulate cortex) damage as possible surrogates of SDMT impairment on the basis of previous findings that highlighted these structures as key brain regions linked to impairment of processing speed functions in MS (30–32).
Only MR imaging metrics that exhibited a statistically significant correlation with Expanded Disability Status Scale pyramidal and SDMT scores at univariate analysis were included in the multilinear regression model as candidate independent variables. Age, sex, and total motion index were included as adjustment variables.
Results
Demographics
Demographics of the patients and clinical and imaging characteristics are reported in Table 1. Age and sex ratio were not statistically different between patients with MS and control participants.
Table 1.
Demographic, Clinical, and MR Imaging Characteristics of Patients
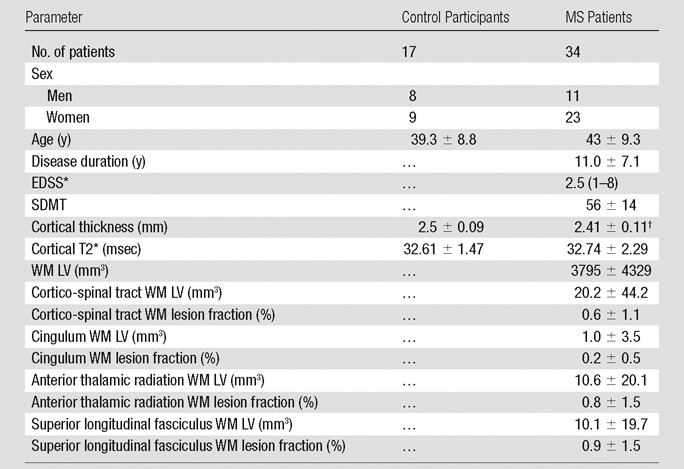
Note.—Data are mean ± standard deviation except where otherwise indicated. EDSS = Expanded Disability Status Scale, LV = lesion volume.
*Data are median with range in parentheses.
†P < .005 between MS and control participants, corrected for age.
Cortical Thickness and T2* Changes in MS Patients Relative to Control Participants
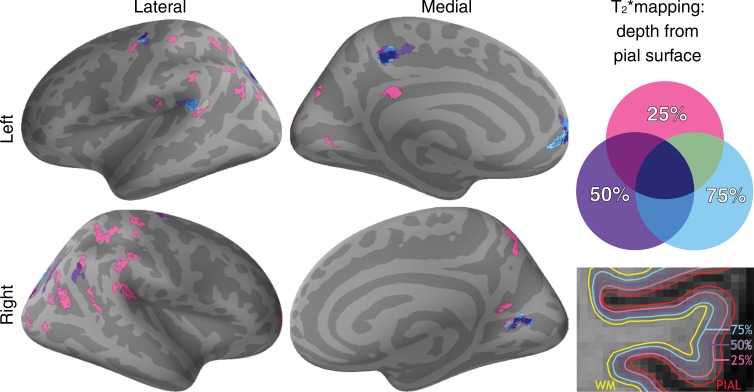
MS patients had decreased mean cortical thickness relative to control participants in the whole brain (P < .005) and in cortical projection regions of the corticospinal tract (mean cortical thickness for MS patients and control participants, respectively, 2.32 mm ± 0.25 [standard deviation] and 2.51 mm ± 0.2) and superior longitudinal fasciculus (mean cortical thickness for MS patients and control participants, respectively, 2.43 mm ± 0.15 and 2.55 mm ± 0.13; P < .001). The general linear model analysis, however, did not reveal vertex-wise cortical thickness differences between the two groups after correction for multiple comparisons. Whole-brain mean cortical quantitative T2* at each depth was not different between the two groups. The regional analysis, however, disclosed several clusters of longer quantitative T2* in MS patients relative to control participants mainly located in the outer cortical layers at 25% depth, and overlapping with the cortical projection areas of the tracts of interest (Fig 2; Table 2). Clusters of longer quantitative T2* in MS patients relative to control participants were not substantially modified when cortical thickness was added as the adjustment variable at the vertex level in the general linear model.
Figure 2:
Overlay of the general linear model significance maps (P < .05, corrected for multiple comparisons) shows clusters of increased cortical T2* in 34 patients with MS relative to 17 healthy control participants at 25%, 50%, and 75% depth from the pial surface. Age and sex were included as adjustment variables.
Table 2.
Regional Analysis of Longer Quantitative T2* in MS Patients
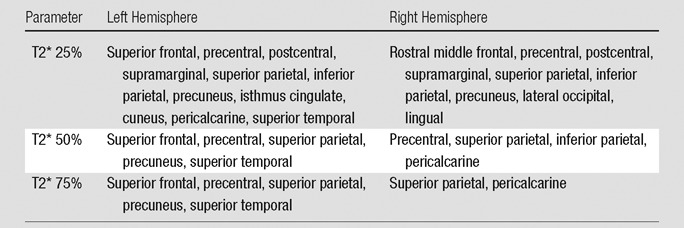
Note.—Table shows the location of clusters in MS patients who exhibited a significantly increased 7-T T2* at various percentage depths from the pial surface compared with control participants. P < .05, corrected.
DTI Differences in WM along the Tracts in MS Patients Relative to Control Participants
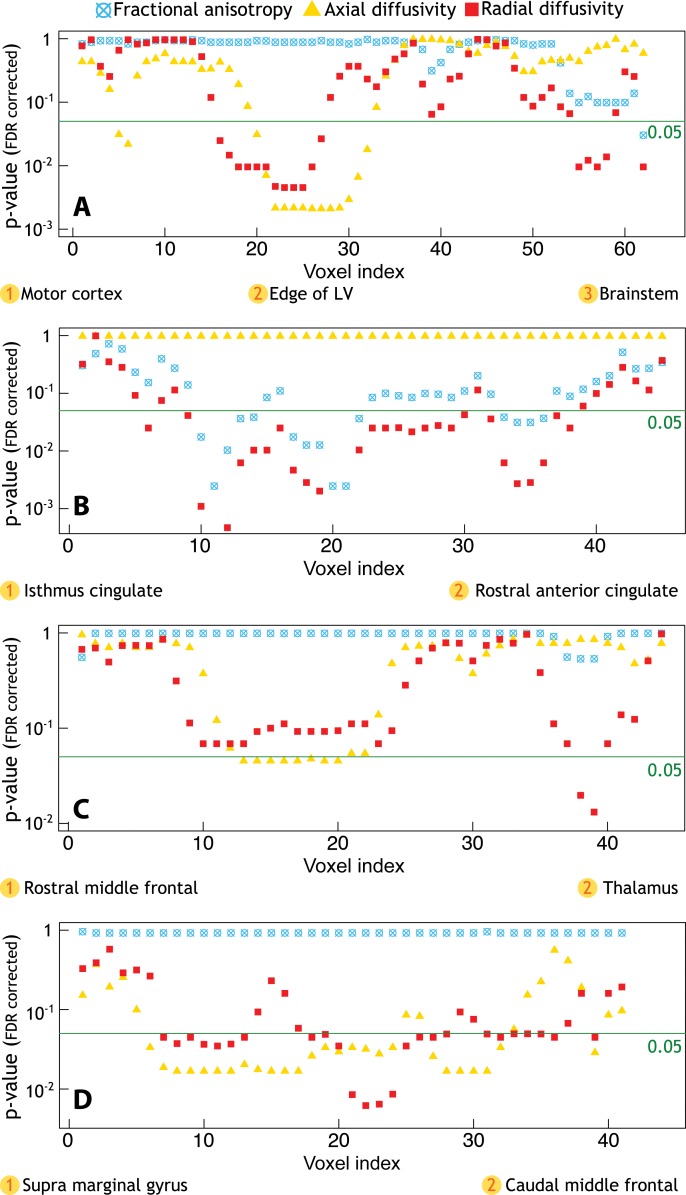
MS patients exhibited reduced WM integrity relative to control participants in all tracts of interest. All P values are reported in Figure 3. With the exception of the uncinate fasciculus, we also found widespread DTI abnormal findings in additional WM tracts available within the Tracts Constrained by Underlying Anatomy pipeline and outside the four main tracts of interest (Fig E2 [online]).
Figure 3:
Profiles of P values along WM tracts of interest obtained from linear regression models that tested differences in fractional anisotropy, radial diffusivity, and axial diffusivity between 34 patients with MS and 17 healthy control participants. Age, sex, and total movement index were included as adjustment variables. A, There was a significant increase in axial diffusivity and radial diffusivity along the corticospinal tract, mainly located in the portion of the tract close to the edge of the lateral ventricles (LV), and in the distal portion within the brainstem. B, Additionally, MS patients exhibited relative to controls a diffuse increase in radial diffusivity and decrease in fractional anisotropy along the entire cingulum, C, a significant increase in axial diffusivity and radial diffusivity along the anterior thalamic radiation, mainly in the proximal portion and in the portion closest to the thalamus, and, D, a diffuse increase in axial diffusivity and radial diffusivity along the entire superior longitudinal fasciculus. FDR = false discovery rate.
Correlation between WM Injury along the Tracts and Cortical Pathologic Changes
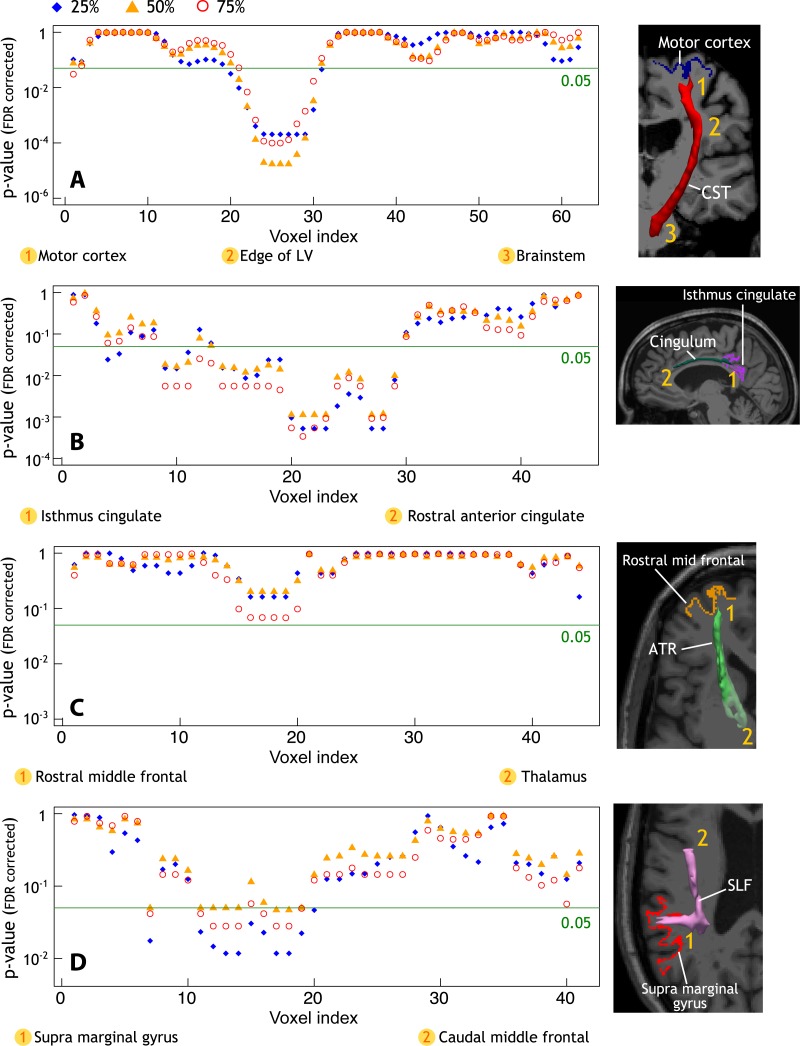
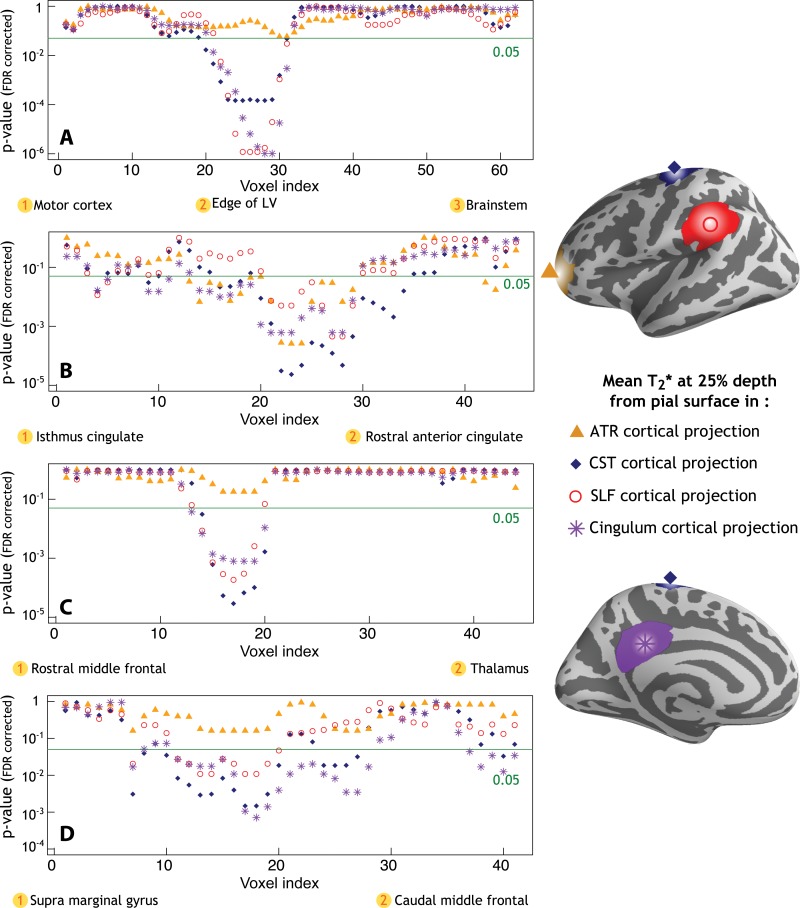
In MS, DTI abnormal findings in each tract of interest correlated with longer quantitative T2* in the corresponding cortical projection area (Fig 4), but it was not correlated with cortical thickness. Increased axial diffusivity in the proximal part of the corticospinal tract (close to cortex) correlated with longer quantitative T2* at each depth of its cortical projection area (P < .001), located mainly in the precentral gyrus. Radial diffusivity in the proximal and middle portions of the cingulum bundle, closest to the isthmus cingulate cortex, correlated positively with quantitative T2* at each depth of the projection cortex (P < .001). In the same portions of the cingulum, fractional anisotropy also negatively correlated with quantitative T2* in the projection cortex (data not shown). There was a trend toward statistical significance between radial diffusivity in the proximal portion of the anterior thalamic radiation and quantitative T2* at 75% depth from pial surface in the projection area, mainly the rostral middle frontal cortex. Finally, radial diffusivity in the proximal portion of the superior longitudinal fasciculus (ie, close to its cortical projection in the supramarginal gyrus) correlated positively with quantitative T2* at 25%, 50%, and 75% depth from pial surface in the projection cortex (P < .05).
Figure 4:
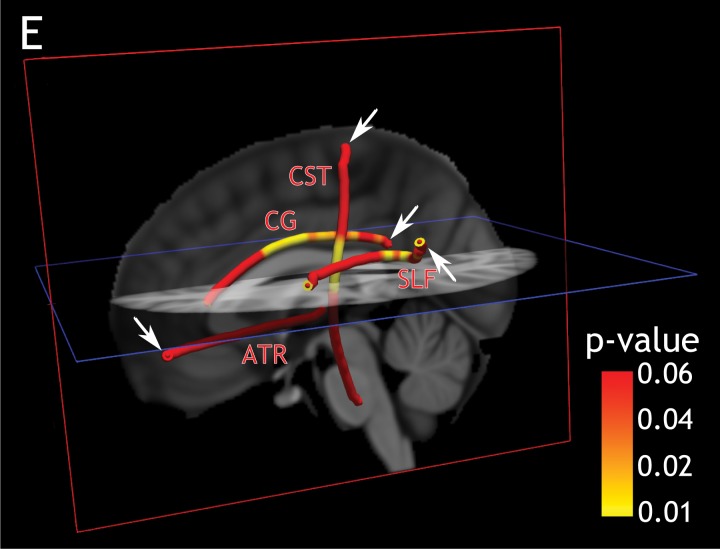
A–D, Profiles of P values along WM tracts of interest. Age, sex, and total movement index were included as adjustment variables in all analyses. Graphs showing profile of P values in 34 patients with MS and WM tracts of interest obtained from linear regression models show a positive correlation between cortical T2* in the, A, motor cortex and axial diffusivity along the corticospinal tract (CST), B, isthmus cingulate cortex and radial diffusivity along the cingulum, C, rostral middle frontal cortex and radial diffusivity along the anterior thalamic radiation (ATR), and D, supra marginal gyrus and radial diffusivity along the superior longitudinal fasciculus (SLF). FDR = false discovery rate, LV = lateral ventricle. E, Three-dimensional view of the brain and the corresponding P values along WM tracts as reported in parts A, B, C, and D (T2* at 25% depth from pial surface, arrows indicate the endpoint of tracts corresponding to cortical region of interest).
The results did not substantially change when voxels of the tracts that colocalized with visible WM lesions were removed from the statistical analysis (Fig E3 [online]).
The relationship between intracortical quantitative T2* and DTI metrics in underlying WM tracts was not spatially specific. Longer quantitative T2*, regardless of the tested cortical area, was associated with increased axial diffusivity and radial diffusivity along the four tracts of interest (Fig 5), and with decreased fractional anisotropy along the cingulum (data not shown). Our results did not substantially change by excluding WM lesions along the tracts (Fig E4 [online]).
Figure 5:
Profiles of P values along tracts of interest obtained from linear regression models that show in 34 patients with MS a positive correlation between diffusion imaging metrics, including, A, axial diffusivity along the corticospinal tract (CST) and cortical T2*, B, radial diffusivity along the cingulum and cortical T2*, C, radial diffusivity along the anterior thalamic radiation (ATR) and cortical T2*, and D, radial diffusivity along the superior longitudinal fasciculus (SLF) and cortical T2*. LV = lateral ventricle.
We did not find any correlation between DTI metrics along the tracts and cortical quantitative T2* or cortical thickness in the control group.
Relationship between Tissue Injury and Clinical Disability
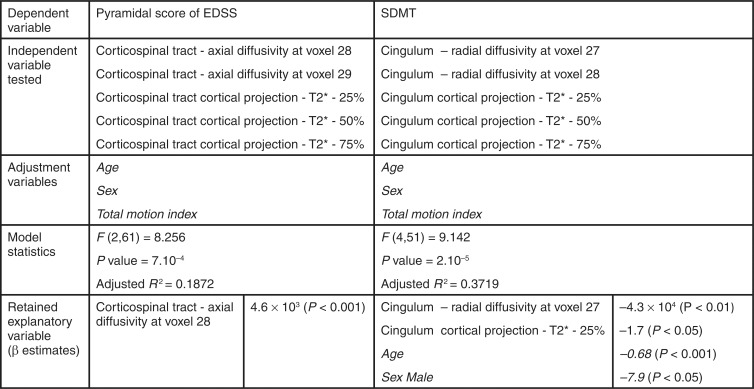
Axial diffusivity in the proximal portion of the corticospinal tract (voxel indices 28 and 29, as presented in graphs in Figs 3–5) was the only DTI significant correlate of pyramidal functional subscore with univariate analysis (P = .01). Quantitative T2* at each depth of the cortical projection area of the corticospinal tract (mainly precentral gyrus) correlated positively with pyramidal subscore (P < .01), but cortical thickness did not. We included axial diffusivity from the proximal portion of the corticospinal tract and quantitative T2* from the corticospinal tract cortical projection area in a stepwise multilinear regression model to predict the pyramidal Expanded Disability Status Scale subscore in our population. In this final model, axial diffusivity remained the unique explanatory variable for Expanded Disability Status Scale pyramidal subscore (Fig 6).
Figure 6:
Imaging predictors of pyramidal functional subscore of EDSS and SDMT with multiple linear regression analysis in patients with MS. Only imaging parameters that correlated with the clinical variable at univariate analysis were used as candidate independent variable in multiple stepwise linear regression model. The retained explanatory variables are displayed with β estimates. Adjustment variables retained in the model are listed in italics. Voxel location along the tracts refers to voxel index as presented in Figure 3, 4, and 5.
Along the cingulum, radial diffusivity in the middle portion of the tract (voxel index 27 and 28, referenced in Figs 3–5) was the strongest correlate of SDMT (P = .02). Quantitative T2* at the three depths within the cingulum cortical projection area (mainly isthmus cingulate) correlated negatively with SDMT (P = .001 at 25% and P = .02 at 50% and 75%), but cortical thickness did not. The stepwise regression model to predict SDMT included radial diffusivity from the middle portion of the cingulum and quantitative T2* from the cingulum cortical projection. Radial diffusivity and quantitative T2* at 25% depth remained both explanatory variables for SDMT (Fig 6).
Discussion
Our results highlight a common tissue sensitivity to MS pathologic changes for intracortical and WM demyelination, which does not manifest exclusively through established anatomic connections. Patients with MS exhibited diffuse cortical pathologic changes reflected by longer T2*, which has been found to be associated predominantly with myelin (33) and nonheme iron content (34,35). Longer quantitative T2* in patients with MS than in control participants likely reflects intracortical myelin and/or iron loss.
The voxel-wise DTI analysis along WM tracts displayed several areas of altered tract integrity in MS, which were diffusively distributed along the cingulum and superior longitudinal fasciculus, while mainly localized in the upper and distal (brainstem) portions of corticospinal tract. The anterior thalamic radiation was preferentially affected in its posterior portion, near the thalamus. The lack of uniformity of pathologic changes along WM tracts might be explained by coexistence of multiple disease-related mechanisms of tissue pathologic changes in nearby tract portions, including demyelination, inflammation, edema, and remyelination.
In our MS cohort, cortical thickness was not associated with WM pathologic changes along the tracts, which were assessed with DTI. Conversely, quantitative T2* proved to be a more sensitive measure than cortical thickness for testing the link between intracortical pathologic changes and underlying WM injury. This highlights that consideration of spatial variation of tissue integrity measures can greatly improve the ability of finding MS-related pathologic changes. For three of the four tested tracts and their corresponding projection cortex, there was a significant association between cortical quantitative T2* at all three cortical depths and DTI abnormal findings in the proximal portion of the underlying connected tracts. We found, however, that the relationship between cortical and WM was not strictly spatially specific to the tract-cortex pair, and instead, DTI abnormal findings along the tracts correlated positively with intracortical quantitative T2* independently from its location. Interestingly, we also found that intracortical and WM tract pathologic changes, despite being strongly associated, independently contributed to clinical outcome metrics in MS. Combination of imaging metrics that reflect both WM and cortex pathologic changes may prove useful to better predict disease severity.
Although, at least in some areas, cortical demyelination could drive pathologic changes in underlying connected WM regions or vice versa, the lack of spatial specificity between cortical and DTI metrics weakens the hypothesis of a tract-driven degenerative process as the main pathogenic mechanism that links WM and cortical degeneration in MS. The widespread significant association between cortical and underlying WM pathologic changes in our MS cohort may reflect concomitant tissue damage. Neuropathologic observations reported an association between cortical demyelination and WM pathologic changes, reflected by diffuse axonal injury, which occurred on a background of global brain inflammation with microglia activation (7). This finding was interpreted as expression of a stage-dependent common pathogenetic pathway of cortical and WM injury, rather than a true interdependence. Further neuropathologic studies led to the hypothesis that cortical inflammation and demyelination in MS may be triggered through the activation of microglia by soluble factors originating from meningeal B-lymphocytes follicle-like structures located mainly in the sulci (5). The proximity of periventricular WM to corticospinal fluid may render this area also susceptible to proinflammatory soluble factors because corticospinal fluid velocity is lowest near the wall of ventricles (36). In vivo positron emission tomographic imaging with 11C-PK11195, a tracer for activated microglia and macrophages, demonstrated increased 11C-PK11195 uptake in periventricular normal-appearing WM of MS patients relative to control participants (37). Interestingly, we found an association between intracortical pathologic changes across several cortical regions and the periventricular portion of the corticospinal tract, which could reflect concomitant pathophysiologic mechanisms driven by diffuse inflammation, without being directly spatially linked one to each other. Another explanation could be that remyelination and repair capacities, known to occur both in the cortex and in the WM (38,39), may be exceeded in cortical and WM regions not necessarily spatially connected.
Some limitations apply to this study. Our results are cross-sectional, and longitudinal evaluations are needed to confirm our observations. Because of the relatively small sample size of our MS cohort, our findings need to be reproduced in larger MS populations. Additionally, because longer T2* could reflect either myelin or iron loss, or both, it would be helpful to combine MR imaging sequences sensitive to myelin content, such as magnetization transfer imaging and T1 mapping, or to iron content, such as quantitative susceptibility mapping, to increase the pathologic specificity to the observed cortical abnormal findings in MS.
Future studies will assess the role of ongoing inflammation in the pathophysiologic mechanisms that link diffuse cortical and WM injury in MS.
Advances in Knowledge
■ In patients with multiple sclerosis (MS), diffusion tensor imaging (DTI) abnormal findings in white matter (WM) tracts, including the corticospinal tract, cingulum, and superior longitudinal fasciculus, correlated with longer T2* at 7-T MR imaging measured at different depths of the cortex in the projection area of the tracts (P < .01), but not with cortical thickness.
■ DTI abnormal findings in each tract of interest were also related with T2* changes in cortical regions outside the cortical projection area of the WM tract (P < .001).
■ A multivariate model determined that, in the MS cohort, the Expanded Disability Status Scale pyramidal score was predicted by axial diffusivity along corticospinal tract (P < .001), while Symbol Digit Modalities Test score was predicted both by radial diffusivity along the cingulum (P < .01) and by T2* at 25% depth from the pial surface in the cortical projection of the cingulum (P < .05).
Implications for Patient Care
■ Imaging tools able to assess intracortical pathologic changes as a function of cortical depth are more sensitive than measures of global cortical tissue damage for investigating the relationship between cortical and WM pathologic changes in MS.
■ The relationship between intracortical and WM injury is not uniquely distributed according to a tract-cortex–specific pattern.
■ Intracortical- and WM-localized pathologic processes contribute independently to clinical outcome measures in MS, which supports the use of regional assessments of WM and intracortical damage to monitor disease progression.
APPENDIX
SUPPLEMENTAL FIGURES
Acknowledgments
Acknowledgments
We thank Mary T. O’Hara for technical assistance during imaging, Dr Anastasia Yendiki for technical advice on the Tracts Constrained by Underlying Anatomy pipeline, Noreen Ward for helping to edit the manuscript, and Dr David Louapre for assistance on statistical analysis.
Received February 26, 2015; revision requested April 23; revision received May 14; accepted May 28; final version accepted June 11.
Supported by the National MS Society (grant NMSS 4281-RG-A1) and the Claflin Award. C.L. supported by a fellowship from ARSEP. C.G. supported by FISM training fellowship 2012/B/4. J.C.A. supported by NMSS FG 1892-A1, FRQS (Canada), QBIN (Canada), and NSERC (Canada). M.G. supported by a Biogen IDEC Clinical Fellowship in Multiple Sclerosis.
Funding: This research was supported by the National Institutes of Health (grants R01NS078322-01-A1, NCRR P41-RR14075, and 5T32NS51151-5).
An earlier incorrect version of this article appeared online. This article was corrected on September 15, 2015
Disclosures of Conflicts of Interest: C.L Activities related to the present article: author’s institution received money from a fellowship from Association pour la Recherche sur la Sclérose en Plaques Foundation. Activities not related to the present article: disclosed no relevant relationships. Other relationships: disclosed no relevant relationships. S.T.G. disclosed no relevant relationships. C.G. Activities related to the present article: author received money from a grant from Fondazione Italiana Sclerosi Multipla. Activities not related to the present article: disclosed no relevant relationships. Other relationships: disclosed no relevant relationships. J.C.A. disclosed no relevant relationships. M.D.G. Activities related to the present article: author received a grant from Biogen Idec. Activities not related to the present article: author owns stock in Pfizer and Abbott Labs. Other relationships: disclosed no relevant relationships. A.S.N. disclosed no relevant relationships. N.M. Activities related to the present article: author and author’s institution received money from a grant from Beth Israel Deaconess Medical Center. Activities not related to the present article: disclosed no relevant relationships. Other relationships: disclosed no relevant relationships. J.A.S. disclosed no relevant relationships. R.P.K. Activities related to the present article: disclosed no relevant relationships. Activities not related to the present article: author receives money for scientific consultation from Genzyme and Biogen. Other relationships: disclosed no relevant relationships. C.M. disclosed no relevant relationships.
Abbreviations:
- DTI
- diffusion-tensor imaging
- GRE
- gradient echo
- MS
- multiple sclerosis
- SDMT
- Symbol Digit Modalities Test
- WM
- white matter
References
- 1.Filippi M, Evangelou N, Kangarlu A, et al. Ultra-high-field MR imaging in multiple sclerosis. J Neurol Neurosurg Psychiatry 2014;85(1):60–66. [DOI] [PubMed] [Google Scholar]
- 2.Nielsen AS, Kinkel RP, Madigan N, Tinelli E, Benner T, Mainero C. Contribution of cortical lesion subtypes at 7T MRI to physical and cognitive performance in MS. Neurology 2013;81(7):641–649. [DOI] [PMC free article] [PubMed] [Google Scholar]
- 3.Calabrese M, Poretto V, Favaretto A, et al. Cortical lesion load associates with progression of disability in multiple sclerosis. Brain 2012;135(Pt 10):2952–2961. [DOI] [PubMed] [Google Scholar]
- 4.Kutzelnigg A, Lassmann H. Cortical demyelination in multiple sclerosis: a substrate for cognitive deficits? J Neurol Sci 2006;245(1-2):123–126. [DOI] [PubMed] [Google Scholar]
- 5.Magliozzi R, Howell O, Vora A, et al. Meningeal B-cell follicles in secondary progressive multiple sclerosis associate with early onset of disease and severe cortical pathology. Brain 2007;130(Pt 4):1089–1104. [DOI] [PubMed] [Google Scholar]
- 6.Cercignani M, Bozzali M, Iannucci G, Comi G, Filippi M. Magnetisation transfer ratio and mean diffusivity of normal appearing white and grey matter from patients with multiple sclerosis. J Neurol Neurosurg Psychiatry 2001;70(3):311–317. [DOI] [PMC free article] [PubMed] [Google Scholar]
- 7.Kutzelnigg A, Lucchinetti CF, Stadelmann C, et al. Cortical demyelination and diffuse white matter injury in multiple sclerosis. Brain 2005;128(Pt 11):2705–2712. [DOI] [PubMed] [Google Scholar]
- 8.Roosendaal SD, Geurts JJ, Vrenken H, et al. Regional DTI differences in multiple sclerosis patients. Neuroimage 2009;44(4):1397–1403. [DOI] [PubMed] [Google Scholar]
- 9.Dineen RA, Vilisaar J, Hlinka J, et al. Disconnection as a mechanism for cognitive dysfunction in multiple sclerosis. Brain 2009;132(Pt 1):239–249. [DOI] [PubMed] [Google Scholar]
- 10.Steenwijk MD, Daams M, Pouwels PJ, et al. What explains gray matter atrophy in long-standing multiple sclerosis? Radiology 2014;272(3):832–842. [DOI] [PubMed] [Google Scholar]
- 11.Mistry N, Abdel-Fahim R, Mougin O, Tench C, Gowland P, Evangelou N. Cortical lesion load correlates with diffuse injury of multiple sclerosis normal appearing white matter. Mult Scler 2014;20(2):227–233. [DOI] [PubMed] [Google Scholar]
- 12.Gorgoraptis N, Wheeler-Kingshott CA, Jenkins TM, et al. Combining tractography and cortical measures to test system-specific hypotheses in multiple sclerosis. Mult Scler 2010;16(5):555–565. [DOI] [PMC free article] [PubMed] [Google Scholar]
- 13.Jehna M, Langkammer C, Khalil M, et al. An exploratory study on the spatial relationship between regional cortical volume changes and white matter integrity in multiple sclerosis. Brain Connect 2013;3(3):255–264. [DOI] [PubMed] [Google Scholar]
- 14.Bodini B, Khaleeli Z, Cercignani M, Miller DH, Thompson AJ, Ciccarelli O. Exploring the relationship between white matter and gray matter damage in early primary progressive multiple sclerosis: an in vivo study with TBSS and VBM. Hum Brain Mapp 2009;30(9):2852–2861. [DOI] [PMC free article] [PubMed] [Google Scholar]
- 15.Steenwijk MD, Daams M, Pouwels PJ, et al. Unraveling the relationship between regional gray matter atrophy and pathology in connected white matter tracts in long-standing multiple sclerosis. Hum Brain Mapp 2015;36(5):1796–1807. [DOI] [PMC free article] [PubMed] [Google Scholar]
- 16.Kolasinski J, Stagg CJ, Chance SA, et al. A combined post-mortem magnetic resonance imaging and quantitative histological study of multiple sclerosis pathology. Brain 2012;135(Pt 10):2938–2951. [DOI] [PMC free article] [PubMed] [Google Scholar]
- 17.Cohen-Adad J, Benner T, Greve D, et al. In vivo evidence of disseminated subpial T2* signal changes in multiple sclerosis at 7 T: a surface-based analysis. Neuroimage 2011;57(1):55–62. [DOI] [PMC free article] [PubMed] [Google Scholar]
- 18.Govindarajan ST, Cohen-Adad J, Sormani MP, Fan AP, Louapre C, Mainero C. Reproducibility of T2 * mapping in the human cerebral cortex in vivo at 7 tesla MRI. J Magn Reson Imaging 2014 Nov 19. [Epub ahead of print] [DOI] [PMC free article] [PubMed] [Google Scholar]
- 19.Cohen-Adad J, Polimeni JR, Helmer KG, et al. T₂* mapping and B₀ orientation-dependence at 7 T reveal cyto- and myeloarchitecture organization of the human cortex. Neuroimage 2012;60(2):1006–1014. [DOI] [PMC free article] [PubMed] [Google Scholar]
- 20.Yao B, Hametner S, van Gelderen P, et al. 7 Tesla magnetic resonance imaging to detect cortical pathology in multiple sclerosis. PLoS ONE 2014;9(10):e108863. [DOI] [PMC free article] [PubMed] [Google Scholar]
- 21.Yao B, Bagnato F, Matsuura E, et al. Chronic multiple sclerosis lesions: characterization with high-field-strength MR imaging. Radiology 2012;262(1):206–215. [DOI] [PMC free article] [PubMed] [Google Scholar]
- 22.Mainero C, Louapre C, Govindarajan ST, et al. A gradient in cortical pathology in multiple sclerosis by in vivo quantitative 7 T imaging. Brain 2015;138(Pt 4):932–945. [DOI] [PMC free article] [PubMed] [Google Scholar]
- 23.Kurtzke JF. Rating neurologic impairment in multiple sclerosis: an expanded disability status scale (EDSS). Neurology 1983;33(11):1444–1452. [DOI] [PubMed] [Google Scholar]
- 24.Fischl B, Dale AM. Measuring the thickness of the human cerebral cortex from magnetic resonance images. Proc Natl Acad Sci U S A 2000;97(20):11050–11055. [DOI] [PMC free article] [PubMed] [Google Scholar]
- 25.Fujimoto K, Polimeni JR, van der Kouwe AJ, et al. Quantitative comparison of cortical surface reconstructions from MP2RAGE and multi-echo MPRAGE data at 3 and 7 T. Neuroimage 2014;90:60–73. [DOI] [PMC free article] [PubMed] [Google Scholar]
- 26.Waehnert MD, Dinse J, Weiss M, et al. Anatomically motivated modeling of cortical laminae. Neuroimage 2014;93(Pt 2):210–220. [DOI] [PubMed] [Google Scholar]
- 27.Yendiki A, Koldewyn K, Kakunoori S, Kanwisher N, Fischl B. Spurious group differences due to head motion in a diffusion MRI study. Neuroimage 2013;88C:79–90. [DOI] [PMC free article] [PubMed] [Google Scholar]
- 28.Yendiki A, Panneck P, Srinivasan P, et al. Automated probabilistic reconstruction of white-matter pathways in health and disease using an atlas of the underlying anatomy. Front Neuroinform 2011;5:23. [DOI] [PMC free article] [PubMed] [Google Scholar]
- 29.Genovese CR, Lazar NA, Nichols T. Thresholding of statistical maps in functional neuroimaging using the false discovery rate. Neuroimage 2002;15(4):870–878. [DOI] [PubMed] [Google Scholar]
- 30.Mesaros S, Rocca MA, Kacar K, et al. Diffusion tensor MRI tractography and cognitive impairment in multiple sclerosis. Neurology 2012;78(13):969–975. [DOI] [PubMed] [Google Scholar]
- 31.Rocca MA, Absinta M, Amato MP, et al. Posterior brain damage and cognitive impairment in pediatric multiple sclerosis. Neurology 2014;82(15):1314–1321. [DOI] [PubMed] [Google Scholar]
- 32.Louapre C, Perlbarg V, García-Lorenzo D, et al. Brain networks disconnection in early multiple sclerosis cognitive deficits: an anatomofunctional study. Hum Brain Mapp 2014;35(9):4706–4717. [DOI] [PMC free article] [PubMed] [Google Scholar]
- 33.Stüber C, Morawski M, Schäfer A, et al. Myelin and iron concentration in the human brain: a quantitative study of MRI contrast. Neuroimage 2014;93(Pt 1):95–106. [DOI] [PubMed] [Google Scholar]
- 34.Langkammer C, Krebs N, Goessler W, et al. Susceptibility induced gray-white matter MRI contrast in the human brain. Neuroimage 2012;59(2):1413–1419. [DOI] [PMC free article] [PubMed] [Google Scholar]
- 35.Fukunaga M, Li TQ, van Gelderen P, et al. Layer-specific variation of iron content in cerebral cortex as a source of MRI contrast. Proc Natl Acad Sci U S A 2010;107(8):3834–3839. [DOI] [PMC free article] [PubMed] [Google Scholar]
- 36.Stadlbauer A, Salomonowitz E, van der Riet W, Buchfelder M, Ganslandt O. Insight into the patterns of cerebrospinal fluid flow in the human ventricular system using MR velocity mapping. Neuroimage 2010;51(1):42–52. [DOI] [PubMed] [Google Scholar]
- 37.Rissanen E, Tuisku J, Rokka J, et al. In vivo detection of diffuse inflammation in secondary progressive multiple sclerosis using PET imaging and the radioligand 11C-PK11195. J Nucl Med 2014;55(6):939–944. [DOI] [PubMed] [Google Scholar]
- 38.Chang A, Staugaitis SM, Dutta R, et al. Cortical remyelination: a new target for repair therapies in multiple sclerosis. Ann Neurol 2012;72(6):918–926. [DOI] [PMC free article] [PubMed] [Google Scholar]
- 39.Franklin RJ, Ffrench-Constant C. Remyelination in the CNS: from biology to therapy. Nat Rev Neurosci 2008;9(11):839–855. [DOI] [PubMed] [Google Scholar]
Associated Data
This section collects any data citations, data availability statements, or supplementary materials included in this article.


