

Abstract
Glutathione S-transferase (GST) genes play a protective role against oxidative stress and may influence disease risk and drug pharmacokinetics. In this study, massive multiscalar trait profiling across a large population of mice derived from a cross between C57BL/6J (B6) and DBA2/J (D2)—the BXD family—was combined with linkage and bioinformatic analyses to characterize mechanisms controlling GST expression and to identify downstream consequences of this variation. Similar to humans, mice show a wide range in expression of GST family members. Variation in the expression of Gsta4, Gstt2, Gstz1, Gsto1, and Mgst3 is modulated by local expression QTLs (eQTLs) in several tissues. Higher expression of Gsto1 in brain and liver of BXD strains is strongly associated (P < 0.01) with inheritance of the B6 parental allele whereas higher expression of Gsta4 and Mgst3 in brain and liver, and Gstt2 and Gstz1 in brain is strongly associated with inheritance of the D2 parental allele. Allele-specific assays confirmed that expression of Gsto1, Gsta4, and Mgst3 are modulated by sequence variants within or near each gene locus. We exploited this endogenous variation to identify coexpression networks and downstream targets in mouse and human. Through a combined systems genetics approach, we provide new insight into the biological role of naturally occurring variants in GST genes.
Introduction
Cellular life forms, whether autonomous or multicellular, must respond to a constant barrage of environmental and metabolic hazards [1]. Glutathione (GSH) transferase activity evolved as a common strategy to combat threats posed by oxidative stress and xenobiotics [2]. GSH is an important cellular antioxidant, signaling molecule, and cofactor [3]. It is also essential for the maintenance of a suitable redox state in mitochondria—which constantly produce damaging reactive oxygen species as a by-product of cellular respiration. Glutathione S-tranferase (GST) enzymes catalyze the conjugation of GSH to electrophilic compounds [2,4], enabling the subsequent export of these potentially harmful substances out of the cell [5,6]. Thus, GSTs play an important role in detoxification of electrophilic xenobiotics [2,7], including drugs, carcinogens, and pesticides, and in the regulation of key signaling pathways involved in apoptosis, homeostasis, and the cellular stress response [3].
The highly conserved mammalian cytosolic GST superfamily contains over a dozen cytosolic genes divided among 7 classes—alpha, mu, omega, pi, sigma, theta, and zeta [8–10]. Two additional but evolutionarily distinct family members include the soluble Kappa class and the membrane-associated proteins in eicosanoid and glutathione metabolism (MAPEG), which include the microsomal GSTs. All members participate in Phase II detoxification using GSH conjugation. Within many of the classes, additional members were created by duplication events, most occurring before mammalian orders diverged from a common ancestor [11]. As a result, most human genes have homologs in mice and both have additional species-specific paralogs [12,13]. The function of most GST homologs is conserved among mammals with different class members demonstrating specific substrate affinities, although GSTs also have unique roles in diverse biological processes potentially unrelated to detoxification (for a review see [11]).
Many members of the GST superfamily are highly polymorphic among human populations [14] and genetic variation is often associated with differences in enzymatic activity [11]. Conflicting reports of genetic associations between polymorphisms in GST genes and negative outcomes and susceptibility for various cancers or age-related neurodegenerative disorders like Alzheimer’s (AD) and Parkinson’s disease (PD) [15] have been reported in both the overall population and different ethnic groups. This includes polymorphisms in GSTM1 or GSTT1 found to be associated with prostate cancer [16,17], acute myeloid leukemia [18], or gastric cancer [19]. In addition, polymorphisms in GSTP1, GSTT1, GSTM1, or GSTO1 are associated with risk of PD after pesticide exposure [20–23], increase in PD risk [24], AD risk [25,26] or AD age of onset [27–30], respectively. Despite reproducibility issues inherent in most human association and linkage studies, variation in enzyme activity among human populations could lead to differences in drug response, apoptotic cell signaling pathways, or susceptibility to oxidative stress, and further analysis is warranted.
Here we leverage C57BL/6J (B6), DBA/2J (D2), and their recombinant inbred progeny—the BXD family of strains—to investigate the variation and genetic regulation of GST genes. The BXD set has been extensively profiled for thousands of behavioral traits and genome-wide expression levels have been generated for numerous brain regions and peripheral tissues. This population has been densely genotyped and is segregating over five million sequence variants that distinguish the parental lineages. The massive breadth of multiscalar trait data accumulated for the BXD population since the late 1970’s make this family particularly well suited for systems genetics and complex trait analysis. In this study we identify several GST genes with variable expression modulated by local sequence variants—Gsta4, Gstt2, Gstz1, Mgst3, and Gsto1—and dissect the functional consequences of this variation.
Methods and Materials
Ethics statement
All animal work was approved by the Institutional Animal Care and Use Committee (IACUC) at the University of Tennessee Health Science Center (IACUC protocol 12–148.0-B; Legacy protocol 680).
Generation of BXD recombinant inbred strains
BXD strains were generated from crosses between B6 and D2 strains resulting in a panel of recombinant inbred strains with either the parental B or D allele fixed at each locus [31]. There are now roughly 160 BXD lines—about 80 strains available from The Jackson Laboratory and ~80 new lines from the University of Tennessee Health Science Center [32]. Animals were maintained on an equal light dark cycle with ad libitum access to food and water.
GeneNetwork data sets
Detailed information for data sets used in the analysis, including tissue acquisition, RNA extraction, array hybridization methods, data processing, and normalization methods, can be found in the “Info” page at www.genenetwork.org. All mouse expression data sets used in this study were generated through collaborative efforts [33,34] and can be publically accessed from www.genenetwork.org. Representative expression data sets include: VU BXD Midbrain Agilent SurePrint G3 Mouse GE (May12) Quantile [35], Hippocampus Consortium M430v2 (Jun06) [34], VCU BXD PFC Sal M430 2.0 (Dec06) RMA [36], INIA Amygdala Cohort Affy MoGene 1.0 ST (Mar11) RMA, GSE16780 UCLA Hybrid MDP Liver Affy HT M430A (Sep11) [37], and UT-VGX Hepatocytes Affy Mouse Gene 1.0 ST Gene Level (Oct14) RMA. Human cortical expression data sets containing AD and control cases were also used, including GSE15222 Human Brain All Cases Myers (Apr09) RankInv Database [38].
Gene expression measurements
Expression of cytosolic and membrane-bound GSTs was measured across the BXD family using Affymetrix and Illumina microarray platforms in brain and liver. Representative probe sets (S1 Table) were selected for each gene based on probe set specificity and mean expression. SNPs and other sequence variants, such as indels (insertions and deletions) or CNVs (copy number variants), overlapping probes have an important impact on the false discovery rate of expression differences and on identification of local expression quantitative trait loci (cis-eQTLs) [39–41]. No representative probe set target sequences overlap SNPs or other sequence variants that could interfere with GST measurements in this study.
Heritability calculations
Broad sense heritability [42] was estimated by comparing the genetic variation between strains to the environmental variance within strains. Biological replicates for each strain are required for broad sense heritability calculations and were only performed for expression data sets for which replicates were available. For recombinant inbred lines, which are homozygous at all loci, the following formula was used: 0.5VA / (0.5VA + VE) or VA / (VA +2VE) where VA = additive genetic variance (variances of strain means) and VE = environmental variance (VE = VT—VA, VT = total variance among subjects) [43].
QTL mapping
Genome-wide interval mapping of gene expression patterns across the BXDs using different data sets was performed in GeneNetwork (www.genenetwork.org), as previously described [44]. Genome-wide empirical P-values are estimated by permuting trait data for each transcript randomly 5000 or more times, to determine the genome-wide significance threshold (P value < 0.05). We estimated QTL intervals for downstream analysis based on a 1.5 LOD confidence interval.
Analysis of allele-specific expression by RNA-seq
We downloaded paired-end RNA-seq data from the European Nucleotide Archive (accession number ERP000591) for lung, liver, and hippocampus of B6xD2 F1 female hybrids generated by crossing B6 females with D2 males [45]. The data consist of transcriptome sequence from six biological replicates. We aligned RNA-seq reads to both the B6 reference genome (mm10 assembly) and the SNP-substituted D2 genome using “Splice Transcripts Alignment to a Reference” tool (STAR, version 2.3.1a) [46] with the following parameters: “—outFilterMultimapNmax 10—outFilterMismatchNmax 12”. We used SAMtools (version 0.1.19) “pileup” function [47] and an in-house Python script (https://github.com/ashutoshkpandey/ASE_prealignment/blob/master/Allele_specific_SAM.py) to assign reads overlapping SNPs to either the B6 or D2 parental allele using both parental genomes. We calculated allelic ratios for each SNP as the ratio of number of reads assigned to the reference allele (B6) to the total number of aligned reads (B6+D2). For each SNP we used an interquartile range (IQR) method to identify outlier allelic ratios from the set of six F1 replicates. Outlier ratios were located outside the [Q1–1.5(IQR) and Q3 + 1.5(IQR)] range where Q1 and Q3 represent first and third quartiles and IQR is calculated as Q3 –Q1. Reads from replicates showing concordant allelic ratios were merged and allelic ratios were recalculated. We used the chi-square goodness of fit test to determine allelic imbalances for a given SNP. For a SNP showing an allelic imbalance, the ratio will deviate from 0.5. We defined genes as having an allele-specific expression difference if they contained one or more SNPs with an allelic imbalance at an FDR threshold of less than 0.1 [48]. We also required the expression fold difference to be >1.25.
Global protein quantification of Gsto1
Data from global protein quantification of mouse hippocampus using tandem mass tag technology was mined for Gsto1 peptides. Hippocampal tissue was collected from three B6 and three D2 mice of two different ages (2 to 3 months or 12 months of age). Isobaric labeling was used to differentiate sample peptides and 10 fractions were collected for each sample and analyzed by low pH reverse phase LC-MS/MS. A total of 7,074 proteins were identified in this study, of which 7,014 were quantified. 28 spectral counts and 8 peptides were identified for Gsto1. A t-test (p < 0.05) was used to determine significance.
Partial correlation analysis
Pearson product-moment correlations were computed in GeneNetwork between Gsto1 (probe set 1416531_at) and all other probe sets in the Hippocampus Consortium M430v2.0 data set after controlling for the genetic variation near Gsto1 (locus rs13483647; Chr 19 at 46.66 Mb) and Ina (locus rs13483649; Chr 19 at 47.22 Mb). The residual values after partial correlation for Gsto1 are stored in the BXD Published Phenotypes database as trait ID 17328. One hundred forty highly correlated and relevant genes were selected based on the following criteria: partial correlation P < 0.001 (r ≥ |0.38|) and a literature correlation of r > 0.5. Literature correlations are available on GeneNetwork and were originally computed using the Semantic Gene Organizer (SGO) software to automatically extract gene-gene relations from titles and abstracts in MEDLINE citations [49]. The Chilibot system (http://chilibot.net), Alzheimer Disease & Frontotemporal Dementia Mutation Database (http://www.molgen.ua.ac.be/ADMutations/), and the ALZGENE database (www.alzgene.org) were used to scan candidate genes for relations with AD. Results were also checked manually.
Identification of downstream targets and phenotypes
The following analytical steps were taken to identify transcripts that are putative downstream targets. First, transcripts with expression level greater than 8 units modulated by a suggestive trans-eQTL (LOD > 2) located in a 4 Mb region overlapping the location of the target GST gene in at least one tissue were selected. Second, the correlation coefficient between the target GST and the expression of each trans-regulated gene was computed (p < 0.01 is considered a significant correlation).
To identify phenotypes that are likely to be downstream of the variation in GST genes we queried a phenotype database of nearly 5000 published phenotypes to identify those significantly correlated with the expression of each GST gene. We also identified phenotypes whose expression was significantly regulated by genomic variants situated within 2 Mb of each target GST gene locus.
Results
Variation in expression of several GST family members is under genetic control
Genome-wide expression profiles are available for ~20 peripheral tissues or cell types and ~10 individual brain regions for the BXD population (www.genenetwork.org). We surveyed all available data but chose to focus on several representative data sets from brain (hippocampus, prefrontal cortex, amygdala, and midbrain) and peripheral tissue (liver and liver hepatocytes) for detailed systems genetics analysis. Representative data sets are robust for expression QTL mapping (eQTL), have been extensively error-checked, and include a large number of BXD strains.
GST expression levels vary tremendously across B6, D2, and the BXD population both within and across tissues (Table 1, S1 Table). Variation tends to be greater in liver compared to individual brain regions. Some GSTs, such as Gsta2 and Gsta3, are predominately expressed in liver, whereas others have higher expression in brain, such as Gstm5 and Mgst3. The expression of many GSTs is moderately to highly heritable (H2 > 0.3) suggesting that some of the variation in expression of individual GSTs is controlled by genetic factors. In agreement with this observation, several GSTs demonstrate genetic modulation of expression by local (cis eQTLs) or distant (trans eQTLs) loci (S1 Table). In general, distant eQTLs are not well conserved across tissues but cis eQTLs are often highly reproducible. We surveyed the genetic regulation of GST family members from all seven classes and found consistent cis modulation of expression across multiple tissues for Gsta4, Gstt2, Gstz1, Gsto1, and Mgst3 (Table 2). No significant and consistent cis or trans modulation of expression was detected for mu, pi, or kappa class members or for the sigma class, which is represented by the highly specialized Hpgds gene that converts prostaglandin H2 to prostaglandin D2. With the exception of Gsto1, all cis-modulated genes (Gsta4, Gstt2, Gstz1, and Mgst3) have higher expression in the BXD population that is associated with inheritance of the D allele from the D2 parental strain. For all cis-modulated GST family members we leveraged multiple informatics resources to identify the genetic architecture underlying expression variation, explore potential functional consequences of that variation, and evaluate biological function through coexpression analysis.
Table 1. Summary of GST gene expression.
| Symbol | Human Homolog | Chr | Mb | Agilent Probe Set | Mid Mean | Mid FC | Mid LOD | Mid QTL | Affymetrix Probe Set | Hip Mean | Hip FC | Hip H^2 | Hip LOD | Hip QTL | Liv Mean | Liv FC | Liv LOD | Liv QTL |
|---|---|---|---|---|---|---|---|---|---|---|---|---|---|---|---|---|---|---|
| Class Alpha | ||||||||||||||||||
| Gsta1 | NA | 9 | 78.08 | A_55_P2032946 | 5.95 | 1.38 | 3.7 | trans | - | - | - | - | - | - | - | - | - | |
| Gsta2 | GSTA5 | 9 | 78.15 | A_55_P2170454 | 6.24 | 2.91 | 8.9 | cis | 1421040_a_at | 5.69 | 1.51 | 0.28 | 1.9 | trans | 11.14 | 8.07 | 3.1 | trans |
| Gsta3 | GSTA3 | 1 | 21.25 | A_55_P1961423 | 9.02 | 1.24 | 3.7 | trans | 1423436_at | 5.76 | 1.36 | 0.24 | 1.9 | trans | 13.16 | 3.46 | 2.8 | trans |
| Gsta4 | GSTA4 | 9 | 78.05 | A_51_P112223 | 10.36 | 1.23 | 10.5 | cis | 1416368_at | 10.88 | 1.99 | 0.59 | 14.2 | cis | 11.33 | 11.43 | 4.1 | cis |
| Class Mu | ||||||||||||||||||
| Gstm1 | GSTM5 | 3 | 107.82 | A_55_P1966432 | 11.45 | 1.19 | 3.1 | trans | 1416416_x_at | 12.12 | 1.81 | 0.34 | 1.9 | trans | 14.50 | 1.83 | 2.3 | trans |
| Gstm2 | GSTM1 | 3 | 107.78 | A_55_P1966438 | 7.91 | 1.55 | 3.3 | trans | 1416411_at | 7.15 | 1.85 | 0.43 | 2.4 | trans | 10.15 | 3.21 | 2.7 | trans |
| Gstm3 | NA | 3 | 107.77 | A_55_P2065231 | 10.15 | 1.37 | 2.7 | trans | 1427474_s_at | 9.22 | 1.69 | 0.33 | 2.6 | trans | 10.63 | 16.11 | 2.9 | trans |
| Gstm4 | GSTM4 | 3 | 107.84 | A_51_P327585 | 9.28 | 1.17 | 3.1 | trans | 1424835_at | 8.38 | 1.33 | 0.26 | 1.7 | trans | 10.09 | 1.97 | 2.6 | trans |
| Gstm5 | GSTM3 | 3 | 107.70 | A_51_P260169 | 11.86 | 1.17 | 1.9 | trans | 1416842_at | 13.14 | 1.34 | 0.29 | 2.2 | trans | 9.15 | 2.02 | 2.9 | trans |
| Gstm6 | NA | 3 | 107.74 | A_55_P2031676 | 9.15 | 1.41 | 2.4 | trans | 1422072_a_at | 8.22 | 1.51 | 0.32 | 2.6 | trans | 9.55 | 4.44 | 2.4 | trans |
| Gstm7 | GSTM2 | 3 | 107.73 | A_55_P2016667 | 10.03 | 1.17 | 3.1 | trans | 1419072_at | 9.74 | 1.61 | 0.30 | 2.5 | trans | 10.31 | 2.10 | 2.5 | trans |
| Class Pi | ||||||||||||||||||
| Gstp1 | GSTP1 | 19 | 4.04 | A_51_P374464 | 11.70 | 1.14 | 3.9 | trans | - | - | - | - | - | - | - | - | - | - |
| Gstp2 | GSTP1 | 19 | 4.04 | A_55_P2008704 | 11.80 | 1.15 | 2.2 | trans | 1449575_a_at | 13.57 | 1.28 | 0.30 | 2.5 | trans | 15.48 | 1.42 | 3.3 | trans |
| Class Theta | ||||||||||||||||||
| Gstt1 | GSTT1 | 10 | 75.25 | A_55_P2024841 | 10.84316216 | 1.182631 | 2.2 | trans | 1418186_at | 8.96 | 1.59 | 0.39 | 2.5 | trans | 13.28 | 2.59 | 2.4 | trans |
| Gstt2 | GSTT2 | 10 | 75.29 | A_51_P350048 | 9.453054054 | 1.273677475 | 5.0 | cis | 1417883_at | 7.10 | 1.65 | 0.39 | 4.1 | cis | 12.71 | 1.72 | 2.4 | trans |
| Gstt3 | NA | 10 | 75.24 | A_51_P377856 | 10.11583784 | 1.235418637 | 3.3 | trans | 1423891_at | 5.50 | 1.46 | 0.49 | 2.1 | trans | 9.94 | 7.72 | 2.9 | trans |
| Gstt4 | NA | 10 | 75.28 | A_51_P432229 | 5.98527027 | 1.680627504 | 2.1 | trans | - | - | - | - | - | - | - | - | ||
| Class Sigma | ||||||||||||||||||
| Hpgds | HPGDS | 2 | 25.32 | A_52_P536796 | 8.03 | 1.44 | 3.1 | trans | 1423859_a_at | 6.46 | 1.44 | 0.55 | 2.1 | trans | 6.37 | 1.22 | 2.8 | trans |
| Class Zeta | ||||||||||||||||||
| Gstz1 | GSTZ1 | 12 | 88.50 | A_55_P1988708 | 11.18 | 1.27 | 17.4 | cis | 1427552_a_at | 8.57 | 1.56 | 0.24 | 2.9 | cis | 13.10 | 1.38 | 4.5 | trans |
| Class Omega | ||||||||||||||||||
| Gsto1 | GSTO1 | 19 | 47.94 | A_51_P155313 | 11.23 | 1.28 | 16.4 | cis | 1416531_at | 10.61 | 1.63 | 0.69 | 18.8 | cis | 12.41 | 1.80 | 4.3 | cis |
| Gsto2 | GSTO2 | 19 | 47.95 | A_55_P2019233 | 8.96 | 1.24 | 2.5 | trans | 1453708_a_at | 5.49 | 1.36 | 0.39 | 2.6 | trans | - | - | ||
| Class Kappa | ||||||||||||||||||
| Gstk1 | GSTK1 | 6 | 42.20 | A_55_P2051313 | 10.46 | 1.19 | 2.6 | trans | 1452823_at | 8.75 | 1.66 | 0.339114752 | 2.4 | trans | 12.45 | 1.68 | 2.7 | trans |
| MAPEG Family | ||||||||||||||||||
| Mgst1 | MGST1 | 6 | 138.10 | A_55_P2175880 | 10.39 | 1.23 | 1.9 | trans | 1415897_a_at | 9.07 | 2.76 | 0.49 | 3.2 | trans | 14.93 | 1.21 | 1.8 | trans |
| Mgst2 | MGST2 | 3 | 51.49 | A_51_P150120 | 8.74 | 1.65 | 1.7 | trans | 1452592_at | 6.43 | 1.26 | 0.24 | 3.0 | trans | 6.65 | 1.27 | 1.9 | trans |
| Mgst3 | MGST3 | 1 | 169.30 | A_55_P2056342 | 11.62 | 1.53 | 18.2 | cis | 1448300_at | 11.61 | 3.21 | 0.56 | 17.7 | cis | 9.27 | 7.43 | 10.3 | cis |
Chr = chromosome, Mb = megabase, Mid = midbrain, Hip = hippocampus, Liv = liver, FC = fold change, H^2 = broad sense heritability.
Table 2. Summary of cis modulation of expression.
| Group | Dataset | Tissue | Record | Gene | Position | Mean Tissue Expr | Max LRS | Max LOD | QTL Peak Marker Location | Additive Effect |
|---|---|---|---|---|---|---|---|---|---|---|
| BXD | EPFL/LISP BXD CD Brown Adipose Affy Mouse Gene 2.0 ST Gene Level (Oct13) RMA | Adipose | 17519649 | Gsta4 | Chr9: 78.04 | 11.91 | 30.9 | 6.70 | Chr9: 77.25 | 0.31 |
| BXD | INIA Adrenal Affy MoGene 1.0ST (Jun12) RMA | Adrenal Gland | 10587315 | Gsta4 | Chr9: 78.04 | 10.74 | 25.7 | 5.57 | Chr9: 77.25 | 0.25 |
| BXD | SJUT Cerebellum mRNA M430 (Oct04) MAS5 | Cerebellum | 1416368_at_A | Gsta4 | Chr9: 78.05 | 9.36 | 10.4 | 2.26 | Chr9: 77.22 | 0.19 |
| BXD | Hippocampus Consortium M430v2 (Jun06) RMA | Hippocampus | 1416368_at | Gsta4 | Chr9: 78.05 | 10.91 | 65.5 | 14.21 | Chr9: 77.25 | 0.19 |
| BXD | UTHSC Hippocampus Illumina v6.1 All Combined (Nov12) RankInv | Hippocampus | ILM1660369 | Gsta4 | Chr9: 78.06 | 13.16 | 56.4 | 12.23 | Chr9: 78.05 | 0.54 |
| BXD | EPFL/LISP BXD CD+HFD Liver Affy Mouse Gene 1.0 ST (Apr13) RMA | Liver | 10587315 | Gsta4 | Chr9: 78.04 | 11.25 | 20 | 4.34 | Chr9: 78.05 | 0.21 |
| BXD | GSE16780 UCLA Hybrid MDP Liver Affy HT M430A (Sep11) RMA | Liver | 1416368_at_A | Gsta4 | Chr9: 78.05 | 11.43 | 18.9 | 4.10 | Chr9: 77.22 | 0.48 |
| BXD | VU BXD Midbrain Agilent SurePrint G3 Mouse GE (May12) Quantile | Midbrain | A_51_P112223 | Gsta4 | Chr9: 78.05 | 10.36 | 48.5 | 10.52 | Chr9: 77.22 | 0.08 |
| BXD | EPFL/LISP BXD CD+HFD Muscle Affy Mouse Gene 1.0 ST (Dec11) RMA | Muscle | 10587315 | Gsta4 | Chr9: 78.04 | 9.75 | 16.3 | 3.54 | Chr9: 78.05 | 0.13 |
| BXD | HQF BXD Neocortex ILM6v1.1 (Dec10v2) RankInv | Neocortex | ILM1660369 | Gsta4 | Chr9: 78.06 | 13.13 | 25.6 | 5.55 | Chr9: 78.05 | 0.15 |
| BXD | INIA Pituitary Affy MoGene 1.0ST (Jun12) RMA | Pituitary Gland | 10587315 | Gsta4 | Chr9: 78.04 | 9.53 | 19.4 | 4.21 | Chr9: 77.25 | 0.17 |
| BHF2 | UCLA BHF2 Brain Female mlratio | Brain | 10024394148 | Gsta4 | Chr9: 78.04 | 0.00 | 15.9 | 3.45 | Chr9: 76.10 | 0.02 |
| BHF2 | UCLA BHF2 Liver Male mlratio | Liver | 10024394148 | Gsta4 | Chr9: 78.04 | -0.03 | 33.3 | 7.22 | Chr9: 76.10 | 0.07 |
| BXD | Eye M430v2 (Sep08) RMA | Eye | 1417883_at | Gstt2 | Chr10: 75.29 | 9.16 | 39.1 | 8.48 | Chr10: 74.44 | 0.17 |
| BXD | UTHSC Mouse BXD Gastrointestinal Affy MoGene 1.0 ST Gene Level (Apr14) RMA | Gastrointestinal Tract | 10370013 | Gstt2 | Chr10: 75.29 | 9.34 | 25.3 | 5.49 | Chr10: 74.08 | 0.11 |
| BXD | Hippocampus Consortium M430v2 (Jun06) RMA | Hippocampus | 1417883_at | Gstt2 | Chr10: 75.29 | 7.10 | 18.8 | 4.08 | Chr10: 73.39 | 0.08 |
| BXD | UTHSC Hippocampus Illumina v6.1 NOS (Sep09) RankInv | Hippocampus | ILM1580519 | Gstt2 | Chr10: 75.29 | 7.57 | 14.3 | 3.10 | Chr10: 74.08 | 0.09 |
| BXD | Mouse kidney M430v2 Female (Aug06) RMA | Kidney | 1417883_at | Gstt2 | Chr10: 75.29 | 12.79 | 18.1 | 3.93 | Chr10: 71.42 | 0.19 |
| BXD | HZI Lung M430v2 (Apr08) RMA | Lung | 1417883_at | Gstt2 | Chr10: 75.29 | 9.97 | 30.1 | 6.53 | Chr10: 74.08 | 0.14 |
| BXD | VU BXD Midbrain Agilent SurePrint G3 Mouse GE (May12) Quantile | Midbrain | A_51_P350048 | Gstt2 | Chr10: 75.29 | 9.45 | 23.2 | 5.03 | Chr10: 74.44 | 0.06 |
| BXD | HQF BXD Neocortex ILM6v1.1 (Dec10v2) RankInv | Neocortex | ILM1580519 | Gstt2 | Chr10: 75.29 | 7.85 | 11.3 | 2.45 | Chr10: 74.08 | 0.06 |
| BXD | Hippocampus Consortium M430v2 (Jun06) RMA | Hippocampus | 1427552_a_at | Gstz1 | Chr12: 88.50 | 8.55 | 13.5 | 2.93 | Chr12: 86.99 | 0.06 |
| BXD | VU BXD Midbrain Agilent SurePrint G3 Mouse GE (May12) Quantile | Midbrain | A_55_P1988708 | Gstz1 | Chr12: 88.50 | 11.18 | 80.2 | 17.40 | Chr12: 88.25 | 0.10 |
| BXD | VCU BXD NAc Sal M430 2.0 (Oct07) RMA | Nucleus Accumbens | 1427552_a_at | Gstz1 | Chr12: 88.50 | 9.16 | 16.5 | 3.58 | Chr12: 85.87 | 0.08 |
| BXD | VCU BXD PFC EtOH M430 2.0 (Dec06) RMA | Prefrontal Cortex | 1427552_a_at | Gstz1 | Chr12: 88.50 | 7.17 | 21.1 | 4.58 | Chr12: 87.45 | 0.11 |
| AXBXA | IRCM AXB/BXA Mouse Heart ILM MouseRef-8 v2.0 (Feb13) RankInv | Heart | ILMN_1229964 | Gstz1 | Chr12: 88.51 | 8.22 | 23.7 | 5.14 | Chr12: 87.28 | -0.06 |
| BHF2 | UCLA BHF2 Brain (June05) mlratio | Brain | 10024414602 | Gstz1 | Chr12: 88.49 | 0.01 | 69.7 | 15.12 | Chr12: 88.36 | 0.03 |
| CTB6F2 | UCLA CTB6/B6CTF2 Brain Males (2005) mlratio | Brain | 10018188926 | Gstz1 | Chr12: 88.49 | -0.04 | 17.6 | 3.82 | Chr12: 86.97 | -0.02 |
| CTB6F2 | UCLA CTB6B6CTF2 Liver Female mlratio | Liver | 10018188926 | Gstz1 | Chr12: 88.49 | -0.02 | 91.5 | 19.85 | Chr12: 85.35 | -0.11 |
| CTB6F2 | UCLA CTB6B6CTF2 Muscle Male mlratio | Muscle | 10018188926 | Gstz1 | Chr12: 88.49 | -0.03 | 59.1 | 12.82 | Chr12: 86.97 | -0.10 |
| BXD | INIA Amygdala Cohort Affy MoGene 1.0 ST (Mar11) RMA | Amygdala | 10463836 | Gsto1 | Chr19: 47.93 | 9.74 | 48.2 | 10.46 | Chr19: 46.66 | 0.17 |
| BXD | UCHSC BXD Whole Brain M430 2.0 (Nov06) RMA | Brain | 1416531_at | Gsto1 | Chr19: 47.94 | 10.16 | 35.1 | 7.61 | Chr19: 48.45 | -0.13 |
| BXD | Eye M430v2 (Sep08) RMA | Eye | 1416531_at | Gsto1 | Chr19: 47.94 | 14.14 | 15.1 | 3.28 | Chr19: 47.22 | -0.17 |
| BXD | GNF Stem Cells U74Av2 (Mar04) RMA | Hematopoietic Cells | 97819_at | Gsto1 | Chr19: 47.94 | 9.36 | 16.5 | 3.58 | Chr19: 47.22 | -0.16 |
| BXD | UMCG Progenitor Cells ILM6v1.1 (Apr09) original | Hematopoietic Cells | ILM6650600 | Gsto1 | Chr19: 47.94 | 12.22 | 22.4 | 4.86 | Chr19: 47.22 | -0.25 |
| BXD | Hippocampus Consortium M430v2 (Jun06) RMA | Hippocampus | 1416531_at | Gsto1 | Chr19: 47.94 | 10.63 | 86.7 | 18.81 | Chr19: 47.22 | -0.17 |
| BXD | UTHSC Hippocampus Illumina v6.1 All Combined (Nov12) RankInv | Hippocampus | ILM6650600 | Gsto1 | Chr19: 47.94 | 11.62 | 34.7 | 7.53 | Chr19: 46.67 | -0.31 |
| BXD | INIA Hypothalamus Affy MoGene 1.0 ST (Nov10) | Hypothalamus | 10463836 | Gsto1 | Chr19: 47.94 | 9.64 | 19.2 | 4.16 | Chr19: 47.22 | 0.11 |
| BXD | Mouse Kidney M430v2 (Jul06) RMA | Kidney | 1416531_at | Gsto1 | Chr19: 47.94 | 11.96 | 29.1 | 6.31 | Chr19: 47.22 | -0.34 |
| BXD | GSE16780 UCLA Hybrid MDP Liver Affy HT M430A (Sep11) RMA | Liver | 1416531_at_A | Gsto1 | Chr19: 47.94 | 12.45 | 19.7 | 4.27 | Chr19: 47.22 | -0.13 |
| BXD | HZI Lung M430v2 (Apr08) RMA | Lung | 1416531_at | Gsto1 | Chr19: 47.94 | 12.07 | 44.5 | 9.65 | Chr19: 46.66 | -0.26 |
| BXD | VU BXD Midbrain Agilent SurePrint G3 Mouse GE (May12) Quantile | Midbrain | A_51_P155313 | Gsto1 | Chr19: 47.94 | 11.23 | 75.6 | 16.40 | Chr19: 47.22 | -0.10 |
| BXD | EPFL/LISP BXD CD+HFD Muscle Affy Mouse Gene 1.0 ST (Dec11) RMA | Muscle | 10463836 | Gsto1 | Chr19: 47.93 | 9.79 | 25.5 | 5.53 | Chr19: 46.66 | -0.14 |
| BXD | BIDMC/UTHSC Dev Neocortex P14 ILMv6.2 (Nov11) RankInv | Neocortex | ILMN_1254523 | Gsto1 | Chr19: 47.94 | 12.09 | 27.9 | 6.05 | Chr19: 48.08 | -0.20 |
| BXD | VCU BXD NAc Sal M430 2.0 (Oct07) RMA | Nucleus Accumbens | 1416531_at | Gsto1 | Chr19: 47.94 | 10.39 | 29 | 6.29 | Chr19: 48.45 | -0.08 |
| BXD | INIA Pituitary Affy MoGene 1.0ST (Jun12) RMA | Pituitary Gland | 10463836 | Gsto1 | Chr19: 47.93 | 7.81 | 62.2 | 13.49 | Chr19: 47.22 | -0.29 |
| BXD | VCU BXD PFC EtOH M430 2.0 (Dec06) RMA | Prefrontal Cortex | 1416531_at | Gsto1 | Chr19: 47.94 | 8.73 | 33.1 | 7.18 | Chr19: 47.22 | -0.14 |
| BXD | VCU BXD PFC Sal M430 2.0 (Dec06) RMA | Prefrontal Cortex | 1416531_at | Gsto1 | Chr19: 47.94 | 8.75 | 34.3 | 7.44 | Chr19: 47.22 | -0.16 |
| BXD | Normal HEI Retina (April 2010) RankInv | Retina | ILMN_1254523 | Gsto1 | Chr19: 47.94 | 12.03 | 21.7 | 4.71 | Chr19: 47.22 | -0.38 |
| BXD | IoP Affy MOE 430v2 Spleen (May09) RMA | Spleen | 1416531_at | Gsto1 | Chr19: 47.94 | 10.78 | 27.9 | 6.05 | Chr19: 47.22 | -0.22 |
| BXD | UTHSC Affy MoGene 1.0 ST Spleen (Dec10) RMA | Spleen | 10463836 | Gsto1 | Chr19: 47.93 | 9.66 | 76.5 | 16.59 | Chr19: 47.22 | -0.27 |
| BXD | UTK Spleen ILM6.1 (Jan10) VST | Spleen | ILM6650600 | Gsto1 | Chr19: 47.94 | 13.01 | 56.1 | 12.17 | Chr19: 47.22 | -0.59 |
| BXD | HQF Striatum Affy Mouse Exon 1.0ST Gene Level (Dec09) RMA | Striatum | 6870181 | Gsto1 | Chr19: 47.93 | 9.48 | 14.4 | 3.12 | Chr19: 48.45 | -0.18 |
| BXD | HZI Treg M430v2 (Feb11) RMA | T Cell (regulatory) | 1416531_at | Gsto1 | Chr19: 47.94 | 10.71 | 41.6 | 9.02 | Chr19: 47.22 | -0.37 |
| BXD | INIA Brain mRNA M430 (Jan06) RMA | Brain | 1416531_at_A | Gsto1 | Chr19: 47.94 | 10.57 | 27.4 | 5.94 | Chr19: 47.22 | -0.10 |
| BXD | UNC Agilent G4121A Liver LOWESS Stanford (Jan06) Both Sexes | Liver | A_51_P155313 | Gsto1 | Chr19: 47.94 | 0.03 | 47.7 | 10.35 | Chr19: 46.66 | -0.30 |
| AXBXA | GSE16780 UCLA Mouse AXB/BXA Liver Affy HT M430A (Sep11) RMA | Liver | 1416531_at_A | Gsto1 | Chr19: 47.94 | 12.51 | 36 | 7.81 | Chr19: 46.66 | -0.18 |
| AXBXA | GSE16780 UCLA Mouse AXB/BXA Liver Affy HT M430A (Sep11) RMA | Liver | 1456036_x_at_A | Gsto1 | Chr19: 47.94 | 10.58 | 41.9 | 9.09 | Chr19: 46.66 | -0.25 |
| LXS | Hippocampus Illumina NOE (Oct08) RankInv beta | Hippocampus | ILM6650600 | Gsto1 | Chr19: 47.94 | 12.34 | 18.1 | 3.93 | Chr19: 48.45 | 0.20 |
| MDP | UCLA GSE27483 MDP Bone Femur ILM Mouse WG-6 v1, v1.1 (Jan13) RSN | Bone Femur | ILM6650600 | Gsto1 | Chr19: 47.94 | 12.46 | 22.6 | 4.90 | Chr19: 48.21 | -0.68 |
| BXD | EPFL/LISP BXD CD Brown Adipose Affy Mouse Gene 2.0 ST Gene Level (Oct13) RMA | Adipose | 17229403 | Mgst3 | Chr1: 169.30 | 9.85 | 21.8 | 4.73 | Chr1: 169.15 | 0.19 |
| BXD | INIA Amygdala Cohort Affy MoGene 1.0 ST (Mar11) RMA | Amygdala | 10359861 | Mgst3 | Chr1: 169.30 | 9.66 | 23 | 4.99 | Chr1: 169.15 | 0.11 |
| BXD | UCHSC BXD Whole Brain M430 2.0 (Nov06) RMA | Brain | 1448300_at | Mgst3 | Chr1: 169.30 | 11.30 | 31.4 | 6.81 | Chr1: 168.32 | 0.22 |
| BXD | Eye M430v2 (Sep08) RMA | Eye | 1448300_at | Mgst3 | Chr1: 169.30 | 11.23 | 22.8 | 4.95 | Chr1: 169.15 | 0.20 |
| BXD | UTHSC Mouse BXD Gastrointestinal Affy MoGene 1.0 ST Gene Level (Apr14) RMA | Gastrointestinal Tract | 10359861 | Mgst3 | Chr1: 169.30 | 11.76 | 27.9 | 6.05 | Chr1: 168.32 | -0.13 |
| BXD | Hippocampus Consortium M430v2 (Jun06) RMA | Hippocampus | 1448300_at | Mgst3 | Chr1: 169.30 | 11.48 | 81.6 | 17.70 | Chr1: 169.15 | 0.35 |
| BXD | UTHSC Hippocampus Illumina v6.1 All Combined (Nov12) RankInv | Hippocampus | ILM3450338 | Mgst3 | Chr1: 169.30 | 14.17 | 75.8 | 16.44 | Chr1: 169.15 | 0.94 |
| BXD | UTHSC Hippocampus Illumina v6.1 All Combined (Nov12) RankInv | Hippocampus | ILM5290736 | Mgst3 | Chr1: 169.30 | 11.86 | 85.6 | 18.57 | Chr1: 169.15 | 0.85 |
| BXD | INIA Hypothalamus Affy MoGene 1.0 ST (Nov10) Female | Hypothalamus | 10359861 | Mgst3 | Chr1: 169.30 | 8.95 | 13.2 | 2.86 | Chr1: 169.15 | 0.11 |
| BXD | Mouse Kidney M430v2 (Jul06) RMA | Kidney | 1448300_at | Mgst3 | Chr1: 169.30 | 13.35 | 57 | 12.36 | Chr1: 169.15 | 0.85 |
| BXD | EPFL/LISP BXD CD+HFD Liver Affy Mouse Gene 1.0 ST (Apr13) RMA | Liver | 10359861 | Mgst3 | Chr1: 169.30 | 9.68 | 58.9 | 12.78 | Chr1: 169.15 | 0.43 |
| BXD | GSE16780 UCLA Hybrid MDP Liver Affy HT M430A (Sep11) RMA | Liver | 1448300_at_A | Mgst3 | Chr1: 169.30 | 8.97 | 47.3 | 10.26 | Chr1: 168.32 | 0.81 |
| BXD | SUH BXD Liver CCl4-treated Affy Mouse Gene 1.0 ST (Jun11) RMA | Liver | 10359861 | Mgst3 | Chr1: 169.30 | 9.82 | 30.9 | 6.70 | Chr1: 169.15 | 0.33 |
| BXD | VU BXD Midbrain Agilent SurePrint G3 Mouse GE (May12) Quantile | Midbrain | A_55_P2056342 | Mgst3 | Chr1: 169.30 | 11.62 | 83.9 | 18.20 | Chr1: 169.15 | 0.19 |
| BXD | EPFL/LISP BXD CD+HFD Muscle Affy Mouse Gene 1.0 ST (Dec11) RMA | Muscle | 10359861 | Mgst3 | Chr1: 169.30 | 11.56 | 46.6 | 10.11 | Chr1: 169.15 | 0.16 |
| BXD | BIDMC/UTHSC Dev Neocortex P14 ILMv6.2 (Nov11) RankInv | Neocortex | ILMN_1238479 | Mgst3 | Chr1: 169.30 | 13.16 | 53.7 | 11.65 | Chr1: 169.15 | 0.33 |
| BXD | HQF BXD Neocortex ILM6v1.1 (Dec10v2) RankInv | Neocortex | ILM3450338 | Mgst3 | Chr1: 169.30 | 14.89 | 59 | 12.80 | Chr1: 169.15 | 0.23 |
| BXD | HQF BXD Neocortex ILM6v1.1 (Dec10v2) RankInv | Neocortex | ILM5290736 | Mgst3 | Chr1: 169.30 | 13.46 | 66.4 | 14.40 | Chr1: 169.15 | 0.31 |
| BXD | VCU BXD NAc Sal M430 2.0 (Oct07) RMA | Nucleus Accumbens | 1448300_at | Mgst3 | Chr1: 169.30 | 11.77 | 47.4 | 10.28 | Chr1: 169.15 | 0.30 |
| BXD | INIA Pituitary Affy MoGene 1.0ST (Jun12) RMA | Pituitary Gland | 10359861 | Mgst3 | Chr1: 169.30 | 7.60 | 33.7 | 7.31 | Chr1: 169.15 | -0.13 |
| BXD | Full HEI Retina (April 2010) RankInv | Retina | ILMN_1238479 | Mgst3 | Chr1: 169.30 | 10.52 | 46.2 | 10.02 | Chr1: 169.15 | 0.22 |
| BXD | UTHSC Affy MoGene 1.0 ST Spleen (Dec10) RMA | Spleen | 10359861 | Mgst3 | Chr1: 169.30 | 9.72 | 15.9 | 3.45 | Chr1: 169.15 | 0.29 |
| BXD | HBP Rosen Striatum M430V2 (Apr05) RMA Orig | Striatum | 1448300_at | Mgst3 | Chr1: 169.30 | 10.78 | 18.7 | 4.06 | Chr1: 168.32 | 0.36 |
| BXD | HQF Striatum Affy Mouse Exon 1.0ST Gene Level (Dec09) RMA | Striatum | 6763903 | Mgst3 | Chr1: 169.30 | 10.47 | 12.4 | 2.69 | Chr1: 168.32 | 0.15 |
| BXD | HQF BXD Striatum ILM6.1 (Dec10v2) RankInv | Striatum | ILM3450338 | Mgst3 | Chr1: 169.30 | 13.51 | 15.6 | 3.38 | Chr1: 168.91 | 0.15 |
| BXD | HQF BXD Striatum ILM6.1 (Dec10v2) RankInv | Striatum | ILM5290736 | Mgst3 | Chr1: 169.30 | 12.16 | 26.2 | 5.68 | Chr1: 168.91 | 0.19 |
| BXD | INIA Brain mRNA M430 (Jun06) RMA | Brain | 1448300_at_A | Mgst3 | Chr1: 169.30 | 12.40 | 37.6 | 8.16 | Chr1: 168.32 | 0.32 |
| BXD | SJUT Cerebellum mRNA M430 (Mar05) RMA | Cerebellum | 1448300_at_A | Mgst3 | Chr1: 169.30 | 12.46 | 55.7 | 12.08 | Chr1: 168.91 | 0.48 |
| BXD | GE-NIAAA Cerebellum mRNA M430v2 (May05) RMA | Cerebellum | 1448300_at | Mgst3 | Chr1: 169.30 | 12.18 | 28.4 | 6.16 | Chr1: 169.15 | 0.57 |
| BXD | UNC Agilent G4121A Liver LOWESS Stanford (Jan06) Both Sexes | Liver | A_51_P215077 | Mgst3 | Chr1: 169.31 | 0.10 | 71 | 15.40 | Chr1: 168.91 | 0.58 |
| B6D2F2 | OHSU/VA B6D2F2 Brain mRNA M430 (Aug05) RMA | Brain | 1448300_at_A | Mgst3 | Chr1: 169.30 | 11.41 | 63.7 | 13.82 | Chr1: 168.63 | 0.35 |
| CTB6F2 | UCLA CTB6/B6CTF2 Brain (2005) mlratio | Brain | 10024412567 | Mgst3 | Chr1: 169.30 | -0.04 | 323.4 | 70.15 | Chr1: 169.30 | 0.13 |
| CTB6F2 | UCLA CTB6/B6CTF2 Liver (2005) mlratio | Liver | 10024412567 | Mgst3 | Chr1: 169.30 | -0.05 | 268 | 58.13 | Chr1: 169.30 | 0.26 |
| CTB6F2 | UCLA CTB6/B6CTF2 Muscle (2005) mlratio | Muscle | 10024412567 | Mgst3 | Chr1: 169.30 | -0.05 | 167.3 | 36.29 | Chr1: 169.30 | 0.08 |
Abbreviations as follows: Expr = Expression; BXD = recombinant inbred cross between C57BL/6 (B) and DBA/2 (D); AXBXA = recombinant inbred set derived from reciprocal crosses between A/J (A) and C57BL/6J (B); BHF2 = F2 cross between C57BL/6J (B) and C3H/HeJ (H); CTB6F2 = F2 cross between CAST/EiJ (CT) and C57BL/6 (B6); LXS = recombinant inbred set generated from Inbred Long-Sleep (ILS) and Short-Sleep (ISS) mice that originated from a cross between 8 inbred strains; MDP = Mouse Diversity Panel consisting of 122 inbred strains of mice; B6D2F2 = F2 cross between C57BL/6 (B6) and DBA/2 (D2). In general a positive additive effect means higher expression of the gene is associated with inheritance of the parental allele and a negative additive effect indicates higher expression driven by inheritance of the maternal allele. Crosses are written with the maternal strain first, such that the maternal strain of the BXD set is C57BL/6 (B).
Gsta4
Expression is variable across the BXD set (Fig 1) ranging from a modest level in the midbrain (fold change of 1.23) to high levels in prefrontal cortex, hippocampus, and liver (fold changes of 1.99, 1.80, and 11.43, respectively). This variation is highly heritable (H2 = 0.59) and is strongly modulated by a significant cis eQTL in 10 tissues (Table 2), including midbrain (LOD = 10.5), hippocampus (LOD = 14.2), prefrontal cortex (LOD = 7.5), liver (LOD = 4), and liver hepatocytes (LOD = 4.2) (Fig 1). The 1.5 LOD confidence interval, which defines the boundaries of the QTL, is ~3 Mb (77 to 80 Mb on Chr 9), precisely overlapping the location of the gene (Chr 9 at 78 Mb). Higher expression of Gsta4 in the BXD family is driven by inheritance of the D allele (Fig 1). Expression of Gsta4 is also cis-modulated in an F2 intercross between C57BL/6J and C3H/HeJ (BHF2, Table 2) and higher expression is driven by inheritance of the C3H/HeJ allele. This result is consistent with a mutation within or near Gsta4 that occurred in the B6 parental strain.
Fig 1. Summary of expression and QTL mapping across BXD strains for Gsta4.

The top five panels contain bar plots representing the expression of Gsta4 for each BXD individual in five different tissues. Average log2 expression is shown on the y-axis and unique strains are shown on the X-axis (BXD1 = 1). Red and blue indicate inheritance of the paternal D2 (D) or maternal B6 (B) allele of Gsta4 in each strain, respectively. If only a single individual was used for expression measurements, error bars are not shown. For genetic reference populations, mapping power is derived from the number of individuals as opposed to the number of biological replicates. Higher expression is associated with inheritance of the D allele. Bottom two panels show the genetic mapping results in each tissue. Association strength (LOD) is shown on the Y-axis and plotted across the genome on the X-axis (by chromosome) for hippocampus (blue), midbrain (red), prefrontal cortex (green), liver (dark purple), and hepatocytes (purple). Genome-wide significance is determined by permutation (n = 5000) with the threshold for significance indicated as black (significant, p <0.05) and grey (suggestive, p < 0.3) horizontal lines. Expression of Gsta4 is modulated by variants within or near its own locus on Chr 9, a cis eQTL.
Gsta4 is situated within a relatively variant-rich region on Chr 9; 96 SNPs and 22 small insertion/deletions (indels) are segregating between the B6 and D2 parental strains. None of these variants are in coding exons, known regulatory regions, or splice sites. Instead, one or more of these variants alter expression through undefined regulatory regions or alternative mechanisms. Although the causal variant has not yet been identified, the cis eQTL regulating Gsta4 expression in multiple tissues across the BXD panel has been validated in liver, lung, and hippocampus by allele-specific expression (ASE) assays using RNA sequencing in B6xD2 F1 hybrid mice (Table 3).
Table 3. Summary of GST ASE.
| Gene Symbol | Chromosome | Position | B6 | D2 | B6 counts | D2 counts | Total reads | P-value | Allelic ratio | RefSeq transcript | Genic feature | Tissue |
|---|---|---|---|---|---|---|---|---|---|---|---|---|
| Gsta4 | chr9 | 78192047 | C | A | 317 | 699 | 1016 | 0.00E+00 | 0.31 | NM_010357 | 5' UTR | Liver |
| Gsta4 | chr9 | 78192047 | C | A | 72 | 165 | 237 | 0.00E+00 | 0.30 | NM_010357 | 5' UTR | Lung |
| Gsta4 | chr9 | 78192047 | C | A | 86 | 161 | 247 | 1.82E-06 | 0.35 | NM_010357 | 5' UTR | Hip |
| Gstz1 | chr12 | 87164437 | C | T | 3902 | 4007 | 7909 | 2.38E-01 | 0.49 | NM_010363 | 3' UTR | Liver |
| Gstz1 | chr12 | 87164437 | C | T | 139 | 153 | 292 | 4.13E-01 | 0.48 | NM_010363 | 3' UTR | Lung |
| Gstz1 | chr12 | 87164437 | C | T | 96 | 117 | 213 | 1.50E-01 | 0.45 | NM_010363 | 3' UTR | Hip |
| Gsto1 | chr19 | 47855077 | G | A | 281 | 208 | 489 | 9.63E-04 | 0.57 | NM_010362 | 5' UTR | Liver |
| Gsto1 | chr19 | 47857874 | T | C | 511 | 393 | 904 | 8.69E-05 | 0.57 | NM_010362 | Exon 3 | Liver |
| Gsto1 | chr19 | 47858048 | A | G | 464 | 300 | 764 | 3.02E-09 | 0.61 | NM_010362 | Exon 3 | Liver |
| Gsto1 | chr19 | 47864318 | G | A | 1098 | 720 | 1818 | 0.00E+00 | 0.60 | NM_010362 | Exon 6 | Liver |
| Gsto1 | chr19 | 47864511 | G | A | 466 | 270 | 736 | 0.00E+00 | 0.63 | NM_010362 | 3' UTR | Liver |
| Gsto1 | chr19 | 47864609 | T | C | 694 | 421 | 1115 | 0.00E+00 | 0.62 | NM_010362 | 3' UTR | Liver |
| Gsto1 | chr19 | 47855077 | G | A | 255 | 173 | 428 | 7.38E-05 | 0.60 | NM_010362 | 5' UTR | Lung |
| Gsto1 | chr19 | 47857874 | T | C | 145 | 90 | 235 | 3.33E-04 | 0.62 | NM_010362 | Exon 3 | Lung |
| Gsto1 | chr19 | 47858048 | A | G | 161 | 92 | 253 | 1.44E-05 | 0.64 | NM_010362 | Exon 3 | Lung |
| Gsto1 | chr19 | 47864318 | G | A | 264 | 227 | 491 | 9.50E-02 | 0.54 | NM_010362 | Exon 6 | Lung |
| Gsto1 | chr19 | 47864511 | G | A | 228 | 149 | 377 | 4.73E-05 | 0.60 | NM_010362 | 3' UTR | Lung |
| Gsto1 | chr19 | 47864609 | T | C | 224 | 140 | 364 | 1.07E-05 | 0.62 | NM_010362 | 3' UTR | Lung |
| Gsto1 | chr19 | 47855077 | G | A | 63 | 48 | 111 | 1.55E-01 | 0.57 | NM_010362 | 5' UTR | Hip |
| Gsto1 | chr19 | 47857874 | T | C | 90 | 71 | 161 | 1.34E-01 | 0.56 | NM_010362 | Exon 3 | Hip |
| Gsto1 | chr19 | 47858048 | A | G | 88 | 74 | 162 | 2.71E-01 | 0.54 | NM_010362 | Exon 3 | Hip |
| Gsto1 | chr19 | 47864318 | G | A | 142 | 104 | 246 | 1.54E-02 | 0.58 | NM_010362 | Exon 6 | Hip |
| Gsto1 | chr19 | 47864511 | G | A | 112 | 76 | 188 | 8.65E-03 | 0.60 | NM_010362 | 3' UTR | Hip |
| Gsto1 | chr19 | 47864609 | T | C | 114 | 85 | 199 | 3.98E-02 | 0.57 | NM_010362 | 3' UTR | Hip |
| Mgst3 | chr1 | 167372500 | A | G | 374 | 865 | 1239 | 0.00E+00 | 0.30 | NM_025569 | 3' UTR | Liver |
| Mgst3 | chr1 | 167372500 | A | G | 105 | 108 | 213 | 8.37E-01 | 0.49 | NM_025569 | 3' UTR | Lung |
| Mgst3 | chr1 | 167372500 | A | G | 257 | 307 | 564 | 3.53E-02 | 0.46 | NM_025569 | 3’ UTR | Hip |
Hip = Hippocampus.
Multiple phenotypes are modulated by variation at the Gsta4 locus
Traits (e.g. gene expression or behavioral phenotypes) that map back to the physical location of Gsta4 may be modulated in part by variation in Gsta4 expression. A repository of behavioral, metabolic, and pharmacological traits (The BXD Published Phenotypes Database) was queried to find all phenotypes that mapped within 4 Mb of the eQTL confidence interval (Chr 9 from 73 to 83 Mb) with a LOD score of two or better. Measures of CNS pharmacology (homovanillic acid and 5-hydroxyindoleacetic acid levels in the medial septal nucleus), locomotor activity (locomotion in the open field periphery, locomotion in the open field center, locomotor activity after ethanol injection), and brain morphology (volume of the hippocampus mossy fiber pathway) all map back to the Gsta4 locus (S1 Fig). All traits, except for homovanillic acid levels, are associated with higher expression in strains that inherited the D allele at this locus and are strongly and significantly correlated with Gsta4 expression in both cortex (|r| > 0.52, p < 0.05) and liver (|r| > 0.345).
Multiple transcripts are modulated by variation at the Gsta4 locus
To identify transcripts modulated by variation at the Gsta4 locus, we queried representative expression data sets available for the BXD population for brain and peripheral tissue. In hippocampus twelve unique transcripts—Auts2 (A730011F23Rik), Zmat5 (2610510L01Rik), Csmd2 (B230311I21), Dstyk (Ripk5), Nosip, Efs, Pam, Il17rc, Ino80e, Gm2a, Acap3 (Centb5), and Fam60a (Tera)—are regulated by the Gsta4 locus (S2 Fig). The expression of Efs and Csmd2 expression is also highly correlated (|r| = 0.5, p < 0.001) with hippocampal Gsta4 levels. Little is known about the function of Zmat5, however, the remaining set of downstream genes modulated by Gsta4 in hippocampus cover a diverse range of biological functions. Several, such as Auts2, Csmd2, Dstyk, Effs, and Pam, play a role in cognition and emotion based on molecular phenotypes and data from knockout mice. For example, exonic deletions in the neurodevelopmental gene AUTS2 are often associated with cognitive deficits [50–53], and variants in CSMD2 have been associated with comorbidity of depression and alcohol dependence [54], and schizophrenia [55]. Deletion of Dstyk is associated with a reduction in spatial learning and memory [56] and mice heterozygous for the cuproenzyme Pam—responsible for biosynthesis of ~50% of all neuropeptides—show marked deficits in thermoregulation and fear response [57]. In addition, Effs—a member of the CRK-associated substrate (Cas) family of adaptor proteins—is involved in assembly of large signaling complexes and may play a role in neurite outgrowth [58] and immune system function. Gm2a and Il17rc are also involved in immune signaling and response, and Nosip is part of the nitric oxide signaling pathway, which can be activated by oxidative stress or tissue injury. Ino80e and Fam60a are generally involved in the regulation of transcription and Fam60 has recently been identified as a member of the Sin3 deacetylase complex involved in transcriptional repression [59].
Cxcl2 (LOD = 2.5) is the only transcript modulated by variation in the Gsta4 locus in the prefrontal cortex and is positively correlated with Gsta4 expression (r = 0.544, p = .002). This gene encodes a chemokine that is induced by oxidative stress and inflammation.
In midbrain, three transcripts (Fbxo46, Pigp, Zfp59) are correlated with Gsta4 expression (|r| > 0.4, p < 0.01) and map back to the Gsta4 locus (LOD > 2.8). Respectively, these genes play a role in ubiquitination pathways, posttranslational modification of glycosylphosphatidylinositol–linked membrane proteins, and transcriptional repression.
Five transcripts map back to the Gsta4 locus in liver (S2 Fig), including Bet1, Dedd2, G6pc, Sec63, and Mbl1 (Smbp). Bet1, Dedd2, and Sec63 are significantly correlated with liver expression of Gsta4 (|r| > 0.4, p < 0.05) while Mbl1 is only modestly correlated (r = 0.343, p = 0.05) and G6pc is uncorrelated. With the exception of Dedd2, all correlations are positive. Sec63 and Bet1 and are involved in intracellular targeting of proteins to and from the endoplasmic reticulum (ER), respectively, and Dedd2 is involved in apoptotic signaling and intracellular targeting of caspases [60]. G6pc plays a role in glucose homeostasis [61] and Mbl1 is a soluble molecule involved in innate immunity that may also be linked to lipid metabolism through PPARα signaling pathways [62].
Gsta4 and Elovl5 are the primary candidates driving downstream trait variation
Linkage disequilibrium is a major confounding factor that limits fine-scale discrimination among physically linked candidates in a QTL from recombinant inbred populations. It is possible to achieve an eQTL precision of 1 to 4 Mb using a moderate number of BXD strains [63], however identification of the causal gene and variant responsible for downstream effects on gene expression or phenotypes is complicated by the existence of multiple cis-modulated genes residing in close proximity. Another gene, Elovl5 (Chr 9 at 77.83 Mb), is also significantly cis-modulated (LOD > 7 in brain and LOD = 4.1 in hepatocytes) and is located within 1 Mb of the Gsta4 locus. Elovl5 is a metabolic gene involved in the synthesis and elongation of long chain polyunsaturated fatty acids and could also be involved in modulation of traits mapping back to this locus.
Correlates of Gsta4 are enriched for metabolic pathways related to oxidative stress
Gene networks consisting of highly correlated genes can reveal underlying biological function. The top 500 correlates of Gsta4 expression in brain (S2 Table) and liver (S3 Table) are enriched for categories related to known functions of GSTs. The results hint at shared and specialized biological functions of Gsta4 correlates in brain and peripheral tissue, such as oxidoreductase activity in both tissues, and an emphasis on antioxidant activity and steroid metabolism in brain compared to an emphasis on glutathione and mitochondrial metabolic processes in liver.
Gstt2
Among the BXD population expression is variable across brain regions, with average expression levels in the midbrain, and low levels of expression in the hippocampus (Fig 2). In midbrain, Gstt2 expression variation among BXD strains is modest at nearly 1.3-fold. In hippocampus, expression is more variable at over 1.6-fold. The expression of Gstt2 is significantly modulated by a cis eQTL in seven tissues (Table 2) from the BXD population, including the midbrain (LOD = 5.0; 1.5 LOD confidence interval on Chr 10 from 74 to 76 Mb) and hippocampus (LOD = 4.1; 1.5 LOD confidence interval on Chr 10 from 69 to 79 Mb) (Fig 2). Inheritance of the D allele confers higher expression in all regions. Although expression across the BXD set is higher in the liver, there is no significant cis modulation of expression detected. Gstt2 is located in a variant poor region and, in both midbrain and hippocampus, it is the only gene within each respective 1.5 LOD confidence interval with demonstrable cis modulation of expression. Two intronic variants in Gstt2 are segregating among the BXD population but their effect on expression is unknown. Due to the location of these variants in introns, validation by ASE analysis was not possible.
Fig 2. Summary of expression and QTL mapping across BXD strains for Gstt2.

Top two panels (bar plots) show expression of Gstt2 in each BXD strain in hippocampus and midbrain. Average log2 expression is shown on the y-axis and unique strains are shown on the X-axis. Red and blue indicate inheritance of the paternal D or maternal B allele of Gsta4 in each strain, respectively. Black indicates a heterozygous (likely erroneous) genotype call. Higher expression is associated with inheritance of the D allele. Bottom panel shows the genetic mapping results in each tissue. Association strength (LOD) is shown on the Y-axis and plotted across the genome on the X-axis (by chromosome) for hippocampus (blue) and midbrain (red). Genome-wide significance is determined by permutation (n = 5000) with the threshold for significance indicated as black (significant, p <0.05) and grey (suggestive, p < 0.3) horizontal lines. Expression of Gstt2 is modulated by variants within or near its own locus on Chr 10, a cis eQTL.
Multiple transcripts are downstream of the variation in Gstt2
No public traits in the BXD Published Phenotypes Database significantly mapped back to the Gstt2 locus. However, hippocampal expression of Apold1 (LOD = 2.5) and Nfasc (LOD = 2.4) map to the Gstt2 locus (74.4 Mb) and both traits are negatively correlated with the expression of Gstt2 (r < -0.37, p < 0.005) (S3 Fig). Apold1 is an endothelial cell early response gene that may be important for endothelial cell signaling and vascular function [64] and Nfasc is an L1 family immunoglobulin cell adhesion molecule implicated in axon targeting and synapse formation during development [65]. In midbrain, several transcripts map back to the Gstt2 locus at LOD > 2 and are correlated (|r| > 0.4, p < 0.01) with Gstt2 expression (S4 Fig). These include genes with a putative role in transcription (Aebp2), translation (Eif4a1), development (Hoxb, Mtpn), cell survival (Fgf12), inhibition of mTOR (Deptor) [66], dopamine and serotonin synthesis (Ddc), glutamate transport (Slc17a7), and uptake of long chain fatty acids (Slc27a3).
Diverse phenotypes and genes enriched for metabolic processes are correlated with Gstt2 in hippocampus
Exploration of the top 500 correlates of Gstt2 in midbrain did not reveal any significant enrichment of biological function. However, the top correlates of Gstt2 in hippocampus support a role in protein metabolism and cellular respiration (S4 Table). We expanded this analysis by asking whether variation in hippocampal Gstt2 expression covaried with trait data in the BXD Published Phenotypes Database. We found a wide range of immune, morphological, and behavioral phenotypes that were significantly (p < 0.005) associated with variation in Gstt2 in hippocampus, including susceptibility to Coccidiodies immitis (Valley Fever) fungal infection (record ID = 13043, r = 0.61, n = 30), glomerular cell counts in kidney in a long term diabetes model induced by streptozotocin treatment (record ID = 12597, r = -0.51, n = 35), corticosterone plasma concentration following saline injection (record ID = 10574, r = 0.67, n = 18), thymus weight after chronic mild stress (record ID = 13584, r = 0.83, n = 13), total neuron number in striatum (record ID = 13439, r = -0.41, n = 62), femur bone mineral density (record ID = 15967, r = 0.50, n = 40), and preference for 10% ethanol (record ID = 10142, r = 0.65, n = 19).
Gstz1
Expression is high with a modest level of variation (1.3-fold) in midbrain while expression in the hippocampus is average and more variable with a fold change of over 1.5 (Fig 3). Cis-modulation of expression is observed in four brain tissues in the BXD set (Table 2), including midbrain (LOD = 17.4; 1.5 LOD confidence interval from 88 to 90 Mb on Chr 12) and hippocampus (LOD = 2.9) (Fig 3). In addition, a significant cis eQTL is also detected in crosses between A/J (A) and B6 (B), B6 and C3H/HeJ (H), and CAST/EiJ (CT) and B6 (Table 2). Higher expression is associated with inheritance of the D allele in the BXD set. In contrast, the parental allele associated with higher expression varies in other crosses, such that expression is higher for inheritance of A or CT alleles compared to the B allele and higher for inheritance of the B allele compared to the H allele. This pattern might be expected if several functional variants are segregating among inbred mouse strains.
Fig 3. Summary of expression and QTL mapping across BXD strains for Gstz1.

Top two panels (bar plots) show expression of Gstz1 in each BXD strain in hippocampus and midbrain. Average log2 expression is shown on the y-axis and unique strains are shown on the X-axis. Red and blue indicate inheritance of the paternal D or maternal B allele of Gstz1 in each strain, respectively. Higher expression is associated with inheritance of the D allele. Bottom panel shows the genetic mapping results in each tissue. Association strength (LOD) is shown on the Y-axis and plotted across the genome on the X-axis (by chromosome) for hippocampus (blue) and midbrain (red). Genome-wide significance is determined by permutation (n = 5000) with the threshold for significance indicated as black (significant, p <0.05) and grey (suggestive, p < 0.3) horizontal lines. Expression of Gstz1 is modulated by variants within or near its own locus on Chr 12, a cis eQTL.
Gstz1 is polymorphic between the B6 and D2 parental strains with four SNPs in the 3’ UTR and one in an intron, however no allelic imbalance was detected for this gene in lung and liver using ASE. There was a trend towards allelic imbalance in the hippocampus with higher expression driven by the D allele but this was not significant (p = 0.15) (Table 3). Gstz1 is located within a region that is relatively gene and variant sparse. In midbrain and hippocampus the only other cis-modulated gene is Tmed8, located on Chr 12 at 88.51 Mb, however, the function of Tmed8 is not well defined.
Multiple transcripts are modulated by variation in Gstz1
No higher order phenotypes significantly map back to the Gstz1 locus. However, in the hippocampus, expression of the pro-apoptotic gene Scotin, the splicing factor Sf3b1, and the mitochondrial inner membrane protein gene Tmem65 are significantly modulated (LOD > 2) by variation at this locus (S5 Fig). In the midbrain, the mitochondrial gene Cstad, the nerve growth factor-induced early expression gene Egr4, the potassium large conductance calcium activated channel Kcnma1, and the RNA binding repressor gene Rbm15 are also significantly modulated by variation at the Gszt1 locus (S5 Fig).
Correlates of Gstz1 suggest a role in a wide range of phenotypes and cellular metabolic processes
A diverse set of phenotypes is significantly (P < 0.005) correlated with Gstz1 expression in hippocampus and midbrain. Metabolic, pharmacological, and brain electrophysiological traits, such as body temperature after a 4 g/kg injection of ethanol (record ID = 10521, r = -0.70, n = 16), copper level in ventral midbrain (record ID = 10729, r = -0.70, n = 14) and iron level in dorsal striatum (record ID = 10242, r = -0.70, n = 14), acute locomotor response to a 1.5 g/kg injection of ethanol (record ID = 10125, r = 0.58, n = 23), activity in the closed quadrants of the elevated zero maze after a 1.8 g/kg injection of ethanol (record ID = 12374, r = -0.37, n = 59), and brain activity and coherence (record ID = 17107, r = -0.76, n = 14), are correlated with hippocampal Gstz1 expression. Blood chemistry and morphological traits—mean blood cell volume (record ID = 12942, r = 0.48, n = 35), adrenal weight (record ID = 12071, r = -0.45, n = 58), adrenal X-zone width (record ID = 11273, r = -0.37, n = 59), thalamic geniculate nuclei volume (record ID = 10934, r = 0.73, n = 12)—are also well correlated. Finally, traits relating to pain sensitivity, activity, and anxiety are significantly correlated with Gstz1 expression in hippocampus, including activity after the first and second tone-shock pairing in the fear conditioning paradigm (record ID = 11914, r = 0.42, n = 54; 11915, r = 0.45, n = 54), response to mechanical nociception (record ID = 11823, r = -0.42, n = 55), and novel open field activity (record ID = 10916, r = 0.67, n = 17).
Expression of Gstz1 in the midbrain is correlated with several pharmacological and behavioral traits including, handling induced convulsions after a 4 g/kg ethanol injection (record ID = 11382, r = -0.85, n = 9), acceptance of 10% ethanol solutions (record ID = 10138, r = -0.60, n = 20), and activity suppression to a cue in the fear conditioning paradigm (record ID = 11917, r = 0.50, n = 32).
The top 500 correlates of Gstz1 expression in hippocampus and midbrain are significantly enriched for metabolic terms (S5 Table). Genes in the hippocampal Gstz1 network were also enriched for the functional categories of rRNA binding and structural constituent of ribosome. In contrast, genes in the midbrain Gstz1 network were enriched for transcription related terms.
Gsto1
In most tissues, Gsto1 is well expressed and variable across the BXD population (Fig 4). Nearly 60% of the variation between individual BXD strains can be explained by a genetic component (hippocampus, 1416531_at, h2 = 0.56) and inheritance of the B allele is always associated with higher expression (Fig 5). A cis-eQTL for Gsto1 was consistently detected in 20 tissues from the BXD set (Table 2) The 1.5 LOD confidence interval for the cis-eQTL is between 47.1 and 48.0 Mb at markers rs3705264 and rs8257607 (hippocampus), precisely aligned with the position of Gsto1. Molecular validation of the cis-eQTL was performed by ASE assay in lung, liver, and hippocampus (Table 3) with the B allele having a significantly increased number of reads relative to the D allele in all tissues. Variation at the gene and mRNA level is also associated with a modest but significant 1.5–fold increase (p = 0.0013) in Gsto1 protein levels in the hippocampus of B6 relative to D2 as measured by global protein quantification using tandem mass tag technology. Cis-modulation of Gsto1 expression is also detected in crosses between A/J and C57BL/6J, Inbred Long-Sleep (ILS) and Short-Sleep (ISS), and a mouse diversity panel.
Fig 4. Summary of Gsto1 expression across BXD strains.

Panels (bar plots) show expression of Gsto1 in each BXD strain in multiple tissues. Average log2 expression is shown on the y-axis and unique strains are shown on the X-axis. Red and blue indicate inheritance of the paternal D or maternal B allele of Gsto1 in each strain, respectively. If only a single individual was used for expression measurements, error bars are not shown. For genetic reference populations, mapping power is derived from the number of individuals as opposed to the number of biological replicates. Higher expression is associated with inheritance of the B allele.
Fig 5. Summary of QTL mapping of Gsto1 expression across BXD strains.

Genetic mapping results are shown for brain and peripheral tissue. Association strength (LOD) is shown on the Y-axis and plotted across the genome on the X-axis (by chromosome) in each QTL map. Genome-wide significance is determined by permutation (n = 5000) with the threshold for significance indicated as black (significant, p <0.05) and grey (suggestive, p < 0.3) horizontal lines. Expression of Gsto1 is modulated by variants within or near its own locus on Chr 19, a cis eQTL.
Many variants within the Gsto1 gene are segregating among the BXD population that could account for the variation at this locus, including a 5’ UTR SNP, three SNPs located in the 3’ UTR, three synonymous variants in exons, and 47 intronic SNPs, one of which is located in a splice region. Unlike previously discussed GSTs, Gsto1 resides within a gene- and variant-rich region that contains 10 other well expressed genes modulated by significant cis-eQTLs (LOD > 3.3 or LRS > 15) located within 4 Mb of the Gsto1 locus (Fig 6). An important consideration in the analysis of Gsto1 biological networks and downstream traits is the effect of linkage disequilibrium at this locus. For example, internexin neuronal intermediate filament protein alpha (Ina) is located within 1 Mb of Gsto1 at 47.01 Mb and is associated with a strong cis-eQTL (1448992_at; LOD = 20). Ina is a major structural component of the cytoskeleton that is expressed primarily in neurons and involved in axonal architecture. Overexpression of Ina leads to neuronal death and degeneration in cortex, thalamus, and cerebellum [67] and is a signature of neuronal interfilament inclusion disease in humans. INA immunoreactivity is also observed in other neurodegenerative disorders, such as AD [68]. Phenotypes and genes that map into this locus, correlations between Gsto1 and Ina, and correlations between other genes and Gsto1 could result from shared biological function or result from the proximity of other cis-modulated genes that are in linkage disequilibrium at this locus.
Fig 6. Summary of recombination and linkage disequilibrium near the Gsto1 locus.
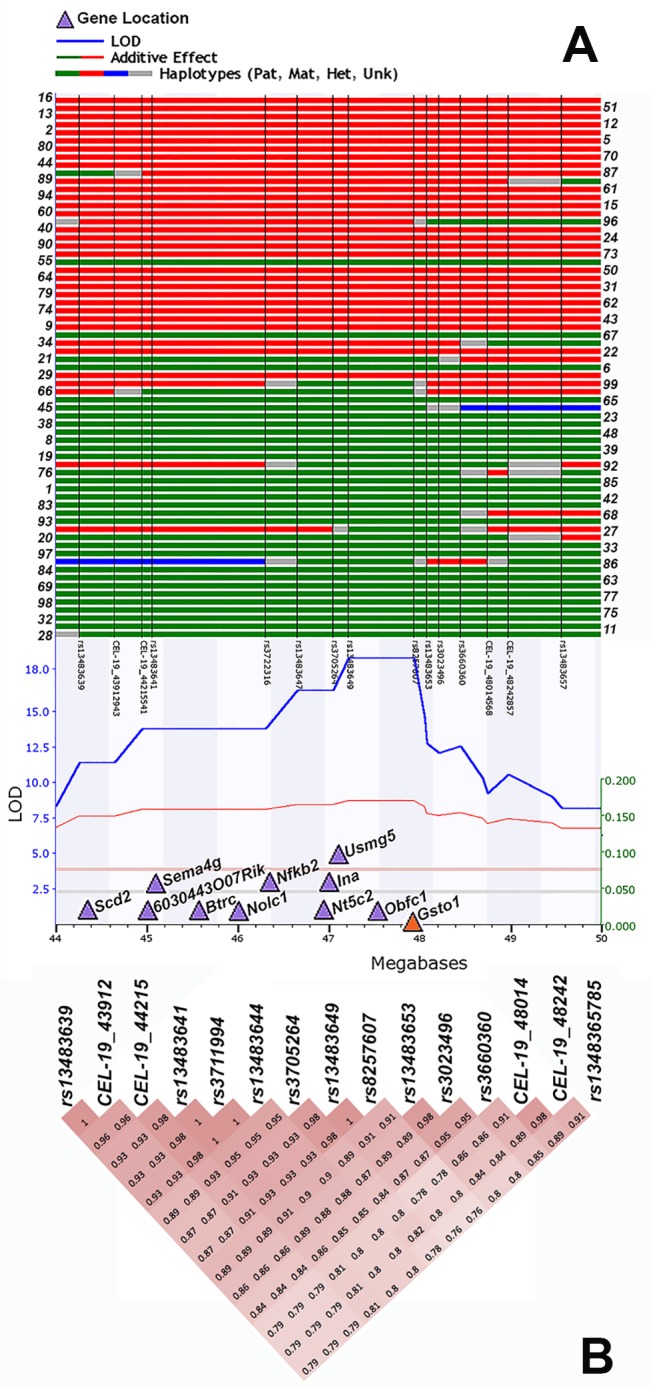
(A) The association score (LOD) (y-axis) for Gsto1 expression in the hippocampus is plotted as a solid blue line across the genome (x-axis) with horizontal lines indicating significance thresholds for significant (red) and suggestive (grey) LOD values. The physical position of Gsto1 is indicated by the orange triangle and the locations of other cis-modulated genes are shown as light purple triangles. Haplotypes are shown above the linkage map for BXD strains with strain number shown to the right and left of the haplotypes. Vertical black lines designate marker position with marker names below the haplotype map. Red and green blocks indicate a chromosomal region inherited from the maternal B6 or paternal D2 strain, respectively. Blue areas are heterozygous and grey areas are undefined meaning that more markers would be needed to pinpoint the exact recombination breakpoint. As expected for a recombinant inbred population, this region is primarily inherited as an entire haplotype block from either parental strain. (B) Pairwise correlations between markers in the region are shown. Intensity reflects correlation strength. Markers in this region are tightly linked.
Partial correlation analysis reveals underlying biology of Gsto1 correlates
To address linkage near the Gsto1 locus and identify true biological correlates of Gsto1, we controlled for the genetic variation at both loci (Ina and Gsto1) in hippocampus using partial correlation analysis. Residual expression correlates of Gsto1 are likely to be valid partners and reflect underlying biology resulting from small effect loci on other chromosomes and larger network associations. We focused on the hippocampus because this tissue is especially vulnerable to neurodegeneration, for which susceptibility has been linked to polymorphisms in human GSTO1. We found 2797 probe sets corresponding to 2384 unique genes that are high residual correlates of Gsto1 (p < 0.001) after partial correlation (S6 Table). In order to identify known and latent relations between co-expressed genes, we carried out a literature correlation analysis. Among these candidates, 128 unique genes shared a high co-incidence of literature citations with Gsto1 (r > 0.5) (S7 Table). This gene set is highly significantly enriched (adjP < 0.001) for many metabolic GO terms as well as localization to mitochondria (S8 Table).
Multiple resources including Chillibot, Alzheimer Disease & Frontotemporal Dementia Mutation Database, the ALZGENE database, and Pubmed were used to determine whether members of the Gsto1 coexpression network had been previously associated with AD or other neurodegenerative disorders. We identified 25 network members, including Gsto1, that are associated with AD in two or more databases (S6 Fig, S9 Table). Nearly half of these genes are localized to mitochondria, including Aldh2, Sod2, Grn, Dlst, Fxn, Hmgcs2, Acat1, Chmp2b, Oat, and Dld. Many genes play a role in metabolic processes, including small molecule metabolism (Gba, Hmgcs2, and Coasy), carboxylic acid metabolism (Gstm1, Gart, Sod2, Dlst, Acsbg1, Gsto1, and Dld), and oxidation-reduction processes (Acp1, Blvra, Aldh2, Cygb, and Fxn).
Correlates of GSTO1 in human datasets support a role in mitochondrial metabolic processes
As a heterogeneous group, humans have a greater amount of genomic variation—from 10 to 40 million segregating SNPs—compared to ~5 million among the BXD family, and a much higher recombination frequency that mitigates problems with linkage disequilibrium. We leveraged a cortical gene expression data set from a mostly Caucasian population contributed by Webster and colleagues in order to explore variation and network relations. The level of GSTO1 mRNA varies roughly 20–fold between 160 AD cases and 186 controls in cortex. There is a small (~1.2–fold) but significant (p = 0.0002) decrease in GSTO1 expression in AD cases compared to controls. The top 1000 correlates of GSTO1 in the AD data set are connected by a correlation of |0.45| or better and are also enriched for location in the mitochondrion (136 genes, adjP = 2.75e-08) as well as several other metabolic terms (S10 Table). These results support a role for GSTO1 in mitochondrial related processes that are conserved between human and rodent and may be involved in neurodegenerative disease pathways.
Multiple phenotypes may be controlled by variation in Gsto1
Analysis of phenotypes that map back to the Gsto1 locus in the BXD population identified morphological and pharmacological traits, including cortical grey matter volume (record ID = 10754, LOD = 2.2) and tolerance to the hypothermic effects of the dopamine D2 and D3 receptor selective agonist quinpirole (record ID = 10048, LOD = 3.7). These traits may be regulated by variation in the Gsto1 locus or variation of neighboring cis-modulated genes.
Mgst3
Expression is more robust in brain compared to liver (Fig 7). Variation across the BXD population is moderate in midbrain and amygdala (~1.5-fold), greater than 2-fold in hippocampus and prefrontal cortex, and greater than 7-fold in liver and hepatocytes (Fig 7). Mgst3 is modulated by a strong and significant cis eQTL in 18 different tissues from the BXD set (Table 2, Fig 8). Cis modulation of expression is also detected in F2 crosses between B6 and D2 and CAST/EiJ and B6 (CTB6F2). In most data sets the 1.5 LOD confidence interval is 2 Mb and inheritance of the D allele confers higher expression. Inheritance of the B allele confers higher expression in the CTB6F2 cross.
Fig 7. Summary of Mgst3 expression across BXD strains.

Panels (bar plots) show expression of Mgst3 in each BXD strain in multiple tissues. Average log2 expression is shown on the y-axis and unique strains are shown on the X-axis. Red and blue indicate inheritance of the paternal D or maternal B allele in each strain, respectively. If only a single individual was used for expression measurements, error bars are not shown. For genetic reference populations, mapping power is derived from the number of individuals as opposed to the number of biological replicates. Higher expression is associated with inheritance of the D allele.
Fig 8. Summary of QTL mapping of Mgst3 expression across BXD strains.

Genetic mapping results are shown for brain and peripheral tissue. Association strength (LOD) is shown on the Y-axis and plotted across the genome on the X-axis (by chromosome) in each QTL map. Genome-wide significance is determined by permutation (n = 5000) with the threshold for significance indicated as black (significant, p <0.05) and grey (suggestive, p < 0.3) horizontal lines. Expression of Mgst3 is modulated by variants within or near its own locus (distal Chr 1), a cis eQTL.
Mgst3 is highly polymorphic between B6 and D2 with 239 intronic and 56 UTR SNPs or small indels. Similar to the other cis-modulated GSTs, one or more non-coding variants underlie the expression variation at this locus as the cis eQTL for Mgst3 has been validated by ASE in both liver and hippocampus (Table 3). Mgst3 resides in a variant rich but relatively gene sparse region, although several neighboring genes (within 2 Mb of Mgst3) are also significantly cis-modulated (LOD > 2) in multiple data sets. This includes two genes involved in developmental processes, Pbx1 (pre B cell leukemia homeobox 1) and Tmco1 (transmembrane coiled-coil domains protein 1) that are cis modulated in hippocampus and midbrain and Pogo transposable element with KRAB domain (Pogk) that is cis-modulated in midbrain and amygdala. Immunoglobulin-like domain containing receptor 2 (Ildr2), an endoplasmic reticulum protein involved in lipid homeostasis, is cis-modulated in hippocampus and amygdala. No neighboring genes within 2 Mb of Mgst3 are cis-modulated across BXD liver tissue, although transcriptional adaptor 1 (Tada1), which is part of the STAGA histone acetyltransferase complex, is cis-modulated in liver hepatocytes and amygdala. Although several genes are cis-modulated in one or two tissues, Mgst3 is the only gene in this interval consistently cis-modulated across all BXD brain and liver datasets surveyed.
Multiple traits are modulated by variation in Mgst3
To investigate the biological impact of Mgst3 variation, we identified higher order phenotypes and transcripts that mapped to within 2 Mb of the locus on Chr 1. Measures of iron, brain morphology, and activity level mapped back to the Mgst3 locus, including iron level in spleen (record ID = 10811, LOD = 2.6), hippocampus weight (record ID = 13031, LOD = 3.9), and activity measured under a variety of paradigms and treatments (record ID = 11947, LOD = 4.3; record ID = 12370, LOD = 4.7; record ID = 12441, LOD = 3.7; record ID = 12439, LOD = 2.6; record ID = 12440, LOD = 3.9; record ID = 12409, LOD = 5.4; record ID = 12371, LOD = 4.4; record ID = 12369, LOD = 3.5).
Multiple transcripts in liver and brain are regulated from the location of Mgst3 and are significantly co-expressed. In liver, the expression of syndecan binding protein (Sdcbp, r = 0.48), an adaptor protein thought to modulate multiple signaling pathways whose expression is altered in a number of different cancers [69], is regulated from the Mgst3 locus. In hepatocytes, acyl-Coenzyme A dehydrogenase, medium chain (Acadm, r = 0.67), D-tyrosyl-tRNA deaylase 1 (Dtd1, r = 0.68), cytochrome P450, family 2, subfamily b, vertin (Vrtn, r = -0.66), polypeptide 23 (Cyp2b23, r = -0.71) and signal sequence receptor beta (Ssr2, r = -0.72) map back to the location of Mgst3. Ssr2 is involved in targeting secretory proteins to the endoplasmic reticulum. Acadm is a mitochondrial flavoprotein involved in fatty acid beta-oxidation and deletion of this gene in mice is associated with fasting and cold intolerance [70]. Cyp2b family members are involved in metabolism and detoxification of a broad range of endogenous and exogenous substrates and Dtd1 is involved in recycling of metabolically inactive D-amino acid tRNA molecules (e.g. D-tyrosine, D-tryptophan, D-aspartic acid) [71],. Finally, the conserved mammalian gene Vrt is thought to regulate fat deposition in pigs [72].
A surprising number of transcripts are partly regulated from the Mgst3 locus in hippocampus and midbrain where 67 and 52 unique transcripts are regulated by a LOD of 2 or more, respectively. Of these transcripts, 41 are also significantly correlated (p < 0.01 and |r| > 0.3) with Mgst3 expression in hippocampus and 52 are significantly correlated in midbrain (S11 Table). The vast majority of these correlations are negative and the only overlapping transcript is the multifaceted signaling molecule, casein kinase 1, alpha 1 (Csnk1a1). All downstream targets from both regions were combined into one set and the ConsensusPathDB-mouse web service (http://cpdb.molgen.mpg.de/MCPDB; [73]) was used to search for overrepresented GO, KEGG, and Reactome annotations. Few GO categories showed significant enrichment after multiple test correction; however, Signaling to p38 via RIT and RIN (n = 3, q-value = 0.04; Raf1, Rit2, Hras1), RAF activation (n = 2, q-value = 0.04; Raf1, Hras1), and L-ascorbate biosynthesis VI (n = 2, q-value = 0.04; Ugp2, Akr1a1) were significantly enriched in the list of downstream targets. In contrast, no significantly modulated downstream transcripts were detected for prefrontal cortex and, of the five transcripts detected in amygdala (Afg3l1, Cplx1, Peli3, Rpl30, Sh3bp5l), only mitochondrial targeted ATPase family gene 3-like 1 (Afg3l1) and complexin 1 (Cplx1), a modulator of synaptic vesicle release, is positively correlated with Mgst3.
Correlates of Mgst3 in mouse and human populations suggest a role in energy production
Similar to Gsto1, linkage disequilibrium confounds attempts to definitively assign subsets of downstream genes and phenotypes to variation in Mgst3. As linkage disequilibrium is reduced in human populations we compared the top 500 correlates of Mgst3 in mouse and human brain and found them to be enriched for GO categories associated with energy production and metabolism. In BXD midbrain, the top correlates are enriched for ATPase activity coupled to transmembrane movement of substances and mitochondrial proton-transporting ATP synthase complex (S12 Table). The top correlates in 187 normal aged human cortical samples are enriched for respiratory electron transport chain, ATP biosynthetic process, mitochondrion, and mitochondrial inner membrane (S13 Table).
GST superfamily expression is correlated in both brain and peripheral tissue
In addition to exploring the genetic regulation of individual GSTs, we also explored interactions among all family members and found that there is extensive covariation in hippocampus and liver. Covariation can be driven by shared biological function, transcriptional regulation, or genetic regulation. Close physical proximity on chromosomes can drive coexpression through common transcriptional control. Paralogs of the alpha, mu, omega, and theta class are located in gene clusters on Chrs 9 (78 Mb), 3 (107.7Mb), 19 (47.9 Mb), and 10 (75.2 Mb), respectively. Theta class members Gstt1-3 demonstrate robust expression covariation and Mu class members Gstm1, Gstm5, Gstm7, and Gstm2 are also well correlated (Fig 9). In contrast, Alpha and Omega paralogs do not display extensive covariation. No common genetic mechanism—such as a single regulatory locus or quantitative trait loci (QTL)—was detected that modulates the expression of multiple GSTs, suggesting that coexpression in these tissues is primarily driven by shared biological function and close physical proximity.
Fig 9. GST coexpression networks in brain and liver.

Top and bottom panels show GST coexpression networks in hippocampus and liver, respectively. Positive correlations are indicated by warm line (edge) colors and negative correlations are indicated by cool edge colors. In addition, correlations greater than |0.7| are indicated as bold lines and those less than |0.5| are indicated by dashed lines. All correlations are greater than |0.3|. The expression of many GST genes is positively correlated.
In hippocampus, nearly all members of the GST network are connected by at least two edges (|r| > 0.3) with the exception of Gsta2 and genes with low expression in hippocampus (Ptgds, Mgst2, and Gstm4; Fig 9). Correlations in the hippocampal GST network are mostly positive with the notable exception of most edges connecting Gstm3. Several GSTs, including Gstk1, Gstt1-3, and Mgst1, are network hubs with connectivity greater than seven nodes. The expression of Gstm2, Gstt1, Gstk1, Mgst1, and Gsta4 is tightly correlated and these genes are highly interconnected. The first principle component (PC1) of this module explains nearly 60% of the covariation in expression and was used as a signature to find additional highly correlated genes in hippocampus. The top 500 genes in this GST network are significantly enriched for localization to the mitochondrion and many metabolic and antioxidant related process (S14 and S15 Tables). Taken together these results suggests that clustering of physically unlinked GST family members in brain is most likely due to underlying biology and the role of these genes in energy production and metabolic homeostasis.
Expression covariation of GSTs is even more pronounced in liver (Fig 9). Network connections are overwhelmingly positive and there is a much higher degree of network connectivity when compared to brain. Gstm5 is unconnected from the network at a threshold of |r| > 0.3 and genes with low expression—Mgst3 and Ptgds—are not well connected. Interestingly, positive and negative correlations are not well conserved between the hippocampus and liver network and may result from differences in expression level, which tends to be higher in liver, or tissue heterogeneity, which is greater in brain. However, comparison of tightly correlated but physically unlinked GSTs in liver revealed the same underlying network biology. Gstm1, Gsta2, Gstm6, Gstt1, Gstk1, and Gstz1 cluster tightly and PC1 captures over 70% of the variance in coexpression. The top 500 correlates of the GST network signature in liver are also significantly enriched for localization to the mitochondrion and metabolic terms (S16 and S17 Tables). Despite the strong overlap of biological function associated with both GST networks there is only about a 9% overlap between the top correlates in liver in brain, suggesting tissue specific expression of correlated metabolic genes in these tissues.
Discussion
The GST family of enzymes utilize glutathione and contribute to the biotransformation and disposition of many compounds, including drugs, pesticides, carcinogens, and products of oxidative stress. Alterations in the function of these genes may act as a risk factor for disease. Here, we have investigated the genetic regulation of GSTs and addressed the potential impact of naturally occurring variation in one component of the glutathione system. Our study is the first such attempt to systematically investigate the cause and consequences of variation in GSTs using a diverse genetic population.
Similar to human populations, the BXD family exhibits a wide range of variation in the expression of GST family members. As expected, physically linked paralogs, such as members of the Theta and Mu class, demonstrate coordinately regulated expression. However, many unlinked GST family members are coexpressed in brain and peripheral tissue and the top correlates of each network are significantly enriched for metabolic terms, confirming that GSTs have broad and overlapping roles in cellular metabolic processes. The covariation between members of the GST network is primarily driven by this underlying biological function as no strong QTLs associated with network coexpression were detected under baseline conditions. In some ways this result is surprising since many genes involved in oxidative stress pathways, including GSTs, are known to contain antioxidant response elements in their promoters [2] and are regulated by the Nrf2 antioxidant response element signaling pathway under both basal and stress conditions [74]. Nrf2, commonly known as Nfe2l2, is actually well correlated (r = 0.6, n = 67, p = 3.77E-08) with expression of the GST network in hippocampus (S2 Table) but does not show cis-modulation of expression in the BXD population. In the absence of strong genetic variants in key control genes, Nfe2l2 and other transcriptional regulators likely work together to modulate baseline expression of GSTs and other metabolic and antioxidant response genes and it is this shared biology that drives network correlations. Although beyond the scope of this paper, a detailed analysis of transcription factors correlated with GST networks across tissues may reveal additional general or tissue-specific transcriptional regulators of genes involved in the response to antioxidants or metabolic stress.
Based on careful genetic analysis of individual GST expression across the BXD population, we identified five GSTs, Gsta4, Gstt2, Gstz1, Mgst3, and Gsto1, whose expression is regulated by distinct and local sequence variants in one or more tissues. We were able to replicate and validate cis eQTLs for Gsta4, Gsto1, and Mgst3 using RNA-seq based ASE assays. This finding is significant because mutations in these genes have a functional impact on transcript expression and have the potential to modulate additional traits. The wealth of multiscalar trait data accumulated since the late 1970’s for the BXD family allowed for a detailed interrogation of the effect of segregating mutations in all five genes.
Minimal obvious impact of Gstt2 and Gstz1 variants
The cis eQTLs in Gstt2 and Gstz1 could not be confirmed by ASE due to the lack of an informative coding variant and relatively low hippocampal expression, respectively. Both GSTs reside in relatively gene or variant sparse regions and are the only genes within each interval with local modulation of expression. Coding mutations—missense, stop, or deletions—could alter protein function without a concomitant change in gene expression and, consequently, would not be identified as cis eQTLs. A search for high impact coding variants in all genes located within each respective QTL confidence interval was conducted for Gstt2 and Gstz1 using inbred strain genomic sequence data available and annotated by the Wellcome Trust Sanger Institute (http://www.sanger.ac.uk/sanger/Mouse_SnpViewer/rel-1303; [45]). This analysis did not reveal any genes within the confidence interval with potentially damaging coding variants, except for a frameshift mutation in a predicted gene model Gm6803 located in the Gstz1 interval. Gstt2 and Gstz1 are therefore good candidates for modulating any traits that map back to the vicinity of each gene. However, these genes appear to exert only a subtle effect on phenotype with few transcripts or higher order traits mapping back to either locus. Variation in Gstt2 or Gstz1 may be buffered by the activities of other GSTs and genes with overlapping functions, or an effect may only be evident after a challenge to the system.
Compensation or buffering is an important consideration for Gstt2 as there are multiple highly related Theta class members in the mouse genome. Gstt1 and Gstt2, for example, share greater than 50% sequence homology in both rodents and humans. However, in humans there are only two theta class members, compared to four in mice, and the locus is very complex; GSTT1 is frequently deleted [75–78] and an inverted duplication of GSTT2 leads to the transcription of pseudogenes whose function is not well defined [76,79]. While several studies have reported associations between GSTT2 and differential cancer susceptibility [79–81], the potential role of this gene is still unclear due to the structural complexity of this locus in humans. Several targeted mutations of murine Gstt2 are available, however, phenotypic abnormalities have yet to be reported (Mouse Genome Informatics, www.informatics.jax.org). The lack of a strong phenotype upon deletion is consistent with our lack of evidence for direct genetic control over more complex traits, however, multiple transcripts are modulated from the Gstt2 locus in the BXD population. These genes play a role in development and cell growth including, Apold1, Aebp2, Eif4a1, Hoxb, Mtpn, Fgf12, Deptor, Nfasc. Our genetic dissection of transcripts modulated by variation in Gstt2 in the BXD population suggests a plausible link between regulation of cell growth pathways and cancer GWAS [79–81] and further investigation is warranted.
The failure to associate robust trait variation to segregating mutations in Gstz1 is perhaps especially surprising as this gene has no paralogs and plays a distinct role in both rodents and humans in the catabolism of phenylalanine and tyrosine [82] and in the biotransformation of dichloroacetate (DCA, a chemotherapeutic agent that also inactivates Gstz1) to glyoxylate [83]. Indeed, deletion of this gene in mice leads to upregulation of alpha, mu, and pi class GSTs and is also associated with increased sensitivity to diets high in phenylalanine and tyrosine [84,85]. These strong effects are puzzling given our findings, however, naturally occurring variants in regulatory regions are expected to result in smaller expression changes than complete gene deletion and may therefore exert a more modest influence on phenotype. In humans there are common haplotypes in GSTZ1 that could affect gene function [86], although the implications on metabolic function or pharmacokinetics of drug metabolism remain unclear [11]. The BXD family would thus be ideally suited for targeted dietary or toxicological studies to evaluate potential consequences of naturally occurring variation in Gstz1.
Strong and consistent variation in Gsto1 levels is not associated with major phenotypic abnormalities
Both members of the Omega class are conserved between human and rodent but only Gsto1 demonstrates significant cis-modulation of expression in the BXD population. Interestingly, this variation has only modest effects on downstream trait variation. In humans, a locus on human chromosome 10q that contains both GSTO1 and GSTO2 has been implicated in risk and age-at-onset of AD [87–89]. Li and colleagues also detected significantly lower GSTO1 levels in the hippocampus of AD patients compared to controls, and alleles of GSTO1 are significantly associated with age-at-onset for AD and Parkinson’s disease (PD) [88]. Despite these findings, several follow-up studies have been published with mixed results [90–93]. GSTO1 is also thought to play a role in inflammation [94], arsenic and alpha-haloketone biotransformation [95,96], and reduction of S-(phenacyl)glutathiones, such as S-(4-nitrophenacyl)glutathione [96]. However, deletion of Gsto1 in mice does not produce an observable phenotype [97] and GSTO1 deficiency in a human breast cancer cell line does not alter sensitivity to arsenic or cytotoxic cancer drugs [95] Despite these discordant findings Gsto1 expression is highly correlated with many metabolic genes, some of which are involved in AD pathways. Among the 2384 unique gene correlates of Gsto1 expression in hippocampus are 128 genes that share a high co-incidence of literature citations—24 of which are known to be associated with AD or dementia, including well studied candidates Chmp2b, Optn, Dlst, Sod2, and Acat1 [98–107]. GSTO1 expression in the cortex of human AD and control cases is highly variable and a significant decrease in GSTO1 levels is evident among AD cases. In both human (AD and control cases) and mouse GSTO1 correlation networks we found significant enrichment for mitochondrial genes. Although probably not the main genetic driver, GSTO1 could interact with other variants, environmental exposure, and aging processes to influence AD risk and pathology, perhaps through changes in glutathione regulation, metabolic processes, or mitochondrial function. Mitochondrial dysfunction has long been implicated in a neurodegenerative disorders such as AD, PD, Huntington’s disease, and amyotrophic lateral sclerosis [108,109]. A direct link between GSTO1 and mitochondrial function has not yet been reported but is suggested in both our human and mouse brain expression networks and further investigation is warranted
Variants in Gsta4 exert a downstream effect on trait variation
We found that expression of Gsta4 is variable and modulated by local sequence variants in the BXD and other murine populations. In primates and rodents, Gsta4 has a high affinity for a major byproduct of lipid peroxidation, 4-hydroxynon-2-enal (4-HNE) [110]. Toxic by-products of lipid peroxidation such as 4-HNE act as signaling molecules and markers of peroxidation that are often elevated after tissue injury or in inflammatory and degenerative diseases, including Parkinson’s Disease [111]. There is also evidence that higher levels of Gsta4 may protect against neurodegeneration, especially after traumatic brain injury, which is associated with elevated levels of 4-HNE [112]. Non-coding variants segregate among human populations, but it remains to be seen how these impact gene expression [113]. However, variation at GSTA4 has been associated with epilepsy remission following pharmacological intervention [114], suggesting a possible role in drug metabolism in addition to a putative neuroprotective role. Gsta4 null mice show a range of tissue-specific phenotypes, including susceptibility to oxidative stress [110], CCl4 hepatotoxicity [115], and increased mitochondrial dysfunction and protein carbonylation in adipose tissue [116].
Based on the biological function of Gsta4 and the strong phenotype after deletion, we expected Gsta4 variation to exert a downstream effect on gene expression and higher order phenotypes in the BXD panel. Indeed, our results support both known and novel functions. For example, Cxcl2 (prefrontal cortex), Bet1 (liver), and Nosip (hippocampus) are modulated by variation in Gsta4 and are involved in response to lipid peroxidation. In Gsta4 knockout mice, exposure to an alcohol liquid diet results in increased lipid peroxidation and expression of multiple inflammatory markers, including Cxcl2 [117]. Bet1 expression has been shown to increase during ER stress [118], which can be induced by various insults, including accumulation of misfolded proteins and by lipid oxidation byproducts such as 4HNE [119]. Combination of superoxide and the signaling molecule nitric oxide (NO) can generate peroxynitrite anions that damage membranes and induce lipid peroxidation [120]. Of note, Nosip is a negative regulator of the main enzyme (nitric oxide synthase) responsible for production of NO [121].
Other downstream targets of Gsta4 hint at an overlapping but undefined role in response to oxidative stress and include genes involved in apoptosis (Dedd2), ubiquitination (Fbxo46), transport into the ER (Sec63) transcriptional regulation (Zfp59, Ino8e, Fam60a), immune function (Gm2a, Effs, Ill7rc) and protein targeting to membranes (Pigp). In addition to a role in immune function, Gm2a is also thought to bind and traffic a range of lipid targets, including phosphatidylcholine [122] and could be involved in repair pathways in response to lipid peroxidation.
Finally, several of the gene products that mapped back to the Gsta4 locus in hippocampus are thought to be involved in cognition and behavior (Aust2, Csmd2, Dstyk, Pam). Interestingly, a number of traits related to hippocampal activity and behavior were also partially modulated by variation in Gsta4, such as hippocampal mossy fiber pathway volume, dopaminergic activity (homovanillic acid levels) in the medial septal nucleus, and several measures of locomotor activity. The medial septal nucleus is innervated by dopaminergic projections from the ventral tegmental area [123] and projects to the hippocampal formation. Stimulation of this ascending pathway produces theta wave activity in the hippocampus of rodents [124] that is critical for information processing and memory storage during exploratory behavior [125,126]. These downstream traits suggest a novel role of Gsta4 in exploratory activity, perhaps mediated through the septal-hippocampal pathway.
Although these findings are exciting and warrant further investigation, a caveat of this analysis is linkage disequilibrium and the size of the haplotype blocks in the BXD population. A neighboring gene involved in fatty acid synthesis, Elovl5, is also modulated by a cis eQTL and could be responsible for variation in traits mapping to this locus on chromosome 9. Elovl5 deletion results in female infertility, increased levels of liver triglycerides, and hepatic steatosis [127] with no effect on body weight or other phenotypic abnormalities. In contrast Gsta4 knockout mice exhibit a range of phenotypic alterations including, reduction of 4-HNE conjugating activity and higher baseline levels of 4-HNE [110,115], lower litter size, increased incidence of bacterial infections, greater susceptibility to the herbicide paraquat, higher fat content in bone marrow [110], mitochondrial defects [116] and extended lifespan [128]. The higher burden of phenotypic abnormalities in the Gsta4 knockout mouse and the overlapping roles in lipid peroxidation pathways of downstream targets identified in our study strongly suggest that the majority of traits mapping back to the chromosome 9 locus are indeed modulated primarily by variation in Gsta4 and not Elovl5.
Variants in Mgst3 exert a downstream effect on trait variation
The only membrane-associated microsomal GST family member with consistent genetic modulation of expression among the BXD population is Mgst3. Although not as well studied as some of the other cis-modulated genes, variation has previously been linked to hippocampal size in the BXD population [129]. In addition, activation of stress response transcriptional activators such as PPARα or Nrf2 lead to increased expression of Mgst3 [130] and studies have documented increased Mgst3 expression in liver after caloric restriction [131] and in heart in response to opioidergic preconditioning that is protective against ischemia-induced injury [132]. Conversely, downregulation of Mgst3 has been observed in Alzheimer’s disease [133]. These studies suggest that Mgst3 has overlapping roles with other GSTs in oxidative stress pathways, unlike many of the other MAPEG family members primarily involved in inflammatory pathways [2].
Downstream trait analysis in the BXD family supports involvement of Mgst3 in detoxification and oxidative stress pathways and hints at novel roles in pathways involved in cancer, cell growth, and behavior. In addition to hippocampal size, multiple measures of locomotor activity are modulated from the Mgst3 locus, suggesting that this gene may also play a role in circuitry or metabolism of brain regions involved in exploratory behavior. In liver, nearly all transcripts whose expression is modulated by Mgst3 are involved in some aspect of metabolism or detoxification (Acadm, Cyp2b, Dtd1, Vrt), with the notable exception of Sdcbp which is a signaling molecule implicated in tumor growth and metastasis for melanoma [134], hepatoma [135], lung cancer [136], glioma [137], urothelial cell carcinoma [138], and breast cancer [139]. Hundreds of transcripts map back to the Mgst3 locus in brain, with 67 and 52 modulated in hippocampus and midbrain, respectively. Among these, only Csnk1a1 was significantly modulated by variation in Mgst3 in both regions. Csnk1a1 is known to regulate the Wnt signaling pathway [140], which is frequently disrupted in cancer and modulates cell growth, adhesion, and survival. Loss of function of Csnk1a1 may be related to poor prognosis in colon cancer [141,142]. In addition, alterations in Csnk1a1 function or expression have been implicated in prostate cancer [143], leukemia [144], myelodysplatic syndrome [145], and breast cancer [146]. The large set of genes that are partially controlled by variation in Mgst3 in hippocampus and midbrain are significantly enriched for signaling to p38 via RIT and RIN, RAF activation and L-ascorbate biosynthesis. The P38 signaling pathway is activated by environmental stress, oxidative stress, and cytokine signaling [147,148]. Activation of the Ras/Raf/MEK/ERK signaling pathway is associated with cell growth and survival, and is often altered in oncogenesis [149]. Taken together, systems genetics analysis across the BXD family supports a role for Mgst3 in oxidative stress and metabolic pathways and suggests a possible novel role in cell growth signaling pathways often disrupted in many cancers.
Conclusion
GSTs are part of a larger cell surveillance system involving GSH. This system depends on the actions of genes involved in GSH synthesis (e.g. glutamate cysteine ligase and glutathione synthetase), export of GSH conjugates from the cell by multidrug resistance-associated proteins, and a whole host of enzymes involved in scavenging reactive oxygen species (ROS) and removal of toxic byproducts of cellular respiration, such as aldehyde and alcohol dehydrogenase, catalase, glutathione peroxidase, and superoxide dismutase [2]. Understanding the genetic architecture of GSTs and other members of the GSH surveillance system in the BXD family is critically important for modeling human disease and pharmacokinetics in murine populations and for evaluating the biological impact of these genes. Multiple GSTs, including Gsta4, Mgst3, Gstt2, Gstz1, and Gsto1 are variable among the BXD population with some individuals carrying mutations that alter gene expression. Future studies can leverage this variation in the BXD cohort to test the influence of these variants in response to perturbations such as exposure to drugs or toxins, cancer, or neurodegeneration, or to evaluate novel associations in human GWAS. Here we used an integrative translational approach to characterize gene regulation and co-expression, and to identify potential downstream targets of GST genes. Our analysis provides new insight into the biological function of GSTs and possible mechanistic links to disease.
Supporting Information
Genetic mapping results are shown for traits from the BXD Published Phenotypes Database. Association strength (LOD) is shown on the Y-axis and plotted over a 30 Mb region spanning the Gsta4 cis eQTL. Line colors show results of interval mapping for each trait plotted on the same scale according to the legend (upper left corner). Homovanillic acid levels (record ID = 12801, LOD = 2.7) and 5-hydroxyindoleacetic acid levels (record ID = 12800, LOD = 2) in the medial septal nucleus, locomotion in the open field periphery (record ID = 11862, LOD = 4.7), locomotion in the open field center (record ID = 11868, LOD = 3.8), locomotor activity after ethanol injection (record ID = 11703, LOD = 4.7), and volume of the hippocampus mossy fiber pathway (record ID = 12591, LOD = 2.1).
(PNG)
Genetic mapping results are shown for nine of the twelve transcripts regulated by the Gsta4 locus in hippocampus (top panel) and for 5 transcripts in liver (bottom panel). Auts2 (A730011F23Rik), Zmat5 (2610510L01Rik), and Csmd2 (B230311I21) are not shown. Mapping of Gsta4 is shown in dark blue in the bottom panel in liver for reference. Association strength (LOD) is shown on the Y-axis and plotted over the region spanning the Gsta4 cis eQTL. Line colors show results of interval mapping for each trait plotted on the same scale according to the legend (upper left corner) in each panel.
(TIF)
Top panel shows correlations between Gstt2 and transcripts mapping back to the Gstt2 locus. Bottom panel shows genetic mapping results for each transcript and Gstt2 (for reference, in red) in hippocampus. Association strength (LOD) is shown on the Y-axis and plotted over the region spanning the Gstt2 cis eQTL. Line colors show results of interval mapping for each trait plotted on the same scale according to the legend (upper left corner) in each panel.
(TIF)
Top panel shows correlation network between Gstt2 and transcripts mapping back to the Gstt2 locus. Positive correlations are indicated by warm line (edge) colors and negative correlations are indicated by cool edge colors. Network threshold is r = |0.3|. Bottom panel shows genetic mapping results for each transcript and Gstt2 (for reference, in red) in midbrain. Association strength (LOD) is shown on the Y-axis and plotted over the region spanning the Gstt2 cis eQTL. Line colors show results of interval mapping for each trait plotted on the same scale according to the legend (upper left corner) in each panel.
(TIF)
Genetic mapping results are shown for each transcript in hippocampus and midbrain. Association strength (LOD) is shown on the Y-axis and plotted over the region spanning the Gstz1 cis eQTL. Line colors show results of interval mapping for each trait plotted on the same scale according to the legend (upper left corner).
(TIF)
Network for the 25 AD associated genes that are correlated with hippocampal Gsto1 expression and co-cited in the literature. Positive correlations are indicated by warm line (edge) colors and negative correlations are indicated by cool edge colors. Network threshold is set at r = |0.3|. The center of the network is the Gsto1 residual trait generated after partial correlation analysis. All 25 genes are highly connected in this network.
(TIF)
(XLSX)
(XLSX)
(XLSX)
(XLSX)
(XLSX)
All have partial r (p-value) < 0.001. Below background expression is shaded.
(XLSX)
All have partial r (p-value) < 0.001 and literature (lit) r > 0.5. Below background expression is shaded.
(XLSX)
(XLSX)
Shading denotes genes whose expression in the hippocampus is below background (average log2 expression < 7). Lit Corr = literature correlation between the genes listed in the table and Gsto1 based on the NCBI Rif; AD & FTDM DB = Alzheimer and Frontotemporal Dementia Mutation Database; Alzgene = field synopsis of genetic association studies in AD.
(XLSX)
(XLSX)
(XLSX)
(XLSX)
(XLSX)
(XLSX)
(XLSX)
(XLSX)
(XLSX)
Funding Statement
This work was supported by NIH grants R01AA023774 and R01ES022614, and a grant from the Natural Science Foundation of China (30971591). The funders had no role in study design, data collection and analysis, decision to publish, or preparation of the manuscript.
References
- 1.Deponte M (2013) Glutathione catalysis and the reaction mechanisms of glutathione-dependent enzymes. Biochim Biophys Acta 1830: 3217–3266. 10.1016/j.bbagen.2012.09.018 [DOI] [PubMed] [Google Scholar]
- 2.Hayes JD, Flanagan JU, Jowsey IR (2005) Glutathione transferases. Annu Rev Pharmacol Toxicol 45: 51–88. [DOI] [PubMed] [Google Scholar]
- 3.Lu SC (2013) Glutathione synthesis. Biochim Biophys Acta 1830: 3143–3153. 10.1016/j.bbagen.2012.09.008 [DOI] [PMC free article] [PubMed] [Google Scholar]
- 4.Mannervik B, Danielson UH (1988) Glutathione transferases—structure and catalytic activity. CRC Crit Rev Biochem 23: 283–337. [DOI] [PubMed] [Google Scholar]
- 5.Board PG (1981) Transport of glutathione S-conjugate from human erythrocytes. FEBS Lett 124: 163–165. [DOI] [PubMed] [Google Scholar]
- 6.Ishikawa T (1992) The ATP-dependent glutathione S-conjugate export pump. Trends Biochem Sci 17: 463–468. [DOI] [PubMed] [Google Scholar]
- 7.Giffen PS, Pick CR, Price MA, Williams A, York MJ (2002) Alpha-glutathione S-transferase in the assessment of hepatotoxicity—its diagnostic utility in comparison with other recognized markers in the Wistar Han rat. Toxicol Pathol 30: 365–372. [DOI] [PubMed] [Google Scholar]
- 8.Atkinson HJ, Babbitt PC (2009) Glutathione transferases are structural and functional outliers in the thioredoxin fold. Biochemistry 48: 11108–11116. 10.1021/bi901180v [DOI] [PMC free article] [PubMed] [Google Scholar]
- 9.Ladner JE, Parsons JF, Rife CL, Gilliland GL, Armstrong RN (2004) Parallel evolutionary pathways for glutathione transferases: structure and mechanism of the mitochondrial class kappa enzyme rGSTK1-1. Biochemistry 43: 352–361. [DOI] [PubMed] [Google Scholar]
- 10.Robinson A, Huttley GA, Booth HS, Board PG (2004) Modelling and bioinformatics studies of the human Kappa-class glutathione transferase predict a novel third glutathione transferase family with similarity to prokaryotic 2-hydroxychromene-2-carboxylate isomerases. Biochem J 379: 541–552. [DOI] [PMC free article] [PubMed] [Google Scholar]
- 11.Board PG, Menon D (2013) Glutathione transferases, regulators of cellular metabolism and physiology. Biochim Biophys Acta 1830: 3267–3288. 10.1016/j.bbagen.2012.11.019 [DOI] [PubMed] [Google Scholar]
- 12.Bammler TK, Smith CA, Wolf CR (1994) Isolation and characterization of two mouse Pi-class glutathione S-transferase genes. Biochem J 298 (Pt 2): 385–390. [DOI] [PMC free article] [PubMed] [Google Scholar]
- 13.Coggan M, Flanagan JU, Parker MW, Vichai V, Pearson WR, Board PG (2002) Identification and characterization of GSTT3, a third murine Theta class glutathione transferase. Biochem J 366: 323–332. [DOI] [PMC free article] [PubMed] [Google Scholar]
- 14.Tew KD, Townsend DM (2012) Glutathione-s-transferases as determinants of cell survival and death. Antioxid Redox Signal 17: 1728–1737. 10.1089/ars.2012.4640 [DOI] [PMC free article] [PubMed] [Google Scholar]
- 15.Mazzetti AP, Fiorile MC, Primavera A, Lo Bello M (2015) Glutathione transferases and neurodegenerative diseases. Neurochem Int 82C: 10–18. [DOI] [PubMed] [Google Scholar]
- 16.Cai Q, Wang Z, Zhang W, Guo X, Shang Z, Jiang N, et al. (2014) Association between glutathione S-transferases M1 and T1 gene polymorphisms and prostate cancer risk: a systematic review and meta-analysis. Tumour Biol 35: 247–256. 10.1007/s13277-013-1030-6 [DOI] [PubMed] [Google Scholar]
- 17.Zhou TB, Drummen GP, Jiang ZP, Qin YH (2014) GSTT1 polymorphism and the risk of developing prostate cancer. Am J Epidemiol 180: 1–10. 10.1093/aje/kwu112 [DOI] [PubMed] [Google Scholar]
- 18.Xiao Q, Deng D, Li H, Ye F, Huang L, Zhang B, et al. (2014) GSTT1 and GSTM1 polymorphisms predict treatment outcome for acute myeloid leukemia: a systematic review and meta-analysis. Ann Hematol 93: 1381–1390. 10.1007/s00277-014-2050-z [DOI] [PubMed] [Google Scholar]
- 19.Meng X, Liu Y, Liu B (2014) Glutathione S-transferase M1 null genotype meta-analysis on gastric cancer risk. Diagn Pathol 9: 122 10.1186/1746-1596-9-122 [DOI] [PMC free article] [PubMed] [Google Scholar]
- 20.Longo GS, Pinhel MS, Sado CL, Gregorio ML, Amorim GS, Florim GS, et al. (2013) Exposure to pesticides and heterozygote genotype of GSTP1-Alw26I are associated to Parkinson's disease. Arq Neuropsiquiatr 71: 446–452. 10.1590/0004-282X20130060 [DOI] [PubMed] [Google Scholar]
- 21.Pinhel MA, Sado CL, Longo Gdos S, Gregorio ML, Amorim GS, Florim GM, et al. (2013) Nullity of GSTT1/GSTM1 related to pesticides is associated with Parkinson's disease. Arq Neuropsiquiatr 71: 527–532. 10.1590/0004-282X20130076 [DOI] [PubMed] [Google Scholar]
- 22.Smeyne M, Boyd J, Raviie Shepherd K, Jiao Y, Pond BB, Hatler M, et al. (2007) GSTpi expression mediates dopaminergic neuron sensitivity in experimental parkinsonism. Proc Natl Acad Sci U S A 104: 1977–1982. [DOI] [PMC free article] [PubMed] [Google Scholar]
- 23.Goldman SM, Kamel F, Ross GW, Bhudhikanok GS, Hoppin JA, Korell M, et al. (2012) Genetic modification of the association of paraquat and Parkinson's disease. Mov Disord 27: 1652–1658. 10.1002/mds.25216 [DOI] [PMC free article] [PubMed] [Google Scholar]
- 24.Singh M, Khan AJ, Shah PP, Shukla R, Khanna VK, Parmar D (2008) Polymorphism in environment responsive genes and association with Parkinson disease. Mol Cell Biochem 312: 131–138. 10.1007/s11010-008-9728-2 [DOI] [PubMed] [Google Scholar]
- 25.Pinhel MA, Nakazone MA, Cacao JC, Piteri RC, Dantas RT, Godoy MF, et al. (2008) Glutathione S-transferase variants increase susceptibility for late-onset Alzheimer's disease: association study and relationship with apolipoprotein E epsilon4 allele. Clin Chem Lab Med 46: 439–445. 10.1515/CCLM.2008.102 [DOI] [PubMed] [Google Scholar]
- 26.Ghosh T, Mustafa M, Kumar V, Datta SK, Bhatia MS, Sircar S, et al. (2012) A preliminary study on the influence of glutathione S transferase T1 (GSTT1) as a risk factor for late onset Alzheimer's disease in North Indian population. Asian J Psychiatr 5: 160–163. 10.1016/j.ajp.2012.02.023 [DOI] [PubMed] [Google Scholar]
- 27.Bernardini S, Bellincampi L, Ballerini S, Federici G, Iori R, Trequattrini A, et al. (2005) Glutathione S-transferase P1 *C allelic variant increases susceptibility for late-onset Alzheimer disease: association study and relationship with apolipoprotein E epsilon4 allele. Clin Chem 51: 944–951. [DOI] [PubMed] [Google Scholar]
- 28.Piacentini S, Polimanti R, Squitti R, Mariani S, Migliore S, Vernieri F, et al. (2012) GSTO1*E155del polymorphism associated with increased risk for late-onset Alzheimer's disease: association hypothesis for an uncommon genetic variant. Neurosci Lett 506: 203–207. 10.1016/j.neulet.2011.11.005 [DOI] [PubMed] [Google Scholar]
- 29.Piacentini S, Polimanti R, Squitti R, Ventriglia M, Cassetta E, Vernieri F, et al. (2012) GSTM1 null genotype as risk factor for late-onset Alzheimer's disease in Italian patients. J Neurol Sci 317: 137–140. 10.1016/j.jns.2012.01.026 [DOI] [PubMed] [Google Scholar]
- 30.Spalletta G, Bernardini S, Bellincampi L, Federici G, Trequattrini A, Ciappi F, et al. (2007) Glutathione S-transferase P1 and T1 gene polymorphisms predict longitudinal course and age at onset of Alzheimer disease. Am J Geriatr Psychiatry 15: 879–887. [DOI] [PubMed] [Google Scholar]
- 31.Taylor BA, Heiniger HJ, Meier H (1973) Genetic analysis of resistance to cadmium-induced testicular damage in mice. Proc Soc Exp Biol Med 143: 629–633. [DOI] [PubMed] [Google Scholar]
- 32.Peirce JL, Lu L, Gu J, Silver LM, Williams RW (2004) A new set of BXD recombinant inbred lines from advanced intercross populations in mice. BMC Genet 5: 7 [DOI] [PMC free article] [PubMed] [Google Scholar]
- 33.Kerns RT, Ravindranathan A, Hassan S, Cage MP, York T, Sikela JM, et al. (2005) Ethanol-responsive brain region expression networks: implications for behavioral responses to acute ethanol in DBA/2J versus C57BL/6J mice. The Journal of neuroscience: the official journal of the Society for Neuroscience 25: 2255–2266. [DOI] [PMC free article] [PubMed] [Google Scholar]
- 34.Overall RW, Kempermann G, Peirce J, Lu L, Goldowitz D, Gage FH, et al. (2009) Genetics of the hippocampal transcriptome in mouse: a systematic survey and online neurogenomics resource. Front Neurosci 3: 55 10.3389/neuro.15.003.2009 [DOI] [PMC free article] [PubMed] [Google Scholar]
- 35.Ye R, Carneiro AM, Airey D, Sanders-Bush E, Williams RW, Lu L, et al. (2014) Evaluation of heritable determinants of blood and brain serotonin homeostasis using recombinant inbred mice. Genes Brain Behav 13: 247–260. 10.1111/gbb.12092 [DOI] [PMC free article] [PubMed] [Google Scholar]
- 36.Wolen AR, Phillips CA, Langston MA, Putman AH, Vorster PJ, Bruce NA, et al. (2012) Genetic dissection of acute ethanol responsive gene networks in prefrontal cortex: functional and mechanistic implications. PLoS One 7: e33575 10.1371/journal.pone.0033575 [DOI] [PMC free article] [PubMed] [Google Scholar]
- 37.Bennett BJ, Farber CR, Orozco L, Kang HM, Ghazalpour A, Siemers N, et al. (2010) A high-resolution association mapping panel for the dissection of complex traits in mice. Genome Res 20: 281–290. 10.1101/gr.099234.109 [DOI] [PMC free article] [PubMed] [Google Scholar]
- 38.Webster JA, Gibbs JR, Clarke J, Ray M, Zhang W, Holmans P, et al. (2009) Genetic control of human brain transcript expression in Alzheimer disease. Am J Hum Genet 84: 445–458. 10.1016/j.ajhg.2009.03.011 [DOI] [PMC free article] [PubMed] [Google Scholar]
- 39.Ciobanu DC, Lu L, Mozhui K, Wang X, Jagalur M, Morris JA, et al. Detection, validation, and downstream analysis of allelic variation in gene expression. Genetics 184: 119–128. 10.1534/genetics.109.107474 [DOI] [PMC free article] [PubMed] [Google Scholar]
- 40.Doss S, Schadt EE, Drake TA, Lusis AJ (2005) Cis-acting expression quantitative trait loci in mice. Genome Res 15: 681–691. [DOI] [PMC free article] [PubMed] [Google Scholar]
- 41.Alberts R, Terpstra P, Li Y, Breitling R, Nap JP, Jansen RC (2007) Sequence polymorphisms cause many false cis eQTLs. PLoS One 2: e622 [DOI] [PMC free article] [PubMed] [Google Scholar]
- 42.Hegmann JP, Possidente B (1981) Estimating genetic correlations from inbred strains. Behav Genet 11: 103–114. [DOI] [PubMed] [Google Scholar]
- 43.Di Curzio DL, Goldowitz D (2011) The genetic basis of adrenal gland weight and structure in BXD recombinant inbred mice. Mamm Genome 22: 209–234. 10.1007/s00335-011-9315-9 [DOI] [PubMed] [Google Scholar]
- 44.Chesler EJ, Lu L, Shou S, Qu Y, Gu J, Wang J, et al. (2005) Complex trait analysis of gene expression uncovers polygenic and pleiotropic networks that modulate nervous system function. Nat Genet 37: 233–242. [DOI] [PubMed] [Google Scholar]
- 45.Keane TM, Goodstadt L, Danecek P, White MA, Wong K, Yalcin B, et al. (2011) Mouse genomic variation and its effect on phenotypes and gene regulation. Nature 477: 289–294. 10.1038/nature10413 [DOI] [PMC free article] [PubMed] [Google Scholar]
- 46.Dobin A, Davis CA, Schlesinger F, Drenkow J, Zaleski C, Jha S, et al. (2013) STAR: ultrafast universal RNA-seq aligner. Bioinformatics 29: 15–21. 10.1093/bioinformatics/bts635 [DOI] [PMC free article] [PubMed] [Google Scholar]
- 47.Li H, Handsaker B, Wysoker A, Fennell T, Ruan J, Homer N, et al. (2009) The Sequence Alignment/Map format and SAMtools. Bioinformatics 25: 2078–2079. 10.1093/bioinformatics/btp352 [DOI] [PMC free article] [PubMed] [Google Scholar]
- 48.Benjamini Y, Hochberg Y (1995) Controlling the false discovery rate: a practical and powerful approach to multiple testing. J R Stat Soc Series B Stat Methodol 57: 289–300. [Google Scholar]
- 49.Homayouni R, Heinrich K, Wei L, Berry MW (2005) Gene clustering by latent semantic indexing of MEDLINE abstracts. Bioinformatics 21: 104–115. [DOI] [PubMed] [Google Scholar]
- 50.Amarillo IE, Li WL, Li X, Vilain E, Kantarci S (2014) De novo single exon deletion of AUTS2 in a patient with speech and language disorder: a review of disrupted AUTS2 and further evidence for its role in neurodevelopmental disorders. Am J Med Genet A 164A: 958–965. 10.1002/ajmg.a.36393 [DOI] [PubMed] [Google Scholar]
- 51.Beunders G, Voorhoeve E, Golzio C, Pardo LM, Rosenfeld JA, Talkowski ME, et al. (2013) Exonic deletions in AUTS2 cause a syndromic form of intellectual disability and suggest a critical role for the C terminus. Am J Hum Genet 92: 210–220. 10.1016/j.ajhg.2012.12.011 [DOI] [PMC free article] [PubMed] [Google Scholar]
- 52.Elia J, Gai X, Xie HM, Perin JC, Geiger E, Glessner JT, et al. (2010) Rare structural variants found in attention-deficit hyperactivity disorder are preferentially associated with neurodevelopmental genes. Mol Psychiatry 15: 637–646. 10.1038/mp.2009.57 [DOI] [PMC free article] [PubMed] [Google Scholar]
- 53.Liu Y, Zhao D, Dong R, Yang X, Zhang Y, Tammimies K, et al. (2015) De novo exon 1 deletion of AUTS2 gene in a patient with autism spectrum disorder and developmental delay: a case report and a brief literature review. Am J Med Genet A 167: 1381–1385. 10.1002/ajmg.a.37050 [DOI] [PubMed] [Google Scholar]
- 54.Edwards AC, Aliev F, Bierut LJ, Bucholz KK, Edenberg H, Hesselbrock V, et al. (2012) Genome-wide association study of comorbid depressive syndrome and alcohol dependence. Psychiatr Genet 22: 31–41. 10.1097/YPG.0b013e32834acd07 [DOI] [PMC free article] [PubMed] [Google Scholar]
- 55.Havik B, Le Hellard S, Rietschel M, Lybaek H, Djurovic S, Mattheisen M, et al. (2011) The complement control-related genes CSMD1 and CSMD2 associate to schizophrenia. Biol Psychiatry 70: 35–42. 10.1016/j.biopsych.2011.01.030 [DOI] [PubMed] [Google Scholar]
- 56.Li K, Liu JW, Zhu ZC, Wang HT, Zu Y, Liu YJ, et al. (2014) DSTYK kinase domain ablation impaired the mice capabilities of learning and memory in water maze test. Int J Clin Exp Pathol 7: 6486–6492. [PMC free article] [PubMed] [Google Scholar]
- 57.Gaier ED, Eipper BA, Mains RE (2014) Pam heterozygous mice reveal essential role for Cu in amygdalar behavioral and synaptic function. Ann N Y Acad Sci 1314: 15–23. 10.1111/nyas.12378 [DOI] [PMC free article] [PubMed] [Google Scholar]
- 58.Yang LT, Alexandropoulos K, Sap J (2002) c-SRC mediates neurite outgrowth through recruitment of Crk to the scaffolding protein Sin/Efs without altering the kinetics of ERK activation. J Biol Chem 277: 17406–17414. [DOI] [PubMed] [Google Scholar]
- 59.Smith KT, Sardiu ME, Martin-Brown SA, Seidel C, Mushegian A, Egidy R, et al. (2012) Human family with sequence similarity 60 member A (FAM60A) protein: a new subunit of the Sin3 deacetylase complex. Mol Cell Proteomics 11: 1815–1828. 10.1074/mcp.M112.020255 [DOI] [PMC free article] [PubMed] [Google Scholar]
- 60.Alcivar A, Hu S, Tang J, Yang X (2003) DEDD and DEDD2 associate with caspase-8/10 and signal cell death. Oncogene 22: 291–297. [DOI] [PubMed] [Google Scholar]
- 61.Lee YM, Pan CJ, Koeberl DD, Mansfield BC, Chou JY (2013) The upstream enhancer elements of the G6PC promoter are critical for optimal G6PC expression in murine glycogen storage disease type Ia. Mol Genet Metab 110: 275–280. 10.1016/j.ymgme.2013.06.014 [DOI] [PMC free article] [PubMed] [Google Scholar]
- 62.Rakhshandehroo M, Stienstra R, de Wit NJ, Bragt MC, Haluzik M, Mensink RP, et al. (2012) Plasma mannose-binding lectin is stimulated by PPARalpha in humans. Am J Physiol Endocrinol Metab 302: E595–602. 10.1152/ajpendo.00299.2011 [DOI] [PubMed] [Google Scholar]
- 63.Pandey AK, Williams RW (2014) Genetics of gene expression in CNS. Int Rev Neurobiol 116: 195–231. 10.1016/B978-0-12-801105-8.00008-4 [DOI] [PMC free article] [PubMed] [Google Scholar]
- 64.Regard JB, Scheek S, Borbiev T, Lanahan AA, Schneider A, Demetriades AM, et al. (2004) Verge: a novel vascular early response gene. J Neurosci 24: 4092–4103. [DOI] [PMC free article] [PubMed] [Google Scholar]
- 65.Ango F, di Cristo G, Higashiyama H, Bennett V, Wu P, Huang ZJ (2004) Ankyrin-based subcellular gradient of neurofascin, an immunoglobulin family protein, directs GABAergic innervation at purkinje axon initial segment. Cell 119: 257–272. [DOI] [PubMed] [Google Scholar]
- 66.Peterson TR, Laplante M, Thoreen CC, Sancak Y, Kang SA, Kuehl WM, et al. (2009) DEPTOR is an mTOR inhibitor frequently overexpressed in multiple myeloma cells and required for their survival. Cell 137: 873–886. 10.1016/j.cell.2009.03.046 [DOI] [PMC free article] [PubMed] [Google Scholar]
- 67.Ching GY, Chien CL, Flores R, Liem RK (1999) Overexpression of alpha-internexin causes abnormal neurofilamentous accumulations and motor coordination deficits in transgenic mice. The Journal of neuroscience: the official journal of the Society for Neuroscience 19: 2974–2986. [DOI] [PMC free article] [PubMed] [Google Scholar]
- 68.Dickson TC, Chuckowree JA, Chuah MI, West AK, Vickers JC (2005) alpha-Internexin immunoreactivity reflects variable neuronal vulnerability in Alzheimer's disease and supports the role of the beta-amyloid plaques in inducing neuronal injury. Neurobiol Dis 18: 286–295. [DOI] [PubMed] [Google Scholar]
- 69.Kegelman TP, Das SK, Emdad L, Hu B, Menezes ME, Bhoopathi P, et al. (2015) Targeting tumor invasion: the roles of MDA-9/Syntenin. Expert Opin Ther Targets 19: 97–112. 10.1517/14728222.2014.959495 [DOI] [PMC free article] [PubMed] [Google Scholar]
- 70.Tolwani RJ, Hamm DA, Tian L, Sharer JD, Vockley J, Rinaldo P, et al. (2005) Medium-chain acyl-CoA dehydrogenase deficiency in gene-targeted mice. PLoS Genet 1: e23 [DOI] [PMC free article] [PubMed] [Google Scholar]
- 71.Soutourina J, Blanquet S, Plateau P (2000) D-tyrosyl-tRNA(Tyr) metabolism in Saccharomyces cerevisiae. J Biol Chem 275: 11626–11630. [DOI] [PubMed] [Google Scholar]
- 72.Hirose K, Mikawa S, Okumura N, Noguchi G, Fukawa K, Kanaya N, et al. (2013) Association of swine vertnin (VRTN) gene with production traits in Duroc pigs improved using a closed nucleus breeding system. Anim Sci J 84: 213–221. 10.1111/j.1740-0929.2012.01066.x [DOI] [PubMed] [Google Scholar]
- 73.Kamburov A, Stelzl U, Lehrach H, Herwig R (2013) The ConsensusPathDB interaction database: 2013 update. Nucleic Acids Res 41: D793–800. 10.1093/nar/gks1055 [DOI] [PMC free article] [PubMed] [Google Scholar]
- 74.Nguyen T, Nioi P, Pickett CB (2009) The Nrf2-antioxidant response element signaling pathway and its activation by oxidative stress. J Biol Chem 284: 13291–13295. 10.1074/jbc.R900010200 [DOI] [PMC free article] [PubMed] [Google Scholar]
- 75.Chenevix-Trench G, Young J, Coggan M, Board P (1995) Glutathione S-transferase M1 and T1 polymorphisms: susceptibility to colon cancer and age of onset. Carcinogenesis 16: 1655–1657. [DOI] [PubMed] [Google Scholar]
- 76.Coggan M, Whitbread L, Whittington A, Board P (1998) Structure and organization of the human theta-class glutathione S-transferase and D-dopachrome tautomerase gene complex. Biochem J 334 (Pt 3): 617–623. [DOI] [PMC free article] [PubMed] [Google Scholar]
- 77.Pemble S, Schroeder KR, Spencer SR, Meyer DJ, Hallier E, Bolt HM, et al. (1994) Human glutathione S-transferase theta (GSTT1): cDNA cloning and the characterization of a genetic polymorphism. Biochem J 300 (Pt 1): 271–276. [DOI] [PMC free article] [PubMed] [Google Scholar]
- 78.Sprenger R, Schlagenhaufer R, Kerb R, Bruhn C, Brockmoller J, Roots I, et al. (2000) Characterization of the glutathione S-transferase GSTT1 deletion: discrimination of all genotypes by polymerase chain reaction indicates a trimodular genotype-phenotype correlation. Pharmacogenetics 10: 557–565. [DOI] [PubMed] [Google Scholar]
- 79.Zhao Y, Marotta M, Eichler EE, Eng C, Tanaka H (2009) Linkage disequilibrium between two high-frequency deletion polymorphisms: implications for association studies involving the glutathione-S transferase (GST) genes. PLoS Genet 5: e1000472 10.1371/journal.pgen.1000472 [DOI] [PMC free article] [PubMed] [Google Scholar]
- 80.Jang SG, Kim IJ, Kang HC, Park HW, Ahn SA, Yoon HJ, et al. (2007) GSTT2 promoter polymorphisms and colorectal cancer risk. BMC Cancer 7: 16 [DOI] [PMC free article] [PubMed] [Google Scholar]
- 81.Matejcic M, Li D, Prescott NJ, Lewis CM, Mathew CG, Parker MI (2011) Association of a deletion of GSTT2B with an altered risk of oesophageal squamous cell carcinoma in a South African population: a case-control study. PLoS One 6: e29366 10.1371/journal.pone.0029366 [DOI] [PMC free article] [PubMed] [Google Scholar]
- 82.Fernandez-Canon JM, Hejna J, Reifsteck C, Olson S, Grompe M (1999) Gene structure, chromosomal location, and expression pattern of maleylacetoacetate isomerase. Genomics 58: 263–269. [DOI] [PubMed] [Google Scholar]
- 83.Shroads AL, Coats BS, McDonough CW, Langaee T, Stacpoole PW (2015) Haplotype variations in glutathione transferase zeta 1 influence the kinetics and dynamics of chronic dichloroacetate in children. J Clin Pharmacol 55: 50–55. 10.1002/jcph.371 [DOI] [PMC free article] [PubMed] [Google Scholar]
- 84.Fernandez-Canon JM, Baetscher MW, Finegold M, Burlingame T, Gibson KM, Grompe M (2002) Maleylacetoacetate isomerase (MAAI/GSTZ)-deficient mice reveal a glutathione-dependent nonenzymatic bypass in tyrosine catabolism. Mol Cell Biol 22: 4943–4951. [DOI] [PMC free article] [PubMed] [Google Scholar]
- 85.Lim CE, Matthaei KI, Blackburn AC, Davis RP, Dahlstrom JE, Koina ME, et al. (2004) Mice deficient in glutathione transferase zeta/maleylacetoacetate isomerase exhibit a range of pathological changes and elevated expression of alpha, mu, and pi class glutathione transferases. Am J Pathol 165: 679–693. [DOI] [PMC free article] [PubMed] [Google Scholar]
- 86.Tzeng HF, Blackburn AC, Board PG, Anders MW (2000) Polymorphism- and species-dependent inactivation of glutathione transferase zeta by dichloroacetate. Chem Res Toxicol 13: 231–236. [DOI] [PubMed] [Google Scholar]
- 87.Li Y, Nowotny P, Holmans P, Smemo S, Kauwe JS, Hinrichs AL, et al. (2004) Association of late-onset Alzheimer's disease with genetic variation in multiple members of the GAPD gene family. Proc Natl Acad Sci U S A 101: 15688–15693. [DOI] [PMC free article] [PubMed] [Google Scholar]
- 88.Li YJ, Oliveira SA, Xu P, Martin ER, Stenger JE, Scherzer CR, et al. (2003) Glutathione S-transferase omega-1 modifies age-at-onset of Alzheimer disease and Parkinson disease. Hum Mol Genet 12: 3259–3267. [DOI] [PubMed] [Google Scholar]
- 89.Reitz C, Mayeux R (2009) Use of genetic variation as biomarkers for Alzheimer's disease. Ann N Y Acad Sci 1180: 75–96. 10.1111/j.1749-6632.2009.04945.x [DOI] [PMC free article] [PubMed] [Google Scholar]
- 90.Capurso C, Panza F, Seripa D, Frisardi V, Imbimbo BP, Verdile G, et al. Polymorphisms in glutathione S-transferase omega-1 gene and increased risk of sporadic Alzheimer disease. Rejuvenation Res 13: 645–652. 10.1089/rej.2010.1052 [DOI] [PubMed] [Google Scholar]
- 91.Kolsch H, Linnebank M, Lutjohann D, Jessen F, Wullner U, Harbrecht U, et al. (2004) Polymorphisms in glutathione S-transferase omega-1 and AD, vascular dementia, and stroke. Neurology 63: 2255–2260. [DOI] [PubMed] [Google Scholar]
- 92.Nishimura M, Sakamoto T, Kaji R, Kawakami H (2004) Influence of polymorphisms in the genes for cytokines and glutathione S-transferase omega on sporadic Alzheimer's disease. Neurosci Lett 368: 140–143. [DOI] [PubMed] [Google Scholar]
- 93.Ozturk A, Desai PP, Minster RL, Dekosky ST, Kamboh MI (2005) Three SNPs in the GSTO1, GSTO2 and PRSS11 genes on chromosome 10 are not associated with age-at-onset of Alzheimer's disease. Neurobiol Aging 26: 1161–1165. [DOI] [PubMed] [Google Scholar]
- 94.Laliberte RE, Perregaux DG, Hoth LR, Rosner PJ, Jordan CK, Peese KM, et al. (2003) Glutathione s-transferase omega 1–1 is a target of cytokine release inhibitory drugs and may be responsible for their effect on interleukin-1beta posttranslational processing. J Biol Chem 278: 16567–16578. [DOI] [PubMed] [Google Scholar]
- 95.Schmuck E, Cappello J, Coggan M, Brew J, Cavanaugh JA, Blackburn AC, et al. (2008) Deletion of Glu155 causes a deficiency of glutathione transferase Omega 1–1 but does not alter sensitivity to arsenic trioxide and other cytotoxic drugs. Int J Biochem Cell Biol 40: 2553–2559. 10.1016/j.biocel.2008.04.017 [DOI] [PubMed] [Google Scholar]
- 96.Board PG, Coggan M, Cappello J, Zhou H, Oakley AJ, Anders MW (2008) S-(4-Nitrophenacyl)glutathione is a specific substrate for glutathione transferase omega 1–1. Anal Biochem 374: 25–30. [DOI] [PubMed] [Google Scholar]
- 97.Chowdhury UK, Zakharyan RA, Hernandez A, Avram MD, Kopplin MJ, Aposhian HV (2006) Glutathione-S-transferase-omega [MMA(V) reductase] knockout mice: enzyme and arsenic species concentrations in tissues after arsenate administration. Toxicol Appl Pharmacol 216: 446–457. [DOI] [PubMed] [Google Scholar]
- 98.Allingham RR, Liu Y, Rhee DJ (2009) The genetics of primary open-angle glaucoma: a review. Experimental eye research 88: 837–844. 10.1016/j.exer.2008.11.003 [DOI] [PMC free article] [PubMed] [Google Scholar]
- 99.Bayer AU, Ferrari F, Erb C (2002) High occurrence rate of glaucoma among patients with Alzheimer's disease. European neurology 47: 165–168. [DOI] [PubMed] [Google Scholar]
- 100.Bryleva EY, Rogers MA, Chang CC, Buen F, Harris BT, Rousselet E, et al. (2010) ACAT1 gene ablation increases 24(S)-hydroxycholesterol content in the brain and ameliorates amyloid pathology in mice with AD. Proceedings of the National Academy of Sciences of the United States of America 107: 3081–3086. 10.1073/pnas.0913828107 [DOI] [PMC free article] [PubMed] [Google Scholar]
- 101.Dumont M, Ho DJ, Calingasan NY, Xu H, Gibson G, Beal MF (2009) Mitochondrial dihydrolipoyl succinyltransferase deficiency accelerates amyloid pathology and memory deficit in a transgenic mouse model of amyloid deposition. Free radical biology & medicine 47: 1019–1027. [DOI] [PMC free article] [PubMed] [Google Scholar]
- 102.Esposito L, Raber J, Kekonius L, Yan F, Yu GQ, Bien-Ly N, et al. (2006) Reduction in mitochondrial superoxide dismutase modulates Alzheimer's disease-like pathology and accelerates the onset of behavioral changes in human amyloid precursor protein transgenic mice. The Journal of neuroscience: the official journal of the Society for Neuroscience 26: 5167–5179. [DOI] [PMC free article] [PubMed] [Google Scholar]
- 103.Isaacs AM, Johannsen P, Holm I, Nielsen JE (2011) Frontotemporal dementia caused by CHMP2B mutations. Current Alzheimer research 8: 246–251. [DOI] [PMC free article] [PubMed] [Google Scholar]
- 104.Osawa T, Mizuno Y, Fujita Y, Takatama M, Nakazato Y, Okamoto K (2011) Optineurin in neurodegenerative diseases. Neuropathology: official journal of the Japanese Society of Neuropathology 31: 569–574. [DOI] [PubMed] [Google Scholar]
- 105.Rezaie T, Child A, Hitchings R, Brice G, Miller L, Coca-Prados M, et al. (2002) Adult-onset primary open-angle glaucoma caused by mutations in optineurin. Science 295: 1077–1079. [DOI] [PubMed] [Google Scholar]
- 106.Tamura H, Kawakami H, Kanamoto T, Kato T, Yokoyama T, Sasaki K, et al. (2006) High frequency of open-angle glaucoma in Japanese patients with Alzheimer's disease. Journal of the neurological sciences 246: 79–83. [DOI] [PubMed] [Google Scholar]
- 107.Yochim BP, Mueller AE, Kane KD, Kahook MY (2012) Prevalence of cognitive impairment, depression, and anxiety symptoms among older adults with glaucoma. Journal of glaucoma 21: 250–254. 10.1097/IJG.0b013e3182071b7e [DOI] [PubMed] [Google Scholar]
- 108.Federico A, Cardaioli E, Da Pozzo P, Formichi P, Gallus GN, Radi E (2012) Mitochondria, oxidative stress and neurodegeneration. J Neurol Sci 322: 254–262. 10.1016/j.jns.2012.05.030 [DOI] [PubMed] [Google Scholar]
- 109.Lin MT, Beal MF (2006) Mitochondrial dysfunction and oxidative stress in neurodegenerative diseases. Nature 443: 787–795. [DOI] [PubMed] [Google Scholar]
- 110.Engle MR, Singh SP, Czernik PJ, Gaddy D, Montague DC, Ceci JD, et al. (2004) Physiological role of mGSTA4-4, a glutathione S-transferase metabolizing 4-hydroxynonenal: generation and analysis of mGsta4 null mouse. Toxicol Appl Pharmacol 194: 296–308. [DOI] [PubMed] [Google Scholar]
- 111.Ayala A, Munoz MF, Arguelles S (2014) Lipid peroxidation: production, metabolism, and signaling mechanisms of malondialdehyde and 4-hydroxy-2-nonenal. Oxid Med Cell Longev 2014: 360438 10.1155/2014/360438 [DOI] [PMC free article] [PubMed] [Google Scholar]
- 112.Al Nimer F, Strom M, Lindblom R, Aeinehband S, Bellander BM, Nyengaard JR, et al. (2013) Naturally occurring variation in the Glutathione-S-Transferase 4 gene determines neurodegeneration after traumatic brain injury. Antioxid Redox Signal 18: 784–794. 10.1089/ars.2011.4440 [DOI] [PMC free article] [PubMed] [Google Scholar]
- 113.Coles BF, Morel F, Rauch C, Huber WW, Yang M, Teitel CH, et al. (2001) Effect of polymorphism in the human glutathione S-transferase A1 promoter on hepatic GSTA1 and GSTA2 expression. Pharmacogenetics 11: 663–669. [DOI] [PubMed] [Google Scholar]
- 114.Speed D, Hoggart C, Petrovski S, Tachmazidou I, Coffey A, Jorgensen A, et al. (2014) A genome-wide association study and biological pathway analysis of epilepsy prognosis in a prospective cohort of newly treated epilepsy. Hum Mol Genet 23: 247–258. 10.1093/hmg/ddt403 [DOI] [PMC free article] [PubMed] [Google Scholar]
- 115.Dwivedi S, Sharma R, Sharma A, Zimniak P, Ceci JD, Awasthi YC, et al. (2006) The course of CCl4 induced hepatotoxicity is altered in mGSTA4-4 null (-/-) mice. Toxicology 218: 58–66. [DOI] [PubMed] [Google Scholar]
- 116.Curtis JM, Grimsrud PA, Wright WS, Xu X, Foncea RE, Graham DW, et al. (2010) Downregulation of adipose glutathione S-transferase A4 leads to increased protein carbonylation, oxidative stress, and mitochondrial dysfunction. Diabetes 59: 1132–1142. 10.2337/db09-1105 [DOI] [PMC free article] [PubMed] [Google Scholar]
- 117.Ronis MJ, Mercer KE, Gannon B, Engi B, Zimniak P, Shearn CT, et al. (2015) Increased 4-hydroxynonenal protein adducts in male GSTA4-4/PPAR-alpha double knockout mice enhance injury during early stages of alcoholic liver disease. Am J Physiol Gastrointest Liver Physiol 308: G403–415. 10.1152/ajpgi.00154.2014 [DOI] [PMC free article] [PubMed] [Google Scholar]
- 118.Suga K, Saito A, Mishima T, Akagawa K (2015) ER and Golgi stresses increase ER-Golgi SNARE Syntaxin5: Implications for organelle stress and betaAPP processing. Neurosci Lett 604: 30–35. 10.1016/j.neulet.2015.07.017 [DOI] [PubMed] [Google Scholar]
- 119.Sanson M, Auge N, Vindis C, Muller C, Bando Y, Thiers JC, et al. (2009) Oxidized low-density lipoproteins trigger endoplasmic reticulum stress in vascular cells: prevention by oxygen-regulated protein 150 expression. Circ Res 104: 328–336. 10.1161/CIRCRESAHA.108.183749 [DOI] [PubMed] [Google Scholar]
- 120.Radi R, Beckman JS, Bush KM, Freeman BA (1991) Peroxynitrite-induced membrane lipid peroxidation: the cytotoxic potential of superoxide and nitric oxide. Arch Biochem Biophys 288: 481–487. [DOI] [PubMed] [Google Scholar]
- 121.Dreyer J, Schleicher M, Tappe A, Schilling K, Kuner T, Kusumawidijaja G, et al. (2004) Nitric oxide synthase (NOS)-interacting protein interacts with neuronal NOS and regulates its distribution and activity. J Neurosci 24: 10454–10465. [DOI] [PMC free article] [PubMed] [Google Scholar]
- 122.Kolter T, Sandhoff K (2005) Principles of lysosomal membrane digestion: stimulation of sphingolipid degradation by sphingolipid activator proteins and anionic lysosomal lipids. Annu Rev Cell Dev Biol 21: 81–103. [DOI] [PubMed] [Google Scholar]
- 123.Zarrindast MR, Ardjmand A, Ahmadi S, Rezayof A (2012) Activation of dopamine D1 receptors in the medial septum improves scopolamine-induced amnesia in the dorsal hippocampus. Behav Brain Res 229: 68–73. 10.1016/j.bbr.2011.12.033 [DOI] [PubMed] [Google Scholar]
- 124.Gray JA, Ball GG (1970) Frequency-specific relation between hippocampal theta rhythm, behavior, and amobarbital action. Science 168: 1246–1248. [DOI] [PubMed] [Google Scholar]
- 125.Sun MK, Zhao WQ, Nelson TJ, Alkon DL (2001) Theta rhythm of hippocampal CA1 neuron activity: gating by GABAergic synaptic depolarization. J Neurophysiol 85: 269–279. [DOI] [PubMed] [Google Scholar]
- 126.Winson J (1978) Loss of hippocampal theta rhythm results in spatial memory deficit in the rat. Science 201: 160–163. [DOI] [PubMed] [Google Scholar]
- 127.Moon YA, Hammer RE, Horton JD (2009) Deletion of ELOVL5 leads to fatty liver through activation of SREBP-1c in mice. J Lipid Res 50: 412–423. 10.1194/jlr.M800383-JLR200 [DOI] [PMC free article] [PubMed] [Google Scholar]
- 128.Singh SP, Niemczyk M, Saini D, Sadovov V, Zimniak L, Zimniak P (2010) Disruption of the mGsta4 gene increases life span of C57BL mice. J Gerontol A Biol Sci Med Sci 65: 14–23. 10.1093/gerona/glp165 [DOI] [PMC free article] [PubMed] [Google Scholar]
- 129.Ashbrook DG, Williams RW, Lu L, Stein JL, Hibar DP, Nichols TE, et al. (2014) Joint genetic analysis of hippocampal size in mouse and human identifies a novel gene linked to neurodegenerative disease. BMC Genomics 15: 850 10.1186/1471-2164-15-850 [DOI] [PMC free article] [PubMed] [Google Scholar]
- 130.Aleksunes LM, Klaassen CD (2012) Coordinated regulation of hepatic phase I and II drug-metabolizing genes and transporters using AhR-, CAR-, PXR-, PPARalpha-, and Nrf2-null mice. Drug Metab Dispos 40: 1366–1379. 10.1124/dmd.112.045112 [DOI] [PMC free article] [PubMed] [Google Scholar]
- 131.Fu ZD, Klaassen CD (2014) Short-term calorie restriction feminizes the mRNA profiles of drug metabolizing enzymes and transporters in livers of mice. Toxicol Appl Pharmacol 274: 137–146. 10.1016/j.taap.2013.11.003 [DOI] [PMC free article] [PubMed] [Google Scholar]
- 132.Ashton KJ, Tupicoff A, Williams-Pritchard G, Kiessling CJ, See Hoe LE, Headrick JP, et al. (2013) Unique transcriptional profile of sustained ligand-activated preconditioning in pre- and post-ischemic myocardium. PLoS One 8: e72278 10.1371/journal.pone.0072278 [DOI] [PMC free article] [PubMed] [Google Scholar]
- 133.Xu PT, Li YJ, Qin XJ, Scherzer CR, Xu H, Schmechel DE, et al. (2006) Differences in apolipoprotein E3/3 and E4/4 allele-specific gene expression in hippocampus in Alzheimer disease. Neurobiol Dis 21: 256–275. [DOI] [PubMed] [Google Scholar]
- 134.Guan M, Chen X, Ma Y, Tang L, Guan L, Ren X, et al. (2015) MDA-9 and GRP78 as potential diagnostic biomarkers for early detection of melanoma metastasis. Tumour Biol 36: 2973–2982. 10.1007/s13277-014-2930-9 [DOI] [PubMed] [Google Scholar]
- 135.Liu X, Zhang X, Lv Y, Xiang J, Shi J (2014) Overexpression of syntenin enhances hepatoma cell proliferation and invasion: potential roles in human hepatoma. Oncol Rep 32: 2810–2816. 10.3892/or.2014.3498 [DOI] [PubMed] [Google Scholar]
- 136.Kim WY, Jang JY, Jeon YK, Chung DH, Kim YG, Kim CW (2014) Syntenin increases the invasiveness of small cell lung cancer cells by activating p38, AKT, focal adhesion kinase and SP1. Exp Mol Med 46: e90 10.1038/emm.2014.1 [DOI] [PMC free article] [PubMed] [Google Scholar]
- 137.Kegelman TP, Das SK, Hu B, Bacolod MD, Fuller CE, Menezes ME, et al. (2014) MDA-9/syntenin is a key regulator of glioma pathogenesis. Neuro Oncol 16: 50–61. 10.1093/neuonc/not157 [DOI] [PMC free article] [PubMed] [Google Scholar]
- 138.Dasgupta S, Menezes ME, Das SK, Emdad L, Janjic A, Bhatia S, et al. (2013) Novel role of MDA-9/syntenin in regulating urothelial cell proliferation by modulating EGFR signaling. Clin Cancer Res 19: 4621–4633. 10.1158/1078-0432.CCR-13-0585 [DOI] [PMC free article] [PubMed] [Google Scholar]
- 139.Yang Y, Hong Q, Shi P, Liu Z, Luo J, Shao Z (2013) Elevated expression of syntenin in breast cancer is correlated with lymph node metastasis and poor patient survival. Breast Cancer Res 15: R50 10.1186/bcr3442 [DOI] [PMC free article] [PubMed] [Google Scholar]
- 140.Elyada E, Pribluda A, Goldstein RE, Morgenstern Y, Brachya G, Cojocaru G, et al. (2011) CKIalpha ablation highlights a critical role for p53 in invasiveness control. Nature 470: 409–413. 10.1038/nature09673 [DOI] [PubMed] [Google Scholar]
- 141.Pribluda A, Elyada E, Wiener Z, Hamza H, Goldstein RE, Biton M, et al. (2013) A senescence-inflammatory switch from cancer-inhibitory to cancer-promoting mechanism. Cancer Cell 24: 242–256. 10.1016/j.ccr.2013.06.005 [DOI] [PubMed] [Google Scholar]
- 142.Sarasqueta AF, Forte G, Corver WE, de Miranda NF, Ruano D, van Eijk R, et al. (2013) Integral analysis of p53 and its value as prognostic factor in sporadic colon cancer. BMC Cancer 13: 277 10.1186/1471-2407-13-277 [DOI] [PMC free article] [PubMed] [Google Scholar]
- 143.Davalieva K, Kostovska IM, Kiprijanovska S, Markoska K, Kubelka-Sabit K, Filipovski V, et al. (2015) Proteomics analysis of malignant and benign prostate tissue by 2D DIGE/MS reveals new insights into proteins involved in prostate cancer. Prostate 75: 1586–1600. 10.1002/pros.23034 [DOI] [PubMed] [Google Scholar]
- 144.Jaras M, Miller PG, Chu LP, Puram RV, Fink EC, Schneider RK, et al. (2014) Csnk1a1 inhibition has p53-dependent therapeutic efficacy in acute myeloid leukemia. J Exp Med 211: 605–612. 10.1084/jem.20131033 [DOI] [PMC free article] [PubMed] [Google Scholar]
- 145.Schneider RK, Adema V, Heckl D, Jaras M, Mallo M, Lord AM, et al. (2014) Role of casein kinase 1A1 in the biology and targeted therapy of del(5q) MDS. Cancer Cell 26: 509–520. 10.1016/j.ccr.2014.08.001 [DOI] [PMC free article] [PubMed] [Google Scholar]
- 146.Loh YN, Hedditch EL, Baker LA, Jary E, Ward RL, Ford CE (2013) The Wnt signalling pathway is upregulated in an in vitro model of acquired tamoxifen resistant breast cancer. BMC Cancer 13: 174 10.1186/1471-2407-13-174 [DOI] [PMC free article] [PubMed] [Google Scholar]
- 147.Coulthard LR, White DE, Jones DL, McDermott MF, Burchill SA (2009) p38(MAPK): stress responses from molecular mechanisms to therapeutics. Trends Mol Med 15: 369–379. 10.1016/j.molmed.2009.06.005 [DOI] [PMC free article] [PubMed] [Google Scholar]
- 148.Cuadrado A, Nebreda AR (2010) Mechanisms and functions of p38 MAPK signalling. Biochem J 429: 403–417. 10.1042/BJ20100323 [DOI] [PubMed] [Google Scholar]
- 149.McCubrey JA, Steelman LS, Chappell WH, Abrams SL, Wong EW, Chang F, et al. (2007) Roles of the Raf/MEK/ERK pathway in cell growth, malignant transformation and drug resistance. Biochim Biophys Acta 1773: 1263–1284. [DOI] [PMC free article] [PubMed] [Google Scholar]
Associated Data
This section collects any data citations, data availability statements, or supplementary materials included in this article.
Supplementary Materials
Genetic mapping results are shown for traits from the BXD Published Phenotypes Database. Association strength (LOD) is shown on the Y-axis and plotted over a 30 Mb region spanning the Gsta4 cis eQTL. Line colors show results of interval mapping for each trait plotted on the same scale according to the legend (upper left corner). Homovanillic acid levels (record ID = 12801, LOD = 2.7) and 5-hydroxyindoleacetic acid levels (record ID = 12800, LOD = 2) in the medial septal nucleus, locomotion in the open field periphery (record ID = 11862, LOD = 4.7), locomotion in the open field center (record ID = 11868, LOD = 3.8), locomotor activity after ethanol injection (record ID = 11703, LOD = 4.7), and volume of the hippocampus mossy fiber pathway (record ID = 12591, LOD = 2.1).
(PNG)
Genetic mapping results are shown for nine of the twelve transcripts regulated by the Gsta4 locus in hippocampus (top panel) and for 5 transcripts in liver (bottom panel). Auts2 (A730011F23Rik), Zmat5 (2610510L01Rik), and Csmd2 (B230311I21) are not shown. Mapping of Gsta4 is shown in dark blue in the bottom panel in liver for reference. Association strength (LOD) is shown on the Y-axis and plotted over the region spanning the Gsta4 cis eQTL. Line colors show results of interval mapping for each trait plotted on the same scale according to the legend (upper left corner) in each panel.
(TIF)
Top panel shows correlations between Gstt2 and transcripts mapping back to the Gstt2 locus. Bottom panel shows genetic mapping results for each transcript and Gstt2 (for reference, in red) in hippocampus. Association strength (LOD) is shown on the Y-axis and plotted over the region spanning the Gstt2 cis eQTL. Line colors show results of interval mapping for each trait plotted on the same scale according to the legend (upper left corner) in each panel.
(TIF)
Top panel shows correlation network between Gstt2 and transcripts mapping back to the Gstt2 locus. Positive correlations are indicated by warm line (edge) colors and negative correlations are indicated by cool edge colors. Network threshold is r = |0.3|. Bottom panel shows genetic mapping results for each transcript and Gstt2 (for reference, in red) in midbrain. Association strength (LOD) is shown on the Y-axis and plotted over the region spanning the Gstt2 cis eQTL. Line colors show results of interval mapping for each trait plotted on the same scale according to the legend (upper left corner) in each panel.
(TIF)
Genetic mapping results are shown for each transcript in hippocampus and midbrain. Association strength (LOD) is shown on the Y-axis and plotted over the region spanning the Gstz1 cis eQTL. Line colors show results of interval mapping for each trait plotted on the same scale according to the legend (upper left corner).
(TIF)
Network for the 25 AD associated genes that are correlated with hippocampal Gsto1 expression and co-cited in the literature. Positive correlations are indicated by warm line (edge) colors and negative correlations are indicated by cool edge colors. Network threshold is set at r = |0.3|. The center of the network is the Gsto1 residual trait generated after partial correlation analysis. All 25 genes are highly connected in this network.
(TIF)
(XLSX)
(XLSX)
(XLSX)
(XLSX)
(XLSX)
All have partial r (p-value) < 0.001. Below background expression is shaded.
(XLSX)
All have partial r (p-value) < 0.001 and literature (lit) r > 0.5. Below background expression is shaded.
(XLSX)
(XLSX)
Shading denotes genes whose expression in the hippocampus is below background (average log2 expression < 7). Lit Corr = literature correlation between the genes listed in the table and Gsto1 based on the NCBI Rif; AD & FTDM DB = Alzheimer and Frontotemporal Dementia Mutation Database; Alzgene = field synopsis of genetic association studies in AD.
(XLSX)
(XLSX)
(XLSX)
(XLSX)
(XLSX)
(XLSX)
(XLSX)
(XLSX)
(XLSX)