

Abstract
Secreted factors play a central role in normal and pathological processes in every tissue in the body. The brain is composed of a highly complex milieu of different cell types and few methods exist that can identify which individual cells in a complex mixture are secreting specific analytes. By identifying which cells are responsible, we can better understand neural physiology and pathophysiology, more readily identify the underlying pathways responsible for analyte production, and ultimately use this information to guide the development of novel therapeutic strategies that target the cell types of relevance. We present here a method for detecting analytes secreted from single human induced pluripotent stem cell (iPSC)-derived neural cells and have applied the method to measure amyloid β (Aβ) and soluble amyloid precursor protein-alpha (sAPPα), analytes central to Alzheimer's disease pathogenesis. Through these studies, we have uncovered the dynamic range of secretion profiles of these analytes from single iPSC-derived neuronal and glial cells and have molecularly characterized subpopulations of these cells through immunostaining and gene expression analyses. In examining Aβ and sAPPα secretion from single cells, we were able to identify previously unappreciated complexities in the biology of APP cleavage that could not otherwise have been found by studying averaged responses over pools of cells. This technique can be readily adapted to the detection of other analytes secreted by neural cells, which would have the potential to open new perspectives into human CNS development and dysfunction.
SIGNIFICANCE STATEMENT We have established a technology that, for the first time, detects secreted analytes from single human neurons and astrocytes. We examine secretion of the Alzheimer's disease-relevant factors amyloid β (Aβ) and soluble amyloid precursor protein-alpha (sAPPα) and present novel findings that could not have been observed without a single-cell analytical platform. First, we identify a previously unappreciated subpopulation that secretes high levels of Aβ in the absence of detectable sAPPα. Further, we show that multiple cell types secrete high levels of Aβ and sAPPα, but cells expressing GABAergic neuronal markers are overrepresented. Finally, we show that astrocytes are competent to secrete high levels of Aβ and therefore may be a significant contributor to Aβ accumulation in the brain.
Keywords: Aβ, Alzheimer's disease, APP, iPSC, microengraving, single cell
Introduction
In many neurodegenerative disorders, select populations of neurons are vulnerable whereas others are unaffected. The biological bases for these selective vulnerabilities are not understood, in part because the field has lacked reliable high-throughput methods for analyzing human neuronal and glial function at the single-cell level. In the case of a subset of neurodegenerative disorders such as Alzheimer's disease (AD), there is growing evidence that neurotoxic species released from cells may underlie pathology. Here, we have developed a methodology to examine secreted products relevant to AD from single cells and adapted this method to examine human neuronal and glial cells derived from induced pluripotent stem cells (iPSCs).
The cellular pathology of AD involves the accumulation of extracellular deposits composed of amyloid β-protein (Aβ) and intraneuronal tangles consisting of hyperphosphorylated tau protein (Hardy and Selkoe, 2002). Mutations in presenilin (PSEN1, PSEN2) or amyloid precursor protein (APP) cause an early-onset form of AD (Bertram et al., 2010). APP encodes the precursor protein of Aβ and PSEN encodes the catalytic site of an intramembrane protease that cleaves APP to generate Aβ (γ-secretase). APP also can be cleaved by α-secretase to generate soluble amyloid precursor protein-alpha (sAPPα), which precludes Aβ generation from the same molecule. Genetic, neuropathological, and biomarker findings place Aβ in a key, early role in AD pathogenesis. Decades of intensive research have focused on the biochemistry of Aβ generation by sequential cleavages of APP. However, much of this work was performed in heterologous cell lines such as HEK, COS, or Chinese hamster ovary (CHO) cells and with methods that required the analysis of averaged responses of large pools of these cells. Although APP cleavage has been studied extensively, basic information about the dynamics of APP cleavage and Aβ secretion in different cell types is not known.
Microengraving involves culturing cells in a dense array of nanowells to quantify multiple secreted analytes and correlate these measurements with cell intrinsic data from a large number of single cells (104–105 per array; Love et al., 2006). Relative to existing techniques, microengraving has three major advantages: (1) high sensitivity for products secreted from single cells, (2) potential for a large number of traits evaluated for each cell, and (3) simultaneous analysis of a large number of cells, which allows for the detection and interrogation of rare cell populations. Adaption of this validated platform for neuroscience research provides a powerful and unique single-cell technology for the field. Although microengraving was first developed to study the secretion of antibodies and cytokines from cells of the immune system (Love et al., 2006; Story et al., 2008; Ogunniyi et al., 2009; Han et al., 2010), the further development and application of this technology to the study of the nervous system has not been described until now.
Here, we adapted microengraving to detect Aβ and sAPPα from single living neuronal and glial cells derived from iPSCs. We identified subpopulations of cells that secrete high levels of sAPPα and/or Aβ, and these subpopulations were further characterized by immunostaining and RNA profiling. We have found the following: (1) a previously unappreciated subpopulation of cells that secrete high levels of Aβ in the absence of detectable sAPPα; (2) during the time of neural differentiation, the number of cells secreting detectable levels of Aβ and sAPPα increases; and, intriguingly, (3) that cells expressing forebrain GABAergic neuronal markers are overrepresented in subpopulations of cells that secrete high levels of Aβ and sAPPα, although varieties of cell types can secrete high levels of each. Finally, although there is a widespread belief that neurons are the major source of Aβ in the CNS, the results presented here show that astrocytes are competent to secrete high levels of Aβ and therefore have the potential to be a significant contributor to Aβ accumulation in AD. Together, the results presented regarding Aβ and sAPPα secretion from hiPSC-derived neural cells at a single-cell level demonstrate the utility of such a system to address previously intractable questions regarding secretion of analytes relevant to nervous system function and pathobiology.
Materials and Methods
Chemicals and antibodies.
Cells were stained with the live marker calcein violet AM or calcein red-orange AM according to manufacturer's instructions (Life Technologies). Antibodies used in microengraving included anti-Aβ (6E10, Covance; 266, Elan Pharmaceuticals), anti-APP N terminus (22C11; Millipore), and anti-APP N terminus (4F2; Selkoe Laboratory, Brigham and Women's Hospital). Selected detection antibodies (4F2 or 266) were conjugated with HRP or biotin, respectively, by Lightning-link HRP or Biotin antibody labeling kits (Novus). Cy2-conjugated anti-HRP and Cy3-conjugated anti-biotin were purchased from Jackson ImmunoResearch.
Cell culture.
CHO cells stably overexpressing human wild-type APP (7WD4 cells; Xia et al., 1997) were cultured in Dulbecco's Eagle medium supplemented with 10% fetal bovine serum and 500 μg/ml G418 (Life Technologies). Cells were dissociated with 0.25% Trypsin/EDTA and neutralized with culture medium. After centrifugation to remove trypsin, cells were suspended in fresh medium at 1–2 × 10⁵ cells/ml and plated for printing for sAPPα and Aβ.
Healthy control (YZ1, TZ1, YK26) or fAD (APP V717I) iPSC-derived forebrain neurons (2× female and 2× male) were cultured and differentiated according to the described protocol (Muratore et al., 2014a; Muratore et al., 2014b). In brief, an embryoid aggregate method was used to generate aggregates, which were then plated on Matrigel-coated plates at day 7 of differentiation. This differentiation protocol generates neurons and glia of multiple cortical fates. To enrich for the differentiation of these cells to GABAergic interneuron fates, sonic hedgehog protein (R&D Systems) was added to cultures (1000 ng/ml) at the neural progenitor stage between days 11–26. At day 26 of differentiation, neuronal aggregates were plated on Matrigel-coated plates for final differentiation and fed with neural differentiation medium containing N2, B27, and growth factors cAMP, IGF1, BDNF, and GDNF.
PDMS arrays used with iPSC-derived neural cells were coated with 5 μg/ml laminin and 20 μg/ml poly-ornithine (Sigma-Aldrich) for 30 min and then blocked with Dulbecco's Eagle medium supplemented with 10% fetal bovine serum for 30 min before cell plating. A suspension of 1–2 × 10⁵ cells/ml of dissociated iPSC-derived neural cells were plated on the precoated PDMS at the days of differentiation listed in the text and then cultured overnight before 4 h printing for sAPPα and Aβ. Purified human astrocytes were purchased from ScienCell and cultured in ScienCell's “astrocyte medium.”
Microengraving and printing.
The nanowell array was fabricated from a biocompatible PDMS (polydimethylsioxane) affixed to a glass microscope slide. Each array had 84,672 wells with 50 × 50 × 50 μm dimensions. Before cell plating, PDMS arrays were incubated in a vacuum plasma cleaner at a high radio frequency for 2 min to make the surface hydrophilic for later cell plating and then placed in PBS. Cells were loaded from suspension (1–2 × 10⁵ cells/ml) by gravity, which favors 0–2 cells per well (examined in real-time under a microscope). Nonadherent cells are removed through subsequent washing. The cells on PDMS were stained with calcein violet or calcein red-orange (Life Technologies) and imaged using an automated inverted epifluorescence microscope (Zeiss). Cell viability and numbers per well were analyzed with Enumerator software (custom software, available upon request to J.C.L.; Ogunniyi et al., 2009; Han et al., 2010). Capture antibody for sAPPα and Aβ (6E10) (35 μg/ml) and human IgG antibody (15 μg/ml) were coated onto a poly-lysine-coated glass slide at room temperature for 1 h and blocked with 5% BSA in PBS for 30 min. Before printing, the glass slide was briefly incubated with 10,000× diluted human serum. Detection of human serum bound to human IgG antibody allows for software alignment of wells. The coated slide was used to seal the nanowell array plated with cells (clamped between plates using a microarray hybridization chamber). Incubation time of printing varied between 2 and 4 h (see results section) at 37°C, followed by removal of the glass slide. Captured sAPPα and total Aβ on the glass slide were detected by incubation with HRP- or biotin-conjugated detection antibodies for 1 h at room temperature (RT), followed by a fluorescently labeled secondary antibody at RT for 1 h. Fluorescent signals were detected using a Genepix Pro slide scanner and aligned with Crossword (Gierahn et al., 2014). Secretion data from Crossword and cell information from Enumerator were combined according the unique ID for each well. For differentiated human iPSC cells, wells were deemed analyte positive if the signal was 1 SD above the mean and the intensity of >30% of the pixels within the well area was >2 SDs above the local mean background intensity.
Immunostaining of cells in arrays.
After analyte detection, human iPSC-derived neural cells were fixed with 4% paraformaldehyde for 30 min and then blocked in PBS/2% Donkey serum/0.1% Triton X-100 for 1 h. After blocking, the cells were immunostained with a variety of antibodies such as Tuj1 (1:200; Millipore), GFAP (1:1000; Abcam), APP N terminus antibody (4F2; 1:500), APP C terminus antibody (C9; 1:500), FoxG1 (1:200; Abcam), Tbr1 (1:200; Abcam), glutamate (1:1000; Immunostar), and GABA (1:1000; Immunostar). A list of cell information including the well IDs, cell size, and fluorescent intensities were extracted using Enumerator software and then gated using MATCH box software (Gierahn et al., 2014) to identify cells positive for each marker. Randomly chosen images of cells were extracted and visually confirmed for proper assignment of “negative” or “positive.” The cytometry data were then merged with microengraving data to assign occupancies and correlate imaging cytometry data with secreted protein data for each well.
Single-cell NanoString gene expression analysis.
Individual human iPSC-derived neural cells of interest, identified by microengraving, were stained with trypan blue for viability assessment and retrieved using a CellCelector micromanipulator (Automated Lab Solutions). The retrieved cells were transferred into lysis buffer (Single Cell-to-CT kit; Life Technologies) followed by reverse transcription (SuperScript Vilo MasterMix; Life Technologies) and multiplexed target enrichment (30 cycles) for genes contained in a custom 150-gene NanoString codeset. Next, 2 μl of amplified samples were loaded with HT DNA 5K LabChip kit on a Caliper LabChip GX machine to examine amplification of cDNA products. Only single-cell samples having clearly amplified products between 200 and 400 bp were furthered examined using the NanoString assay. The amplified cDNA were hybridized to the code set and processed with the nCounter Prep station as per the manufacturer's instructions. The cartridge was scanned using the nCounter Digital Analyzer and analyzed by nSolver Analysis Software. Raw probe counts were normalized to total probe counts per sample. Heat map and principle component analysis (PCA) were performed using the Genepattern platform established by the Broad Institute.
Results
Detection of Aβ and sAPPα secreted from single cells overexpressing APP
To examine secretion of analytes from single cells, cells were plated from a suspension in defined medium onto arrays of nanowells with volumes of 50 μm3. These arrays were manufactured by replica molding using a biocompatible elastomer (Ogunniyi et al., 2009). The density of cells plated favors 0, 1, or 2 cells in each well (1∼2 × 10⁵ cells/ml). Approximately 100,000 wells are analyzed per assay, with 30,000–40,000 wells containing single cells. Wells with two or more cells can be analyzed separately and wells with no cells aid in background determinations. Figure 1 presents an overview of the microengraving procedure. After plating in nanowells, cells were stained with a marker for living cells and imaged. After imaging, analyte secretion was examined by placing glass slides coated with capture antibodies to analytes of interest on top of the nanowell array. These slides isolate each well from its neighbors and create microenvironments with ∼100 pl of media per well. The subnanoliter volume of the well enhances the sensitivity of the assay relative to conventional methods. After analytes were captured over 2–4 h, the glass slides were removed and incubated with a detection antibody conjugated to an HRP or biotin tag, followed by a fluorescence-conjugated anti-HRP or anti-biotin, similar to a traditional “sandwich ELISA.” Slides were scanned and analyzed using standard microarray instrumentation (Genepix). After removal of the slides, cells remained in their original nanowells and were stained with a second live cell marker, fixed and immunostained, and/or retrieved from the nanowell for examinations of gene expression. Data were analyzed using both Genepix and MATCH Box software and integrated to provide compiled data for each cell as described previously (Gierahn et al., 2014). To control for variable background levels across the array, data are presented as the signal-to-noise ratio (SNR), calculated as follows: SNR = (foreground median − background median)/(STDEV background). To gauge our limit of detection for Aβ and sAPPα codetection, spot blots were performed using purified Aβ and sAPPα and optimized antibody pairs. Aβ and sAPPα were detected at a concentration as low as 1 ng/ml using our detection method.
Figure 1.

Overview of the protocol for detecting secreted APP cleavage products from single cells. In the first step, cells are dissociated, plated in nanowells, stained with a viability marker (calcein), and imaged. In the second step, wells are sealed off from their neighbors with a glass slide coated with a capture antibody that binds both sAPPα and Aβ, as well as a control antibody (human IgG) for highlighting the shape and precise location of each well. Secreted sAPPα and Aβ are captured for 2–4 h. After incubation, the glass slide is separated from PDMS wells and then incubated with HRP- or biotin-conjugated detection antibodies for sAPPα and Aβ, followed by fluorescence-conjugated secondary antibodies. The glass slide is then washed and scanned using a Genepix scanner. In the third step, the cells in PDMS wells after microengraving are either fixed and immunostained for cell fate markers or retrieved from wells for gene expression analyses. Finally, data from each step are integrated and analyzed using Crossword and Matchbox.
We first examined the efficiency of Aβ and sAPPα co-detection from single cells using microengraving with a stable monoclonal CHO-based cell line overexpressing wild-type human APP (7WD4; Xia et al., 1997). With this CHO-based cell line, 74.3% (±2.9 SEM) of cells stained positive for a “live” cell marker (calcein violet) following the entire procedure. Figure 2, A and B, show histograms of the relative frequency for sAPPα and Aβ detection from wells with no cells, cell-containing wells that we determined are below the threshold of detection for each analyte (“neg”), and cell-containing wells that were above the threshold of detection for each analyte (“pos”). To be called “positive,” the intensity of the signal from the well must be >1.5-times the local background plus 2 SDs. These results show that, using these methods, we can accurately separate positive and negative signals. To minimize the rate of false discovery, we used stringent criteria for calling a signal “positive” and are therefore likely calling some wells “negative” that are actually secreting analytes above the technique's threshold of detection (see red vs blue histogram traces in Fig. 2A,B). To estimate a false-positive rate, we examined the percentage of wells containing no cells that were deemed to be positive by our stated criteria. Over 12 experiments, the estimated mean percentage of “false positives” based on these criteria was 0.10% for sAPPα and 0.02% for Aβ.
Figure 2.
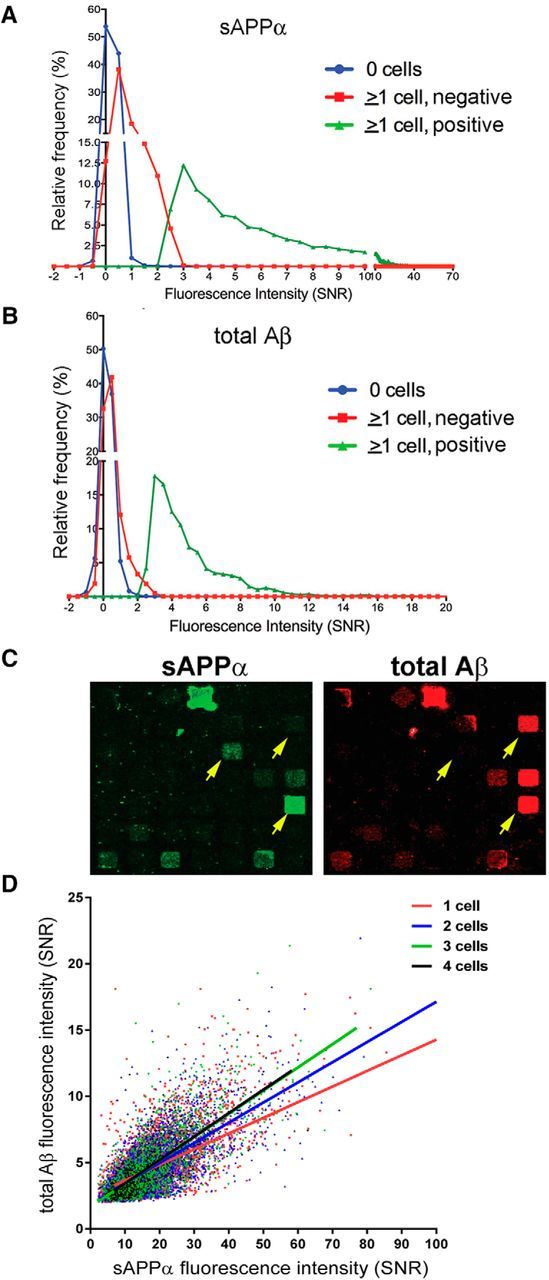
Single-cell detection of APP cleavage products using human APP-overexpressing stable clonal cell lines. Microengraving was used to co-detect secreted Aβ and sAPPα from CHO cells overexpressing wild-type hAPP (7WD4). A, B, Representative histogram distributions of sAPPα and Aβ fluorescence intensity from wells with or without cells from single arrays. C, Representative printing images for single blocks of nanowells. Yellow arrows highlight the range of intensities for printing observed from single living cells. D, Fluorescence intensities (SNR) are plotted for sAPPα (x-axis) and total Aβ (y-axis) for each well with positive signal. Each dot represents data from a single well containing 1–4 cells.
Figure 2C shows representative blocks from two arrays for the range of signal intensities observed for total Aβ and sAPPα codetection (7WD4 cells). Yellow arrows point to individual wells to highlight different fluorescent intensities observed from this monoclonal cell line when these cells were analyzed at the single-cell level. Figure 2D highlights this further, showing the relative range of secretion levels from wells with single cells (red dots). The presence of multiple cells in a well did not seem to influence the relative secretion of total Aβ and sAPPα significantly (Fig. 2D). These analyses of single cells suggest that, even in a population homogenous in cell fate, cell state (e.g., cell cycle phase) may affect secretion of these APP cleavage products.
Detection of Aβ and sAPPα in single human iPSC-derived neurons and glia
In recent years, numerous studies including our own have established protocols for differentiating human iPSCs to neuronal and glial fates of the forebrain (Muratore et al., 2014a; Muratore et al., 2014b). Figure 3A outlines the developmental timing of our differentiation protocol, which results in >90% of the cells expressing neuronal markers at day 40, with a portion of the remaining cells expressing markers of neural progenitor cells. These progenitor cells produce astrocytes late in the differentiation protocol and, by day 100 of differentiation, ∼75% of the cells express neuronal markers and ∼20% express astrocyte markers (Muratore et al., 2014b). The population expressing neuronal markers consists of a heterogeneous mixture of cells expressing markers of upper and lower cortical layers, as well as markers of excitatory and inhibitory neurons. We have shown previously that these heterogeneous mixtures of neural cell types secrete increasing levels of Aβ and sAPPα over differentiation time from day 0 to day 100 (Muratore et al., 2014b). This suggests that APP expression and/or processing increases as cells go from an immature, mitotic fate to a postmitotic, differentiated neuronal state. Using the MSD ELISA platform, we estimated the levels of Aβ and sAPPα secreted from pooled populations of hiPSC-derived neurons and glia between days 50 and 100 to be 50–1800 pg/ml of total Aβ and 15–110 ng/ml sAPPα (Muratore et al., 2014b). Normalizing to the estimated number of cells plated in the pooled cultures (30,000 cells per well) and the amount of time the media were conditioned (∼48 h), we estimate that the mean levels of secretion per cell over 4 h (a standard time that we captured analytes using microengraving) is 0.1–5.0 fg of total Aβ and 50–300 fg of sAPPα. However, it is clear that every cell is not secreting equal amounts over 4 h. Given the heterogeneity of cell fates present in these cultures, we predict that subpopulations of cells are contributing more or less to the levels of Aβ and sAPPα secreted within a given 4 h window.
Figure 3.
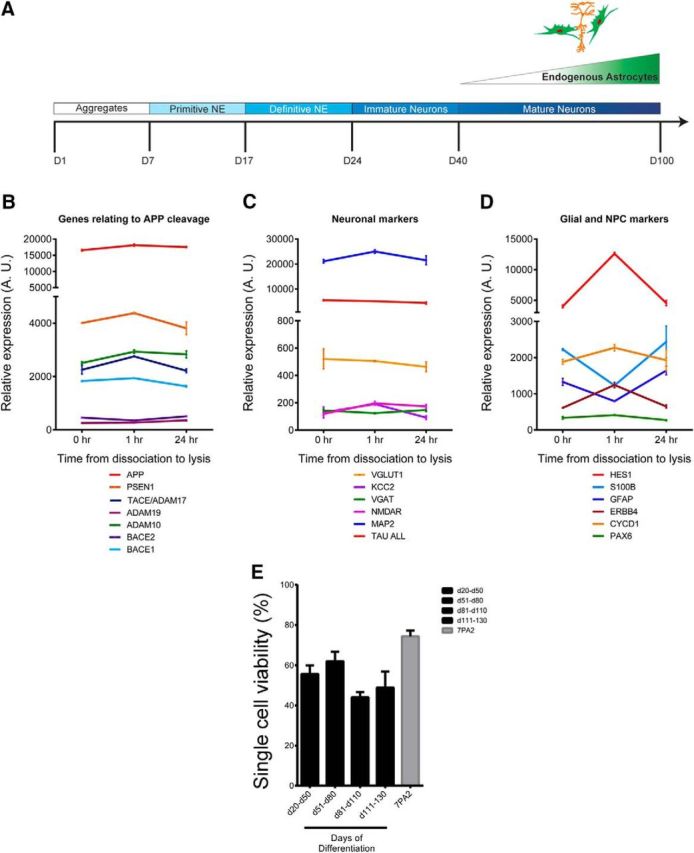
Gene expression and viability after culture of hiPSC-derived neurons and glia after culture in nanowells. A, Schematic of timing of hiPSC neural differentiation (Muratore et al., 2014a; Muratore et al., 2014b). B–D, HiPSC-derived neural cells in pooled cultures (d98) were either lysed without dissociation, dissociated and lysed 1 h later, or dissociated and lysed 24 h later. RNA was prepped and subjected to NanoString analysis. Normalized data for genes relating to APP cleavage (B), neuronal markers (C), and glial and NPC markers (D) are shown. n = 3 for each condition, error bars indicate SD. E, Viability of single hiPSC-derived neural cells over differentiation time is shown. n = 2 (d20–50), 7 (d51–80), 4 (d81–110), 2 (d111–130), and 14 (7PA2). Error bars indicate SEM.
To adapt microengraving for analyses of neural cells, neurons and glia were derived from iPSCs using our established protocol (schematized in Fig. 3A; Muratore et al., 2014b) and then dissociated and plated cells in nanowells at multiple time points. We found significant changes in the expression of a subset of genes acutely after dissociation, which rebounded to original levels 24 h after dissociation (Fig. 3B–D). These acute changes are not surprising given the physical and chemical manipulation of the cells. We thus measured secreted analytes 24 h after dissociation and plating in nanowells. We have compared methods of dissociating hiPSC-derived neurons and found that Accutase (Innovative Cell Technologies) effectively dissociates these cells while maintaining high cell viability. We next determined the optimal substrate for plating these cells in nanowells by comparing PDMS without additional substrate with poly-d-lysine coating or with poly-ornithine/laminin coating. We found that poly-ornithine/laminin provides the optimal viability and lowest background. Over the time allowed for differentiation, the viability of the cells after dissociation and plating in nanowells does not appear to vary significantly (Fig. 3E). However, the detection prevalence of both total Aβ and sAPPα increases over differentiation time from day 20 to day 110 (Fig. 4A,B). Although the detection prevalence increases over differentiation time, the distribution of SNR values of analyte “positive” single cells does not vary significantly between these time points (Fig. 4C,D). Figure 4, E and F, show histograms of the relative frequency for Aβ and sAPPα printing intensities for wells with no cells, cell-containing wells that we determine were below the threshold of detection for each analyte (“neg”), and cell-containing wells that were above the threshold of detection for each analyte (“pos”). Similar to experiments in 7WD4 cells overexpressing APP (Fig. 2A,B), we were able to identify secretion of these analytes accurately from single cells above background fluorescence intensities (Fig. 4E,F).
Figure 4.
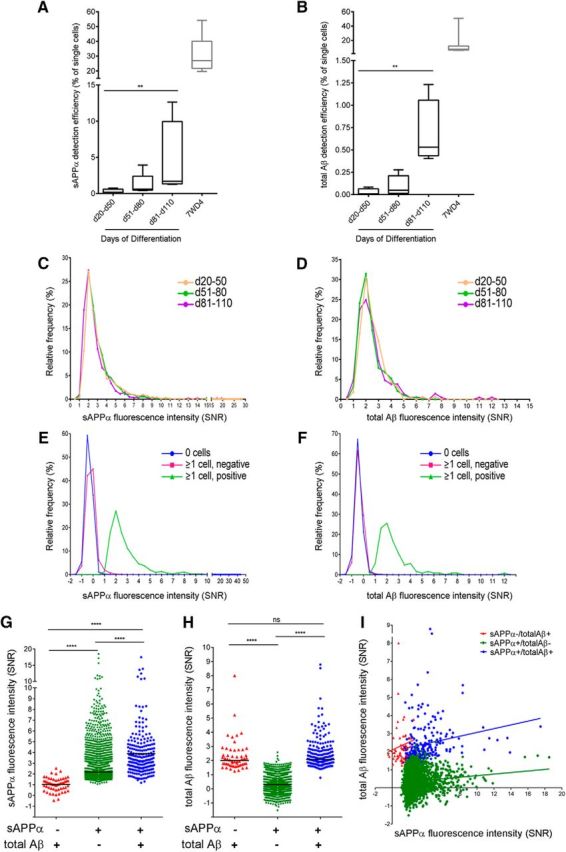
Detection of secreted sAPPα and total Aβ from single hiPSC-derived neural cells. Human iPSCs were differentiated to forebrain neural fates. At multiple time points of differentiation, cells were dissociated and plated in nanowells for 24 h. Cells were then imaged for a marker of living cells and sAPPα and Aβ detected using the experimental outline presented in Figure 1. The detection efficiency for single, living cells is shown for sAPPα (A) and Aβ (B) at different time points of differentiation and compared with the detection efficiency for 7WD4 cells over multiple experiments: iPSC differentiation d20–50 (n = 4), d51-d80 (n = 5), d81-d110 (n = 4), and 7WD4 (n = 13). Box shows minimum to maximum value and line shows the median value. **p < 0.01, Kruskal–Wallis multiple-comparisons test. C, D, Histogram distribution of SNR values of wells positive for sAPPα (C) and Aβ (D) for each range of differentiation time. For each bin, data from three independent experiments for each time point are combined. Histogram distribution of the relative frequency of sAPPα (E) and total Aβ (F) SNR printing intensity from wells with or without cells are shown (combined data from three representative experiments, each over 75 d of differentiation). G–I, Combined data from four experiments are shown for single, living cells differentiated to neuronal fates for 64–99 d. The intensity of sAPPα or Aβ secreted from three different groupings of single cells (sAPPα−/totalAβ+, sAPPα+/totalAβ−, sAPPα+/totalAβ+) are presented in G and H and the correlation of sAPPα and total Aβ from each group is presented in I. Black lines in G and H denote the mean value for each group. ****p < 0.0001, one-way ANOVA, Kruskal–Wallis multiple-comparisons tests.
A range of secretion profiles for Aβ and sAPPα were observed from differentiated neural cells (>90 d of differentiation; Fig. 4G–I). Although subsets of cells secrete detectable levels of both Aβ and sAPPα, a larger subset of cells secretes detectable levels of only sAPPα. This is to be expected because α-secretase cleavage is a higher-frequency event than β-secretase cleavage in most cell types, including hiPSC-derived neural cells. Over hiPSC differentiation in pooled groups of cells, the α:β cleavage ratio is >20 at d9 of differentiation and this ratio steadily decreases to ∼2 at d100 of differentiation (as measured by sAPPα vs sAPPβ release from cells; Muratore et al., 2014b). Both α- and β-cleaved APP products steadily increased over differentiation time as total APP expression increased. Despite the observed predominance of α-cleavage, we also observed a smaller but unexpected subpopulation of cells that secreted detectable levels of Aβ without detectable levels of sAPPα (Fig. 4G–I). Over five independent experiments, the percentage of the total population of cells that secreted high Aβ without detectable sAPPα ranged from 0.03% to 0.10% (mean of 0.7% ± 0.4% SD). Cleavage of APP via α- or β-secretase is believed to occur, respectively, at the cell surface and in acidic compartments such as endosomes. Additional studies are warranted to examine the mechanism by which this rare population of cells displays elevated β-cleavage relative to α-cleavage. This single-cell technology provides an opportunity to address this important question. Interestingly, when comparing cells that secrete detectable levels of sAPPα alone with cells that secrete detectable levels of both analytes, the mean levels of secreted sAPPα levels were elevated when detectable levels of Aβ were also secreted (Fig. 4G). In contrast, mean levels of Aβ were not different between Aβ positive groups (Fig. 4H).
Comparison of Aβ and sAPPα secretion from neural cells derived from control and familial AD iPSCs
We have reported previously the generation and characterization of hiPSC lines from fAD patients harboring the London mutation in APP (V717I; Muratore et al., 2014b). In that study, we confirmed the known effect of this mutation on increasing the Aβ42 to Aβ40 ratio in pooled cultures. In addition, we found that overall levels of secreted Aβ were slightly but significantly elevated in fAD neural cultures relative to control cultures due to elevated β-secretase cleavage (∼1.5-fold increase in total Aβ levels as measured by ELISA; Muratore et al., 2014b). Here, we aimed to compare Aβ and sAPPα secretion profiles from control and fAD single neural cells. Control and fAD iPSCs were differentiated to neural fates in parallel cultures for >90 d as above. Cells then were dissociated and differentially labeled with calcein violet (control) or else calcein red-orange (fAD). Cells were then mixed and plated in nanowell arrays. Secreted Aβ and sAPPα were detected as in Figure 1. Histograms in Figure 5, A and B, show that the distribution of sAPPα and Aβ fluorescence intensities from both control and fAD cells are highly similar. Further, of the cells secreting detectable levels of sAPPα and Aβ (Fig. 5C–G), the levels of each analyte in each subpopulation (sAPPα−/Aβ+, sAPPα+/Aβ−; sAPPα+/Aβ+) were similar between control and fAD cells, with fAD cells showing slightly higher averaged levels of Aβ secretion. The percentage of cells secreting detectable Aβ was ∼1.4-fold higher in fAD cells. In addition, a higher proportion of the fAD population secreted detectable levels of Aβ (expected distribution based on proportions from control population, χ2 test, p < 0.001). Therefore, the elevated Aβ levels in fAD neural cells observed in pooled cultures (Muratore et al., 2014b) appears to be due in part to increased numbers of cells secreting high levels of Aβ.
Figure 5.
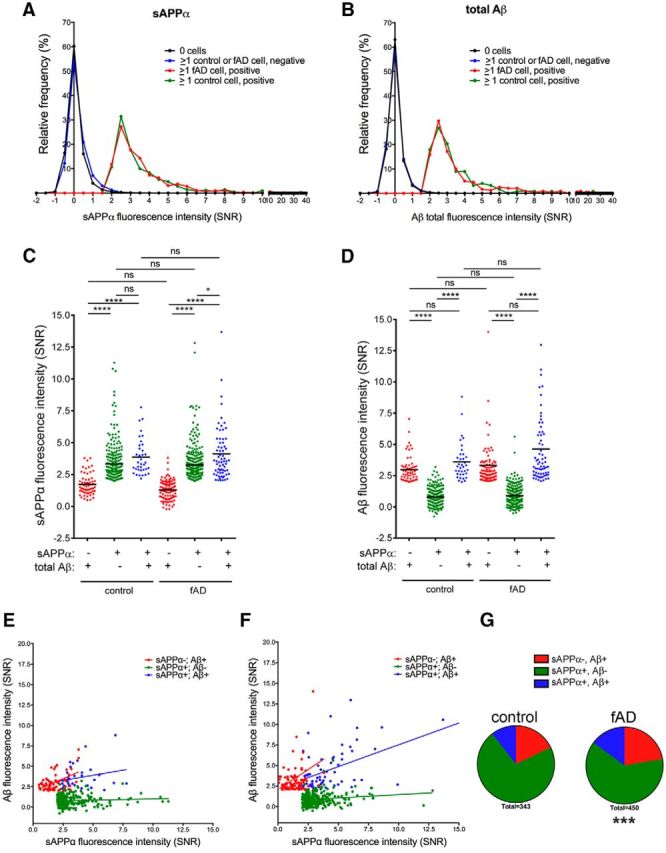
HiPSC-derived neural cells from familial AD and healthy control lines display similar secretion profiles of Aβ and sAPPα. Control and fAD hiPSC lines were differentiated to neural fates for 121 d, followed by dissociation, labeling with calcein violet (control) or calcein red-orange (fAD), and were then mixed and plated in nanowells and imaged. Twenty-four hours later, microengraving was performed for 4 h to detect sAPPα and Aβ, followed by staining with a second viability marker and imaging. Histograms show the distribution of SNR values of wells negative or positive for sAPPα (A) and total Aβ (B). For each graph, data from three arrays are combined. C, D, Fluorescence intensity of sAPPα (C) or total Aβ (D) secreted from three different groupings of single cells (sAPPα−/totalAβ+, sAPPα+/totalAβ−, sAPPα+/totalAβ+). Black lines in C and D denote the mean value for each group. *p < 0.05; ****p < 0.0001, ns = not significant, one-way ANOVA, Kruskal–Wallis multiple-comparisons tests. The correlation of sAPPα and total Aβ fluorescence intensity from each group for control (E) and fAD (F) is shown. Percentages of subpopulations defined by different sAPPα and Aβ secretion profiles were calculated for control and fAD hiPSC-derived neural cells and graphed as pie charts in G. ***p < 0.001, chi-square tests comparing fAD with control (expected).
Profiling of subpopulations of hiPSC-derived neurons and glia secreting the highest levels of Aβ and sAPPα
As discussed above, measurements of Aβ and sAPPα secretion from iPSC-derived neural cultures using standard tissue culture techniques have revealed differences in APP cleavage over differentiation time. Although these observations were consistent between wells containing pools of cells, differentiation rounds, and cell lines, these data represent data from bulk heterogenous populations of multiple cell fates. It is unknown whether cells of particular neuronal and glial fates process APP differentially and if there are specific cell fates that contribute predominantly to the observed secretion profiles of Aβ and sAPPα. Therefore, we next aimed to identify the subpopulations of cells in hiPSC neural cultures that secrete the highest levels of Aβ and/or sAPPα, and molecularly characterize those cells. Control and fAD human iPSCs were differentiated to neural fates for >90 d and Aβ and sAPPα detected as in Figure 5. Cells were stained for trypan blue after printing and selected viable cells were analyzed by gene expression analyses. Individual cells secreting both analytes, sAPPα alone, or neither analyte were retrieved from their nanowells and lysed. RNA was reverse-transcribed using SuperScript VILO Mastermix and cDNA amplified 30× using multiplexed enrichment of each of 150 targets sequences. Amplified cDNA was then denatured and hybridized to a custom NanoString codeset. In parallel, sets of 500 cells were lysed and subjected to the same protocol (“pools”). Data obtained were normalized to the total probe counts per cell (or pool of cells). Figure 6A shows the Aβ and sAPPα printing images from examples of the cells selected for NanoString analysis. This custom probe set contains cell fate markers, housekeeping genes, APP and its binding partners, and genes encoding the secretases that cleave APP. Heat map of normalized Nanostring data are shown in Figure 6B. These experiments were replicated in an independent set of 29 cells on a separate custom Nanostring probe set targeting an overlapping set of genes. Normalized probe counts for each gene for both sets are provided online in the GEO database (http://www.ncbi.nlm.nih.gov/geo/query/acc.cgi?acc=GSE76551).
Figure 6.
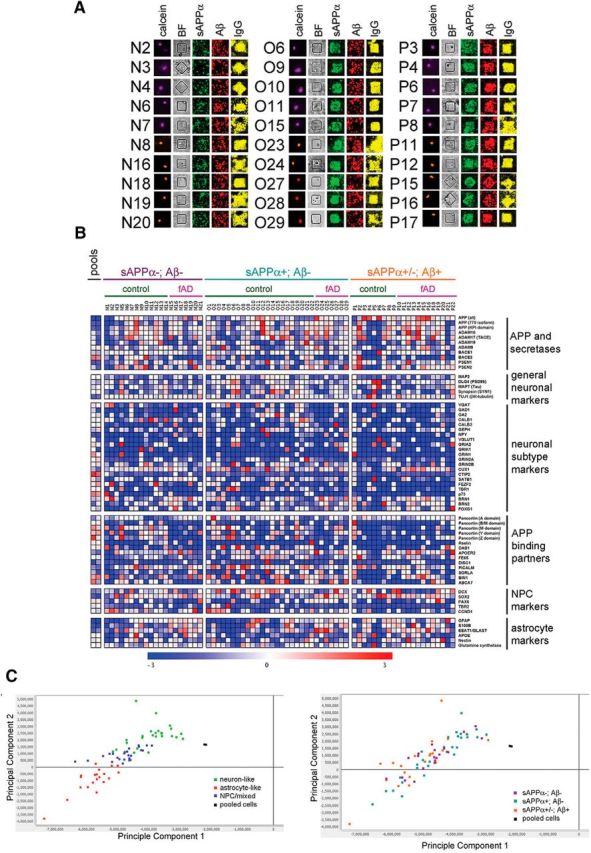
Examination of gene expression profiles after detection of sAPPα and Aβ from single iPSC-derived neural cells. HiPSC-derived neural cells differentiated to neural fates >90 d were stained with calcein (violet for control cells or red-orange for fAD cells) to mark viable cells and imaged, followed by 4 h of microengraving for sAPPα and total Aβ. After printing, individual cells were stained with trypan blue to mark cells with intact membranes, retrieved from nanowells, lysed, and cDNA was synthesized and amplified using multitarget amplification and hybridized to a custom NanoString codeset. Expression data for each cell was normalized to total probe counts. A, Example images of cells from wells selected for NanoString analysis and their corresponding printing images are shown. BF, Bright field; IgG, control to aid in well alignment. B, Heat map of expression data of select genes are shown for each cell, as well as for pools of 500 cells each. Full dataset with normalized values are presented in the GEO database (http://www.ncbi.nlm.nih.gov/geo/query/acc.cgi?acc=GSE76551). C, PCA (GenePattern) was performed, the top two eigenvectors graphed, and subgroups colored based upon neuron and astrocyte marker expression (left) and APP cleavage product secretion (right).
Neurons are thought to be the major source of Aβ in the brain based on studies in mice (Zhao et al., 1996; Calhoun et al., 1999) and expression of BACE (Vassar et al., 1999; Laird et al., 2005). Furthermore, there is evidence that excitatory neurons of the forebrain are a strong contributor of Aβ secretion through an activity-dependent mechanism (Kamenetz et al., 2003). Therefore, we hypothesized that, at the single-cell level, the highest secretors of Aβ would be neurons and perhaps a particular subtype of excitatory neurons. However, individual cells secreting sAPPα and/or Aβ expressed markers for astrocytes or neurons (Figs. 6B, 7B,E). Within the class of cells expressing neuronal markers (“neuron-like” cells), markers of GABAergic (e.g., P10, O14) and glutamatergic (e.g., P6, O6), as well as of upper (e.g., P15, O1) and lower (e.g., P5, O6) layer neuronal fates were expressed in subsets of individual cells secreting high levels of sAPPα and/or Aβ (Figs. 6B, 7C,F).
Figure 7.
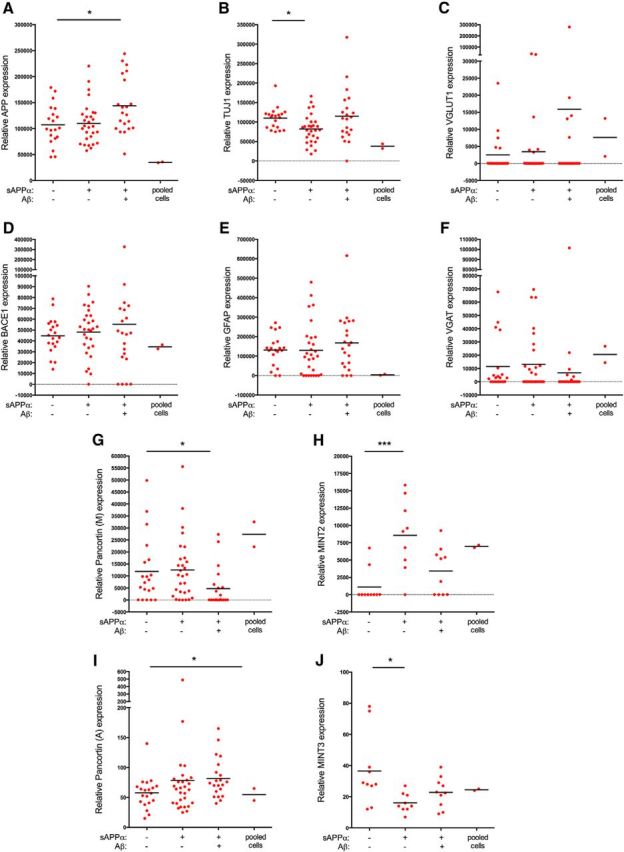
Cells secreting high levels of sAPPα and Aβ express markers of an array of cell types. Scatter plots of data for select genes examined by NanoString analysis in Figure 6: APP (A), Tuj1 (B), VGLUT1 (C), BACE1 (D), GFAP (E), VGAT (F), Pancortin (M; G), MINT2 (H), Pancortin (A; I), and MINT3 (J). *p < 0.05, ***p < 0.001, one-way ANOVA with Kruskal–Wallis multiple-comparisons tests performed across single-cell data.
In agreement with our observations of individual genes, principle component analysis (PCA) of the NanoString dataset did not segregate cells based upon sAPPα and Aβ secretion profile (Fig. 6C). Based upon the expression of the top 10 genes in each cell, we classified each cell as “neuron-like,” “astrocyte-like,” or “NPC/mixed” and PCA-segregated cells based upon this classification scheme (Fig. 6C). Cells secreting the highest levels of sAPPα and Aβ were represented in each of these subgroups (Fig. 6C).
In recent years, several candidate protein ligands for APP, including F-spondin (Ho and Südhof, 2004; Hoe et al., 2005), Reelin (Hoe et al., 2006; Hoe et al., 2009), Integrin β1 (Young-Pearse et al., 2008), Contactins (Bai et al., 2008; Osterfield et al., 2008), Lingo-1 (Bai et al., 2008), and Pancortins (Rice et al., 2012) have been reported to interact physically with the ectodomain of APP and modulate its processing—and, in some cases, function. In addition, several cytosolic proteins, including DAB1 (Homayouni et al., 1999; Young-Pearse et al., 2007), PICALM (Xiao et al., 2012), DISC1 (Young-Pearse et al., 2010), Fe65 (Borg et al., 1996; Zambrano et al., 1998; Cao and Südhof, 2004), MINTs (McLoughlin and Miller, 1996; Mueller et al., 2000; Hill et al., 2003), and SORLA (Cam and Bu, 2006), have been identified to bind to the intracellular domain of APP and expression of several of these proteins has been described to affect APP trafficking and/or cleavage. Because many of these APP-binding partners were shown to affect α- and/or β-secretase cleavage, we examined expression of these factors in cells secreting APP cleavage products (Fig. 7). On average, cells secreting high levels of Aβ expressed lower levels of total Pancortin (Fig. 7G), but relatively higher levels of a particular isoform of Pancortin (A-domain; Fig. 7I). The majority of cells secreting high levels of sAPPα also expressed high levels of MINT2 (Fig. 7H), whereas MINT3 was highly expressed in cells not secreting high levels of either analyte (Fig. 7J). Although potentially interesting and worthy of further analyses, these data suggest that expression of these APP-binding partners does not strictly define those subpopulations of cells secreting high levels of Aβ and/or sAPPα.
We predicted that cells secreting the highest levels of APP cleavage products would express the highest levels of APP and those secreting Aβ would express the highest levels of β-secretase (BACE1 and/or BACE2). Although the average RNA levels of APP were significantly higher in cells secreting detectable levels of both analytes (Fig. 7A), BACE expression levels were not predictive for whether a cell would secrete detectable Aβ (Fig. 7D). Although some Aβ-secreting cells expressed low levels of BACE, other cells that did not secrete detectable APP cleavage products expressed very high levels of BACE and APP. Similarly, expression of genes encoding α- and γ-secretase did not segregate with any particular APP analyte subgroup (Fig. 6B). This result suggests that, at a single-cell level, RNA expression levels of APP and its cleavage enzymes are not predictive of high levels of APP cleavage product secretion. It would be valuable to examine other α-, β-, and γ-cleaved products using this methodology in future studies to assay activity of these secretases in parallel to APP processing. This methodology also provides insights into the complement of ADAMs, BACEs, PSENs, and aph1 isoform expression in subsets of iPSC-derived neural cells. For example, some cells secreting sAPPα express ADAM10, whereas others express ADAM9, ADAM17, or combinations of these ADAMs. (Please see the Nanostring data in the GEO database: http://www.ncbi.nlm.nih.gov/geo/query/acc.cgi?acc=GSE76551.)
To examine APP at the protein level, we immunostained hiPSC-derived neural cells with antibodies recognizing both the N- and C termini of APP after printing for Aβ and sAPPα (Fig. 8). Greater than 80% of the cells in the overall population and in the Aβ- and sAPPα-secreting subpopulations were positive for immunostaining with both antibodies. Six percent of Aβ-secreting cells (14/239) and 3% of sAPPα-secreting cells (26/875) immunostained negative for both epitopes. We hypothesize that this small subset of cells that express low levels of APP holoprotein but secrete high levels of cleavage products represent a subpopulation of cells that cleave APP holoprotein in a highly efficient manner.
Figure 8.

Multiple cell fates are capable of secreting high levels of sAPPα and total Aβ. HiPSC-derived neural cells differentiated to neural fates >90 d were stained with a marker of living cells (calcein violet) and imaged. Twenty-four hours later, cells were subjected to 4 h of microengraving for sAPPα and Aβ. After printing, cells were fixed in the nanowells and immunostained for the listed factors. Example images of immunostained cells and their corresponding printing images for sAPPα and total Aβ are shown in A. MATCH box software was used to plot fluorescence intensities of individual cells. Cells were first gated for DAPI fluorescence (B, left) and the DAPI-positive cells were then gated for marker positivity (TUJ1 example shown in B, right). Percentages of subpopulations defined by different immunostaining profiles were calculated for the total population, as well as the sAPPα and the Aβ printing positive populations, and graphed as pie charts in C. For APP, “N” refers to an N-terminal antibody and “C” refers to a C-terminal antibody. **p < 0.001, ****p < 0.0001, Chi-square tests comparing sAPPα and total Aβ printing positive populations compared with the total population (expected).
To evaluate the validity of cell fate findings in larger number of cells, we performed microengraving experiments followed by immunostaining for cell type markers. Figure 8A shows printing and immunostaining examples of individual wells. Approximately 70% and 11% of the overall population of cells were TUJ1+GFAP− and TUJ1−GFAP+, respectively. Eleven percent of the cells expressed neither marker and may represent neural crest or neural progenitor cells. The remaining 8% of cells were positive for both markers (co-expression of these genes also was observed in a subset of cells at the RNA level, a population we called “mixed/NPC”; Fig. 6C). The populations of cells secreting detectable levels of Aβ and/or sAPPα had profiles of TUJ1 and GFAP expression highly similar to the total population, with a slight overrepresentation of the TUJ1+GFAP− subpopulation (Fig. 8C). To verify that astrocytes are indeed capable of secreting high levels of Aβ, we examined the secretion profile of Aβ and sAPPα from purified human astrocytes obtained from ScienCell. At the single-cell level, a subset of these astrocytes secreted detectable levels of sAPPα (8.8% ± 3.2 SD of the total population of cells) and Aβ (1.6% ± 1.0 SD of the total population of cells), with a similar profile of secretion as hiPSC-derived cells (Fig. 9A–D). At the pooled level, these primary astrocytes secreted Aβ species at ∼1/3 the level of hiPSC-derived neural cells at day 60, as measured by standard MSD ELISA (Fig. 9E,F). These findings suggest that both neurons and astrocytes are capable of secreting high levels of each of these analytes.
Figure 9.
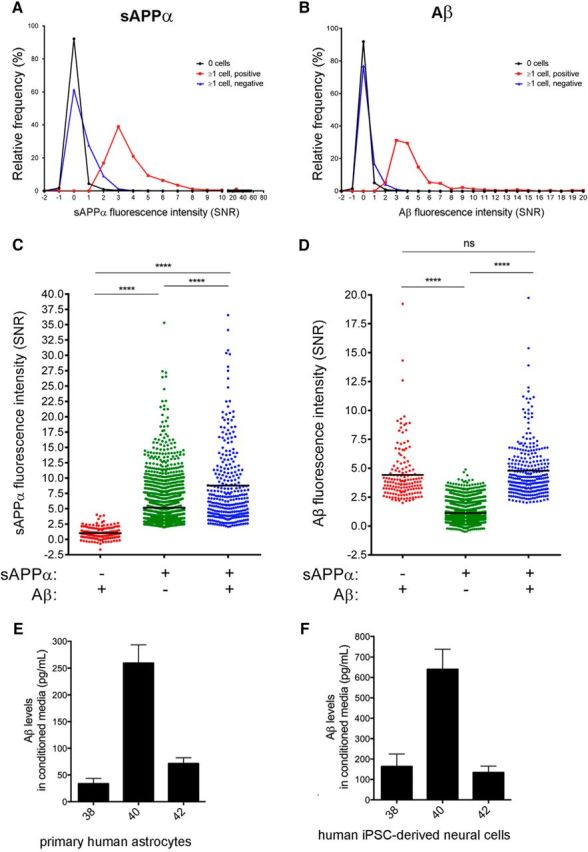
Detection of secreted sAPPα and Aβ from primary human astrocytes. Human astrocytes (ScienCell) were dissociated and plated in nanowells. Cells were then imaged for a marker of living cells and sAPPα and/or total Aβ was detected using the experimental outline presented in Figure 1. Histogram distribution of the relative frequency of sAPPα (A) and Aβ (B) SNR printing intensity from wells with or without cells are shown. C, D, Intensity of sAPPα or total Aβ secreted from three different groups of single cells (sAPPα−/totalAβ+, sAPPα+/totalAβ−, sAPPα+/totalAβ+). Black lines in C and D denote the mean value for each group. ****p < 0.0001, ns = not significant, one-way ANOVA, Kruskal–Wallis multiple-comparisons tests. E, F, Primary human astrocytes (E) or else hiPSC-derived neural cells (F) were cultured in 96-well plates at a density of 40,000 cells per well. Conditioned media (CM) was collected after incubation on cells for 48 h and Aβ levels were measured via ELISA. Mean values are shown for 6–7 wells. Error bars indicate SEM.
To further examine whether certain subtypes of neural cells preferentially secrete high levels of APP cleavage products, after Aβ and sAPPα detection, parallel arrays were immunostained either for FOXG1 (a forebrain progenitor and neuronal marker) and TBR1 (a marker of subsets of progenitor cells as well as lower cortical layer neurons) or for glutamate and GABA. Relative to the total population of cells, FOXG1+TBR1+ cells were overrepresented in the sAPPα+ subpopulation of cells (5465/10141 cells; 54% of total population vs 525/729 cells; 72% of sAPPα+ cells; Fig. 8C). In addition, GABA+ cells were mildly but significantly overrepresented in the sAPPα+ and Aβ+ subpopulations (1038/2156 cells; 48% and 283/714, 40%, respectively) relative to the overall population of cells (11332/33215 cells, 34%; Fig. 8C).
To examine Aβ and sAPPα secretion from an interneuron-enriched iPSC-derived population, we used sonic hedgehog (Shh) to direct forebrain cortical neurons to a more ventral fate during a critical patterning window (Fig. 10A). Previous reports have shown that treatment with Shh during this window directs cells to a GABAergic, interneuron fate (Liu et al., 2013). As reported previously (Liu et al., 2013), we observed that treatment with Shh during this window reduces expression of a marker of excitatory cortical neuron fates (TBR1; Fig. 10C) and increases expression of markers of interneuron fates (GAD1, GABA, PVB; Fig. 10B,C). After differentiation to 40 d, media were collected from pooled cultures and analyzed by standard MSD ELISA. Neural cultures that had been patterned with Shh showed ∼2-fold elevated levels of secretion of Aβ38, Aβ40, and Aβ42 relative to unpatterned neural cultures (Fig. 10D).
Figure 10.

HiPSC-derived forebrain cultures directed to ventral fates secrete elevated levels of Aβ. Human iPSCs were differentiated to forebrain fates and cultured with or without Shh between days 10 and24 in standard culturing vessels (A). At day 40 of differentiation, media were collected after 48 h of culture and cells were either fixed and immunostained (B) or lysed and RNA collected for qRT-PCR analyses (C). B, Immunostaining for markers of interneurons [GABA, parvalbumin (PVB)] with a general neuronal marker (MAP2) and counterstained with DAPI. Images of Shh-patterned neurons at day 40 of differentiation are shown. C, RNA was prepared and qRT-PCR was performed for a cortical marker (TBR1) or a marker of interneurons (GAD1). D, Media were analyzed by MSD Aβ triplex ELISA and normalized to total RNA (n = 5). Error bars indicate SEM. ***p < 0.001, ****p < 0.0001, unpaired t test.
Discussion
In this study, we have established a methodology for detecting Aβ and sAPPα secretion from single cells. We have adapted this method to examine secretion of these analytes from human iPSC-derived neurons and astrocytes and show that we can interrogate intrinsic characteristics of secreting cells using immunostaining and RNA expression analyses. Because of its central role in AD pathogenesis, the mechanism by which APP is cleaved has been the focus of a multitude of studies in academia and industry. Therefore, much is known about small molecules and protein factors that regulate APP cleavage by α-, β-, and γ-secretases. This deep knowledge base regarding APP cleavage provided an ideal paradigm for establishing this methodology. In examining Aβ and sAPPα secretion from single cells, we were able to identify previously unappreciated complexities in the biology of APP cleavage that could not otherwise have been found by studying averaged responses over pools of cells. First, we found heterogeneity in the Aβ and sAPPα secretion levels over 2 h from what was thought to be a homogeneous populations of cells (clonal stable APP-overexpressing CHO lines), suggesting that cell state can have a detectable impact upon APP cleavage. Second, we show that the observed increase in Aβ and sAPPα secretion in pooled cells over differentiation time of human iPSC-derived neural cells results from an increase in the number of cells secreting high levels of each. Third, we predicted that distinct, molecularly definable cell fates would secrete the highest levels of sAPPα and Aβ and that subpopulations of glutamatergic, excitatory neurons would secrete the highest levels of APP cleavage products. By examining iPSC-derived neurons and glia at a single-cell level, we found instead that a diverse array of cell fates are capable of secreting high levels of Aβ and sAPPα, with a significant fraction of these high secretors expressing markers of astrocytes or GABAergic neuronal fate. These data support a model in which many distinct cell types in the brain contribute to the pools of secreted Aβ and sAPPα. This directly supports recent findings that revealed that neurons not of an excitatory fate, as well as non-neuronal cells, contribute robustly to Aβ generation and deposition in an aged transgenic model of AD (Veeraraghavalu et al., 2014).
As with any experimental system in which the cellular environment is perturbed, there are multiple caveats of this system to keep in mind when interpreting results. Studies of single cells in which individual cells are isolated from their neighbors, such as those described herein, may be particularly vulnerable to potential artifacts. Here, we were careful in our interpretations to not make claims regarding what occurs in the aged brain. Rather, we highlight the potential of a variety of cell types to secrete high levels of Aβ, sAPPα, or both analytes. For example, here, we found that neurons expressing GABAergic markers can secrete high levels of Aβ. However, because other neuronal types also secrete high levels of Aβ, using microengraving alone it would not be possible to predict what the impact of Aβ secretion from GABAergic cells would be in the living brain. Therefore, whereas single-cell analyses provide a novel view of APP cleavage in individual cells, we want to emphasize the importance of validating the potential significance of these findings with alternative methods.
In this study, we have focused upon the secretion of analytes from isolated individual cells. By examining single cells isolated in nanowells, we can separate the intrinsically encoded properties of Aβ and sAPPα secretion from the potential cell-non-autonomous effects of cell–cell interactions. However, by carefully examining wells with two or more cells, this system has the potential to dissect cell–cell interaction effects that may be important for APP processing. For example, we examined expression of a subset of proteins that have been proposed to affect APP processing (Fig. 7). The effects of these and other proteins could be tested at the single-cell level using a cell-mixing approach with examination of wells with multiple cells. In addition, it has been proposed previously that sAPPα can affect APP processing (Obregon et al., 2012). Data presented here in Figure 2D suggest that multiple cells in a well do not affect the relative secretion of Aβ and sAPPα in the case of a CHO cell line overexpressing APP. Future studies are warranted to examine how particular cell types of neural origin with endogenous APP expression influence APP processing in other cell types of neural origin.
The method described here can be adapted to profile neural progenitor cells, neurons, and glia that secrete other factors of interest. Of particular interest are secreted proteins central to neurodevelopmental processes and disease-relevant neurotoxic species. In addition, because cells remain alive in the well after printing, serial application of antibody-coated glass slides to the arrays allows for longitudinal analysis of target analytes and therefore allows for the investigation of responses of individual cells to small molecules. Studies such as these may provide new insights into the mechanism of action of certain small molecules.
In summary, we have established a method to detect analyte secretion from hiPSC-derived single neural cells that allows us to link this information to data collected about the cells. In optimizing this technique for detection of AD-related analytes, we have uncovered novel biological findings that could not have been observed without a single-cell analytical platform. These findings open up a number of additional biological questions and this technology provides an opportunity to elucidate the answers to these questions. Importantly, this technique can be readily adapted to the detection of other analytes secreted by neuronal and glial cells. With the expansion to other analytes, this new analysis platform has the potential to open new perspectives into human CNS development and dysfunction.
Footnotes
This work was supported by the W.M. Keck Foundation (J.C.L.), the Harvard Stem Cell Institute (T.L.Y.-P.), the National Institutes of Health (National Institute of Mental Health Grant R21MH096233 to T.L.Y.-P. and National Institute on Aging Grant R33AG049864 to T.L.Y.-P.), and the Koch Institute (Support Grant P30-CA14051 form the National Cancer Institute). J.C.L. is a Camille Dreyfus Teacher-Scholar. We thank Rachel Gladstone, Qing Han, and Rachel Barry for technical assistance; David Biggs for aid in using Enumerator software; and members of the LaVoie, Selkoe, Love, and Young-Pearse laboratories for helpful discussions.
The authors declare no competing financial interests.
References
- Bai Y, Markham K, Chen F, Weerasekera R, Watts J, Horne P, Wakutani Y, Bagshaw R, Mathews PM, Fraser PE, Westaway D, St George-Hyslop P, Schmitt-Ulms G. The in vivo brain interactome of the amyloid precursor protein. Mol Cell Proteomics. 2008;7:15–34. doi: 10.1074/mcp.M700077-MCP200. [DOI] [PubMed] [Google Scholar]
- Bertram L, Lill CM, Tanzi RE. The genetics of Alzheimer disease: back to the future. Neuron. 2010;68:270–281. doi: 10.1016/j.neuron.2010.10.013. [DOI] [PubMed] [Google Scholar]
- Borg JP, Ooi J, Levy E, Margolis B. The phosphotyrosine interaction domains of X11 and FE65 bind to distinct sites on the YENPTY motif of amyloid precursor protein. Mol Cell Biol. 1996;16:6229–6241. doi: 10.1128/MCB.16.11.6229. [DOI] [PMC free article] [PubMed] [Google Scholar]
- Calhoun ME, Burgermeister P, Phinney AL, Stalder M, Tolnay M, Wiederhold KH, Abramowski D, Sturchler-Pierrat C, Sommer B, Staufenbiel M, Jucker M. Neuronal overexpression of mutant amyloid precursor protein results in prominent deposition of cerebrovascular amyloid. Proc Natl Acad Sci U S A. 1999;96:14088–14093. doi: 10.1073/pnas.96.24.14088. [DOI] [PMC free article] [PubMed] [Google Scholar]
- Cam JA, Bu G. Modulation of beta-amyloid precursor protein trafficking and processing by the low density lipoprotein receptor family. Mol Neurodegener. 2006;1:8. doi: 10.1186/1750-1326-1-8. [DOI] [PMC free article] [PubMed] [Google Scholar]
- Cao X, Südhof TC. Dissection of amyloid-beta precursor protein-dependent transcriptional transactivation. J Biol Chem. 2004;279:24601–24611. doi: 10.1074/jbc.M402248200. [DOI] [PubMed] [Google Scholar]
- Gierahn TM, Loginov D, Love JC. Crossword: a fully automated algorithm for the segmentation and quality control of protein microarray images. J Proteome Res. 2014;13:362–371. doi: 10.1021/pr401167h. [DOI] [PMC free article] [PubMed] [Google Scholar]
- Han Q, Bradshaw EM, Nilsson B, Hafler DA, Love JC. Multidimensional analysis of the frequencies and rates of cytokine secretion from single cells by quantitative microengraving. Lab Chip. 2010;10:1391–1400. doi: 10.1039/b926849a. [DOI] [PMC free article] [PubMed] [Google Scholar]
- Hardy J, Selkoe DJ. The amyloid hypothesis of Alzheimer's disease: progress and problems on the road to therapeutics. Science. 2002;297:353–356. doi: 10.1126/science.1072994. [DOI] [PubMed] [Google Scholar]
- Hill K, Li Y, Bennett M, McKay M, Zhu X, Shern J, Torre E, Lah JJ, Levey AI, Kahn RA. Munc18 interacting proteins: ADP-ribosylation factor-dependent coat proteins that regulate the traffic of beta-Alzheimer's precursor protein. J Biol Chem. 2003;278:36032–36040. doi: 10.1074/jbc.M301632200. [DOI] [PubMed] [Google Scholar]
- Ho A, Südhof TC. Binding of F-spondin to amyloid-beta precursor protein: a candidate amyloid-beta precursor protein ligand that modulates amyloid-beta precursor protein cleavage. Proc Natl Acad Sci U S A. 2004;101:2548–2553. doi: 10.1073/pnas.0308655100. [DOI] [PMC free article] [PubMed] [Google Scholar]
- Hoe HS, Wessner D, Beffert U, Becker AG, Matsuoka Y, Rebeck GW. F-spondin interaction with the apolipoprotein E receptor ApoEr2 affects processing of amyloid precursor protein. Mol Cell Biol. 2005;25:9259–9268. doi: 10.1128/MCB.25.21.9259-9268.2005. [DOI] [PMC free article] [PubMed] [Google Scholar]
- Hoe HS, Tran TS, Matsuoka Y, Howell BW, Rebeck GW. DAB1 and Reelin effects on amyloid precursor protein and ApoE receptor 2 trafficking and processing. J Biol Chem. 2006;281:35176–35185. doi: 10.1074/jbc.M602162200. [DOI] [PubMed] [Google Scholar]
- Hoe HS, Lee KJ, Carney RS, Lee J, Markova A, Lee JY, Howell BW, Hyman BT, Pak DT, Bu G, Rebeck GW. Interaction of reelin with amyloid precursor protein promotes neurite outgrowth. J Neurosci. 2009;29:7459–7473. doi: 10.1523/JNEUROSCI.4872-08.2009. [DOI] [PMC free article] [PubMed] [Google Scholar]
- Homayouni R, Rice DS, Sheldon M, Curran T. Disabled-1 binds to the cytoplasmic domain of amyloid precursor-like protein 1. J Neurosci. 1999;19:7507–7515. doi: 10.1523/JNEUROSCI.19-17-07507.1999. [DOI] [PMC free article] [PubMed] [Google Scholar]
- Kamenetz F, Tomita T, Hsieh H, Seabrook G, Borchelt D, Iwatsubo T, Sisodia S, Malinow R. APP processing and synaptic function. Neuron. 2003;37:925–937. doi: 10.1016/S0896-6273(03)00124-7. [DOI] [PubMed] [Google Scholar]
- Laird FM, Cai H, Savonenko AV, Farah MH, He K, Melnikova T, Wen H, Chiang HC, Xu G, Koliatsos VE, Borchelt DR, Price DL, Lee HK, Wong PC. BACE1, a major determinant of selective vulnerability of the brain to amyloid-beta amyloidogenesis, is essential for cognitive, emotional, and synaptic functions. J Neurosci. 2005;25:11693–11709. doi: 10.1523/JNEUROSCI.2766-05.2005. [DOI] [PMC free article] [PubMed] [Google Scholar]
- Liu Y, Liu H, Sauvey C, Yao L, Zarnowska ED, Zhang SC. Directed differentiation of forebrain GABA interneurons from human pluripotent stem cells. Nat Protoc. 2013;8:1670–1679. doi: 10.1038/nprot.2013.106. [DOI] [PMC free article] [PubMed] [Google Scholar]
- Love JC, Ronan JL, Grotenbreg GM, van der Veen AG, Ploegh HL. A microengraving method for rapid selection of single cells producing antigen-specific antibodies. Nat Biotechnol. 2006;24:703–707. doi: 10.1038/nbt1210. [DOI] [PubMed] [Google Scholar]
- McLoughlin DM, Miller CC. The intracellular cytoplasmic domain of the Alzheimer's disease amyloid precursor protein interacts with phosphotyrosine-binding domain proteins in the yeast two-hybrid system. FEBS Lett. 1996;397:197–200. doi: 10.1016/S0014-5793(96)01128-3. [DOI] [PubMed] [Google Scholar]
- Mueller HT, Borg JP, Margolis B, Turner RS. Modulation of amyloid precursor protein metabolism by X11alpha/Mint-1. A deletion analysis of protein-protein interaction domains. J Biol Chem. 2000;275:39302–39306. doi: 10.1074/jbc.M008453200. [DOI] [PubMed] [Google Scholar]
- Muratore CR, Srikanth P, Callahan DG, Young-Pearse TL. Comparison and optimization of hiPSC forebrain cortical differentiation protocols. PLoS One. 2014a;9:e105807. doi: 10.1371/journal.pone.0105807. [DOI] [PMC free article] [PubMed] [Google Scholar]
- Muratore CR, Rice HC, Srikanth P, Callahan DG, Shin T, Benjamin LN, Walsh DM, Selkoe DJ, Young-Pearse TL. The familial Alzheimer's disease APPV717I mutation alters APP processing and Tau expression in iPSC-derived neurons. Hum Mol Genet. 2014b;23:3523–3536. doi: 10.1093/hmg/ddu064. [DOI] [PMC free article] [PubMed] [Google Scholar]
- Obregon D, Hou H, Deng J, Giunta B, Tian J, Darlington D, Shahaduzzaman M, Zhu Y, Mori T, Mattson MP, Tan J. Soluble amyloid precursor protein-alpha modulates beta-secretase activity and amyloid-beta generation. Nat Commun. 2012;3:777. doi: 10.1038/ncomms1781. [DOI] [PMC free article] [PubMed] [Google Scholar]
- Ogunniyi AO, Story CM, Papa E, Guillen E, Love JC. Screening individual hybridomas by microengraving to discover monoclonal antibodies. Nat Protoc. 2009;4:767–782. doi: 10.1038/nprot.2009.40. [DOI] [PMC free article] [PubMed] [Google Scholar]
- Osterfield M, Egelund R, Young LM, Flanagan JG. Interaction of amyloid precursor protein with contactins and NgCAM in the retinotectal system. Development. 2008;135:1189–1199. doi: 10.1242/dev.007401. [DOI] [PubMed] [Google Scholar]
- Rice HC, Townsend M, Bai J, Suth S, Cavanaugh W, Selkoe DJ, Young-Pearse TL. Pancortins interact with amyloid precursor protein and modulate cortical cell migration. Development. 2012;139:3986–3996. doi: 10.1242/dev.082909. [DOI] [PMC free article] [PubMed] [Google Scholar]
- Story CM, Papa E, Hu CC, Ronan JL, Herlihy K, Ploegh HL, Love JC. Profiling antibody responses by multiparametric analysis of primary B cells. Proc Natl Acad Sci U S A. 2008;105:17902–17907. doi: 10.1073/pnas.0805470105. [DOI] [PMC free article] [PubMed] [Google Scholar]
- Vassar R, Bennett BD, Babu-Khan S, Kahn S, Mendiaz EA, Denis P, Teplow DB, Ross S, Amarante P, Loeloff R, Luo Y, Fisher S, Fuller J, Edenson S, Lile J, Jarosinski MA, Biere AL, Curran E, Burgess T, Louis JC, et al. Beta-secretase cleavage of Alzheimer's amyloid precursor protein by the transmembrane aspartic protease BACE. Science. 1999;286:735–741. doi: 10.1126/science.286.5440.735. [DOI] [PubMed] [Google Scholar]
- Veeraraghavalu K, Zhang C, Zhang X, Tanzi RE, Sisodia SS. Age-dependent, non-cell-autonomous deposition of amyloid from synthesis of beta-amyloid by cells other than excitatory neurons. J Neurosci. 2014;34:3668–3673. doi: 10.1523/JNEUROSCI.5079-13.2014. [DOI] [PMC free article] [PubMed] [Google Scholar]
- Xia W, Zhang J, Kholodenko D, Citron M, Podlisny MB, Teplow DB, Haass C, Seubert P, Koo EH, Selkoe DJ. Enhanced production and oligomerization of the 42-residue amyloid beta-protein by Chinese hamster ovary cells stably expressing mutant presenilins. J Biol Chem. 1997;272:7977–7982. doi: 10.1074/jbc.272.12.7977. [DOI] [PubMed] [Google Scholar]
- Xiao Q, Gil SC, Yan P, Wang Y, Han S, Gonzales E, Perez R, Cirrito JR, Lee JM. Role of phosphatidylinositol clathrin assembly lymphoid-myeloid leukemia (PICALM) in intracellular amyloid precursor protein (APP) processing and amyloid plaque pathogenesis. J Biol Chem. 2012;287:21279–21289. doi: 10.1074/jbc.M111.338376. [DOI] [PMC free article] [PubMed] [Google Scholar]
- Young-Pearse TL, Bai J, Chang R, Zheng JB, LoTurco JJ, Selkoe DJ. A critical function for beta-amyloid precursor protein in neuronal migration revealed by in utero RNA interference. J Neurosci. 2007;27:14459–14469. doi: 10.1523/JNEUROSCI.4701-07.2007. [DOI] [PMC free article] [PubMed] [Google Scholar]
- Young-Pearse TL, Chen AC, Chang R, Marquez C, Selkoe DJ. Secreted APP regulates the function of full-length APP in neurite outgrowth through interaction with integrin beta1. Neural Dev. 2008;3:15. doi: 10.1186/1749-8104-3-15. [DOI] [PMC free article] [PubMed] [Google Scholar]
- Young-Pearse TL, Suth S, Luth ES, Sawa A, Selkoe DJ. Biochemical and functional interaction of disrupted-in-schizophrenia 1 and amyloid precursor protein regulates neuronal migration during mammalian cortical development. J Neurosci. 2010;30:10431–10440. doi: 10.1523/JNEUROSCI.1445-10.2010. [DOI] [PMC free article] [PubMed] [Google Scholar]
- Zambrano N, Minopoli G, de Candia P, Russo T. The Fe65 adaptor protein interacts through its PID1 domain with the transcription factor CP2/LSF/LBP1. J Biol Chem. 1998;273:20128–20133. doi: 10.1074/jbc.273.32.20128. [DOI] [PubMed] [Google Scholar]
- Zhao J, Paganini L, Mucke L, Gordon M, Refolo L, Carman M, Sinha S, Oltersdorf T, Lieberburg I, McConlogue L. Beta-secretase processing of the beta-amyloid precursor protein in transgenic mice is efficient in neurons but inefficient in astrocytes. J Biol Chem. 1996;271:31407–31411. doi: 10.1074/jbc.271.49.31407. [DOI] [PubMed] [Google Scholar]