

Abstract
Receptor organization and dynamics at the cell membrane are important factors of signal transduction regulation. Using super‐resolution microscopy and single‐particle tracking, we show how the negative coreceptor CD22 works with the cortical cytoskeleton in restraining BCR signalling. In naïve B cells, we found endogenous CD22 to be highly mobile and organized into nanodomains. The landscape of CD22 and its lateral diffusion were perturbed either in the absence of CD45 or when the CD22 lectin domain was mutated. To understand how a relatively low number of CD22 molecules can keep BCR signalling in check, we generated Brownian dynamic simulations and supported them with ex vivo experiments. This combined approach suggests that the inhibitory function of CD22 is influenced by its nanoscale organization and is ensured by its fast diffusion enabling a “global BCR surveillance” at the plasma membrane.
Keywords: B‐cell receptor signalling, glycoprotein CD45, membrane dynamics, siglec CD22, super‐resolution microscopy
Subject Categories: Immunology, Signal Transduction
Introduction
The B‐cell receptor (BCR) is essential for the development, survival and effector functions of B lymphocytes. In naïve B cells, the BCR complex comprises the surface‐bound immunoglobulin M (IgM) or IgD, and the non‐covalently associated Igα/β sheath, containing the immunoreceptor tyrosine‐based activation motifs (ITAM) responsible for intracellular signal transduction (Reth, 1989; Weiss & Littman, 1994; Kurosaki, 2002). Signalling through the BCR in vivo is triggered by cognate binding of antigen displayed on the surface of presenting cells, leading to the elevation of intracellular calcium levels and subsequent B‐cell activation to form antibody‐secreting plasma cells and long‐lasting memory cells (Rajewsky, 1996). In experimental systems in vitro, BCR signalling is commonly induced by receptor engagement using cross‐linking antibodies. More recently, actin cytoskeleton disruption alone has been shown to be sufficient to induce a robust BCR signalling, implying a fundamental role for the cytoskeleton network in the control of constitutive (tonic) BCR signalling (Treanor et al, 2010).
Strict regulation of BCR signalling is vital to maintain appropriate B‐cell responses to potentially pathogenic invaders while preventing the spurious activation associated with autoimmunity. There are a large family of inhibitory coreceptors classically known to downregulate signalling through the BCR; probably the best characterized of these is CD22 (Nitschke, 2005). The intracellular domain of CD22 contains three immune‐receptor tyrosine‐based inhibitory motifs (ITIMs), phosphorylation of which is enhanced after BCR cross‐linking leading to the direct recruitment of SH2‐domain‐containing phosphatase‐1 (SHP‐1) (Schulte et al, 1992; Leprince et al, 1993; Peaker & Neuberger, 1993; Doody et al, 1995), as well as the inositol phosphatase SHIP via the adaptors Grb2 and Shc (Poe et al, 2000; Otipoby et al, 2001). Moreover, it has been observed that CD22 can also form complexes with Syk and PLCγ1 (Law et al, 1996). This suggests that CD22 is able to transmit both negative and positive regulatory signals, although this multivalent activity remains debatable. The global inhibition of phosphatase activity by treatment with pervanadate results in an increase in BCR‐dependent phosphorylation events, suggesting that phosphatases counterbalance the effects of activating kinases and participate in constitutive signalling through the BCR (Cyster & Goodnow, 1995; Wienands et al, 1996). In line with this, B cells isolated from CD22‐deficient mice exhibit enhanced calcium signalling following BCR cross‐linking, providing a potential explanation for the spontaneous autoimmunity displayed by these mice (O'Keefe et al, 1996, 1999; Otipoby et al, 1996; Sato et al, 1996; Nitschke et al, 1997). The extracellular domain of CD22 contains seven Ig‐like domains, the N‐terminal domain of which is responsible for the specific recognition of sialic acid—abundantly displayed on many glycoproteins (Powell et al, 1993; van der Merwe et al, 1996). It is generally accepted that the ligand‐binding site of CD22 is usually masked by sialic acid expressed in cis on resting B cells (Razi & Varki, 1998; Jin et al, 2002; Kelm et al, 2002), but it can be unmasked when the ligand is presented in trans by neighbouring cells (Lanoue et al, 2002; Danzer et al, 2003; Collins et al, 2004). Despite several studies on the matter (Hanasaki et al, 1995; Adachi et al, 2012), the identity of the physiological ligand for the sialic acid‐binding domain of CD22 remains unclear. Reduced calcium signalling in response to BCR cross‐linking is seen when B cells are either deficient in the enzyme responsible for generating sialylated ligands (ST6GalI) (Hennet et al, 1998; Collins et al, 2002, 2006; Grewal et al, 2006) or express CD22 with a mutated lectin domain (Müller et al, 2013). These findings suggest that the binding of sialic acid can modulate the capacity of CD22 to inhibit BCR signalling (Poe et al, 2004; Jellusova & Nitschke, 2012); however, the molecular mechanisms that link CD22 sialic acid‐binding activity to its inhibitory role are not yet known.
Visualizing the molecular landscape of receptors on the cell surface has provided new insights into the mechanisms by which the functions of these receptors can be regulated. In particular, small clusters of FcεRI and Lyn have been found on the membranes of unstimulated mast cells (Wilson et al, 2000) and it has been suggested that the BCR (Schamel & Reth, 2000) and TCR exist in oligomeric structures (Schamel et al, 2005). In line with the concept of “protein islands”(Lillemeier et al, 2006, 2010), pre‐existing clusters of BCRs and CD19 have been visualized on the surface of primary naïve B cells (Mattila et al, 2013). Somewhat surprisingly, BCR signalling does not require a global reorganization of receptors, but depends instead on the lateral mobility and compartmentalization on the nanoscale of both the BCR and the positive coreceptor CD19. Oligomer formation can be promoted on the Cμ4 domain of the BCR (Tolar et al, 2009). The concept of lateral diffusion and receptor proximity might explain why fluorescence resonance energy transfer failed to detect interaction between Igα and Igβ (Tolar et al, 2005).
Much of our current understanding of the role of CD22 in dampening BCR signalling is based on biochemical analyses, and little is known about the dynamics and organization of this receptor in the membrane of primary naïve B cells. Here, we demonstrate a joint action between CD22 and the actin cytoskeleton to restrain BCR signalling. By super‐resolution microscopy, we show that endogenous CD22 exists in preformed nanoclusters on the membrane of primary naïve B cells. We found that CD22 organization is dependent on the ability of CD22 to bind sialic acid and is influenced by the presence of the glycoprotein CD45. Moreover, by single‐particle tracking and the combined use of computational and transgenic models, we suggest that the activity of the siglec CD22 in restraining BCR signalling is linked to its membrane dynamics. These findings not only broaden our perspective of CD22 as a crucial regulator of B‐cell activation, but also highlight the regulatory role of the sialylation network in controlling both ligand‐dependent activation and “tonic” BCR signalling that is necessary for B‐cell survival.
Results
BCR signalling triggered by cytoskeleton disruption is restrained by CD22
In resting naïve B cells, disruption of the actin cytoskeleton triggers BCR‐mediated signalling events such as intracellular calcium mobilization and activation of ERK and Akt in a manner reminiscent of antigen‐induced B‐cell activation (Treanor et al, 2010). However, the early molecular events initiated by this mode of BCR signalling and how these events might also be regulated by the organization and dynamics of inhibitory coreceptors in the B‐cell membrane have not yet been explored.
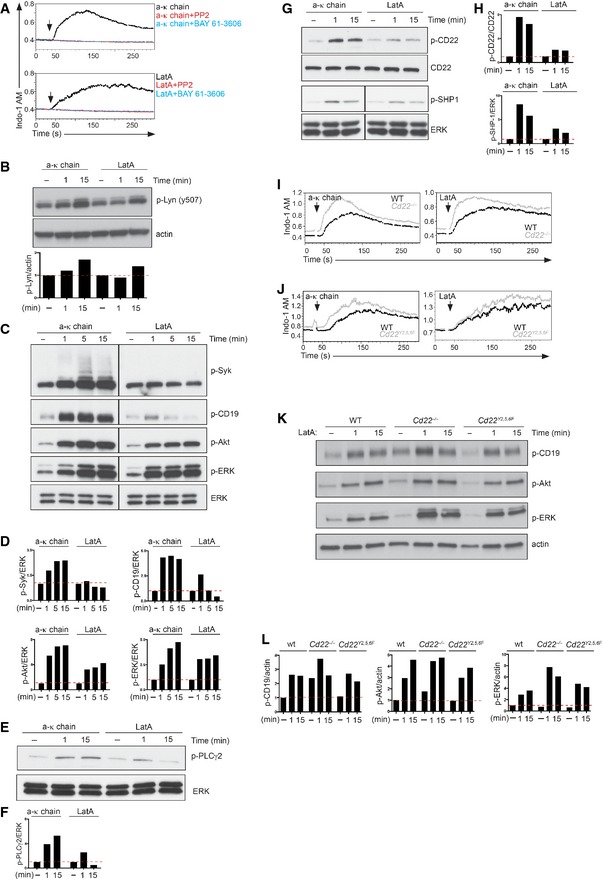
Initially, to characterize the early molecular requirements for BCR‐mediated signalling in response to actin cytoskeleton disruption, primary naïve B cells were treated with the Src‐family kinase (SFK) inhibitor PP2 and the Syk‐inhibitor BAY 61–3606. We observed that when either SFK or Syk activity was blocked, B cells did not exhibit an increase in cytoplasmic calcium following the inhibition of actin polymerization by latrunculin A (LatA) (Fig 1A). This requirement for SFK and Syk is in line with that observed for BCR signalling in response to a cross‐linking antibody (Fig 1A). To further analyse proximal signalling at the level of SFKs, we used Western blotting to assess the phosphorylation status of the C‐terminal inhibitory tyrosine of Lyn (Y507) upon stimulation with anti‐kappa antibody and LatA. We observed that Lyn phosphorylation was increased after 1 min of anti‐kappa stimulation and was higher still at 15 min, whereas a similar increase was detected only at 15 min upon cytoskeleton disruption (Fig 1B).
Figure 1. CD22 restrains BCR and CD19 cytoskeleton‐dependent signalling.
-
AWild‐type primary B cells were treated with 5 μg/ml of anti‐kappa antibody (a‐k chain, top) or 1 μM latrunculin A (LatA, bottom). Intracellular calcium flux was measured by flow cytometry in the presence of 10 μM Src‐inhibitor (PP2), 1 μM Syk‐inhibitor (BAY 61–3606) or vehicle control.
-
BWild‐type primary B cells were treated with vehicle control (−), 5 μg/ml anti‐kappa antibody or 1 μM LatA for the indicated time. Cells were lysed and analysed by SDS–PAGE followed by immunoblotting with phospho‐Lyn (Y507) and actin as a loading control. The intensity of phosphorylated proteins, normalized to actin, was referred to the respective unstimulated sample, set as 1.
-
C, DWild‐type primary B cells were treated with vehicle control (−), 5 μg/ml anti‐kappa antibody or 1 μM LatA for the indicated time. Cells were lysed and analysed by SDS–PAGE followed by immunoblotting with phospho‐Syk (p‐Syk), phospho‐CD19 (p‐CD19), phospho‐Akt (p‐Akt), phospho‐ERK (p‐ERK) and total ERK as a loading control. The intensity of phosphorylated proteins, normalized to ERK, was referred to the respective unstimulated sample, set as 1.
-
E, FWild‐type primary B cells were treated with vehicle control (−), 5 μg/ml anti‐kappa antibody or 1 μM LatA for the indicated time. Cells were lysed and analysed by SDS–PAGE followed by immunoblotting with phospho‐PLCγ2 (p‐PLCγ2) and total ERK as a loading control. The intensity of phosphorylated proteins, normalized to ERK, was referred to the respective unstimulated sample, set as 1.
-
G, HWild‐type primary B cells were treated with vehicle control (−), 5 μg/ml anti‐kappa antibody or 1 μM LatA for the indicated time. Cells were lysed and analysed by SDS–PAGE followed by immunoblotting with phospho‐CD22 (p‐CD22), phospho‐SHP1 (p‐SHP1), and CD22 or total ERK as loading controls. The intensity of phosphorylated proteins, normalized to CD22 or ERK, was referred to the respective unstimulated sample, set as 1.
-
IWild‐type and Cd22 −/− primary B cells were treated with 5 μg/ml anti‐kappa antibody or 1 μM LatA, and intracellular calcium flux was measured by flow cytometry.
-
JWild‐type and Cd22 Y2,5,6F primary B cells were treated with 5 μg/ml anti‐kappa antibody or 1 μM LatA, and intracellular calcium flux was measured by flow cytometry.
-
K, LWild‐type, Cd22 −/− and Cd22 Y2,5,6F primary B cells were treated with vehicle control (−) or 1 μM LatA for the indicated time. Cells were lysed and analysed by SDS–PAGE followed by immunoblotting with phospho‐CD19 (p‐CD19), phospho‐Akt (p‐Akt), phospho‐ERK (p‐ERK) and actin as a loading control. The intensity of phosphorylated proteins, normalized to actin, was referred to the unstimulated sample of the wild‐type cells, set as 1.
We therefore went on to investigate whether the propagation of BCR signalling from Syk in response to LatA results in the activation of the downstream pathway in the same way as it does following BCR cross‐linking. To do this, the phosphorylation kinetics of signalling molecules including Syk, CD19 and PLCγ2 were assessed by Western blotting after stimulation of primary naïve B cells with either BCR cross‐linking antibody or LatA. We observed that for B cells stimulated with anti‐kappa, phosphorylation peaked at 5 min for Syk and CD19 and at 15 min for PLCγ2 (Fig 1C–F), while a slightly faster (1 min) phosphorylation was observed after treating B cells with LatA. Although lower phosphorylation levels of Syk, CD19 and PLCγ2 were observed in the cells treated with LatA, it was clear from the phosphorylation of Akt and ERK that the intracellular signal was as effectively transmitted by this treatment as it was in response to BCR cross‐linking antibody (Fig 1C and D).
In response to antigen stimulation, the inhibitory coreceptor CD22 plays a critical role in regulating the extent of B‐cell activation through the recruitment of the SHP‐1 phosphatase (Doody et al, 1995). To investigate whether CD22 plays a similar role in controlling BCR‐mediated signalling following cytoskeleton disruption, we examined the extent of CD22 and SHP‐1 activation in primary naïve B cells in response to LatA. We observed that both CD22 and SHP‐1 were rapidly phosphorylated after treatment with LatA (Fig 1G and H). The activation kinetics of CD22 and SHP‐1 resembled those observed in response to BCR cross‐linking, supporting the concept that this inhibitory pathway participates in the regulation of B‐cell tonic signalling.
To formally establish this, we took advantage of mouse models that either completely lack CD22 expression (Cd22 −/− ) or which express a mutated form of CD22 where the three functional tyrosines in the ITIM motifs of CD22 are mutated (tyrosines 2, 5 and 6; Müller et al, 2013). The extent of B‐cell activation was measured in primary B cells obtained from these mice following stimulation with either anti‐kappa or LatA. We noted a higher level of BCR signalling in Cd22 −/− B cells, as judged by higher intracellular calcium levels either at the steady‐state or in response to stimuli, and increased CD19, Akt and ERK phosphorylation (Fig 1I, K and L). These results are in line with an inhibitory role for CD22 not only in ligand‐dependent BCR activation but also in tonic signalling. Similar results were obtained in B cells expressing the Cd22 Y2,5,6F variant (Fig 1J–L). In line with these observations, B cells expressing a different variant of CD22 in which only 2 of the 3 tyrosines are mutated (Cd22 Y5,6F; Müller et al, 2013) also exhibit an altered BCR signalling in response to LatA or BCR engagement (Fig EV1A–C).
Figure EV1. BCR signalling in Cd22 Y5,6F B cells upon cytoskeleton disruption and ligand‐dependent stimulation.

-
AWild‐type and Cd22 Y5,6F primary B cells were treated with 5 μg/ml anti‐kappa or 1 μM LatA and intracellular calcium was measured by flow cytometry.
-
B, CWild‐type, Cd22 −/− and Cd22 Y5,6F primary B cells were treated with vehicle control (−) or 1 μM LatA for the indicated times. Cells were lysed and analysed by SDS–PAGE followed by immunoblotting with phospho‐CD19 (p‐CD19), phospho‐Akt (p‐Akt), phospho‐ERK (p‐ERK) and actin or total ERK as loading controls. The intensity of phosphorylated proteins, normalized to actin or ERK, was referred to the unstimulated sample of the wild‐type cells, set as 1.
Source data are available online for this figure.
Taken together, it appears that the molecular events of BCR signalling are similar, regardless of whether the activation is triggered by BCR cross‐linking or by cytoskeleton disruption. However, it is an important distinction that BCR cross‐linking appears to be more effective at inducing early tyrosine phosphorylation than cytoskeleton disruption stimulation. Furthermore, we established that the joint action of CD22 and the cortical cytoskeleton negatively regulates B‐cell activation.
CD22 is highly clustered on the surface of resting primary B cells
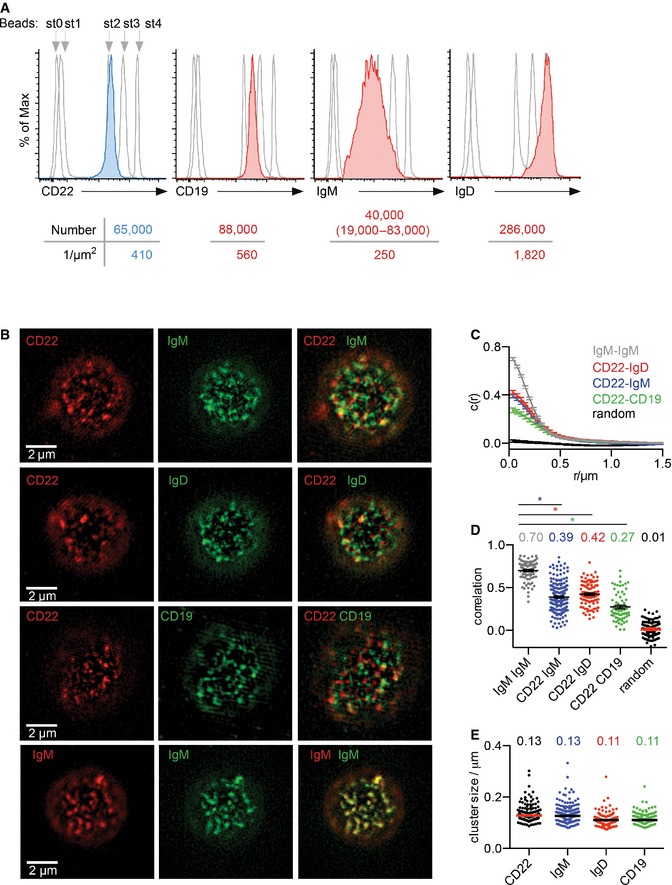
Previously, it has been shown that the organization of receptors in the B‐cell membrane plays an important role in mediating BCR signalling and subsequent cell activation (Mattila et al, 2013). In view of this, and of the participation of inhibitory players in BCR signalling after cytoskeleton disruption, we investigated the molecular organization of CD22 in the B‐cell membrane. Firstly, we used a bead‐based counting assay to establish the number of CD22 molecules present on the surface of naïve splenic B cells (Mattila et al, 2013). This approach revealed that there are around 65,000 molecules of CD22 on the surface of B cells, which translates into a density of 410 molecules per μm2 (Fig 2A). The expression of CD22 is therefore comparable to that of CD19 and IgM, which are expressed at 88,000 and 40,000 molecules per cell, respectively, but considerably lower than IgD, which is expressed at 286,000 molecules per cell (Fig 2A). Importantly, the measured levels of expression led us to estimate that these four transmembrane molecules occupy more than 10% of the B‐cell surface area.
Figure 2. CD22 density and colocalization on the surface of primary B cells.
-
ADetermining the number and density of CD22, CD19, IgM and IgD on the surface of wild‐type primary B cells. Cells were stained with PE‐conjugated antibody against CD22 (blue profile), CD19 (red profile), IgM (red profile) or IgD (red profile) and their fluorescence profiles compared to those of standard beads (grey profiles), which each possess a well‐defined number of binding sites (st0 = blank, st1–st4 = increasing number of binding sites) against the primary antibody. For IgM, where the range of expression is large, the low and high 25 percentiles were calculated as in Mattila et al (2013) and shown in parentheses. Data are representative of three independent experiments.
-
B–EDual‐colour SIM analysis of CD22, IgM, IgD and CD19. Wild‐type primary B cells were fixed, stained with Atto633‐ or 488‐conjugated antibody against CD22, IgM or IgD and Alexa 647‐conjugated antibody against CD19 and settled onto non‐stimulatory coverslips. Cells were then embedded in agarose, imaged with SIM and analysed. (B) SIM images of CD22, IgM, IgD and CD19. (C) Cross‐correlation function. (D) Pearson correlation coefficient. (E) Cluster size calculated from autocorrelation analysis. Bars and numbers indicate the median. Data are pooled from three independent experiments. *P < 0.0001 (Student's t‐test).
We then simultaneously visualized CD22 with IgM, IgD or CD19 in primary B cells using dual‐colour structured illumination microscopy (SIM) (Gustafsson et al, 2008). This novel technology surpasses the resolution limit of far‐field light microscopy by using spatially varying illumination. It allows the organization of membrane receptors on the cell surface to be visualized with a higher resolving power and better contrast than, for example confocal microscopy. To this end, primary B cells were first fixed, simultaneously labelled for CD22 with IgM, IgD or CD19 and then settled on coverslips for imaging as described in the methods. Visual inspection of the dual‐colour images revealed that in resting B cells, IgM, IgD, CD22 and CD19 exist in preformed but distinct islands, which sometimes colocalized (Fig 2B). To quantify the extent of colocalization between the different islands, we used cross‐correlation analysis (Sengupta et al, 2011). In our analysis, a maximum correlation score of 1 is expected for perfect colocalization, while a score of 0 or a slightly negative value indicates a random position between the islands (Fig 2C and D). The correlation value observed for CD22 with either IgM or IgD was of 0.39 or 0.42, respectively, indicating that they are not perfectly overlapping, but instead have partial colocalization. Indeed, a much higher value of 0.70 was observed when an IgM/IgM staining was quantified as a positive control. A lower value of 0.27 was measured for CD22 and CD19, suggesting that these two coreceptors are colocalizing to a lesser degree (Fig 2C and D). Together, these data indicate that IgM, IgD, CD22 and CD19 all exist in discrete islands. In particular, CD22 appears to be in a closer association with BCR molecules than with CD19.
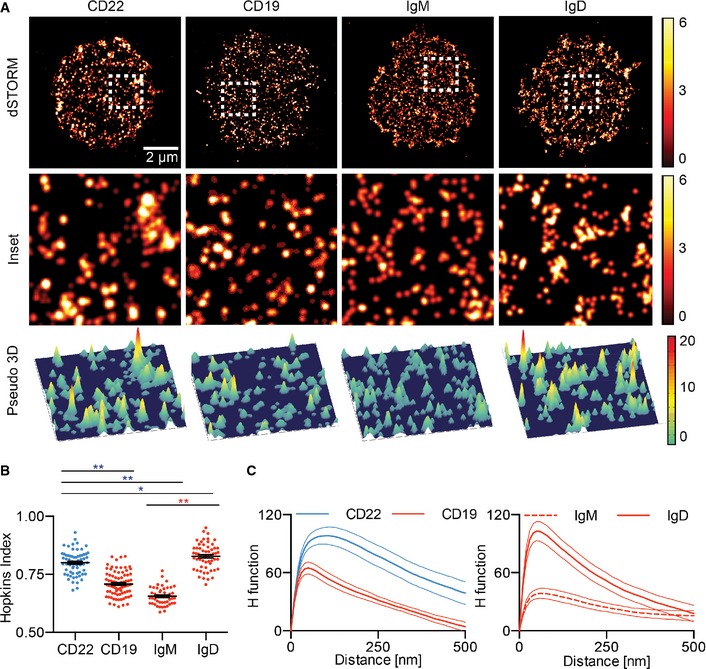
We next wanted to learn more about the organization of CD22, IgM, IgD and CD19 at the B‐cell surface. Our initial attempts to derive radius values of the different receptor islands from our SIM images were limited by the resolution (Fig 2E). To achieve higher localization precision, we examined the organization of CD22 in primary B cells using direct stochastic optical reconstruction microscopy (dSTORM), which achieves a localization precision of 10–30 nm (Heilemann et al, 2008). Primary B cells were labelled with an antibody against CD22 conjugated with the Alexa 647 fluorophore and settled under non‐stimulatory conditions on anti‐major histocompatibility complex class II (MHCII)‐coated coverslips. After fixation, these cells were imaged using total internal reflection fluorescence microscopy (TIRFM). The premise of dSTORM relies on transferring all the Alexa 647 fluorophores into a metastable “dark” state, from which only small subsets are stochastically reactivated by continuous low‐intensity illumination, imaged and localized with 10‐ to 30‐nm precision over 3,000–8,000 cycles. The rendered 2D images revealed that in resting B cells, CD22 exists in preformed nanoclusters, similar to those observed for CD19, IgD and IgM (Fig 3A). To quantify the extent to which CD22 tends to cluster, we used two approaches, one using the Hopkins index and the other using the H function (Zhang et al, 2006). The Hopkins index scores the extent to which the distribution of receptors on the cell surface is completely random (score of 0.5) or completely non‐random (score of 1.0). We found that CD22 had a Hopkins index of 0.81, indicating that CD22 is not randomly distributed in the resting B‐cell membrane. Interestingly, the Hopkins index for CD22 is similar to that observed for IgD, suggesting that this inhibitory coreceptor, like IgD, is more likely to exist in a clustered state than either IgM or CD19 (Fig 3B). Secondly, we used the H function derived from Ripley's K function which quantifies the extent of receptor clustering by examining the number of molecules found within increasing distances of each individual molecule compared with that predicted for a random distribution. The position of the peak of the H function is the readout for the approximate size of an average cluster and the height of the peak is an estimate for the average density of molecules in the cluster. In this case, we found that CD22 clusters have a radius of aggregation of around 100 nm (Fig 3C). This indicates that, similar to IgD, IgM and CD19, CD22 is predominantly located in preformed nanoscale clusters in the resting B‐cell membrane. Thus, it appears that, as a general rule, cell surface receptors that play an important role in BCR signalling are organized into nanoclusters within the B‐cell membrane.
Figure 3. CD22 is highly clustered on the surface of resting B cells.
-
A2D (top and middle) and pseudo‐3D (bottom) dSTORM images were reconstructed from single‐molecule localizations. The white dashed square is shown in magnification (middle) and pseudo‐3D (bottom).
-
B, CQuantification of the distribution of CD22, CD19, IgM and IgD with H function and Hopkins index. Error bars (Hopkins index) and thin lines (H function) denote mean ± SEM. Data are pooled from at least three experiments per receptor. *P < 0.001, **P < 0.0001 (Student's t‐test).
The rapid diffusion of CD22 provides a means of attenuating BCR signalling
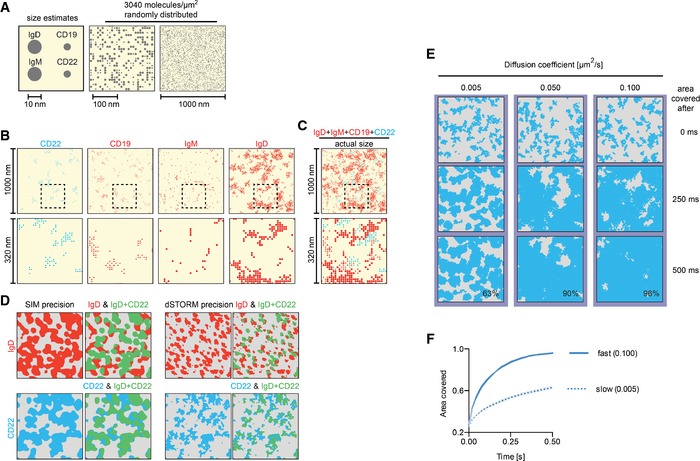
To incrementally integrate our findings into a conceptual model, we started by building a graphic representation. To this end, we considered the size and abundance of the CD22, IgM, IgD and CD19 receptors. Based on their structural data (Harris et al, 1998), we considered the lateral dimension of a surface‐bound IgM or IgD molecule to be in the order of 10–15 nm, and those of CD19 and CD22 to be close to 5 nm (Fig 4A). We randomly distributed these four receptor molecules, assuming no overlap, over an area of 1 μm2, taking into consideration the experimentally determined abundance of the receptors (Fig 4A). We found that CD22, CD19, IgM and IgD together amounted to a density of approximately 3,040 molecules per μm2. This means that they jointly cover 10–15% of the total surface area, conveying an immediate impression of receptor crowding. Given that each receptor exhibits a characteristic level of clustering, this parameter was independently introduced for each (Fig 4B) using the experimentally determined degree of clustering. Notably, the inclusion of all receptors in one image immediately conveyed how much the inhibitory nanoclusters (blue, CD22) were outnumbered by the activatory molecules (red, IgD, IgM, CD19) (Fig 4C).
Figure 4. CD22 compensates numerical disadvantage through high diffusion dynamics.
-
A–CGraphic representation of the surface densities and the nanoscale distributions of CD22, CD19, IgM and IgD. (A) Size estimates for IgD/M and CD19/CD22 (left) and random distribution (centre and right) of the number of molecules measured in Figure 2A. (B) Surface distribution of the actual numbers of CD22, CD19, IgM and IgD, taking into consideration their clustering tendency. Full 1 μm × 1 μm view (top) and zoom into black dashed square (bottom). (C) Integration of the distributions of CD22, CD19, IgM and IgD (from Figure 4B) into one graph. Full 1 μm × 1 μm view (top) and zoom into black dashed square (bottom).
-
D–FIn silico model and simulation of area covered by CD22 nanocluster diffusion. (D) SIM and dSTORM precision images of IgD (top) and CD22 (bottom) to show every localization of IgD (in red) and CD22 (in blue). Images were then overlaid to indicate areas (green) where CD22 (blue) overlaps with IgD (red), highlighting the areas where IgD would be overlapping with CD22 (top right) and where CD22 would be overlapping with IgD (bottom right). (E) Computer simulation of area covered by diffusing CD22 nanoclusters. CD22 nanoclusters were distributed in a simulated 1 μm × 1 μm area according to clustering parameters from dSTORM. Nanoclusters were then allowed to move with the indicated lateral mobilities over time. The total area covered (in per cent) by CD22 is indicated when reaching 500 ms. (F) Area covered by CD22 nanoclusters diffusing with 0.005 μm2/s (slow) or 0.100 μm2/s (fast).
At this point, we wanted to generate a more realistic representation of receptor clusters so we converted the individual molecules into distinct areas. To do this, we firstly used our SIM data to link neighbouring molecules of CD22 and IgD such that we obtained distinct clusters that overlapped to the same extent as observed experimentally (Fig 2), and we then introduced the dSTORM resolution to add precision to the localization. The overlay image highlights the areas where IgD overlaps with CD22 or where CD22 overlaps with IgD (Fig 4D). Given that regulation of BCR signalling is likely to require a close proximity of the two receptors, the relatively high proportion of BCR that is not overlapping CD22 raises the question of how CD22 can perform its inhibitory role.
To address this question, we developed a dynamic in silico model derived from our experimental observations to predict the area surveyed by CD22 nanoclusters according to their mobility. CD22 nanoclusters are modelled on the dSTORM data as before and diffuse at an assigned speed. This speed was chosen to be within the observed physiological range of membrane receptors, that is between 0.005 μm2/s (IgD) and 0.100 μm2/s (MHCII) (Treanor et al, 2010); in contrast, lipids diffuse with speeds up to 0.6 μm2/s (Schütz et al, 2000). We found that when CD22 was assigned a speed of 0.05 μm2/s, then 90% of the cell membrane area was covered within 500 ms (Fig 4E; Movie EV1). However, when the diffusion coefficient was set to 0.005 μm2/s, it took five times longer to achieve a similar coverage (Fig 4E and F). This model demonstrates that a high lateral mobility of CD22 nanoclusters could provide a means by which CD22 might come into contact with many BCR nanoclusters and thereby regulate signalling.
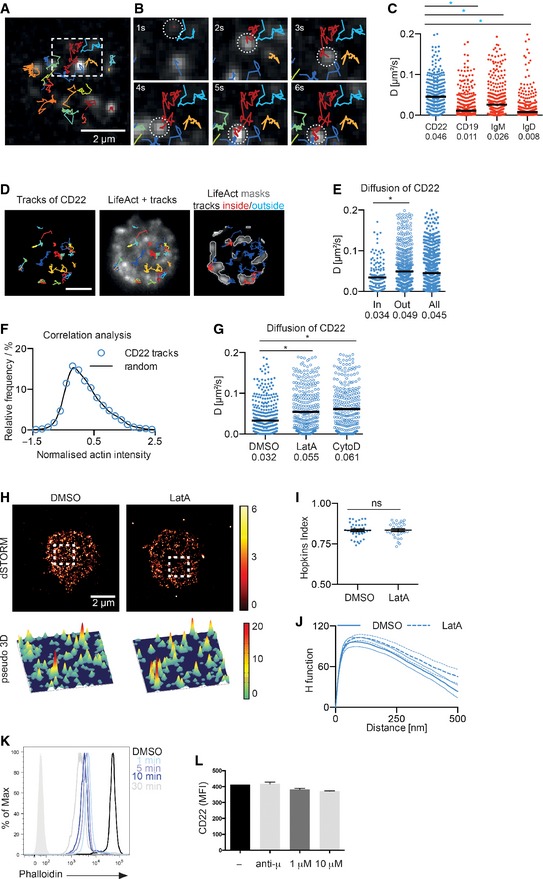
Given the predictions from our in silico model, we moved on to examine experimentally the rate at which CD22 diffuses in the membrane of resting primary B cells using single‐particle tracking (SPT) (Treanor et al, 2010). Naïve B cells were stained with limited amounts of fluorescently labelled anti‐CD22, anti‐IgM, anti‐IgD and anti‐CD19 Fab fragment and visualized by TIRFM under non‐stimulatory conditions, as described previously (Mattila et al, 2013). The resulting analysis of single‐particle tracks demonstrated that CD22 is indeed highly mobile and shows a broad range of diffusion coefficients with a median of 0.046 μm2/s (Fig 5A–C; Movie EV2). This observed mobility is comparable with the 0.05 μm2/s predicted from our model to allow coverage of more than 90% of the B‐cell surface in 500 ms (Fig 4E). Interestingly, the diffusion of CD22 is much faster than that recorded for other receptors in the B‐cell membrane, namely IgD (0.008 μm2/s), IgM (0.026 μm2/s) and CD19 (0.011 μm2/s) (Fig 5C; Mattila et al, 2013). While the rapid diffusion of CD22 might appear surprising when considering the size of the observed nanoclusters, it is clear from our model system that this provides an elegant mechanism for CD22 to achieve efficient attenuation of BCR signalling.
Figure 5. The cortical actin cytoskeleton does not regulate CD22 organization.
-
A–CSingle‐particle tracking of CD22, CD19, IgM and IgD. Wild‐type primary B cells were stained with Atto633‐conjugated Fab fragments against CD22, CD19, IgM and IgD, settled onto non‐stimulatory coverslips and imaged. Single‐particle trajectories were then analysed. (A) Trajectories of CD22 showing diffusion of single particles over 6 s. (B) Magnified region from (A) traces one particle (current position indicated with white dashed circle, trajectory in red) over 6 s. (C) Diffusion coefficients of 300 representative CD22, CD19, IgM and IgD particles. Bars and numbers indicate the median. Data are pooled from at least three experiments per receptor. *P < 0.0001 (Student's t‐test).
-
D–FSingle‐particle tracking of CD22 in primary LifeAct‐GFP‐expressing B cells. Cells were labelled with Atto633‐conjugated Fab fragments against CD22, settled onto non‐stimulatory coverslips and imaged. Single‐particle trajectories were then analysed. (D) Trajectories of CD22 (left) showing diffusion of single particles over 6 s and overlaid with a still image of F‐actin intensity (middle). Areas of high F‐actin density (grey line boundaries) with trajectories of CD22 classified as being inside (red) and outside (blue) of F‐actin‐rich areas. (E) Diffusion coefficients of CD22 particles from (D) whose trajectories were classed as inside (in) or outside (out) of actin‐rich areas. The overall diffusion is also shown (all). Bars and numbers indicate the median. Data are pooled from two different experiments. *P < 0.0001 (Student's t‐test). (F) Correlation analysis. For each position in each CD22 track, the actin intensity was measured and compared to the same number of random positions on the same cell. Values from different cells were normalized so that the average intensity in F‐actin‐rich regions corresponds to a value of one and the average for F‐actin low regions to zero.
-
GWild‐type primary B cells were labelled with Atto633‐conjugated Fab fragments against CD22, settled onto non‐stimulatory coverslips and treated with vehicle control (DMSO) or 1 μM LatA. Single‐particle trajectories were then analysed. Bars and numbers indicate the median. Data are pooled from two experiments. *P < 0.0001 (Student's t‐test).
-
H–JWild‐type primary B cells were stained with Alexa 647‐conjugated antibody against CD22 and settled onto non‐stimulatory coverslips. Cells were then fixed, imaged with dSTORM and analysed. (H) 2D (top) and pseudo‐3D (bottom) dSTORM images were reconstructed from single‐molecule localizations. The white dashed square is shown in pseudo‐3D (bottom). (I, J) Quantification of the distribution of CD22 Hopkins index and with H function. Error bars (Hopkins index) and thin lines (H function) denote mean ± SEM. Data are pooled from two different experiments.
-
KFlow cytometric analysis of F‐actin by intracellular phalloidin staining of unstimulated or LatA‐treated wild‐type B cells for the indicated length of time. Data represent two independent experiments.
-
LFlow cytometric analysis of CD22 surface expression in resting or stimulated B cells with 10 μg/ml anti‐μ chain (Jackson ImmunoResearch), 1 μM or 10 μM LatA for 5 and 15 min. Error bars denote mean ± SD. Data are from two independent experiments.
CD22 mobility but not organization is regulated by the actin cytoskeleton
We have shown previously that the underlying B‐cell actin cytoskeleton regulates BCR mobility (Treanor et al, 2010). In view of this, we sought to test a potential role for the actin cytoskeleton in the regulation of CD22 diffusion and organization in the B‐cell membrane.
The mobility of CD22 relative to the density of underlying actin was examined using dual‐view SPT in primary B cells expressing the F‐actin‐binding probe LifeAct‐GFP (Riedl et al, 2008). The fluorescent signals arriving from single particles of CD22 and LifeAct‐GFP were simultaneously recorded using an optical splitter, and the latter used to generate masks with high LifeAct signal being assigned as “actin rich”. The CD22 tracks observed within the cell body were then classified as “inside” or “outside” actin‐rich areas according to the region in which the receptor spends most time (Fig 5D). Using this approach, we observed that CD22 mobility was lower inside actin‐rich areas, exhibiting a median diffusion coefficient of 0.034 μm2/s compared with 0.049 μm2/s outside. We also observed that the CD22 particle tracks were located outside of actin‐rich areas approximately 70% of the time (Fig 5E). We went on to carry out a more detailed analysis at the pixel level to determine whether CD22 is preferentially located in areas with higher actin density. To do this, the intensity of LifeAct‐GFP in the pixels containing single‐particle tracks of CD22 was recorded and compared with the same number of random positions on the cell (Fig 5F). Interestingly, the distribution of LifeAct‐GFP intensities in pixels visited by CD22 tracks closely resembled the distribution of the random actin intensities observed across the cell. The surprising lack of accumulation of CD22 in actin‐rich areas may be due in part to the highly dynamic cortical actin cytoskeleton in B cells, but suggests that CD22 is slowed down, rather than trapped when moving through actin‐rich areas.
To further probe the influence of the actin cytoskeleton on CD22 mobility, primary B cells were treated with either 1 μM LatA or 10 μM cytochalsin D (CytoD) to trigger cytoskeleton reorganization and the dynamics of CD22 were recorded using SPT. We observed that the median diffusion coefficient of CD22 was almost twofold higher after treatment with either LatA or CytoD (0.055 μm2/s and 0.061 μm2/s, respectively) compared with the vehicle control (DMSO, 0.032 μm2/s) (Fig 5G). It is important to note that these results were recorded at a later time point (10–15 min) to allow administration of the drug, which consistently results in a lower diffusion coefficient compared to measurements recorded at earlier time points (0.046 μm2/s to 0.032 μm2/s, Fig 5C). We saw, however, the same effect for the control and drug‐treated cells (data not shown). The dynamic behaviour of CD22 after activation induced by cytoskeleton reorganization is in contrast to that observed for the positive coreceptor CD19, but is in line with that shown for the BCR (Mattila et al, 2013). The impact of cytoskeleton disruption on the dynamic behaviour of CD22 raises a question: Does this mode of activation trigger a corresponding global reorganization of CD22? To answer this, we used dSTORM to visualize the distribution of CD22 in primary B cells following treatment with LatA. Visual inspection of the resulting dSTORM images revealed that cytoskeleton disruption does not have an effect on the nanoscale distribution of CD22 (Fig 5H). In line with this, the Hopkins index of CD22 is not significantly altered from the vehicle control following LatA treatment (0.81 and 0.82, respectively) (Fig 5I). However, in response to cytoskeleton disruption, the height of the H function peak is greater compared to the untreated sample, indicating that the cluster density slightly increases, although the average radius of CD22 nanoclusters remains unchanged at around 90–100 nm (Fig 5J). Our LatA stimulation spans 1 to 20 min, a sufficient time window to observe a substantial disruption of the actin network (Fig 5K) but without altering CD22 surface expression (Fig 5L; Sherbina et al, 1996) or B‐cell morphology (Treanor et al, 2010). This demonstrates that the global organization of CD22 nanoclusters is not dramatically affected following reorganization of the actin cytoskeleton and is in line with previous observations for the BCR and CD19 (Mattila et al, 2013).
In all, the results indicate that the cortical actin cytoskeleton can influence the dynamic behaviour, but not the global organization of CD22 in the‐B cell membrane.
CD22 dynamics and organization in the B‐cell membrane are regulated by the glycoprotein CD45
As the actin cytoskeleton does not appear to be primarily responsible for the global organization of CD22, we moved on to consider a role for the lectin activity of CD22 in shaping its behaviour in the B‐cell membrane. CD22 binds specifically to α2,6‐Sia, but as this interaction has the characteristic low affinity of a lectin–ligand interaction (Crocker et al, 1999), it seems reasonable to expect that the density of this ligand on the B cell surface might direct the dynamics of CD22. α2,6‐Sia is expressed by a number of glycoproteins in B cells, and the protein tyrosine phosphatase CD45 in particular has emerged as a putative and abundant binding partner of CD22 (Stamenkovic et al, 1991; Cyster & Goodnow, 1997).
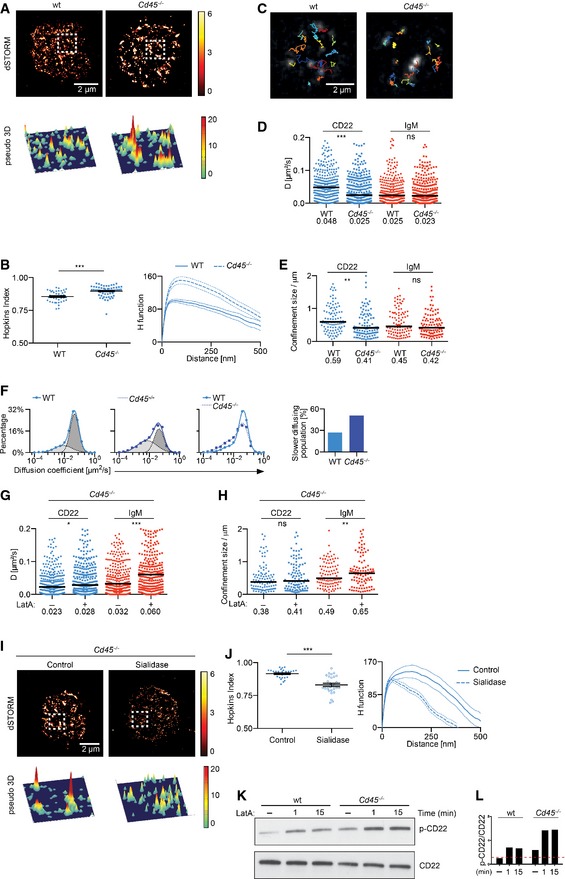
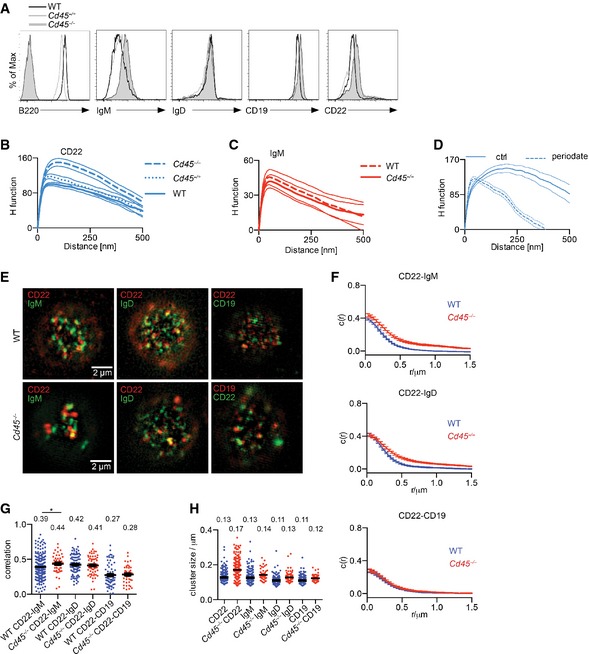
In order to investigate the potential influence that lectin interactions might have on CD22 in the B‐cell membrane, we took advantage of a mouse model lacking the expression of the glycosylated protein CD45. We examined the distribution of CD22 in CD45‐deficient B cells at high resolution using dSTORM. Visual inspection of the resulting rendered dSTORM images revealed a dramatic difference in the organization of CD22 in CD45‐deficient cells compared with wild‐type cells, with the former exhibiting considerably larger CD22 nanoclusters (Fig 6A). In line with this, we found that the CD22 organization in CD45‐deficient B cells is described by a higher Hopkins index (0.90) and H function peak position (150 nm) compared with wild‐type B cells (0.85 and 100 nm, respectively) (Fig 6B). This demonstrates that CD22 exhibits a higher tendency to be clustered in the absence of CD45. Moreover, we also detect a coalescence of CD22s in B cells extracted from CD45 heterozygous mice (Cd45 +/−) compared with wild‐type cells, so it appears that the extent of CD22 nanoclustering is proportionally dependent on the amount of CD45 present on the cell surface (Fig EV2A and B).
Figure 6. CD45 has a major contribution in CD22 organization and mobility.
-
A, BWild‐type and CD45‐deficient primary B cells were stained with Alexa 647‐conjugated antibody against CD22 and settled onto non‐stimulatory coverslips. Cells were then fixed, imaged with dSTORM and analysed. (A) 2D (top) and pseudo‐3D (bottom) dSTORM images were reconstructed from single‐molecule localizations. The white dashed square is shown in pseudo‐3D (bottom). (B) Error bars (Hopkins index) and thin lines (H function) denote mean ± SEM. Data are pooled from three experiments.
-
C–EWild‐type and CD45‐deficient primary B cells were labelled with Atto633‐conjugated Fab fragments against CD22 or IgM, settled onto non‐stimulatory coverslips and imaged. Single‐particle trajectories were then analysed. (C) Trajectories of CD22 in wild‐type (left) and CD45‐deficient cells (right) showing diffusion of single particles over 6 s. (D) Diffusion coefficients of 300 representative CD22 and IgM particles. Bars and numbers indicate the median. Data are pooled from three experiments. (E) Confinement analysis of CD22 and IgM. Bars and numbers indicate the median.
-
FTwo‐population analysis of CD22 diffusion. Diffusion coefficients were plotted on a logarithmic scale and fitted to two Gaussian‐shaped curves to account for slower (light grey) and faster (dark grey) diffusing populations. Wild‐type (blue line and circles, left) and CD45‐deficient (blue line and squares, left middle) primary B cells were compared in an overlay (right middle) and their proportions plotted (right).
-
G, HCD45‐deficient primary B cells were labelled with Atto633‐conjugated Fab fragments against CD22 or IgM, settled onto non‐stimulatory coverslips, treated with vehicle control (DMSO) or 1 μM LatA and imaged. Single‐particle trajectories were then analysed and diffusion coefficients calculated. (G) Diffusion coefficients of 300 representative CD22 and IgM particles. (H) Confinement analysis. Bars and numbers indicate the median. Data are pooled from two experiments.
-
I, JCD45‐deficient primary B cells were stained with Alexa 647‐conjugated antibody against CD22, settled onto non‐stimulatory coverslips and treated with vehicle control or sialidase. Cells were then fixed, imaged with dSTORM and analysed. (I) 2D (top) and pseudo‐3D (bottom) dSTORM images were reconstructed from single‐molecule localizations. The white dashed square is shown in pseudo‐3D (bottom). (J) Quantification of the distribution of CD22 with Hopkins index and H function. Error bars (Hopkins index) and thin lines (H function) denote mean ± SEM. Data are pooled from two experiments.
-
K, LWild‐type and CD45‐deficient primary B cells were treated with vehicle control (−) or 1 μM LatA for the indicated times. Cells were lysed and analysed by SDS–PAGE followed by immunoblotting with phospho‐CD22 (p‐CD22) and total CD22 as a loading control. The intensity of p‐CD22, normalized to CD22, was referred to the unstimulated sample of the wild‐type cells, set as 1. Data represent two independent experiments.
Figure EV2. CD45 is required for organizing CD22.
-
AExpression levels of cell surface proteins were measured by flow cytometry. Wild‐type, Cd45 −/+ and Cd45 −/− primary B cells were labelled with antibodies against B220, IgM, IgD, CD19 and CD22.
-
BWild‐type, Cd45 −/+ and Cd45 −/− primary B cells were stained with Alexa 647‐conjugated antibody against CD22 and settled onto non‐stimulatory coverslips. Cells were then fixed, imaged with dSTORM and analysed. Quantification of the distribution of CD22 with H function. Thin lines denote mean ± SEM.
-
CWild‐type and Cd45 −/− primary B cells were stained with Cy5‐conjugated Fab fragment against IgM and settled onto non‐stimulatory coverslips. Cells were then fixed, imaged with dSTORM and analysed. Quantification of the distribution of IgM with H function. Thin lines denote mean ± SEM.
-
DCD45‐deficient primary B cells were treated with vehicle control or periodate, stained with Alexa 647‐conjugated antibody against CD22 and settled onto non‐stimulatory coverslips. Cells were then fixed, imaged with dSTORM and analysed. Quantification of the distribution of IgM with H function. Thin lines denote mean ± SEM.
-
E–HDual‐colour SIM analysis of CD22, IgM, IgD and CD19 in CD45‐deficient primary B cells. Cells were fixed, stained with Atto633‐ or ‐488‐conjugated antibody against CD22, IgM or IgD and Alexa 647‐conjugated antibody against CD19 and settled onto non‐stimulatory coverslips. Cells were then embedded in agarose, imaged with SIM and analysed. (E) SIM images of CD22, IgM, IgD and CD19. (F) Cross‐correlation function. (G) Pearson correlation coefficient. (H) Cluster size calculated from autocorrelation analysis. Bars and numbers indicate the median. Data are from two independent experiments. *P < 0.05 (Student's t‐test).
Given the impact that the removal of CD45 has on CD22 organization in the B‐cell membrane, we went on to assess the role that this sialylated ligand might have on the mobility of CD22 using SPT. We observed that the median diffusion coefficient of CD22 is significantly lower in CD45‐deficient cells compared with wild‐type B cells (0.025 μm2/s and 0.048 μm2/s, respectively) (Fig 6C and D; Movie EV3). Indeed, the lower diffusion coefficient of CD22 was accompanied by a reduction in the area of confinement (Fig 6E) and an increase in the slower‐diffusing population (Fig 6F) in CD45‐deficient B cells. The treatment of these cells with LatA did not substantially alter the rate of CD22 diffusion (0.028 μm2/s compared with vehicle control 0.023 μm2/s) (Fig 6G), and the area of confinement suggested that the influence of the actin cytoskeleton on CD22 dynamics was diminished in CD45‐deficient B cells (Fig 6H). Importantly, IgM nanoscale organization, diffusion and sensitivity to cytoskeleton disruption were not altered in CD45‐deficient B cells (Figs 6D, E, G and H, and EV2C), indicating that the alterations in CD22 organization and dynamics were not simply the result of aberrant disorganization of the B‐cell surface in the absence of CD45.
The increased tendency of CD22 to coalesce into larger clusters in CD45‐deficient primary B cells implies that it may engage in homotypic interactions, and this is in line with previous findings in a B‐cell line (Han et al, 2005). In this scenario, the removal of sialylated CD45 from the cell surface is expected to decrease the competition for ligand binding and favour interactions between neighbouring sialylated CD22 molecules. To establish whether this is indeed the case in our system, CD45‐deficient B cells were treated with sialidase to remove α2,6‐Sia ligands from the cell surface and the organization of CD22 was visualized using dSTORM. We observed that the sialidase‐treated cells exhibited a higher number of smaller CD22 nanoclusters compared with untreated cells (Fig 6I). In addition, both the H function and Hopkins index decreased when the cells were stripped of sialic acid (Fig 6J), indicating that the formation of larger clusters of CD22 in the absence of CD45 was indeed determined by ligand‐dependent homotypic CD22 cis‐interactions. Similar results were also observed when sialic acid was removed from the cell surface after mild periodate treatment (Fig EV2D).
The influence that CD45 has on CD22 organization was further analysed by SIM (Fig EV2E–G). Similar to our observations by dSTORM, we found a significant enlargement of CD22 clusters in CD45‐deficient cells, whereas the IgM, IgD and CD19 organization remained the same (Fig EV2H). Furthermore, analysis of dual‐colour images did not reveal any marked alterations in the degree of CD22 overlap with IgD or CD19, but showed a minor, although significant increase in the CD22–IgM correlation (Fig EV2F and G). Together, these results demonstrate that the absence of CD45 leads to a profound alteration in CD22 organization without substantially altering the degree of association of CD22 with IgM, IgD or CD19.
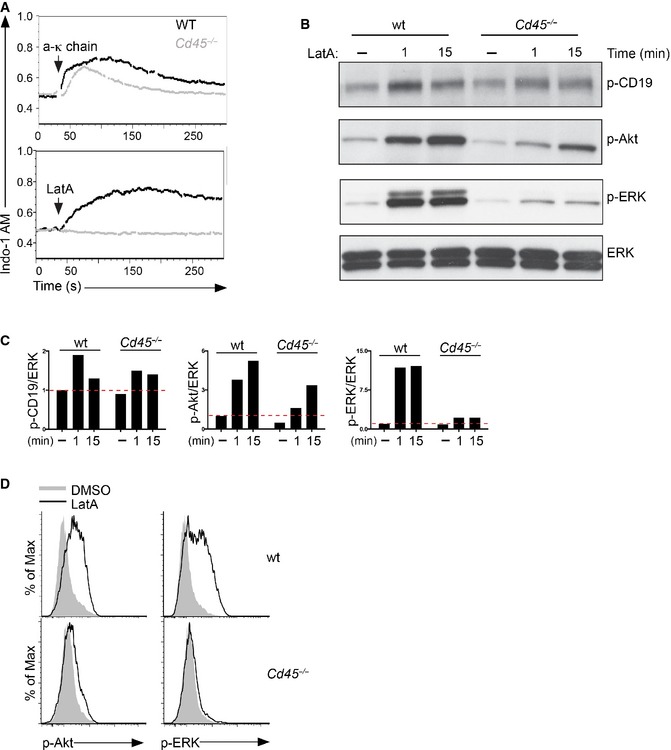
We were keen to examine the functional significance that the altered organization of CD22 in CD45‐deficient B cells has on BCR signalling triggered following cytoskeleton disruption. CD45‐deficient B cells exhibited higher levels of CD22 phosphorylation both in the basal state and in response to LatA (Fig 6K and L). Indeed, these cells were strongly impaired in their ability to mediate BCR signalling upon LatA treatment (Fig EV3A–D). This observation suggests that altering the organization of CD22 may have implications for B‐cell activation; however, CD45 itself plays a central role in the initiation of BCR signalling (Hermiston et al, 2003). Therefore, although the CD45‐deficient mouse has allowed us to identify an important role for cis‐interactions in the organization and dynamics of CD22 in B cells, it does not provide a straightforward model to accurately investigate the functional consequences that these interactions play in BCR signalling.
Figure EV3. CD45 is dispensable for BCR signalling after ligand stimulation but essential for receptor signalling after cytoskeleton disruption.
-
AWild‐type and Cd45 −/− primary B cells were treated with 5 μg/ml anti‐kappa or 1 μM LatA. Intracellular calcium flux was measured by flow cytometry.
-
B, CWild‐type and CD45‐deficient primary B cells were treated with vehicle control (−) or 1 μM LatA for the indicated times. Cells were lysed and analysed by SDS–PAGE followed by immunoblotting with phospho‐CD19 (p‐CD19), phospho‐Akt (p‐Akt), phospho‐ERK (p‐ERK) and total ERK as a loading control. The intensity of phosphorylated proteins, normalized to ERK, was referred to the unstimulated sample of the wild‐type cells, set as 1.
-
DWild‐type and CD45‐deficient primary B cells were treated with vehicle control (−) or 1 μM LatA for 5 min, fixed, permeabilized, stained for phospho‐Akt (p‐Akt) and phospho‐ERK (p‐ERK) and analysed by flow cytometry. Data are representative of three independent experiments.
Source data are available online for this figure.
CD22 dynamics, organization and attenuation of BCR signalling are dependent on interaction with α2,6‐Sia
We have established that CD22 exhibits a dramatically different organization in the B‐cell membrane in the absence of the sialylated protein CD45. As this is potentially due to increased CD22 homotypic interactions, we investigated the role of the extracellular lectin domain in determining the dynamic distribution of CD22 in the B‐cell membrane.
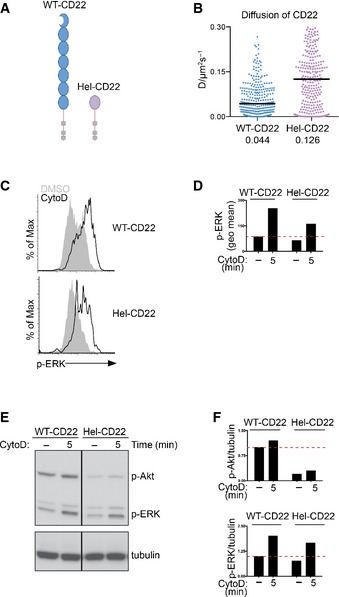
To achieve this, we engineered a chimeric CD22 protein with the extracellular domains substituted with the unrelated small molecule hen egg lysozyme (Hel) and expressed it in the A20 B‐cell line (Fig EV4A). As these cells expressed the chimeric CD22 (Hel‐CD22) alongside endogenous CD22, it provided a convenient system to assess the effect that the extracellular domain has on the lateral mobility of CD22 using SPT. Comparable to primary B cells (Fig 5A–C), endogenous CD22 exhibits a median diffusion coefficient of 0.044 μm2/s in A20 cells, but chimeric Hel‐CD22 diffuses significantly faster with a median diffusion coefficient of 0.126 μm2/s (Fig EV4B). We then examined the functional consequences of expressing chimeric Hel‐CD22 in the regulation of BCR signalling. We observed robust activation of ERK and Akt in A20 wild‐type cells following stimulation with CytoD; however, the levels of both ERK and Akt phosphorylation were significantly lower in the A20 B cells that also expressed the chimeric Hel‐CD22 (Fig EV4C–F). This observation shows that the extracellular domain plays an important role in shaping the membrane diffusion of CD22 and suggests that higher mobility might lead to stronger signal inhibition.
Figure EV4. Extracellular domain of CD22 regulates its diffusion.
-
ASchematic structure of wild‐type CD22 and chimeric Hel‐CD22 construct.
-
BSingle‐particle tracking of wild‐type CD22 and Hel‐CD22 in A20 B cells. A20 B cells co‐expressing endogenous wild‐type CD22 and Hel‐CD22 were simultaneously labelled with Atto 488‐conjugated Fab fragments against CD22 or Atto 633‐conjugated Fab fragment against Hel, settled onto non‐stimulatory coverslips and imaged. Single‐particle trajectories were then analysed. Bars and numbers indicate the median. Data are pooled from two experiments.
-
C, DA20 B cells co‐expressing wild‐type CD22 and Hel‐CD22 were treated with vehicle control (−) or 10 μM cytochalasin D (CytoD) for 5 min, fixed, permeabilized, stained for phospho‐ERK (p‐ERK) and analysed by flow cytometry.
-
E, FA20 B cells co‐expressing wild‐type CD22 and Hel‐CD22 B cells were treated with vehicle control (−) or 10 μM CytoD for 5 min. Cells were lysed and analysed by SDS–PAGE followed by immunoblotting with phospho‐Akt (p‐Akt), phospho‐ERK (p‐ERK) and tubulin as a loading control. The intensity of phosphorylated proteins, normalized to tubulin, was referred to the unstimulated sample of the wild‐type cells, set as 1. Data are representative of two independent experiments.
Source data are available online for this figure.
To examine the role of the CD22 extracellular domain in a more physiological system, we then took advantage of a transgenic mouse model that expresses CD22 with a point mutation in the α2,6‐Sia‐binding pocket (Cd22 R130E) in place of endogenous CD22 (Müller et al, 2013). We examined experimentally the mobility of Cd22 R130E in primary B cells using SPT. We observed that the median diffusion coefficient of CD22 was significantly higher in Cd22 R130E B cells compared with wild‐type controls (0.068 μm2/s and 0.048 μm2/s, respectively) (Fig 7A and B; Movie EV4) and indeed Cd22 R130E shows a greater area of confinement (Fig 7C). Moreover, a more detailed inspection of these data reveals that the entire population of CD22 is shifted to a higher mobility on abrogation of α2,6‐Sia binding (Fig 7D and E). These observations are consistent with the notion that the increased lateral mobility of CD22 may promote the attenuation of BCR signalling.
Figure 7. CD22 mobility, nanoscale organization and function are dependent on its sialic acid‐binding activity.

-
A–EWild‐type and Cd22 R130E primary B cells were labelled with Atto 633‐conjugated Fab fragments against CD22 or IgM, settled onto non‐stimulatory coverslips and imaged. Single‐particle trajectories were then analysed. (A) Trajectories of CD22 in wild‐type (left) and Cd22 R130E cells (right) showing diffusion of single particles over 6 s. (B) Diffusion coefficients of 300 representative CD22 and IgM particles. (C) Confinement analysis. Bars and numbers indicate the median. (D, E) Two‐population analysis of CD22 diffusion. Analysis of CD22 diffusion plotted on a logarithmic scale and fitted to two Gaussian‐shaped curves to account for slower and faster‐diffusing populations. (D) Wild‐type (blue line and circles) and Cd22 R130E (blue dotted line and squares) primary B cells were compared in an overlay. (E) Proportions of faster‐diffusing populations.
-
F, GWild‐type and Cd22 R130E primary B cells were stained with Alexa 647‐conjugated antibody against CD22 and settled onto non‐stimulatory coverslips. Cells were then fixed, imaged with dSTORM and analysed. (F) 2D (top) and pseudo‐3D (bottom) dSTORM images were reconstructed from single‐molecule localizations. The white dashed square is shown in pseudo‐3D (bottom). (G) Quantification of the distribution of CD22 with Hopkins index and H function. Error bars (Hopkins index) and thin lines (H function) denote mean ± SEM. Data are pooled from three experiments.
-
HWild‐type and Cd22 R130E primary B cells were treated with 1 μM LatA and intracellular calcium flux was measured by flow cytometry.
-
I–KWild‐type and Cd22 R130E primary B cells were treated with vehicle control (−) or 1 μM LatA for the indicated times. Cells were lysed and analysed by SDS–PAGE followed by immunoblotting with phospho‐CD19 (p‐CD19), phospho‐Akt (p‐Akt), phospho‐ERK (p‐ERK) and actin and total ERK as loading controls. The intensity of phosphorylated proteins, normalized to actin or ERK, was referred to the unstimulated sample of the wild‐type cells, set as 1. Data are representative of at least two experiments.
-
LComputer simulation of diffusing CD22 nanoclusters with the nanocluster size from Cd22 R130E primary B cells.
-
M–OArea covered by diffusing CD22 with the nanocluster parameters or the diffusion coefficient of Cd22 R130E. (M) Computer simulation of diffusing CD22 with the nanocluster parameters of Cd22 R130E cells. (N) Computer simulation of diffusing CD22 with the median diffusion coefficient of Cd22 R130E. (O) Computer simulation of diffusing CD22 nanoclusters with the real diffusion coefficient and nanocluster parameters for CD22 observed in wild‐type and Cd22 R130E cells. The graph shows the area covered. Data are from seven independent simulation runs.
To ascertain how abrogated α2,6‐Sia binding influences the nanoclustering of CD22, we used dSTORM and observed that Cd22 R130E was organized in smaller nanoclusters than wild‐type CD22 (Fig 7F). The smaller size of CD22 nanoclusters is reflected in the lower peak position of the H function in Cd22 R130E B cells compared with wild type (60 nm and 100 nm, respectively) (Fig 7G). Furthermore, the Hopkins index increases in Cd22 R130E from 0.80 to 0.87, which shows that the CD22 is more likely to be in the clustered state. Together with the earlier finding that larger CD22 nanoclusters are formed in the absence of CD45 (Fig 6A and B), these observations lend weight to the idea that CD22 nanoclustering in the B‐cell membrane is promoted by homotypic interactions that are dependent on α2,6‐Sia binding. In addition, cross‐correlation analysis of dual‐colour SIM images showed a marginal increase of CD22 overlap with IgM and no increased overlap with IgD (Fig EV5A–C).
Figure EV5. CD22 colocalization with BCR and ligand‐dependent BCR signalling in primary Cd22 R130E B cells.

-
A–CDual‐colour SIM analysis of CD22, IgM and IgD. Cells were fixed, stained with Atto633‐ or ‐488‐conjugated antibody against CD22, IgM or IgD and settled onto non‐stimulatory coverslips. Cells were then embedded in agarose, imaged with SIM and analysed. (A) SIM images of CD22, IgM and IgD. (B) Cross‐correlation function. (C) Pearson correlation coefficient. Bars and numbers indicate the mean. Data are from three independent experiments. *P < 0.05 (Student's t‐test).
-
DWild‐type and Cd22 R130E primary B cells were treated with 5 μg/ml anti‐kappa, and intracellular calcium flux was measured by flow cytometry.
-
E, FWild‐type and Cd22 R130E primary B cells were stimulated with 5 μg/ml anti‐kappa for the indicated times. Cells were lysed and analysed by SDS–PAGE followed by immunoblotting with phospho‐CD19 (p‐CD19), phospho‐Akt (p‐Akt), phospho‐ERK (p‐ERK) and actin as a loading control. The intensity of phosphorylated proteins, normalized to actin, was referred to the unstimulated sample of the wild‐type cells, set as 1. Data are representative of two independent experiments.
Source data are available online for this figure.
Considering the altered organization and dynamics of CD22 caused by the abrogation of α2,6‐Sia binding capability, we went on to assess the repercussions on the ability of CD22 to attenuate BCR signalling after cytoskeleton disruption. Importantly, we observed no increase in intracellular calcium in Cd22 R130E B cells after treatment with LatA (Fig 7H). Furthermore, the activation of CD19, Akt and ERK was lower in B cells expressing Cd22 R130E compared with wild‐type controls (Fig 7I–K). These findings demonstrate that the lectin‐binding activity of CD22 might provide a means of regulating the inhibitory activity of this coreceptor and thereby signalling through the BCR.
Since we found that Cd22 R130E is organized in smaller clusters and acquires higher mobility than wild‐type CD22, we then employed our in silico model in an attempt to understand the possible contributions of cluster size and diffusion to the enhanced function of Cd22 R130E in dampening BCR signalling. We first evaluated whether a diminution in nanocluster size has an effect on the area covered by CD22. We used the cluster values observed for Cd22 R130E in a further round of in silico modelling (Fig 7L). Simulations were run as previously described in Fig 4, and the area covered by the mutated coreceptor was measured. Unexpectedly, the area covered by the smaller clusters representing Cd22 R130E was consistently higher than that of the larger wild‐type CD22 clusters (Fig 4E). Such an increase in area covered of the smaller clusters can be explained by the fact that larger clusters physically occupy more area thus covering less “fresh” territory compared to smaller clusters during their motion.
In our in silico model, we went on to disentangle the effects that cluster size and diffusion coefficient have on Cd22 R130E specifically. We first compared the area covered with a cluster size fixed at the value of Cd22 R130E for the experimentally measured diffusion coefficients of wild‐type CD22 and Cd22 R130E (Fig 7M). Then, we compared the area covered with the diffusion rate fixed value of Cd22 R130E for the cluster sizes of wild‐type CD22 and Cd22 R130E (Fig 7N). These results show that both smaller cluster size and faster diffusion similarly affect the area covered. Lastly, we compared the area covered by CD22 and Cd22 R130E with their experimentally measured values for both nanocluster size and diffusion coefficient. We found that Cd22 R130E can indeed sample a larger area than wild‐type CD22 in a given window of time through the combined effects of having both smaller clusters and faster diffusion (Fig 7O).
Given that the alterations in mobility and organization of Cd22 R130E had resulted in diminished tonic BCR signalling, we anticipated that this CD22 mutant form would also be more active at dampening BCR signalling stimulation. To assess this, B cells were stimulated with anti‐kappa antibody, and then BCR‐dependent signalling was analysed as above. In line with observations reported by Müller et al (2013), we saw that Cd22 R130E cells were indeed significantly reduced in their ability to raise calcium levels in response to BCR cross‐linking compared to wild‐type cells (Fig EV5D). Moreover, BCR signalling in response to ligand was also reduced, as judged by the reduced levels of CD19, Akt and ERK phosphorylation (Fig EV5E and F).
All together, our data demonstrate that the altered nanocluster organization and mobility of Cd22 R130E result in diminished tonic and ligand‐dependent signalling. Overall, a picture of CD22 emerges in which the organization and dynamic diffusion of this inhibitory coreceptor are orchestrated through a network of lectin‐mediated interactions in the B‐cell membrane, thereby shaping the extent of signalling through the BCR and consequent B‐cell activation.
Discussion
We have demonstrated that alteration of the cortical cytoskeleton elicits an intracellular signalling cascade that is qualitatively, but not quantitatively, similar to that triggered by cross‐linking the BCR. Notably, this response also employs the canonical CD22‐negative regulatory pathway. By combining super‐resolution microscopy and single‐particle tracking, we have established that endogenous CD22 exists in preformed nanoclusters and its lateral mobility increases when cortical actin is disrupted, while its nanoscale organization remains unaffected. Instead, using transgenic mice expressing CD22 mutant variants, we were able to establish that the sialic acid‐binding domain of this receptor has a major contribution in defining both the lateral mobility and nanocluster organization. Similarly, we found reduced mobility and higher degree of clustering in the absence of the glycoprotein CD45, a potential binding partner for CD22. Together, our findings demonstrate that CD22 works with the actin cytoskeleton to jointly control BCR signalling in naïve B cells and that CD22 organization and dynamics are important properties in this regulation.
We previously showed that disruption of the cortical cytoskeleton induces BCR signalling (Treanor et al, 2010) which involves calcium flux and ERK and Akt phosphorylation. More recently, we demonstrated that although the BCR was necessary, it was not sufficient to elicit such signals and that the BCR requires a productive collaboration with the coreceptor CD19 (Mattila et al, 2013). Here, we established that the disassembling of the actin network also induces the early tyrosine kinase signature of BCR signalling, involves Src kinases and induces phosphorylation of Syk, PLCγ2 and CD19. While these early events were qualitatively similar to those observed when B cells are stimulated by antigen or by BCR cross‐linking, the magnitude of these responses was substantially lower. Nevertheless, they led to robust calcium flux as well as ERK and Akt phosphorylation. These data indicate that in response to actin disruption, signalling is initiated by BCR and Src kinases, propagated via Syk and CD19, leading to calcium flux and Akt and ERK responses. Instead, signalling initiated by BCR cross‐linking will lead to extensive Syk activity, which can be CD19 independent, followed by calcium flux, Akt and ERK responses. These two signalling modes might account for the differences between “tonic” and activatory BCR signalling (Lam et al, 1997). They also are in line with recent work from the Weiss group in T cells (Tan et al, 2014). In this, they demonstrated that Csk inhibition triggers extremely high levels of SFK activity but was not sufficient to trigger calcium flux or ERK. Indeed, the additional requirement of actin disruption allows PLCγ1 access to PtdIns(4,5)P2 for the further propagation of the proximal TCR signal which depends on CD28 (Tan et al, 2014). Despite some minor intrinsic differences between B and T cells, these data highlight the important role of actin cytoskeleton remodelling during lymphocyte activation.
Importantly, we show here that the low levels of early tyrosine phosphorylation induced in B cells by LatA treatment are under the strict control of the inhibitory coreceptor CD22 and its effector SHP‐1. While CD22 expression has always been inferred by the levels of antibody staining in flow cytometry (D'Arena et al, 2000), this methodology does not provide the precise number of molecules of CD22 on the cell surface. Here, we determined that CD22 is present at 65,000 molecules per B cell. This means that CD22 appears to be markedly outnumbered when compared to the expression of IgM and IgD, the sum of which corresponds to 326,000 molecules. As shown in our super‐resolution data, this imbalance is maintained when the clustering of CD22 molecules is considered. We went on to develop Brownian dynamic simulations in an attempt to link CD22 properties to function. Our in silico model anticipated that fast lateral diffusion might permit CD22 molecules to survey a larger area on the B‐cell surface in a shorter window of time. Our single‐particle‐tracking analysis of CD22 confirms this prediction: indeed, CD22 is highly mobile (0.046 μm2/s) if considering that the physiological range of diffusion coefficients is from 0.005 μm2/s for IgD to 0.100 μm2/s for MHC‐II (Wade et al, 1989; Vrljic et al, 2002; Umemura et al, 2008; Treanor et al, 2010). It is not technically possible to determine from the tracking of individual fluorophores whether they represent individual receptor molecules or several receptors in one cluster. We conclude from the Hopkins index that most of the CD22 exists in clusters; therefore, it is highly likely that we are tracking mobile receptor clusters. The other possibility would be that a pool of highly mobile individual molecules diffuses between immobile clusters, although this would imply a large immobile fraction in the SPT data, which is in contrast to the small fraction we observe. We conclude, therefore, that the large mobile fraction in the SPT data mostly represents CD22 in clusters, with a small contribution from individual molecules, which would also be in agreement with the in silico model. The slow dynamics observed in the absence of CD45, as well as the faster dynamics observed for Cd22 R130E compared with wild type, indicate that the state of CD22 might have a direct effect in influencing receptor mobility. Nevertheless, the fast diffusion of CD22 might allow it to make contact with a high number of BCR nanoclusters. This is likely to compensate for CD22 being outnumbered and provides rapid negative surveillance of the BCR.
On B cells, we have estimated that the BCR, CD19 and CD22 nanoclusters occupy more than 10% of the surface. It is important to understand how the organization of these molecules allows B cells to respond to specific stimulation while preventing aberrant activation. Recent studies have demonstrated that the BCR is not monomeric but exists pre‐clustered or in islands on the surface of cells (Mattila et al, 2013; Kläsener et al, 2014). However, the particular mechanisms driving receptor nanoclustering are not completely understood. Notably, we recently showed that the tetraspanin CD81 determines, at least in part, the organization of CD19 nanoclusters (Mattila et al, 2013). In a similar fashion, we have demonstrated here that cis‐interactions control the membrane organization of the lectin CD22, namely the presence of CD45 and sialic acid binding. We observed that in CD45‐deficient B cells, the degree of CD22 nanoclustering dramatically increases, pointing towards a specific interaction between CD22 and CD45. The formation of larger CD22 clusters in the absence of CD45 can be reversed when the cells are treated with sialidase, indicating a ligand dependency of homotypic CD22 cis‐interactions. These findings suggest that CD45 works as a spacer between neighbouring CD22 molecules, reducing the tendency of CD22 molecules to clump together. Indeed, a photoaffinity protein–glycan cross‐linking assay, performed in a human lymphoma B‐cell line, indicated a preference of CD22 to form homomultimeric complexes (Han et al, 2005). These complexes appear to be preferentially located into clathrin‐coated pit domains, which are responsible for receptor internalization and endocytosis (Collins et al, 2005; Grewal et al, 2006). Moreover, we observed that mutated CD22 unable to bind sialic acid (Cd22 R130E) exhibited a reduced degree of nanoclustering when compared to wild‐type CD22.
In addition to the concept of receptor nanoclustering, plasma membrane compartmentalization has emerged as an important parameter in understanding the regulation of receptor signalling. The cytoskeleton and associated proteins define membrane compartments, restricting the diffusion of plasma membrane components (Kusumi et al, 1993, 2005) such as FcεRI in mast cells and the BCR on B‐cell membranes (Andrews et al, 2008; Treanor et al, 2010). In particular, the lateral mobility of the BCR is mediated by the cortical cytoskeleton (Treanor et al, 2010). This interaction has profound consequences for signalling, evidenced by BCR signalling after cytoskeleton disruption. In contrast, CD19 membrane lateral mobility is not mediated by actin, but determined instead by the tetraspanin CD81, which immobilizes CD19. The cytoskeleton appears to differentially compartmentalize BCR and CD19 islands, and hence, when it is disrupted, BCR signalling is generated.
CD22 diffusion increases once the cytoskeleton is disrupted, indicating a certain degree of restriction by actin, although cis‐interactions appear to play the major role in CD22 dynamics and organization. In CD45‐deficient B cells, CD22 exhibits a sharply decreased lateral mobility, probably as a consequence of its increase in aggregation. Such a severe reorganization of CD22 is likely to affect B‐cell activation. In line with previous results (Benatar et al, 1996; Cyster et al, 1996; Hermiston et al, 2005), we observed that in CD45‐deficient B cells, the calcium response is only mildly impaired after receptor cross‐linking. Instead, we observed severely reduced BCR signalling after LatA treatment, which might be caused by an altered function of CD22. Indeed, the alterations of CD22 nanoscale organization and diffusion in CD45‐deficient cells are accompanied by a significant increase in both CD22 basal and LatA‐induced phosphorylation levels. Our data are in accordance with previous biochemical studies showing higher CD22 basal phosphorylation when CD45 was misplaced on the surface of a B‐cell line with a cross‐linking anti‐CD45 antibody (Greer & Justement, 1999). In addition, diminished responses in CD45‐deficient B cells can be rescued when SHP‐1 is depleted, supporting the idea of a gain of function for CD22 in CD45‐deficient mice (Pani et al, 1997). As CD22 phosphorylation seems to be mediated by Lyn (Cyster & Goodnow, 1997; Cornall et al, 1998; Smith et al, 1998), the mechanism responsible for the enhanced CD22 phosphorylation we observed in CD45‐deficient cells is not clear. However, even though Lyn phosphorylation is decreased in the absence of CD45, in B cells, the presence of the phosphatase CD148 permits a lower but functional level of Lyn kinase activity to be sustained (Cordoba et al, 2013). In this scenario, the reorganization that occurs at the nanoscale level on the membrane of CD45‐deficient cells might direct active Lyn to preferentially engage the enlarged clusters of CD22, thereby exacerbating a negative feedback loop.
Intrinsic alterations in the levels of Src kinase activity in CD45‐deficient cells, however, are likely to have a dominant effect and therefore prevent us from ascribing all these differences to CD22 organization alone. To address this in a more straightforward way, we took advantage of transgenic mice expressing a mutant form of CD22. Functional implications of CD22 cis‐interactions were previously reported using ST6GalI knockout or R130E knock‐in mice with ablated sialic acid or mutated α2,6‐Sia‐binding domain, respectively (Jin et al, 2002; Collins et al, 2005; Grewal et al, 2006; Müller et al, 2013). B cells from these mice are hypo‐responsive after IgM cross‐linking, possibly due to a higher colocalization of the BCR to CD22 in clathrin‐coated pit domains in the absence of ligand binding (Collins et al, 2005). Notably, it has been shown that CD22 phosphorylation is higher in resting Cd22 R130E B cells (Müller et al, 2013). Here, we show that when they are unable to recognize sialic acid, CD22 nanoclusters are smaller in size and acquire higher lateral mobility compared with wild‐type CD22, characteristics that parallel a robust inhibition of BCR signalling in response to both BCR engagement and cytoskeleton disruption.
Notably, our in silico model shows that both of the characteristics (smaller cluster size and higher diffusion) render CD22 able to survey larger areas on the B‐cell surface, which might be the reason why Cd22 R130E acquires a stronger inhibitory function. Moreover, smaller clusters are also likely to have relatively more peripheral CD22 molecules exposed than larger clusters, which, together with a faster mobility, could render Cd22 R130E able to keep more molecules of BCR in check in less time. Indeed, in a recently presented proximity ligation assay (PLA), Cd22 R130E showed a higher association with IgM in resting B cells compared with wild‐type B cells (Müller et al, 2013). In our study, we use SIM and dSTORM as two complementary super‐resolution microscopy methods (Gustafsson et al, 2008; Heilemann et al, 2008). SIM is based on applying patterned illumination during imaging and does not pose special restrictions in the choice of fluorophores, which makes it ideally suited for multicolour experiments. In contrast, dSTORM exploits stochastic blinking of fluorophores under special buffer and illumination conditions. The advantages of dSTORM are its higher resolution (10–30 nm) compared to SIM (110–150 nm) and the possibility of counting individual molecules, thereby allowing, for instance, cluster analysis (Lillemeier et al, 2010; Mattila et al, 2013). However, it is difficult to find suitable fluorophores for multicolour dSTORM experiments. The stochastic nature of the imaging process can lead to multiple blinking events for a single labelled antibody (Mattila et al, 2013). However, it is also possible to miss receptors because of insufficient labelling or altered blinking conditions in the local environment. While this does not affect the results of the single‐colour cluster analyses reported in the current study, it can be challenging in multicolour experiments (Mattila et al, 2013). Taking these limitations into consideration, our dual‐colour SIM analysis showed only a minor, but significant increase in Cd22 R130E colocalization with IgM.
Together, these observations are in line with our model where the organization and high lateral mobility of CD22 is fundamental in dampening BCR signalling both at the steady‐state and upon ligand‐dependent stimulation (see model in Fig 8).
Figure 8. A role for CD22 dynamics and organization in restraining BCR signalling in naïve B cells.
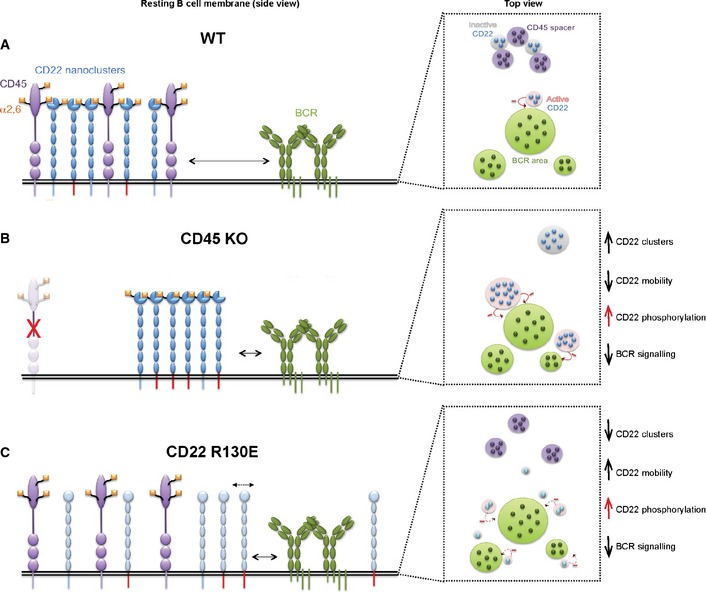
- In the steady state, CD22 dynamics and nanoclustering are regulated by CD45. Sialylated CD45 works as a spacer between mobile molecules of CD22 displaying high amount of sialic acid. This organization limits the extent of active CD22 (red tails, side view) and restrains the proximity of CD22 to the BCR (long arrow, side view). This equilibrium allows a low level of basal signalling required for B‐cell survival.
- When CD45 is absent, the tendency of CD22 to form self‐interactions via sialic acid binding increases together with CD22 nanocluster size and inhibitory activity. Bigger clusters of hyperactive CD22, no longer trapped by CD45, can access the BCR more easily (short arrow, side view) restraining the signalling.
- The inability of CD22 to bind the sialic acid (Cd22 R130E) on either CD45 or neighbouring CD22 molecules decreases the size of CD22 nanoclusters with a concomitant increase of CD22 lateral mobility (dashed arrows, side view and top view) and phosphorylation. In this situation, CD22 is able to explore a larger area and access more BCRs (short arrow, side view), thus leading to a higher signal inhibition.
On the basis of our findings, we include the inhibitory coreceptor CD22 in the scenario of B‐cell activation upon cytoskeleton disruption. We postulate the following model: in resting B cells, the constitutive “tonic” signalling generated by pre‐existing nanoclusters of BCRs and CD19 is kept under control by the high dynamism of CD22 nanoclusters. In parallel, the actin cytoskeleton defines distinct compartments in the plasma membrane where BCR is restrained from signalling. The disruption of the cytoskeleton releases BCR nanoclusters, which will now be able to diffuse freely. Freely diffusing BCR will, in turn, overcome CD22 inhibitory action because they will be able to interact with other BCR nanoclusters, or with islands of CD19, and therefore, signalling will be positively sustained.
Materials and Methods
Cell preparation and culture
Mouse strains used: C57BL/6 wild‐type mice; BALB/c wild‐type mice; μMT (Kitamura et al, 1991); CD45‐deficient mice (Mee, P.J.); and LifeAct‐GFP mice (Riedl et al, 2008) kindly provided by M. Sixt and R. Faessler (Max Plank Institute of Biochemistry, Munich). For bone marrow chimeras, B‐cell‐deficient μMT mice were irradiated with 2 × 6.6 Gy, and on the day after injected intravenously with 2 × 10⁶ bone marrow cells from CD22 transgenic mice expressing either CD22‐Y2,5,6F, CD22‐Y5,6F and CD22‐R130E or from CD22‐deficient mice. The splenocytes were isolated after 2–4 months. Splenic naïve B cells were purified by negative selection, according to the manufacturer's instructions using MACS B‐cell isolation kit (Carrasco et al, 2004) and used on the day of isolation. Primary B cells and murine A20 B‐cell line were cultured at 37°C in complete medium (RPMI containing 10% FCS, 10 mM HEPES, GlutaMAX, penicillin and streptomycin (all LifeTechnologies) and 50 μM β‐mercaptoethanol (Sigma‐Aldrich). All the experiments were approved by the Cancer Research UK Animal Ethics Committee and the UK Home Office.
Reagents
Latrunculin A, cytochalasin D, PP2 and Syk‐inhibitor IV BAY 61‐3606 were purchased from Calbiochem. Sialidase from Arthrobacter ureafaciens was purchased from Roche.
Cloning and transfection of recombinant lysozyme‐CD22
For the generation of Hel‐CD22 chimera, Hel sequence was amplified by PCR from a pcDNA3 plasmid containing a Hel‐cDNA fragment (Batista & Neuberger, 1998) with the sense primer 5′ CGGAATTCATGAGGTCTTTGCTAATC 3′ and antisense primer 5′ CGGGATCCAGATCCGCTTCCACC 3′ and cloned in the pCDNA3.1 expression vector in EcoRI and BamHI restriction sites. CD22 transmembrane domain and intracellular tail sheaths were amplified from A20 cDNA. Fragments were amplified with the sense primer 5′ CGGGATCCGTCGCCTTGGGACTAGGCTTC 3′ and the antisense primer 5′ GCGCTTAAGTCAGTGCTTGAGGGTCACATA 3′ and cloned in the Hel‐pCDNA3.1 vector in BamHI and AflII restriction sites. The vector was introduced by electroporation and single clones were selected with 0.5 mg/ml G418 (Sigma‐Aldrich). Hel‐CD22 expression was verified by flow cytometry using Alexa 555‐conjugated anti‐Hel antibody (F10).
Preparation of Fab fragments of monoclonal antibodies
Fab fragments of purified monoclonal antibody against murine CD22 (Cy34.1; ATCC TIB163), IgD (11‐26c) and CD19 (1D3 and 6D5) were prepared as previously described (Depoil et al, 2008). Fab fragments were labelled with Atto488 or Atto633 (Atto‐Tec) dyes according to the manufacturer's instructions.
Sample preparation for single‐particle tracking
Single‐particle tracking was performed as previously described (Treanor et al, 2010). Briefly, primary naïve B cells and A20 B cells were labelled with limiting dilutions of Atto633‐ or Atto488‐conjugated anti‐CD22 Fab (Cy34.1), anti‐CD19 Fab (1D3), anti‐IgD Fab (11–26c) or anti‐IgM Fab (Jackson ImmunoResearch) for 10 min on ice and washed with PBS. Cells were then resuspended in imaging buffer and allowed to settle on anti‐MHCII‐coated coverslips in Focht Chamber System 2 (FCS2) chambers (Bioptechs Inc.) at 37°C for 2 min prior to imaging with TIRFM for 15 min. For disruption of F‐actin, 1 μM LatA or DMSO pre‐warmed in imaging buffer was injected into the chambers 5 min after cell settling and imaged 10 min after adding the drug.
Sample preparation for dSTORM
Cells were labelled 15 min on ice with Cy5‐ or Alexa 647‐conjugated Fab fragments (anti‐IgM (Jackson ImmunoResearch), anti‐IgD 11‐26c, anti‐CD19 6D5) or full antibodies (anti‐CD19 6D5, anti‐CD22 OX‐97), washed in PBS, suspended in imaging buffer and allowed to adhere on anti‐MHCII‐coated coverslips at 37°C for 4 min. For LatA treatment, either pre‐warmed 1 μM LatA or DMSO was added and incubated for another 4 min at 37°C. For sialidase treatment, cells were resuspended in HeBs buffer (20 mM HEPES, 140 mM NaCl) in the presence of 100 mU/ml of sialidase for 30 min at 37°C and washed in PBS before staining and settling them on the coverslips as described above. For periodate treatment, cells were resuspended in PBS/1%BSA buffer in the presence of 2 mM NaIO4 for 30 min on ice. The samples were then fixed (4% paraformaldehyde, 0.2% glutaraldehyde) for 40 min. For imaging, samples were put in freshly prepared dSTORM switching buffer (PBS pH 7.4 (Sigma), 50 mM β‐mercaptoethylamine (Sigma)) that was complemented with colloidal gold particles (100 nm diameter, British Biocell) as fiducials.
Sample preparation for SIM
Primary B cells were fixed in 2% PFA for 30 min at room temperature and stained with specific antibodies for 1 h. Cells were then washed in PBS, allowed to adhere on poly‐L‐lysine‐coated glass‐bottomed cell culture dishes (MatTek) for 1 h and ultimately immobilized in 1% low‐melting agarose. Staining was performed using anti‐IgM Fab (Jackson ImmunoResearch), anti‐IgD (11–26c), anti‐CD22 (Cy43.1) conjugated with Atto633 or ‐488 and anti‐CD19 (6D5) conjugated with Alexa 647.
Microscopy
Structured Illumination microscopy was performed on an Elyra PS.1 microscope (Carl Zeiss) using 488‐nm and 640‐nm laser excitation and a 63×/1.40 Plan Apochromat oil‐immersion objective (Zeiss). Imaging was started 20 min after placing the dish on the microscope to prevent artefacts due to sample drift. Two‐colour alignment was performed after each experiment day using a multicolour bead sample (Zeiss) and the channel alignment function in the Zen software (Zeiss). Images were reconstructed in the Zen software using a theoretical point‐spread function and a noise filter setting of –4.0 for both channels, which gave a good compromise between resolution and signal to noise ratio of the reconstructed images. Under these conditions, the lateral resolution was found to be 150 nm using 40‐nm green fluorescent beads. Z‐stacks were recorded at the bottom of the cells and a maximum intensity projection of 4–5 slices (440–550 nm) generated. Images shown in the figures are scaled to 90% of the maximum intensity to enhance lower intensity features. Normalized two‐colour cross‐correlation images were calculated from the maximum intensity projections in MATLAB using the function normxcorr2. These images were then radially averaged to get cross‐correlation curves c(r) for each cell. The mean and SEM of these curves is plotted in the figures. The value at r = 0 corresponds to the Pearson correlation coefficient and is given for each cell. The noise in SIM images is typically spatially correlated at small distances; however, the cross‐correlation between the two channels was found to be zero, indicating that the noise does not contribute to c(r). Cluster sizes were calculated from SIM images using autocorrelation analysis. The size is given as the standard deviation of a Gaussian fit to the radial average of the autocorrelated image. Cluster sizes measured this way are well above the value obtained from images containing only noise, showing that we do indeed measure the size of the clusters.
For single‐particle tracking, TIRFM images were acquired with an EMCCD camera (iXon3 897, Andor) coupled to a TIRFM system (Cell R, Olympus) with three laser lines (488 nm, 561 nm and 640 nm) and motorized filter wheel (Olympus). Single‐molecule imaging was performed as previously described (Treanor et al, 2010) with 20 frames/s for 15 s using a 150× NA 1.45 objective (Olympus). Dual‐View TIRFM recording was achieved with an image splitter (Quadview, Photometrics) as described (Treanor et al, 2010).
For dSTORM on the Cell R TIRFM system (Olympus), a 150× NA 1.45 objective (Olympus) was used. Acquisition at 640 nm and activation at 488 nm were simultaneous. 2,000–5,000 frames were acquired with exposure times of 150 ms.
For dSTORM on the ELYRA PS.1 system (Zeiss), an alpha Plan Apochromat 100× NA 1.46 objective (Zeiss) was used with a 1.6× magnification changer. Acquisition at 640 nm and activation at 405 nm were simultaneous. 3,000–6,000 frames were acquired with exposure times of 50 ms.
Data analysis
dSTORM data were analysed similar to Mattila et al, 2013; with MATLAB (The MathWorks, Natick, MA). Single‐particle tracking data were analysed as described in Treanor et al, 2010; and confinement size was calculated as described in Mattila et al, 2013.
Dual‐view TIRF image sequences were analysed in MATLAB. Images were split into the two channels, and one of the channels was transformed using a 2D spatial transformation with bicubic interpolation. Reference images with multicoloured beads (TetraSpeck 0.2 μm, Life technologies) were used to infer the spatial transformation from reference points given by the bead positions. This transformation accounts for translation, rotation and different scaling between the two channels.
To identify regions of high actin content, TIRFM images were time‐averaged over five frames to improve the signal to noise ratio and spatially band‐pass filtered to retain features between 1 and 4 pixels. A binary image was then obtained by application of a threshold determined by Otsu's method (Otsu, 1979). Regions above the threshold are used to identify areas of high actin content in the original image. After excluding a region of 10 pixel width around the cell edge from the analysis, this led to 20% of the remaining area identified as actin rich. Single‐particle tracks, measured in the other channel, were then classified as being inside or outside actin‐rich regions, depending on the region the tracks spend the more time in. For each position in each track, the actin intensity in an area of 9 pixels centred on the individual position was measured and compared the same number of random positions on the same cell. As actin intensities vary between the cells, the values from different cells were normalized so that the average intensity in the actin‐rich regions corresponds to a value of one and the average for actin low regions corresponds to zero.
Cell stimulation and immunoblotting
Primary naïve B cells or A20 B cells were equilibrated in imaging buffer at 37°C for 10 min and then 5 μg/ml of anti‐kappa antibody, 1 μM LatA, 10 μM CytoD or DMSO pre‐warmed in PBS was added for the indicated time. Cells were lysed in 1% NP‐40 buffer and analysed by SDS–PAGE followed by immunoblotting with indicated antibodies. Anti‐phospho‐Lyn (Y507), anti‐phospho‐ERK, anti‐phospho‐Akt (Ser473), anti‐phospho‐Syk, anti‐phospho‐PLCγ2, anti‐phospho‐CD19, anti‐phospho‐SHP‐1 and anti‐ERK were all from Cell Signaling. Anti‐phospho‐CD22 (12a/CD22, p‐Y822) was from BD Bioscience and rabbit anti‐CD22 was from L. Nitschke, University of Erlangen, Erlangen, Germany. Anti‐tubulin and anti‐actin were purchased from Sigma. Goat anti‐kappa was from Southern Biotech.
Flow cytometry
Staining was done using anti‐IgM (R6‐60.2), anti‐IgD (11‐26c), anti‐CD19 (1D3 and 6D5), anti‐CD22 (Cy43.1) or anti‐B220 (RA3‐6B2) antibodies conjugated with APC, FITC or PE, all from BD Bioscience. The counting of the number of BCRs, CD19 and CD22 was done as previously described (Mattila et al, 2013). Briefly, receptor staining was done using PE‐conjugated rat IgG2a anti‐mouse monoclonal antibodies (11‐26c for IgD, R6‐60.2 for IgM, 1D3 for CD19 from BD Bioscience and clone 308501 for CD22 from R&D) and Quantum TM Simply Cellular Kit for standardization (Bangs Laboratories, Inc.) according to the manufacturer's instructions. For phosphoflow, the antibodies against phospho‐ERK and phospho‐Akt (Cell Signaling) were detected by Alexa 488‐conjugated anti‐rabbit IgG secondary antibody according to the Cell Signaling phosphoflow protocol. Intracellular actin staining was performed using Alexa Fluor 488 phalloidin (Molecular Probes). All data were collected on a LSR Fortessa flow cytometer (Becton Dickinson) and analysed using FlowJo software (TreeStar).
Ca2+ influx assay by flow cytometry
For intracellular Ca2+, primary naïve B cells were preloaded with 3 μM Indo‐1 AM (Molecular Probes, Invitrogen) in RPMI at 37°C for 30 min. After collecting a baseline reading for 25 s, 5 μg/ml of anti‐kappa antibody, 1 μM LatA or DMSO was added to the cells in the presence or not of the inhibitors PP2 and BAY‐3606, and the ratio of fluorescence (405/525 nm) was determined for 300 s on a LSR Fortessa flow cytometer (Becton Dickinson).
2D representation
The goal of the graphic 2D representation is to visualize the high‐density and clustered distribution of the molecules on the membrane. To this end, we generated an array in MATLAB that represents a 1,000 nm × 1,000 nm grid with 1‐nm spacing. On this grid, molecules could be positioned on coordinates that are multiples of 10 nm, for example at x = 820 nm and y = 350 nm, but not x = 828 nm and y = 343 nm. The reason is that we wanted to rule out any overlap of molecules and that we set the diameter of IgD/M to be 10 nm and of CD22/19 to be 5 nm. The total numbers of receptors in the simulated 1,000 nm × 1,000 nm area are taken from the bead‐based counting assay experiment in Fig 2:
IgD: 1820, IgM: 250, CD19: 560, CD22: 410.
In the first step, a number of cluster seeds for every molecular species are randomly placed onto the grid. The numbers of seeds were chosen to be:
IgD: 25, IgM: 20, CD19: 16, CD22: 12.
Then, the remaining molecules of each species are placed onto the grid, each species having a fixed probability to attach to an existing cluster of the species. When all the positions of the molecules are determined, filled circles of 10 nm diameter (IgD/M) and 5 nm diameter (CD19/22) are drawn onto the 1,000 nm × 1,000 nm grid at these positions. For a random distribution of molecules as shown in Fig 4A, the probability of attachment is set to zero. To achieve distributions (Fig 4B and C) that resemble those observed via dSTORM, the probabilities of attachment were chosen to be:
IgD: 0.95, IgM: 0.5, CD19: 0.75, CD22: 0.92.
These probabilities were found to generate clustered distributions that visually resemble those observed in dSTORM.
In silico model of receptor diffusion and area covered
The goal of this computational model is to compare the area covered by diffusing nanoclusters over time. It builds on the graphic 2D representation presented above. We concentrated on the coreceptor CD22 and the dominant isotype of the BCR; IgD.
Receptors were distributed as described above on a grid with 10‐nm spacing and with side length of 3 μm. The resulting distribution of receptors was dilated (using MATLAB's imdilate function) to join neighbouring receptors and their connecting pixels into nanoclusters. These clusters were identified by the regionsprops function, which allows easy access to the coordinates of individual nanoclusters. This process also means that nanoclusters do not contain only receptors but also “free” connecting pixels between individual constituent molecules.
To visualize how these generated distributions of receptors would appear under the microscope using different technologies, the clusters were smeared further with a Gaussian‐blur filter. The filter's sigma value was adjusted to account for approximately 30 nm (dSTORM) and 120 nm (SIM) localization precision.
In the dynamic part, nanoclusters could undergo unrestricted Brownian motion. For every nanocluster in every time step, a step length was calculated based on an exponential distribution of diffusion coefficients with a preset median diffusion coefficient. Such an exponential distribution best resembles the previously observed data, that is distributions of diffusion coefficients. In Fig 4, we chose to simulate speeds that spanned the spectrum of diffusion coefficients observed in our laboratory in single‐particle tracking experiments, from 0.005 μm2/s (IgD) to 0.100 μm2/s (MHCII) (Treanor et al, 2010).
In every time step, the positions covered by nanoclusters were recorded and then summed cumulatively to represent the covered area over time. Nanocluster diffusion and area covered were analysed in a central square of 2 μm side length to minimize boundary effects. Seven runs were performed per condition, and the total running time was 1 s.
Statistical analysis
Sample sizes were chosen on the basis of published work in which similar phenotypical characterization and similar defects were reported. The sample size for diffusion analysis and confinement size were chosen as 300 and 100, respectively, to detect an effect size of 20% with power of 90%. For Hopkins index analysis, sample sizes were chosen to detect an effect size of 5% with power of 90%, and these calculations were performed using the MATLAB statistics toolbox. Cohort randomization or “blinding” of investigators to sample identity was not done in this study. In some experiments, the data for each study group were compared with Student's t‐test and P‐values were calculated. Normal distribution of samples was assumed on the basis of published studies with analysis similar to ours.
Code availability
The computer code for the simulations can be accessed by contacting the corresponding author.
Author contributions
FG and CF designed and performed the experiments, analysed the data and wrote the paper. AB assisted with microscopy, data analysis and contributed to the discussion and preparation of the manuscript. PM contributed to the discussion. LN contributed to the discussion and, with JM, kindly provided CD22‐KO, CD22‐Y5,6F, CD22‐Y2,5,6F and CD22‐R130E bone marrow cells. DB provided his expertise for computational experiments. FDB conceived of the study and prepared the manuscript.
Conflict of interest
The authors declare that they have no conflict of interest.
Supporting information
Expanded View Figures PDF
Source Data for Expanded View
Movie EV1
Movie EV2
Movie EV3
Movie EV4
Review Process File
Source Data for Figure 1
Source Data for Figure 6
Source Data for Figure 7
Acknowledgements
We thank NE. Harwood and JA. Coleman (The Francis Crick Institute) for edition of the manuscript. We thank B. Montaner (The Francis Crick Institute) for help with breeding and maintenance of the mouse colony. We thank all the members of the Lymphocyte Interaction Laboratory for critically reading of the manuscript. This work was supported by Cancer Research UK, Institute Pasteur‐Fondazione Cenci Bolognetti (FG.) and Royal Society Wolfson Research Merit Award (FDB.).
The EMBO Journal (2016) 35: 258–280
See also: D Depoil & ML Dustin (February 2016)
References
- Adachi T, Harumiya S, Takematsu H, Kozutsumi Y, Wabl M, Fujimoto M, Tedder TF (2012) CD22 serves as a receptor for soluble IgM. Eur J Immunol 42: 241–247 [DOI] [PubMed] [Google Scholar]
- Andrews NL, Lidke KA, Pfeiffer JR, Burns AR, Wilson BS, Oliver JM, Lidke DS (2008) Actin restricts FcepsilonRI diffusion and facilitates antigen‐induced receptor immobilization. Nat Cell Biol 10: 955–963 [DOI] [PMC free article] [PubMed] [Google Scholar]
- Batista FD, Neuberger MS (1998) Affinity dependence of the B cell response to antigen: a threshold, a ceiling, and the importance of off‐rate. Immunity 8: 751–759 [DOI] [PubMed] [Google Scholar]
- Benatar T, Carsetti R, Furlonger C, Kamalia N, Mak T, Paige CJ (1996) Immunoglobulin‐mediated signal transduction in B cells from CD45‐deficient mice. J Exp Med 183: 329–334 [DOI] [PMC free article] [PubMed] [Google Scholar]
- Carrasco YR, Fleire SJ, Cameron T, Dustin ML, Batista FD (2004) LFA‐1/ICAM‐1 interaction lowers the threshold of B cell activation by facilitating B cell adhesion and synapse formation. Immunity 20: 589–599 [DOI] [PubMed] [Google Scholar]
- Collins BE, Blixt O, Bovin NV, Danzer C‐P, Chui D, Marth JD, Nitschke L, Paulson JC (2002) Constitutively unmasked CD22 on B cells of ST6Gal I knockout mice: novel sialoside probe for murine CD22. Glycobiology 12: 563–571 [DOI] [PubMed] [Google Scholar]
- Collins BE, Blixt O, DeSieno AR, Bovin N, Marth JD, Paulson JC (2004) Masking of CD22 by cis ligands does not prevent redistribution of CD22 to sites of cell contact. Proc Natl Acad Sci USA 101: 6104–6109 [DOI] [PMC free article] [PubMed] [Google Scholar]
- Collins BE, Blixt O, Han S, Duong B, Li H, Nathan JK, Bovin N, Paulson JC (2006) High‐affinity ligand probes of CD22 overcome the threshold set by cis ligands to allow for binding, endocytosis, and killing of B cells. J Immunol 177: 2994–3003 [DOI] [PubMed] [Google Scholar]
- Collins BE, Smith BA, Bengtson P, Paulson JC (2005) Ablation of CD22 in ligand‐deficient mice restores B cell receptor signaling. Nat Immunol 7: 199–206 [DOI] [PubMed] [Google Scholar]
- Cordoba S‐P, Choudhuri K, Zhang H, Bridge M, Basat AB, Dustin ML, van der Merwe PA (2013) The large ectodomains of CD45 and CD148 regulate their segregation from and Inhibition of ligated T‐cell receptor. Blood 121: 4295–4302 [DOI] [PMC free article] [PubMed] [Google Scholar]
- Cornall RJ, Cyster JG, Hibbs ML, Dunn AR, Otipoby KL, Clark EA, Goodnow CC (1998) Polygenic autoimmune traits: Lyn, CD22, and SHP‐1 are limiting elements of a biochemical pathway regulating BCR signaling and selection. Immunity 8: 497–508 [DOI] [PubMed] [Google Scholar]
- Crocker PR, Vinson M, Kelm S, Drickamer K (1999) Molecular analysis of sialoside binding to sialoadhesin by NMR and site‐directed mutagenesis. Biochem J 341(Pt 2): 355–361 [PMC free article] [PubMed] [Google Scholar]
- Cyster JG, Goodnow CC (1995) Protein tyrosine phosphatase 1C negatively regulates antigen receptor signaling in B lymphocytes and determines thresholds for negative selection. Immunity 2: 13–24 [DOI] [PubMed] [Google Scholar]
- Cyster JG, Healy JI, Kishihara K, Mak TW, Thomas ML, Goodnow CC (1996) Regulation of B‐lymphocyte negative and positive selection by tyrosine phosphatase CD45. Nature 381: 325–328 [DOI] [PubMed] [Google Scholar]
- Cyster JG, Goodnow CC (1997) Tuning antigen receptor signaling by CD22: integrating cues from antigens and the microenvironment. Immunity 6: 509–517 [DOI] [PubMed] [Google Scholar]
- Danzer C‐P, Collins BE, Blixt O, Paulson JC, Nitschke L (2003) Transitional and marginal zone B cells have a high proportion of unmasked CD22: implications for BCR signaling. Int Immunol 15: 1137–1147 [DOI] [PubMed] [Google Scholar]
- D'Arena G, Musto P, Cascavilla N, Dell'Olio M, Di Renzo N, Carotenuto M (2000) Quantitative flow cytometry for the differential diagnosis of leukemic B‐cell chronic lymphoproliferative disorders. Am J Hematol 64: 275–281 [DOI] [PubMed] [Google Scholar]
- Depoil D, Fleire S, Treanor BL, Weber M, Harwood NE, Marchbank KL, Tybulewicz VLJ, Batista FD (2008) CD19 is essential for B cell activation by promoting B cell receptor‐antigen microcluster formation in response to membrane‐bound ligand. Nat Immunol 9: 63–72 [DOI] [PubMed] [Google Scholar]
- Doody GM, Justement LB, Delibrias CC, Matthews RJ, Lin J, Thomas ML, Fearon DT (1995) A role in B cell activation for CD22 and the protein tyrosine phosphatase SHP. Science 269: 242–244 [DOI] [PubMed] [Google Scholar]
- Greer SF, Justement LB (1999) CD45 regulates tyrosine phosphorylation of CD22 and its association with the protein tyrosine phosphatase SHP‐1. J Immunol 162: 5278–5286 [PubMed] [Google Scholar]
- Grewal PK, Boton M, Ramirez K, Collins BE, Saito A, Green RS, Ohtsubo K, Chui D, Marth JD (2006) ST6Gal‐I restrains CD22‐dependent antigen receptor endocytosis and Shp‐1 recruitment in normal and pathogenic immune signaling. Mol Cell Biol 26: 4970–4981 [DOI] [PMC free article] [PubMed] [Google Scholar]
- Gustafsson MGL, Shao L, Carlton PM, Wang CJR, Golubovskaya IN, Cande WZ, Agard DA, Sedat JW (2008) Three‐dimensional resolution doubling in wide‐field fluorescence microscopy by structured illumination. Biophys J 94: 4957–4970 [DOI] [PMC free article] [PubMed] [Google Scholar]
- Han S, Collins BE, Bengtson P, Paulson JC (2005) Homomultimeric complexes of CD22 in B cells revealed by protein‐glycan cross‐linking. Nat Chem Biol 1: 93–97 [DOI] [PubMed] [Google Scholar]
- Hanasaki K, Powell LD, Varki A (1995) Binding of human plasma sialoglycoproteins by the B cell‐specific lectin CD22. Selective recognition of immunoglobulin M and haptoglobin. J Biol Chem 270: 7543–7550 [DOI] [PubMed] [Google Scholar]
- Harris LJ, Skaletsky E, McPherson A (1998) Crystallographic structure of an intact IgG1 monoclonal antibody. J Mol Biol 275: 861–872 [DOI] [PubMed] [Google Scholar]
- Heilemann M, van de Linde S, Schüttpelz M, Kasper R, Seefeldt B, Mukherjee A, Tinnefeld P, Sauer M (2008) Subdiffraction‐Resolution Fluorescence Imaging with Conventional Fluorescent Probes. Angew Chem Int Ed 47: 6172–6176 [DOI] [PubMed] [Google Scholar]
- Hennet T, Chui D, Paulson JC, Marth JD (1998) Immune regulation by the ST6Gal sialyltransferase. Proc Natl Acad Sci USA 95: 4504–4509 [DOI] [PMC free article] [PubMed] [Google Scholar]
- Hermiston ML, Xu Z, Weiss A (2003) CD45: a critical regulator of signaling thresholds in immune cells. Annu Rev Immunol 21: 107–137 [DOI] [PubMed] [Google Scholar]
- Hermiston ML, Tan AL, Gupta VA, Majeti R, Weiss A (2005) The juxtamembrane wedge negatively regulates CD45 function in B cells. Immunity 23: 635–647 [DOI] [PubMed] [Google Scholar]
- Jellusova J, Nitschke L (2012) Regulation of B cell functions by the sialic acid‐binding receptors siglec‐G and CD22. Front Immunol 2: 1–96 [DOI] [PMC free article] [PubMed] [Google Scholar]
- Jin L, McLean PA, Neel BG, Wortis HH (2002) Sialic acid binding domains of CD22 are required for negative regulation of B cell receptor signaling. J Exp Med 195: 1199–1205 [DOI] [PMC free article] [PubMed] [Google Scholar]
- Kelm S, Gerlach J, Brossmer R, Danzer C‐P, Nitschke L (2002) The ligand‐binding domain of CD22 is needed for inhibition of the B cell receptor signal, as demonstrated by a novel human CD22‐specific inhibitor compound. J Exp Med 195: 1207–1213 [DOI] [PMC free article] [PubMed] [Google Scholar]
- Kitamura D, Roes J, Kühn R, Rajewsky K (1991) A B cell‐deficient mouse by targeted disruption of the membrane exon of the immunoglobulin mu chain gene. Nature 350: 423–426 [DOI] [PubMed] [Google Scholar]
- Kläsener K, Maity PC, Hobeika E, Yang J, Reth M (2014) B cell activation involves nanoscale receptor reorganizations and inside‐out signaling by Syk. Elife 3: e02069 [DOI] [PMC free article] [PubMed] [Google Scholar]
- Kurosaki T (2002) Regulation of B cell fates by BCR signaling components. Curr Opin Immunol 14: 341–347 [DOI] [PubMed] [Google Scholar]
- Kusumi A, Sako Y, Yamamoto M (1993) Confined lateral diffusion of membrane receptors as studied by single particle tracking (nanovid microscopy). Effects of calcium‐induced differentiation in cultured epithelial cells. Biophys J 65: 2021–2040 [DOI] [PMC free article] [PubMed] [Google Scholar]
- Kusumi A, Nakada C, Ritchie K, Murase K, Suzuki K, Murakoshi H, Kasai RS, Kondo J, Fujiwara T (2005) Paradigm shift of the plasma membrane concept from the two‐dimensional continuum fluid to the partitioned fluid: high‐speed single‐molecule tracking of membrane molecules. Annu Rev Biophys Biomol Struct 34: 351–378 [DOI] [PubMed] [Google Scholar]
- Lam KP, Kühn R, Rajewsky K (1997) In vivo ablation of surface immunoglobulin on mature B cells by inducible gene targeting results in rapid cell death. Cell 90: 1073–1083 [DOI] [PubMed] [Google Scholar]
- Lanoue A, Batista FD, Stewart M, Neuberger MS (2002) Interaction of CD22 with alpha2,6‐linked sialoglycoconjugates: innate recognition of self to dampen B cell autoreactivity? Eur J Immunol 32: 348–355 [DOI] [PubMed] [Google Scholar]
- Law CL, Sidorenko SP, Chandran KA, Zhao Z, Shen SH, Fischer EH, Clark EA (1996) CD22 associates with protein tyrosine phosphatase 1C, Syk, and phospholipase C‐gamma(1) upon B cell activation. J Exp Med 183: 547–560 [DOI] [PMC free article] [PubMed] [Google Scholar]
- Leprince C, Draves KE, Geahlen RL, Ledbetter JA, Clark EA (1993) CD22 associates with the human surface IgM‐B‐cell antigen receptor complex. Proc Natl Acad Sci USA 90: 3236–3240 [DOI] [PMC free article] [PubMed] [Google Scholar]
- Lillemeier BF, Pfeiffer JR, Surviladze Z, Wilson BS, Davis MM (2006) Plasma membrane‐associated proteins are clustered into islands attached to the cytoskeleton. Proc Natl Acad Sci USA 103: 18992–18997 [DOI] [PMC free article] [PubMed] [Google Scholar]
- Lillemeier BF, Mörtelmaier MA, Forstner MB, Huppa JB, Groves JT, Davis MM (2010) TCR and Lat are expressed on separate protein islands on T cell membranes and concatenate during activation. Nat Immunol 11: 90–96 [DOI] [PMC free article] [PubMed] [Google Scholar]
- Mattila PK, Feest C, Depoil D, Treanor B, Montaner B, Otipoby KL, Carter R, Justement LB, Bruckbauer A, Batista FD (2013) The actin and tetraspanin networks organize receptor nanoclusters to regulate B cell receptor‐mediated signaling. Immunity 38: 461–474 [DOI] [PubMed] [Google Scholar]
- van der Merwe PA, Crocker PR, Vinson M, Barclay AN, Schauer R, Kelm S (1996) Localization of the putative sialic acid‐binding site on the immunoglobulin superfamily cell‐surface molecule CD22. J Biol Chem 271: 9273–9280 [PubMed] [Google Scholar]
- Müller J, Obermeier I, Wöhner M, Brandl C, Mrotzek S, Angermüller S, Maity PC, Reth M, Nitschke L (2013) CD22 ligand‐binding and signaling domains reciprocally regulate B‐cell Ca2 + signaling. Proc Natl Acad Sci USA 110: 12402–12407 [DOI] [PMC free article] [PubMed] [Google Scholar]
- Nitschke L, Carsetti R, Ocker B, Köhler G, Lamers MC (1997) CD22 is a negative regulator of B‐cell receptor signalling. Curr Biol 7: 133–143 [DOI] [PubMed] [Google Scholar]
- Nitschke L (2005) The role of CD22 and other inhibitory co‐receptors in B‐cell activation. Curr Opin Immunol 17: 290–297 [DOI] [PubMed] [Google Scholar]
- O'Keefe TL, Williams GT, Davies SL, Neuberger MS (1996) Hyperresponsive B cells in CD22‐deficient mice. Science 274: 798–801 [DOI] [PubMed] [Google Scholar]
- O'Keefe TL, Williams GT, Batista FD, Neuberger MS (1999) Deficiency in CD22, a B cell‐specific inhibitory receptor, is sufficient to predispose to development of high affinity autoantibodies. J Exp Med 189: 1307–1313 [DOI] [PMC free article] [PubMed] [Google Scholar]
- Otipoby KL, Andersson KB, Draves KE, Klaus SJ, Farr AG, Kerner JD, Perlmutter RM, Law C‐L, Clark EA (1996) CD22 regulates thymus‐independent responses and the lifespan of B cells. Nature 384: 634–637 [DOI] [PubMed] [Google Scholar]
- Otipoby KL, Draves KE, Clark EA (2001) CD22 regulates B cell receptor‐mediated signals via two domains that independently recruit Grb2 and SHP‐1. J Biol Chem 276: 44315–44322 [DOI] [PubMed] [Google Scholar]
- Otsu N (1979) A threshold selection method from gray‐level histograms. IEEE Trans Sys Man Cyber 9: 62–66 [Google Scholar]
- Pani G, Siminovitch KA, Paige CJ (1997) The motheaten mutation rescues B cell signaling and development in CD45‐deficient mice. J Exp Med 186: 581–588 [DOI] [PMC free article] [PubMed] [Google Scholar]
- Peaker CJ, Neuberger MS (1993) Association of CD22 with the B cell antigen receptor. Eur J Immunol 23: 1358–1363 [DOI] [PubMed] [Google Scholar]
- Poe JC, Fujimoto M, Jansen PJ, Miller AS, Tedder TF (2000) CD22 Forms a Quaternary Complex with SHIP, Grb2, and Shc: a PATHWAY FOR REGULATION OF B LYMPHOCYTE ANTIGEN RECEPTOR‐INDUCED CALCIUM FLUX. J Biol Chem 275: 17420–17427 [DOI] [PubMed] [Google Scholar]
- Poe JC, Fujimoto Y, Hasegawa M, Haas KM, Miller AS, Sanford IG, Bock CB, Fujimoto M, Tedder TF (2004) CD22 regulates B lymphocyte function in vivo through both ligand‐dependent and ligand‐independent mechanisms. Nat Immunol 5: 1078–1087 [DOI] [PubMed] [Google Scholar]
- Powell LD, Sgroi D, Sjoberg ER, Stamenkovic I, Varki A (1993) Natural ligands of the B cell adhesion molecule CD22 beta carry N‐linked oligosaccharides with alpha‐2,6‐linked sialic acids that are required for recognition. J Biol Chem 268: 7019–7027 [PubMed] [Google Scholar]
- Rajewsky K (1996) Clonal selection and learning in the antibody system. Nature 381: 751–758 [DOI] [PubMed] [Google Scholar]
- Razi N, Varki A (1998) Masking and unmasking of the sialic acid‐binding lectin activity of CD22 (Siglec‐2) on B lymphocytes. Proc Natl Acad Sci USA 95: 7469–7474 [DOI] [PMC free article] [PubMed] [Google Scholar]
- Reth M (1989) Antigen receptor tail clue. Nature 338: 383–384 [PubMed] [Google Scholar]
- Riedl J, Crevenna AH, Kessenbrock K, Yu JH, Neukirchen D, Bista M, Bradke F, Jenne D, Holak TA, Werb Z, Sixt M, Wedlich‐Soldner R (2008) Lifeact: a versatile marker to visualize F‐actin. Nat Meth 5: 605–607 [DOI] [PMC free article] [PubMed] [Google Scholar]
- Sato S, Miller AS, Inaoki M, Bock CB, Jansen PJ, Tang ML, Tedder TF (1996) CD22 is both a positive and negative regulator of B lymphocyte antigen receptor signal transduction: altered signaling in CD22‐deficient mice. Immunity 5: 551–562 [DOI] [PubMed] [Google Scholar]
- Schamel WW, Reth M (2000) Monomeric and oligomeric complexes of the B cell antigen receptor. Immunity 13: 5–14 [DOI] [PubMed] [Google Scholar]
- Schamel WWA, Arechaga I, Risueño RM, van Santen HM, Cabezas P, Risco C, Valpuesta JM, Alarcón B (2005) Coexistence of multivalent and monovalent TCRs explains high sensitivity and wide range of response. J Exp Med 202: 493–503 [DOI] [PMC free article] [PubMed] [Google Scholar]
- Schulte RJ, Campbell MA, Fischer WH, Sefton BM (1992) Tyrosine phosphorylation of CD22 during B cell activation. Science 258: 1001–1004 [DOI] [PubMed] [Google Scholar]
- Schütz GJ, Kada G, Pastushenko VP, Schindler H (2000) Properties of lipid microdomains in a muscle cell membrane visualized by single molecule microscopy. EMBO J 19: 892–901 [DOI] [PMC free article] [PubMed] [Google Scholar]
- Sengupta P, Jovanovic‐Talisman T, Skoko D, Renz M, Veatch SL, Lippincott‐Schwartz J (2011) Probing protein heterogeneity in the plasma membrane using PALM and pair correlation analysis. Nat Meth 8: 969–975 [DOI] [PMC free article] [PubMed] [Google Scholar]
- Sherbina NV, Linsley PS, Myrdal S, Grosmaire LS, Ledbetter JA, Schieven GL (1996) Intracellular CD22 rapidly moves to the cell surface in a tyrosine kinase‐dependent manner following antigen receptor stimulation. J Immunol 157: 4390–4398 [PubMed] [Google Scholar]
- Smith KG, Tarlinton DM, Doody GM, Hibbs ML, Fearon DT (1998) Inhibition of the B cell by CD22: a requirement for Lyn. J Exp Med 187: 807–811 [DOI] [PMC free article] [PubMed] [Google Scholar]
- Stamenkovic I, Sgroi D, Aruffo A, Sy MS, Anderson T (1991) The B lymphocyte adhesion molecule CD22 interacts with leukocyte common antigen CD45RO on T cells and alpha 2‐6 sialyltransferase, CD75, on B cells. Cell 66: 1133–1144 [DOI] [PubMed] [Google Scholar]
- Tan YX, Manz BN, Freedman TS, Zhang C, Shokat KM, Weiss A (2014) Inhibition of the kinase Csk in thymocytes reveals a requirement for actin remodeling in the initiation of full TCR signaling. Nat Immunol 15: 186–194 [DOI] [PMC free article] [PubMed] [Google Scholar]
- Tolar P, Sohn HW, Pierce SK (2005) The initiation of antigen‐induced B cell antigen receptor signaling viewed in living cells by fluorescence resonance energy transfer. Nat Immunol 6: 1168–1176 [DOI] [PubMed] [Google Scholar]
- Tolar P, Hanna J, Krueger PD, Pierce SK (2009) The constant region of the membrane immunoglobulin mediates B cell‐receptor clustering and signaling in response to membrane antigens. Immunity 30: 44–55 [DOI] [PMC free article] [PubMed] [Google Scholar]
- Treanor B, Depoil D, Gonzalez‐Granja A, Barral P, Weber M, Dushek O, Bruckbauer A, Batista FD (2010) The membrane skeleton controls diffusion dynamics and signaling through the B cell receptor. Immunity 32: 187–199 [DOI] [PMC free article] [PubMed] [Google Scholar]
- Umemura YM, Vrljic M, Nishimura SY, Fujiwara TK, Suzuki KGN, Kusumi A (2008) Both MHC class II and its GPI‐anchored form undergo hop diffusion as observed by single‐molecule tracking. Biophys J 95: 435–450 [DOI] [PMC free article] [PubMed] [Google Scholar]
- Vrljic M, Nishimura SY, Brasselet S, Moerner WE, McConnell HM (2002) Translational diffusion of individual class II MHC membrane proteins in cells. Biophys J 83: 2681–2692 [DOI] [PMC free article] [PubMed] [Google Scholar]
- Wade WF, Freed JH, Edidin M (1989) Translational diffusion of class II major histocompatibility complex molecules is constrained by their cytoplasmic domains. J Cell Biol 109: 3325–3331 [DOI] [PMC free article] [PubMed] [Google Scholar]
- Weiss A, Littman DR (1994) Signal transduction by lymphocyte antigen receptors. Cell 76: 263–274 [DOI] [PubMed] [Google Scholar]
- Wienands J, Larbolette O, Reth M (1996) Evidence for a preformed transducer complex organized by the B cell antigen receptor. Proc Natl Acad Sci USA 93: 7865–7870 [DOI] [PMC free article] [PubMed] [Google Scholar]
- Wilson BS, Pfeiffer JR, Oliver JM (2000) Observing FcepsilonRI signaling from the inside of the mast cell membrane. J Cell Biol 149: 1131–1142 [DOI] [PMC free article] [PubMed] [Google Scholar]
- Zhang J, Leiderman K, Pfeiffer JR, Wilson BS, Oliver JM, Steinberg SL (2006) Characterizing the topography of membrane receptors and signaling molecules from spatial patterns obtained using nanometer‐scale electron‐dense probes and electron microscopy. Micron 37: 14–34 [DOI] [PubMed] [Google Scholar]
Associated Data
This section collects any data citations, data availability statements, or supplementary materials included in this article.
Supplementary Materials
Expanded View Figures PDF
Source Data for Expanded View
Movie EV1
Movie EV2
Movie EV3
Movie EV4
Review Process File
Source Data for Figure 1
Source Data for Figure 6
Source Data for Figure 7