Abstract
Mammalian E3 is an essential mitochondrial enzyme responsible for catalyzing the terminal reaction in the oxidative catabolism of several metabolites. E3 is a key regulator of metabolic fuel selection as a component of the pyruvate dehydrogenase complex (PDHc). E3 regulates PDHc activity by altering the affinity of pyruvate dehydrogenase kinase, an inhibitor of the enzyme complex, through changes in reduction and acetylation state of lipoamide moieties set by the NAD+/NADH ratio. Thus, an accurate kinetic model of E3 is needed to predict overall mammalian PDHc activity. Here, we have combined numerous literature data sets and new equilibrium spectroscopic experiments with a multitude of independently collected forward and reverse steady-state kinetic assays using pig heart E3. The latter kinetic assays demonstrate a pH-dependent transition of NAD+ activation to inhibition, shown here, to our knowledge, for the first time in a single consistent data set. Experimental data were analyzed to yield a thermodynamically constrained four-redox-state model of E3 that simulates pH-dependent activation/inhibition and active site redox states for various conditions. The developed model was used to determine substrate/product conditions that give maximal E3 rates and show that, due to non-Michaelis-Menten behavior, the maximal flux is different compared with the classically defined kcat.
Keywords: enzyme kinetics, flavoprotein, mathematical modeling, mitochondrial metabolism, pyruvate dehydrogenase complex (PDC), global fitting, kcat
Introduction
Dihydrolipoamide dehydrogenase (E3) is one of three catalytic subunits (E1, E2, and E3) found in a number of multienzyme catabolic complexes (1). E3 is responsible for catalyzing the terminal redox reaction, which is the reversible two-electron oxidation of dihydrolipoamide to lipoamide with the concomitant reduction of NAD+ to NADH (2–4). E3 is a component of the pyruvate dehydrogenase complex (PDHc),2 which oxidizes pyruvate to produce CO2, acetyl-CoA, and NADH (5). The PDHc is at the interface of glycolysis, the tricarboxylic acid cycle, and is reciprocally regulated relative to fatty acid β-oxidation (6, 7).
Its hub-like position in central metabolic pathways has endowed the PDHc with a major regulatory role in mammals with links to metabolic maladaptations (8) related to heart failure (9–11), diabetes (12, 13), and the Warburg effect in cancer cells (14–16). An imbalance between glucose/fatty acid substrate selection is a hallmark of the aforementioned diseased states (6, 17). The PDHc is also known to be a critical factor in substrate selection, which is modulated by multiple factors (13, 18).
Mammalian PDHc regulation is governed in large part by its own specific pyruvate dehydrogenase kinase (PDK) and phosphatase (PDP) (19–21). PDK and PDP bind to the lipoamide-containing L sites (22–25) located on E2 and the E3-binding protein, a PDHc structural subunit. PDK binding, and thus PDHc activity, is greatly affected by the redox and acetylation state of lipoamide. When reduced, acetylated lipoamide moieties favor PDK binding (23, 24, 26, 27). The redox state of lipoamide moieties in E2 and the E3-binding protein is governed by the forward reductive acetylation activity of E1 and the NADH/lipoamide activity of E3. It has been postulated that E3 activity has primary kinetic control of the lipoamide redox state, because E1 activity is rate-limiting for the overall PDHc reaction (8). Thus, PDK/PDHc regulation via the NAD+/NADH ratio, a general indicator of intracellular redox (28) and bioenergetic status (29), is mediated through the E3 component of the complex.
In vitro E3 component kinetics and redox regulation have been studied from multiple organisms and have demonstrated similar kinetic patterns but with remarkably different regulatory sensitivities to NAD+/NADH ratio and pH (30–34). Mammalian and bacterial E3 components are the most disparate examples, with E3 from Escherichia coli demonstrating the greatest observed NAD+/NADH catalytic sensitivity (30). Greater NAD+/NADH sensitivity in E. coli E3 (Ec-E3) may be reasoned from a regulatory standpoint because E. coli PDHc lacks the PDK/PDP enzymes, which provide another layer of PDHc regulation in mammals (5, 35). Despite smaller NAD+/NADH kinetic effects in mammalian versus bacterial E3s, PDK activity in the mammalian PDHc is very sensitive to NAD+/NADH (26, 36, 37), mediated through E3.
NAD+/NADH effects are intimately related to pH, as they may be more appropriately modeled as the ratio of NAD+/(NADH + H+), due to the release of a proton during NAD+ reduction (38). Thus, E3 NAD+/NADH regulation is pH-dependent. The reverse E3 reaction consumes NADH, lipoamide, and H+, while producing NAD+ and dihydrolipoamide. Typically, in the reverse direction, initial amounts of added NAD+ to in vitro assays provide an activating effect in acidic pH (30, 39, 40), whereas, ever increasing amounts of NADH cause E3 substrate inhibition (30). These observations span mammalian and bacterial E3s but are most prominent in the archetypical bacterial E3 from E. coli. Although the magnitude of NAD+/(NADH + H+) kinetic regulation differs from E. coli (30), human (33), rat (34), and spinach enzymes (32), we have previously shown that these differences are explained by a single thermodynamically constrained model (41).
Prior E3 analysis (41) demonstrates that NAD+ is mainly an activator in the reverse reaction, with E. coli (30), spinach (32), and human liver (33). Reed (34) also showed, using rat liver E3, that varying amounts of NAD+ lead to kinetic patterns deviating from a simple ping-pong mechanism (34).
Even though the rat liver E3 kinetic study showed no NAD+ activation (34), NAD+ activation was demonstrated with human liver E3 enzyme (33, 41). Interestingly, NAD+ activation was also reported early on by Massey and Veeger (39) using pig heart E3, but little primary data were shown. Muiswinkel-Voetberg and Veeger (40) demonstrated the pH dependence of the initial velocity of pig heart E3 with the reverse reaction and showed activation of the rates by adding 0.1 mm NAD+. However, these data did not include physiologically relevant pH ranges (pH ≥ 7).
There are other available data on the pH-dependent regulation of mammalian E3 (mam-E3) (42–47); however, none address the NAD+ pH-dependent kinetic regulation. After modeling E3 kinetic data from a number of organisms, we found that lacking mam-E3 data, especially reverse progress curve type data and NAD+/(NADH + H+) effects, weakened mam-E3 model parameterization and predictability in physiological conditions (41).
Therefore, we have collected a large array of pH-dependent progress curves and initial velocity data, in the reverse direction, using different amounts of NAD+ and lipoamide with pig heart E3. We also include independent data sets with the forward reaction that vary pH, NAD+, and dihydrolipoamide. Furthermore, we use spectroscopic methods to determine the redox state of the enzyme through FAD absorbance and fluorescence to gain further insight into E3 regulation.
Efforts to globally fit this data set with our previously defined model (41) revealed the need to modify the model. The result is a new 4-state thermodynamically constrained redox model of pig heart E3, which is able to reproduce a wide array of kinetic and equilibrium data. A unique example includes progress curves demonstrating, to our knowledge for the first time, both reverse E3 acidic NAD+ activation and alkaline NAD+ inhibition in a single consistent data set.
We also demonstrate the physiological kinetic reversibility of E3, which supports E3 kinetic control over the PDHc. Furthermore, in light of the observed non-Michaelis-Menten behavior of E3 (30, 39), we use non-linear optimization to search conditions that produce maximal E3 flux under physiological constraints. Our result demonstrates the difference between the maximum flux and kcat (48).
Experimental Procedures
Reagents
All chemicals and buffers were purchased from Sigma. Pig heart E3 was purchased from Calzyme (San Luis Obispo, CA) without further purification. All experiments were conducted using Nanopure water. Pig heart E3 was reconstituted in 50 mm potassium phosphate and 0.3 mm EDTA at pH 7. Active site concentration was assessed by monitoring the enzyme-bound FAD spectrum and calculating the concentration based on the molar absorptivity of 11.3 mm−1 cm−1 at 455 nm (47). Stock solutions were aliquoted and stored at −20 °C.
Fluorescence Binding Assays
Fluorescence binding assays were conducted in 50 mm potassium phosphate, 0.3 mm EDTA, and adjusted to have an ionic strength of 170 mm using KCl at pH 7. Pig heart E3 (1.2 μm, 2 ml volume) solution was titrated with incremental amounts of a 100 mm NAD+ stock solution at 25 °C. The binding assay was monitored by pig heart E3 FAD fluorescence excited at 455 nm. Pig heart E3 FAD fluorescence emission spectra were collected from 480 to 650 nm using an LS 55 luminescence spectrometer (PerkinElmer Life Sciences). Excitation and emission slit widths were set at 5 and 8 nm, respectively. Fluorescence emission spectra were corrected for dilution.
dl-Lipoamide titrations of pig heart E3 (0.75 μm, 2 ml volume) were conducted in the same general conditions as the NAD+ titration described above; although dl-lipoamide (47 mm) stock was solubilized in a 100% ethanol solution. The final percentage of ethanol in the titration was ≤20%. The dl-lipoamide binding assays were monitored by pig heart E3 protein fluorescence (tryptophan) excited at 280 nm and by pig heart E3 FAD fluorescence excited at 455 nm. E3 protein fluorescence was corrected for dilution and was also corrected for inner filter effects using Equation 1 (49).
 |
Fluorescence binding assays were analyzed using their full spectra according to supplemental Equation S1 and its solution shown in supplemental Equation S2. A detailed description of this method is provided in the supplemental material under Fluorescence Binding Assay Method.
Pig Heart E3 Kinetic Assays
Pig heart E3 kinetic assays were conducted in various initial solutions of NAD+ (0, 0.1, and 0.5 mm), NADH (0.25 and 0.5 mm), dl-lipoamide (0.25, 1, and 3 mm), and pH (4.5, 5.25, 5.65, 6.25, 7, 8, and 8.5). Assays were conducted using 2 nm enzyme, 0.3 mm EDTA, 0.67 mg/ml BSA (50), at 25 °C in 170 mm ionic strength adjusted using KCl. Final ethanol concentrations, due to the dl-lipoamide 100% ethanol solvent, were held constant at 7.5% throughout all assays. Assay pH was buffered using 50 mm citrate (pH 4.5), MES (pH 5.25, 5.65, and 6.25), MOPS (pH 7), and Tris (pH 8 and 8.5). To mitigate unwanted buffer effects, we chose to use the structurally similar MES and MOPS buffers around physiologically relevant pH. We show that MOPS and Tris, although structurally dissimilar, produce no difference in E3 rate at the same pH (supplemental Fig. S10).
Assays were conducted on a Varioskan Flash multimode plate reader (Thermo Fisher Scientific, Waltham, MA) using a 96-well format with 200-μl assay total volumes, which were followed at 340 nm. Calibration curves for NADH and dl-lipoamide were carried out on the plate reader to account for each of their molar absorptivities in the dihydrolipoamide dehydrogenase reaction. Enzyme assays were initiated by the automated injection of 100 μl (half of the total assay volume) of E3 to each well.
Literature-derived FAD Anaerobic Absorbance Titrations
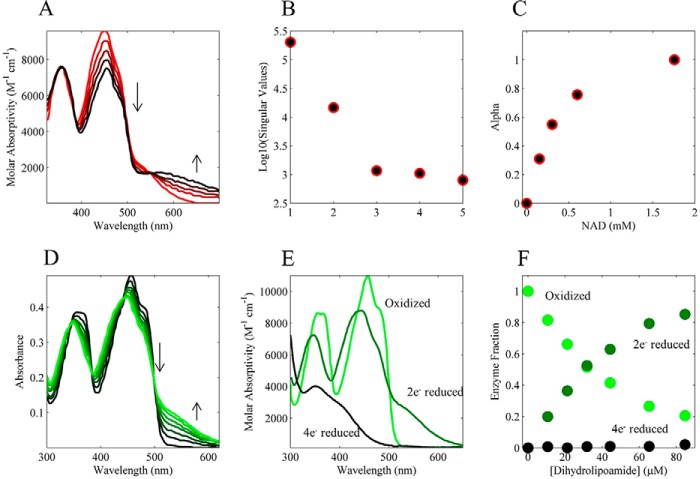
Pig heart E3 FAD absorption spectra in Fig. 4, A, D, and E, were obtained using the graph-digitizing software ScanIt 1.06 (amsterCHEM) from Fig. 3 in Ref. 46 and Figs. 1 and 4 in Ref. 47, respectively. Further necessary modifications to these obtained data are described in the supplemental material, under E3 FAD Spectral Analysis). The spectral data in Fig. 4, D and E, were used to estimate the fraction of enzyme that exists in the three major E3 redox states of oxidized, 2e−-reduced charge transfer complex, and 4 e−-reduced state by applying supplemental Equation S3 and its solution supplemental Equation 4. A detailed discussion of how these spectral data were used to extract enzyme fractional states is also provided in the supplemental material, under E3 FAD spectral analysis.
FIGURE 4.
Literature-derived equilibrium pig heart E3 FAD spectral titrations. A, pig heart E3 FAD absorption spectra were obtained from Fig. 3 in Ref. 46. In this experiment, pig heart E3 was anaerobically reduced with dithionite (initial red spectrum) and then titrated with NAD+ (0, 0.151, 0.303, 0.602, and 1.757 mm; red to black lines) at a pH of 5.8. B, semi-log plot of the singular values from a singular value decomposition of the spectra in A. C, fraction of NAD+ bound to the 2e− reduced E3 state was calculated assuming the spectra in A are composed of only bound and unbound species and solving for this fraction using linear least squares. The resulting fractions, or α values, are shown as a function of total NAD+. D, pig heart E3 FAD absorption spectra were obtained from Fig. 4 in Ref. 47. In this experiment, oxidized pig heart E3 was anaerobically titrated with dihydrolipoamide (0, 10.6, 21.2, 31.8, 44.3, 65.3, and 84.67 μm; black to green). E, pig heart E3 FAD absorption spectra were from oxidized (light green), 2e− reduced (dark green), and 4e− reduced (black) obtained from Fig. 1 in Ref. 47. F, pig heart E3 absorption spectra of the different redox states in E were used to solve (see “Experimental Procedures”) the fraction of oxidized, 2e−, and 4e− reduced enzyme states as a function of the dihydrolipoamide titration in D. Extracted fractional enzyme states (oxidized, 2e− reduced, and 4e− reduced) are shown as a function of dihydrolipoamide.
FIGURE 3.
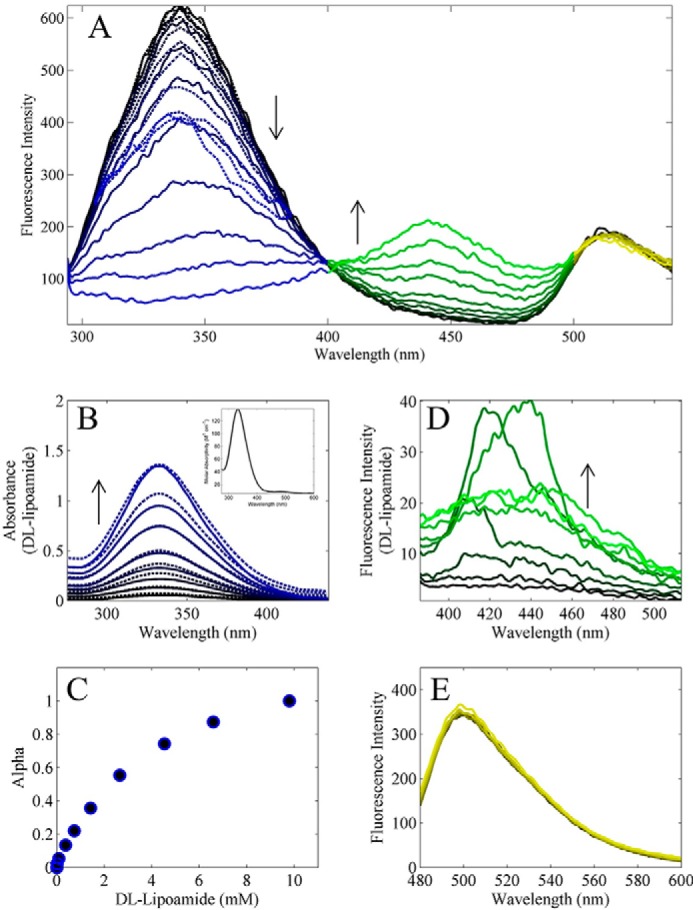
dl-Lipoamide equilibrium fluorescence titration of pig heart E3. A, pig heart E3 fluorescence was excited at 280 nm and titrated with dl-lipoamide in conditions described under “Experimental Procedures.” Fluorescence spectra from 294 to 400 nm decreased with increasing dl-lipoamide additions (0, 0.016, 0.094, 0.373, 0.74, 1.43, 2.66, 4.53, 6.6, and 9.8 mm) (black to blue lines). These data (294–400 nm) were corrected (dashed lines in A) for an inner filter effect due to the absorption of dl-lipoamide as shown in B. Fluorescence spectra (A) from ∼400 to 500 nm increased with increasing dl-lipoamide additions (black to green). A fluorescence intensity peak was also observed near 500 nm and remained constant in intensity throughout the titration (black to yellow). B, absorption spectra of dl-lipoamide with increasing concentrations (0.526, 1, 1.98, 2.66, 3.62, 5.4, 7.72, and 9.97 mm; black to blue solid lines). Inset, dl-lipoamide absorption spectra were fitted (dashed lines) using linear least squares to obtain the molar absorptivity (m−1 cm−1) of dl-lipoamide to be used for inner filter effect correction. C, α values are plotted as a function of total dl-lipoamide. D, increasing concentrations of dl-lipoamide (0, 0.0157, 0.0938, 0.373, 0.74, 1.427, 2.66, and 4.53 mm; black to green) in the absence of protein were excited at 330 nm. E, pig heart E3 FAD fluorescence was excited at 455 nm and titrated with dl-lipoamide in the same conditions in A. Pig heart E3 FAD fluorescence spectra are shown with increasing dl-lipoamide concentrations (0, 0.015, 0.046, 0.156, 0.373, 1, 2, 3.6, and 5.4 mm; black to yellow).
FIGURE 1.
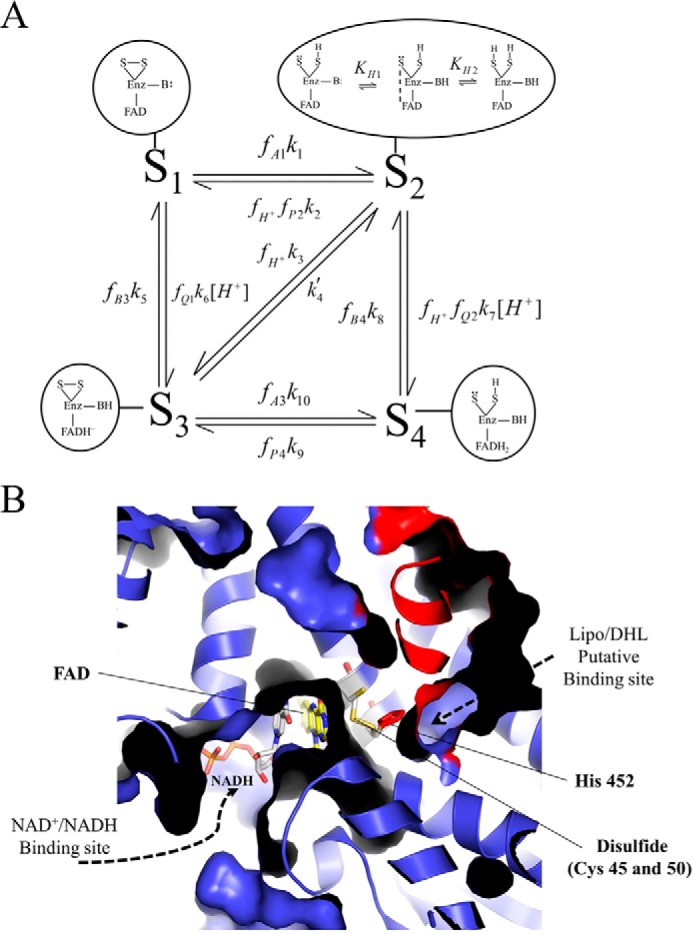
Mammalian E3 kinetic model and substrate/product-binding sites. A, pig heart E3 kinetic model consists of four redox states as follows: oxidized (S1), hydride-reduced disulfide (S2), hydride-reduced FAD (S3), and a hydride-reduced disulfide and FAD state (S4). Each enzyme redox state is depicted in the corresponding bubble captions, which illustrate the disulfide (S-S), flavin (FAD), and active site base (B:) chemical forms as part of the E3 enzyme (Enz). In the model, S2 has the ability to undergo (de)protonation, where the middle schematic in the bubble caption represents the charge transfer complex required for hydride transfer between the thiolate redox center and FAD cofactor to advance the mechanism between S2 and S3 enzyme states (3). Dihydrolipoamide, NAD+, lipoamide, NADH, and protons are represented by A, B, P, Q, and H+, respectively. Fractional occupancies, the fraction of a substrate or product bound to a given enzyme state, are represented by f, and subscripts indicate the substrate/product bound to a specific state (S1 through S4). Substrates and products are considered to bind randomly within each redox state and in rapid equilibrium compared with chemical steps. Our assumption of rapid equilibrium binding is supported by previous studies (3, 43, 46). B, x-ray structure of human E3 (Protein Data Bank code 1ZMD) (4) illustrates the general substrate/product binding situation common to E3s, where the re face of the FAD cofactor is exposed, and the si face is guarded by an active site disulfide. In the human E3 structure (4), NAD+ and NADH were shown to bind the re face of the FAD cofactor, whereas the si face does not bind either NAD redox state. There are available structures with bound NAD+ (Protein Data Bank code 1ZMC) and NADH (Protein Data Bank code 1ZMD). We chose to show the NADH-bound structure, which has a different binding mode than NAD+ where the nicotinamide ring of NADH is oriented toward the FAD cofactor. Structurally homologous enzymes in the flavin disulfide reductase family (69), molecular dynamics simulations (70), and structures of bound lipoamide inhibitors reveal the lipoamide binding cavity (71). The E3 human structure (4) is shown in a cutaway view so that the binding pockets, located in the protein interior, can be viewed. The structure (a dimer) is colored so that one monomer is blue and the other is red. Active site components are annotated accordingly with the bound NADH (gray) and FAD (yellow) cofactors shown in stick representation. The active site disulfide (Cys-45 and -50 in humans) and histidine (residue 452 in humans) are shown as yellow and red sticks, respectively. This figure was made using PyMOL (72) and Protein Data Bank code 1ZMD.
Kinetic Modeling
The model schematic is shown in Fig. 1A, where the overall forward E3 reaction is shown in Reaction 1.
 |
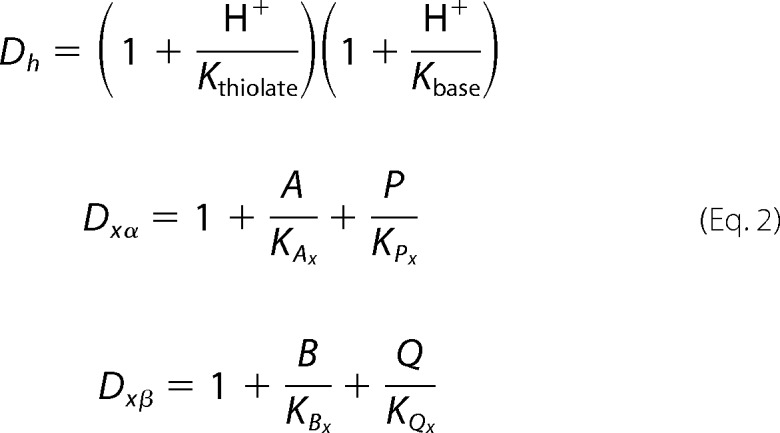
In Reaction 1, A, B, P, Q, and H+ represent dihydrolipoamide, NAD+, lipoamide, NADH, and a proton, respectively. This model assumes that pig heart E3 is composed of four major redox states, including fully oxidized (S1), hydride-reduced disulfide (S2), hydride-reduced FAD (S3), and a hydride-reduced disulfide and FAD state (S4). We also assume that substrates, products, and protons bind randomly and are in rapid equilibrium with each redox state. Binding polynomials are used to determine the fraction of bound and free forms of the enzyme (Equation 2).
Dihydrolipoamide/lipoamide (A/P) and NADH/NAD+ (Q/B) pairs are considered to bind to two separate sites on E3 as is reasoned through existing structural data (Fig. 1B). The (A/P) and (Q/B) sites are denoted as α and β, respectively. In our experiments, a dl-lipoamide mixture was used, as is the case with datasets that were obtained from the literature. A discussion of this in regard to the kinetic model can be found in the supplemental material under Lipoamide Stereochemistry.
As demonstrated previously (41), we have allowed equilibrium dissociation constants to vary depending on the redox status of the enzyme to more accurately account for redox effects on the enzyme-ligand interaction. Different enzyme redox states are indicated in the binding polynomials by use of their numbered states (in Equation 2, x = states 1, 2, 3, or 4). Binding polynomials (Equation 2) for protons (Dh), representing the active site thiolate and base, are accounted for and assumed to be most significant in the instance of the hydride-reduced disulfide state (S2).
 |
Fractional occupancies (Equation 3) are produced by taking the ratio of the specific binding state that advances the mechanism from all other substrates (51).
 |
The kinetic equations are shown in matrix form in the supplemental Equation S5 and were solved analytically by computing the pseudo inverse of the state-transition matrix using MATLAB (2014b) Symbolic Math Toolbox. The solution to supplemental Equation S5 provides the distribution equations for each enzyme state, which are used to create a flux expression for the net production of NADH (Q) (Equation 4).
 |
Model Constraints
Thermodynamic loop constraints were derived using the two inner loops (Fig. 1A), described in detailed elsewhere (41). The resulting constraints are shown in Equation 5 and were used to eliminate two rate constants from the flux expression, k5 and k9.
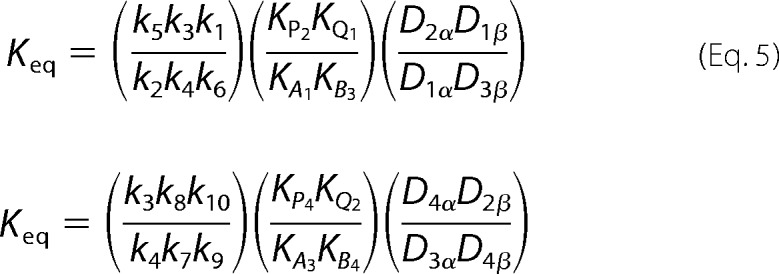 |
The overall equilibrium constant for the dihydrolipoamide dehydrogenase reaction (Equation 6) is required for the above constraint and was normalized to pH 7 by multiplying the right hand side of Equation 6 by 107. Previously (41), the apparent equilibrium constant at pH 7 was estimated to be 0.0766, using Equation 7, from the midpoint potentials of the lipoamide/dihydrolipoamide (−0.287 V) and NAD+/NADH (−0.320 V) couples determined at 25 °C (2, 47).
 |
 |
In Equation 7, n is the number of electrons transferred; F is Faraday's constant (96,485 C mol−1); ΔEm is the midpoint potential difference; R is the gas constant (8.315 J K−1 mol−1), and T is temperature is in Kelvin. As was discussed previously (41), there are indeterminate errors associated with midpoint potentials (52) that are amplified through the exponential relationship between ΔEm and Keq (Equation 7). Also in relation to this fact, we have found additional pH-dependent equilibrium data for E3 in the Goldberg et al. database (53), which reports an apparent equilibrium constant of 0.27 at pH 7. We allowed variation in Keq to encompass experimental variability, where the boundary for the apparent Keq at pH 7 was set between 0.03 and 0.4. Details of model fitting are described in the supplemental material under Fitting.
pH-dependent E3 Flux Optimization via NAD+/NADH and Lipo/DHL Ratios
NAD+/NADH and Lipo/DHL ratios can be optimized to produce a physiological maximal flux by using a fixed total amount of both lipoamide and NAD of 10 and 3 mm, respectively. These values were obtained from literature estimations (1, 54), and with specified NAD+/NADH and Lipo/DHL ratios were used to solve for the corresponding oxidized and reduced lipoamide and NAD concentrations needed to satisfy the conditions. For instance, in the case of NAD, the total NAD concentration (NADT) and ratio are given in Equation 8. Substitution and rearrangement yields Equation 9 and concentrations for both NAD+ and NADH.
 |
 |
Using the above constraints, the NAD+/NADH and Lipo/DHL ratios were optimized using the best-fit rate and equilibrium dissociation constants (Table 1) for both mam-E3 and Ec-E3 (Figs. 11–14); the Ec-E3 kinetic model and parameters have been determined in a prior publication using a 3-state redox model (41).
TABLE 1.
Best-fit kinetic parameters for mammalian E3 to 4-state redox modela
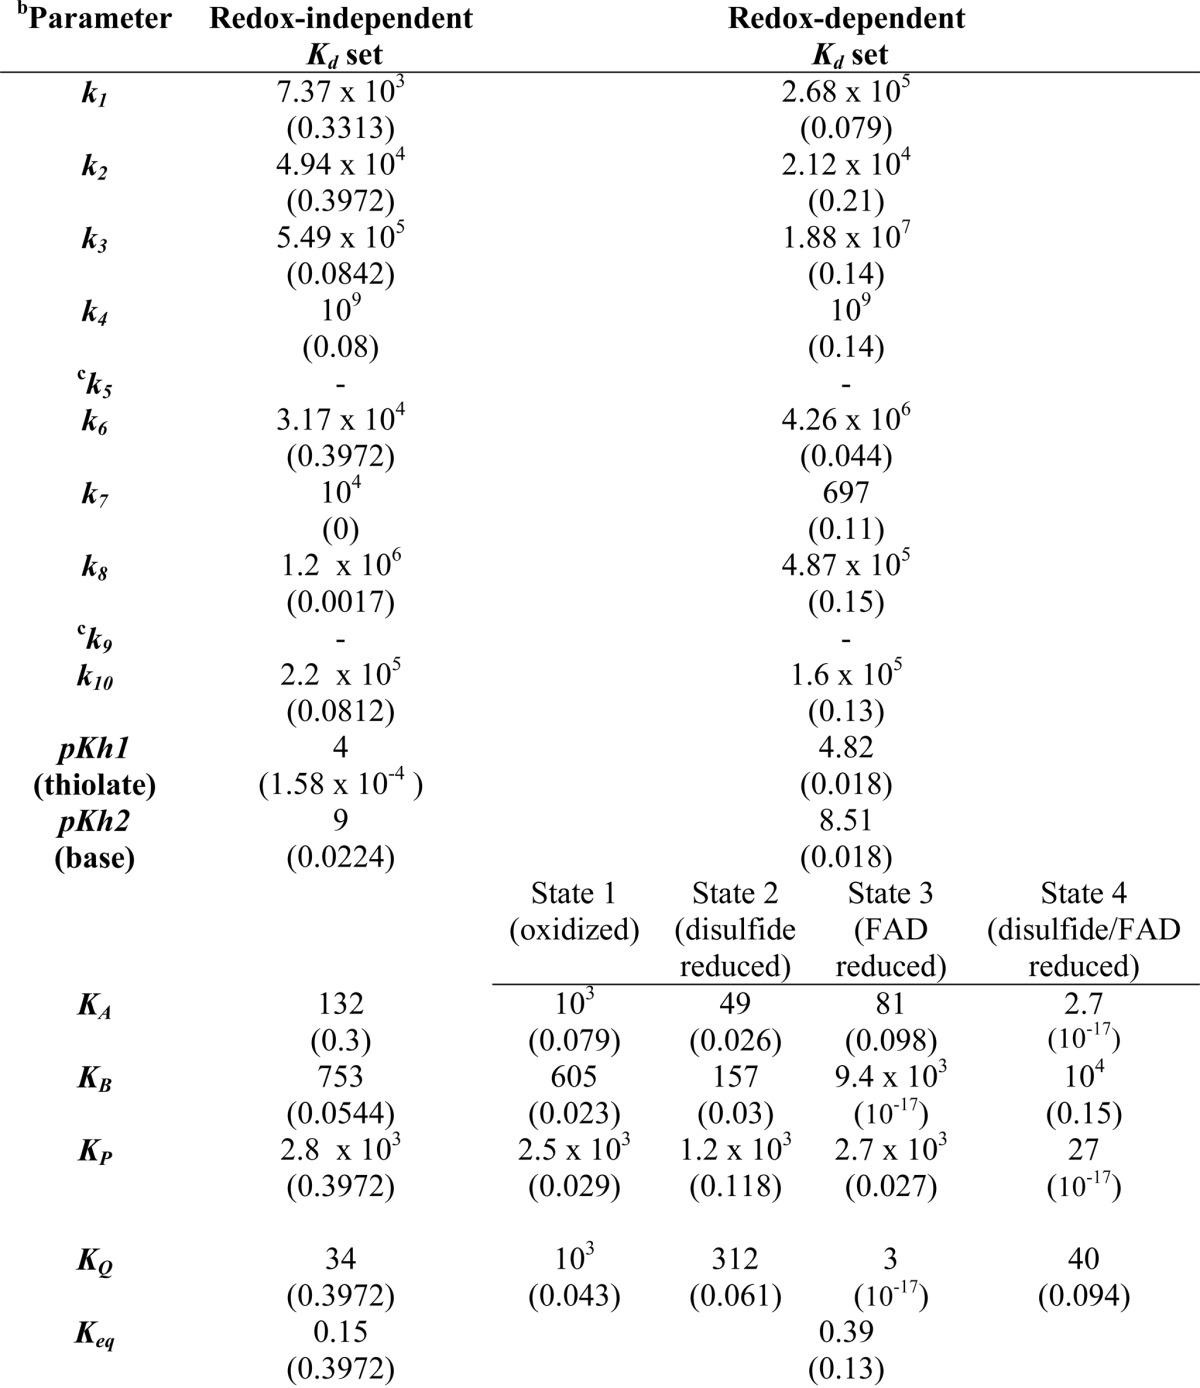
a Parameter values are from the global fitting of the data in Fig. 6 to a 4-state redox model where the equilibrium dissociation constants (Kd in micromolars) were either independent or dependent on the E3 redox state. Parameter sensitivities are in parentheses and calculated according to a previously described method (65).
b Rate constants were constrained within the bounds of 10 −3 to 109 min−1, and equilibrium dissociation constants were bounded between 1 and 104 μm · pKh1 and pKh2 were bounded between 9 and 4, respectively.
c The rate constants k5 and k9 were eliminated from the flux expression using thermodynamic loop constraints (Equation 5) described under “Experimental Procedures.”
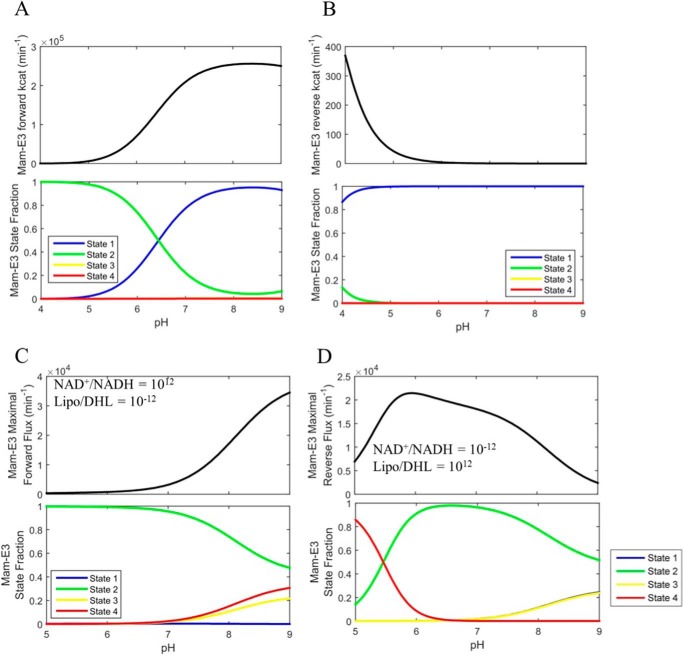
FIGURE 11.
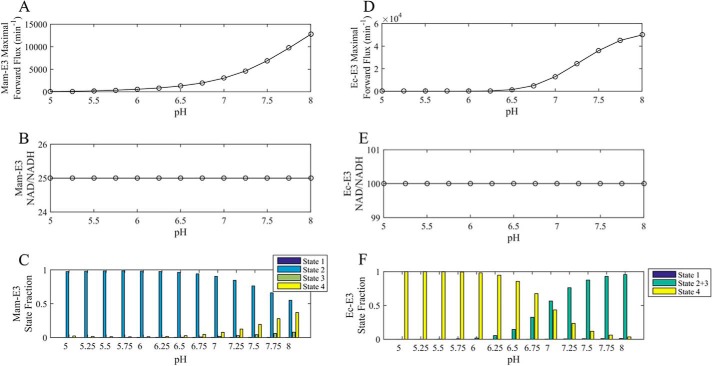
Mammalian E3 pH-dependent forward/reverse kcat and maximal forward/reverse pH-dependent fluxes with corresponding enzyme fractional states. A, top, mammalian E3 forward kcat as a function of pH was calculated as described under “Experimental Procedures” using globally fitted parameters (Table 1) obtained by fitting the data in Fig. 6 to the 4-state redox model. Bottom, enzyme redox fractional states corresponding to the forward kcat in A were calculated as described under “Experimental Procedures.” B, top, mammalian E3 reverse kcat as a function of pH was calculated in the same manner as the forward kcat and as described under “Experimental Procedures.” Bottom, enzyme redox fractional states corresponding to the reverse kcat were calculated as described under “Experimental Procedures.” C, top, parameterized (Table 1) 4-state redox-dependent flux expression was maximized using NAD+/NADH, Lipo/DHL, and pH as adjustable parameters to produce a flux maximized in the forward direction, shown as a function of pH. The lipoamide and NAD pool were constrained to 10 and 3 mm, respectively. Bottom, enzyme redox fractional states corresponding to the flux were computed with the resulting NAD+/NADH and Lipo/DHL ratios of 1012 and 10−12 respectively, as a function of pH. D, top, parameterized (Table 1) 4-state redox flux expression was maximized using NAD+/NADH, Lipo/DHL, and pH as adjustable parameters to produce a maximal flux in the reverse direction, shown as a function of pH. The lipoamide and NAD pool were constrained to 10 and 3 mm, respectively. Bottom, enzyme redox fractional states corresponding to the flux were computed with the resulting NAD+/NADH and Lipo/DHL ratios of 10−12 and 1012, respectively, as a function of pH. Table 2 provides the fitted parameter values for this analysis.
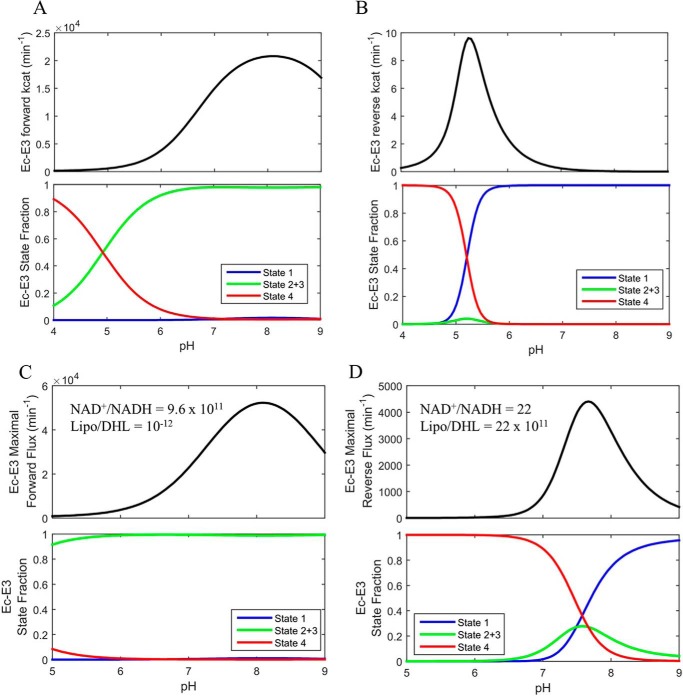
FIGURE 12.
E. coli E3 pH-dependent forward/reverse kcat and maximal pH-dependent forward/reverse fluxes with corresponding enzyme fractional states. A, top, E. coli E3 forward kcat as a function of pH was calculated, as described under “Experimental Procedures,” using globally fitted parameters obtained from Moxley et al. (41) to a 3-state redox-dependent Kd model. Bottom, enzyme redox fractional states corresponding to the forward kcat were calculated as described under “Experimental Procedures.” B, top, E. coli E3 reverse kcat as a function of pH was calculated, as described under “Experimental Procedures,” using globally fitted parameters obtained from Moxley et al. (41) to a 3-state redox-dependent Kd model. Bottom, enzyme redox fractional states corresponding to the reverse kcat were calculated as described under “Experimental Procedures.” C, top, flux expression parameterized by globally fitted parameters obtained from Moxley et al. (41), to the 3-state redox-dependent Kd model, was maximized in the forward direction using NAD+/NADH, Lipo/DHL, and pH as adjustable parameters and shown as a function of pH. Lipoamide and NAD pools were constrained to 10 and 3 mm, respectively. Bottom, enzyme redox fractional states corresponding to the flux were computed with the resulting NAD+/NADH and Lipo/DHL ratios of 9.6 × 10¹¹ and 10−12, respectively, as a function of pH. D, top, flux expression parameterized by globally fitted parameters obtained from Moxley et al. (41), to the 3-state redox-dependent Kd model, was maximized in the reverse direction using NAD+/NADH, Lipo/DHL, and pH as adjustable parameters and shown as a function of pH. Lipoamide and NAD pools were constrained to 10 and 3 mm, respectively. Bottom, enzyme redox fractional states corresponding to the flux were computed with the resulting NAD+/NADH and Lipo/DHL ratios of 22 and 22 × 1011, respectively, as a function of pH. Table 2 provides the fitted parameter values for this analysis.
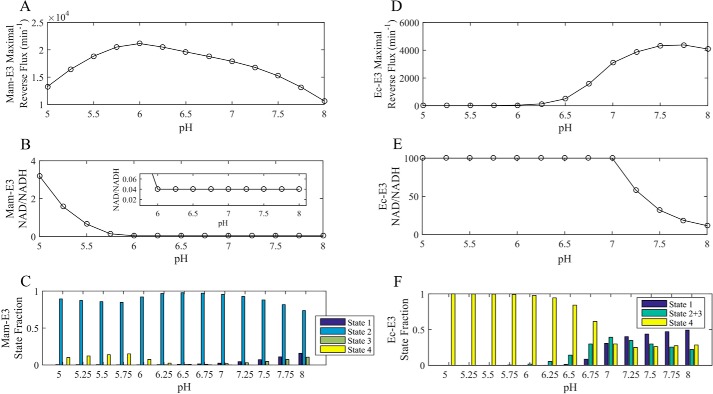
FIGURE 13.
Maximal mammalian and E. coli E3 reverse flux at fixed pH values via NAD+/NADH and Lipo/DHL ratio optimization. A–C, 4-state redox-dependent Kd model flux expression parameterized (Table 1) by globally fitting the data shown in Fig. 6 was maximized in reverse mam-E3 flux using the NAD+/NADH and Lipo/DHL ratios as adjustable parameters at fixed pH values. D–F, Ec-E3 reverse flux was maximized in the same manner as the mam-E3 reverse flux using a 3-state redox-dependent Kd model described and parameterized in Moxley et al. (41). In each case, the total concentration of lipoamide and NAD was fixed to 10 and 3 mm, respectively, according to literature estimates (54, 57). The concentration of lipoamide is based on a previous estimation considering the stoichiometry and volume of the pyruvate dehydrogenase complex (1). The optimized value of the Lipo/DHL ratio was approximately the upper bound of 1012 in all cases. Fitted NAD+/NADH values were given tighter boundaries compared with optimizations shown in Figs. 11 and 12, as described under “Experimental Procedures.” A, maximal mam-E3 reverse flux at fixed pH values using NAD+/NADH and lipo/DHL ratios as adjustable parameters with the 4-state redox model flux expression. B, fitted NAD+/NADH ratios at fixed pH values for the mam-E3 reverse flux optimization. C, calculated mammalian fractional enzyme states at fixed pH values, using the fitted NAD+/NADH and Lipo/DHL ratios, in B. D, maximized Ec-E3 reverse flux at fixed pH values using NAD+/NADH and lipo/DHL ratios as adjustable parameters with the 3-state redox model flux expression described and parameterized in Moxley et al. (41). E, fitted NAD+/NADH ratios at fixed pH values for the Ec-E3 reverse flux optimization. F, calculated E. coli fractional enzyme states at fixed pH values using the fitted NAD+/NADH and Lipo/DHL ratios in E.
FIGURE 14.
Maximal mammalian and E. coli E3 forward flux at fixed pH values via NAD/NADH and Lipo/DHL ratio optimization. A–C, 4-state redox model flux expression parameterized (Table 1) by globally fitting the data shown in Fig. 6 was maximized in forward mammalian E3 flux using the NAD+/NADH and Lipo/DHL ratios as adjustable parameters at fixed pH values. D–F, the E. coli E3 forward flux was maximized in the same manner as the mammalian E3 forward flux using a 3-state redox-dependent Kd model described and parameterized in Moxley et al. (41). In each case, the total concentration of lipoamide and NAD was fixed to 10 and 3 mm, respectively, according to literature estimates (54). The concentration of lipoamide is based on a previous estimation considering the stoichiometry and volume of the pyruvate dehydrogenase complex (1). The optimized value of the Lipo/DHL ratio was approximately the lower bound of 10−12 in all cases. Fitted NAD+/NADH values were given tighter boundaries compared with optimizations shown in Figs. 11 and 12, as described under “Experimental Procedures.” A, maximal mammalian E3 forward flux at fixed pH values using NAD+/NADH and lipo/DHL ratios as adjustable parameters with the 4-state redox model flux expression parameterized (Table 1) with the data in Fig. 6. B, fitted NAD+/NADH ratios at fixed pH values for the mammalian E3 forward flux optimization. C, calculated mammalian fractional enzyme states at fixed pH values, using the fitted NAD+/NADH and Lipo/DHL ratios, in B. D, maximized E. coli E3 forward flux at fixed pH values using NAD+/NADH and lipo/DHL ratios as adjustable parameters with the 3-state redox model flux expression described and parameterized in Moxley et al. (41). E, fitted NAD+/NADH ratios at fixed pH values for the E. coli E3 forward flux optimization. F, calculated E. coli fractional enzyme states at fixed pH values using the fitted NAD+/NADH and Lipo/DHL ratios in E.
Substrate/product ratios were optimized using the same global and local minimizers as the data fitting described in the supplemental material. Initial ratio values were randomly chosen between the following boundaries. The NAD+/NADH ratio was given the upper bounds of 102 (Ec-E3) and 25 (mam-E3) and lower bounds of 10−2 (Ec-E3) and 25−1 (mam-E3). The Lipo/DHL ratio was given the upper and lower bound of 1012 and 10−12, respectively, for both Ec-E3 and mam-E3.
NAD+/NADH boundaries were chosen to encompass a range that more than spans observed in vivo estimates (55–57) to allow a wide range that may apply to normal, abnormal, or diseased states (58). Lipo/DHL ratios are less documented and thus are given less stringent bounds. Enzyme fractional states (Figs. 7 and 11–14) were calculated with defined NAD+/NADH, Lipo/DHL, and pH values using distribution equations (59).
FIGURE 7.
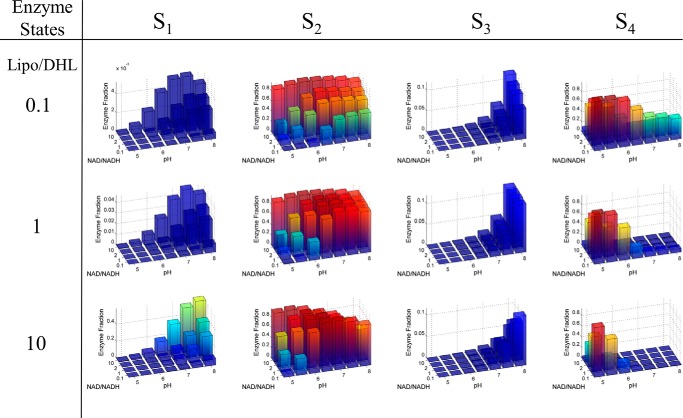
Calculated mammalian E3 4-state redox steady-state distribution. The 4-state, redox steady-state distribution as a function of NAD+/NADH, Lipo/DHL, and pH was calculated using the globally fitted parameters (Table 1) obtained from fitting the data shown in Fig. 6. NAD+/NADH ratio values were selected based on a wide range found in the literature (56, 57), and Lipo/DHL ratio values were arbitrarily chosen. The total concentration of lipoamide and NAD was fixed to 10 and 3 mm, respectively, according to literature estimates (54). The concentration of lipoamide is based on a previous estimation considering the stoichiometry and volume of the pyruvate dehydrogenase complex (1).
Substrate/product optimization was carried out by either allowing pH to vary (Figs. 11 and 12; Table 2) or fixing pH at different values (Figs. 13 and 14). Optimizations that allowed pH to vary (Figs. 11 and 12) are shown in comparison with kcat calculations described below and were given very wide boundaries for NAD+/NADH and Lipo/DHL (upper bound, 1012; lower bound, 10−12) to probe flux optima beyond physiological constraints.
TABLE 2.
Mammalian and E. coli E3 kcat and flux optimization analysis
Calculations determining kcat as a function of pH and optimization algorithms used to produce the flux maximum (Jmax) are described in “Experimental Procedures.” Flux (J) optimizations required to produce Jmax conserve NAD (54) and lipoamide (1) pool sizes of 3 and 10 mm, respectively.
| Parameter | Mammalian E3a |
E. coli E3b |
||
|---|---|---|---|---|
| Forward | Reverse | Forward | Reverse | |
| kcat(pH)c | 2.6 × 10⁵ (pH = 8.24) | 369 (pH = 4) | 2.1 × 10⁴ (pH = 8) | 9.5 (pH = 5.25) |
| Jmaxd | 3.5 × 10⁴ | 2 × 10⁴ | 5.23 × 10⁴ | 4.4 × 10³ |
| NAD+/NADHe | 1012 | 10−12 | 9.6 × 10¹¹ | 22 |
| Lipo/DHLe | 10−12 | 1012 | 10−12 | 22 × 1011 |
| pH | 9 | 5.6 | 8.11 | 7.67 |
a Mammalian E3 kcat (pH) and flux maximum (Jmax) were determined using the 4-state redox Kd-dependent parameters shown in Table 1.
b E. coli E3 kcat (pH) and flux maximum (Jmax) were determined using the previously described 3-state model and best-fit parameters (41).
c Maximum kcat (pH) values are displayed in units of min−1.
d E3 flux maximum (Jmax) are displayed in units of min−1.
pH-dependent kcat and Corresponding Enzyme Fractional State Calculation
Best-fit kinetic parameters (Table 1) using mam-E3 data (Fig. 6), for the 4-state redox model, and best-fit kinetic parameters for Ec-E3 described in Moxley et al. (41) were used to calculate the pH-dependent kcat in both the forward (Figs. 11A and 12A; top) and reverse (Figs. 11B and 12B) directions. The forward and reverse kcat values were derived by taking the limit of the flux expression as the substrates, in either direction, approach infinity (48). The corresponding enzyme state fractions that result from infinite substrate concentrations were calculated by taking the limit of each enzyme state distribution equation as substrates approach infinity (Figs. 11, A and B, and 12, A and B, bottom).
FIGURE 6.
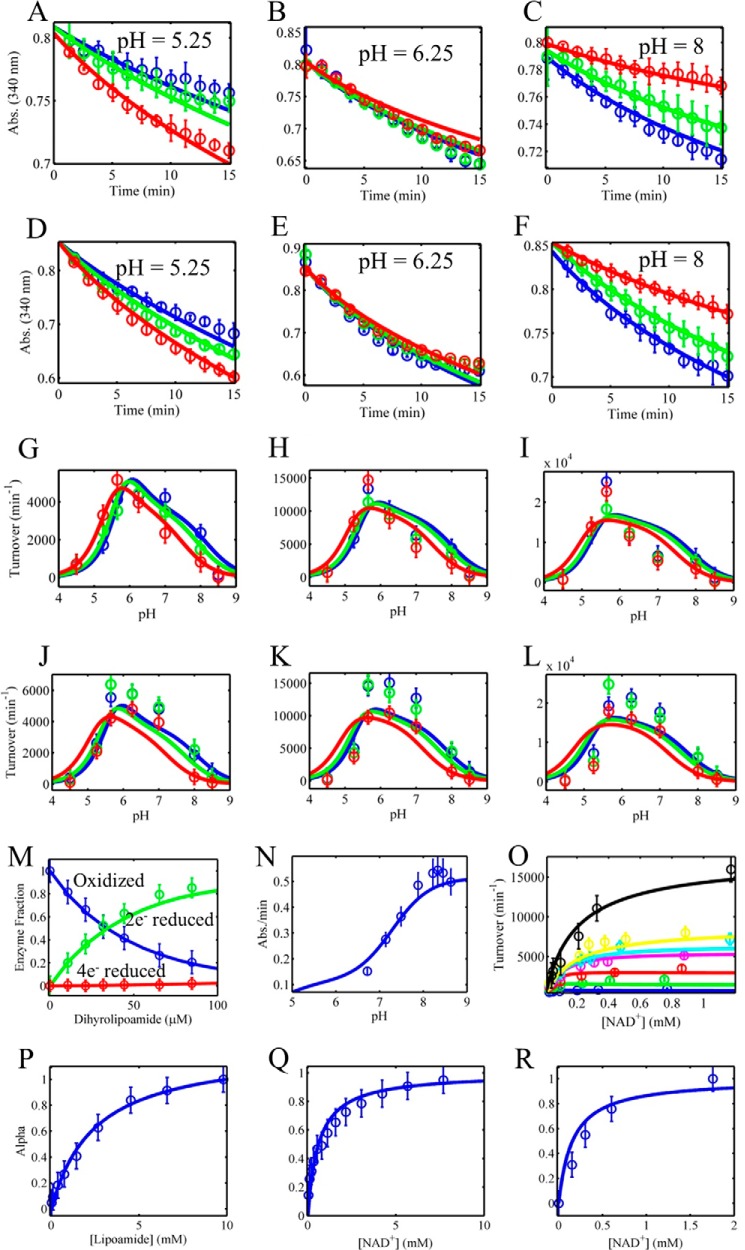
Global fitting of mammalian E3 reverse progress curves, reverse/forward initial velocity, and equilibrium titration data to a 4-state redox model with redox-dependent equilibrium dissociation constants. A–F, pig heart E3 reverse reaction progress curve data were collected in different initially added amounts of NAD+ (0, 100, and 500 μm), shown as blue, green, and red circles, respectively. Model simulations (4-state model) are shown as solid lines of the corresponding data marker color. All time-dependent assays shown in A–F contained 500 μm initially added NADH. A–C and D–F contained 0.25 and 1 mm dl-lipoamide, respectively. pH was held fixed at 5.25, 6.25, and 8 shown in A–C and D–F, respectively. G–L, pig heart E3 pH-dependent reverse initial velocity data were collected in different initially added amounts of NAD+ (0, 100, and 500 μm), shown as blue, green, and red circles, respectively. Model simulations (4-state model) are shown as solid lines of the corresponding data marker color. Initial rates shown in G–I were obtained in 500 μm initially added NADH and 0.25 (G), 1 (H), and 3 mm (I) dl-lipoamide. Initial rates shown in J–L were obtained with 250 μm initially added NADH and 0.25 (J), 1 (K), and 3 mm (L) dl-lipoamide. M, pig heart E3 fractional redox states were obtained from the dihydrolipoamide equilibrium titration shown in Fig. 4, D–F. The oxidized, 2e− reduced, and 4e− reduced states as a function of dihydrolipoamide are shown as blue, green, and red circles, respectively. N, human liver E3 forward initial rate data as a function of pH was obtained from Fig. 5 of Ref. 33 and fitted along all other datasets in this figure. O, forward initial rate data (circles) as a function of NAD+ in different fixed concentrations of dihydrolipoamide (25 (blue), 40 (green), 50 (red), 100 (magenta), 250 (cyan), 500 (yellow), and 750 μm (black)) were taken from the top of Fig. 1 in (63) and simulated (lines) with globally fitted parameters along with all other datasets shown in this figure. P–R, α values (blue circles) obtained from Figs. 2C, 3C, and 4C were simulated (blue lines) with globally fitted parameters assuming rapid equilibrium binding of each ligand described by their corresponding enzyme state fractional occupancies (Equation 3). Error bars represent standard deviations of the data from at least three experimental repeats, and error bars for literature-derived data sets (M–O) were assigned a 10% error according to the maximum ordinate value.
As described by Cornish-Bowden (48), the kcat is not a true flux maximum but a limit in mathematical terms. These derivations and calculations were used to compare with the true optimizations of flux in NAD+/NADH, Lipo/DHL, and pH (Figs. 11, C and D, and 12, C and D), albeit with a finite NAD and lipoamide pool of 3 and 10 mm, respectively (1, 54). These flux optimizations also differed from those shown in Figs. 13 and 14 by allowing a much wider range of NAD+/NADH and Lipo/DHL to further probe E3 flux optima (upper bound, 1012; lower bound, 10−12, for both ratios). In addition, pH was an adjustable parameter bound between 4 and 9.
Results
Equilibrium Fluorescence Titrations
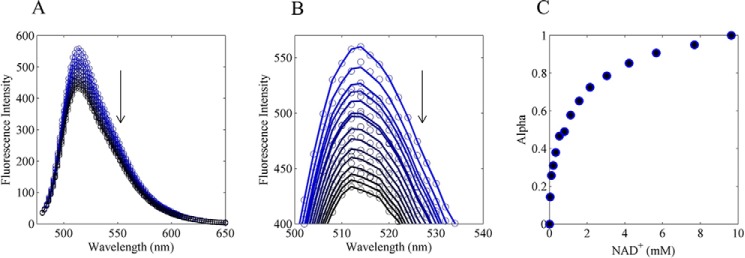
Fig. 2 summarizes an equilibrium titration of oxidized E3 (S1 in Fig. 1A) with NAD+. Utilizing the entire spectral dataset, accurate estimates of the fraction of NAD+ bound to the enzyme are computed by assuming linear superposition of NAD+ bound and free enzyme spectra (60). In this method, we assume that the first spectrum represents the unbound species, and the final spectrum, in the titration, represents the bound species. We solve for the term α (supplemental Equation S2), which provides the fraction of bound protein, and a fit to each spectrum (Fig. 2B). From here, α as a function of NAD+ (Fig. 2C) can be globally fitted with all other data sets (see below) and provides a very sensitive experiment reporting on NAD+ binding affinity to the E3-oxidized state (or S1 in Fig. 1A). Details of this method are explained in the supplemental material, under Fluorescence Binding Assay.
FIGURE 2.
Equilibrium NAD+ titration of pig heart E3. A, pig heart E3 FAD fluorescence was excited at 455 nm and titrated with NAD+ in conditions described under “Experimental Procedures.” Pig heart E3 FAD fluorescence was quenched by increasing amounts of NAD+ (blue to black). B, linear least squares method was applied to estimate the fraction of bound NAD+ assuming the observed spectra are a linear sum of bound and unbound spectra (see “Experimental Procedures”). Solid lines are calculated spectra, and circles are observed spectra. C, determined α values are shown as a function of total NAD+.
Reed (34) reported that both NAD+ and lipoamide binding to the oxidized form of E3 (Fig. 2A) would be consistent with the Lineweaver-Burk plot patterns they observed. Because we could not find any reports of lipoamide binding experiments in the literature, we conducted equilibrium titration experiments with dl-lipoamide and oxidized E3 (Fig. 3). In this experiment, E3 protein fluorescence was excited at 280 nm and was monitored from 294 to 540 nm (Fig. 3A). We observed apparent fluorescence quenching between 294 and 400 nm (Fig. 3A, black to blue), apparent fluorescence enhancement between 400 and 500 nm (Fig. 3A, black to green), and static fluorescence beyond 500 nm (Fig. 3A, black to yellow).
Apparent fluorescence quenching between 294 and 400 nm can be partially attributed to primary and secondary inner filter effects (49), resulting from the absorbance of dl-lipoamide from 280 to 440 nm (Fig. 3B, main solid lines). dl-Lipoamide molar absorptivity (m−1 cm−1) in this region was determined (Fig. 3B, inset), where the predicted absorbances are shown (Fig. 3B, main dashed lines). The dl-lipoamide molar absorptivity was then used to correct for inner filter effects using Equation 1 resulting in the corrected data (Fig. 3A, black to blue dashed lines). Inner filter effect corrected spectra (Fig. 3A, black to blue dashed lines) were then analyzed by applying the linear least squares method described in the supplemental material, where αi was determined as a function of dl-lipoamide (Fig. 3C).
Fluorescence enhancement between 400 and 500 nm is believed to be attributed to dl-lipoamide fluorescence (Fig. 3D). This conclusion was reached by exciting (280 nm) a solution of dl-lipoamide alone as a function of increasing dl-lipoamide, which showed increases in fluorescence between 400 and 500 nm. Fluorescence beyond 400 nm was attributed to E3 FAD fluorescence (Fig. 3E) by conducting a separate titration exciting E3 FAD fluorescence at 455 nm, whereas while titrating with dl-lipoamide showed little effect on the spectra. This result is consistent with the lipoamide-binding site being distal to the isoalloxazine ring of the FAD cofactor. This result coincides with the structural data (Fig. 1B) and a two-site mechanism (one site each for NAD+/NADH and Lipo/DHL) that we used to model the kinetic data (see “Experimental Procedures” for model description).
Analysis of Literature-derived Equilibrium UV-visible Titrations
Additional information on ligand affinity and the redox equilibrium properties of pig heart E3 was obtained by analyzing existing FAD spectra of a NAD+ equilibrium titration on the E3 charge transfer complex (Fig. 4A) (46) and a dihydrolipoamide titration of oxidized E3 (Fig. 4D) (47). The NAD+ equilibrium titration (Fig. 4A) was conducted on the E3 charge transfer complex at pH 5.8 (apparent Keq = 0.0048) (46) and reports on the binding affinity of NAD+ to the enzyme state S2 (Fig. 1A). A singular value decomposition of the spectral data illustrates that the spectra are mostly composed of two species (Fig. 4B), where we assume that these species represent NAD+-free and -bound charge transfer complex. These spectra were then analyzed, as the fluorescence titrations described above, to obtain a binding curve as a function of NAD+ (Fig. 4C).
The redox status of pig heart E3 in the presence of increasing concentrations of dihydrolipoamide was monitored through FAD absorbance spectra (Fig. 4D) (47). Using absorbance spectra of known E3 major redox states (Fig. 4E), the fractions of E3 redox states as a function of dihydrolipoamide (Fig. 4F) can be determined from the titration spectra. (See supplemental material under E3 FAD spectral analysis.)
Mammalian E3 Activation/Inhibition and Modeling
We previously demonstrated (41) that a 3-state redox model consisting of oxidized, 2e−, and 4e− reduced states can simulate NAD+ activation effects as they vary among different E3 homologs. E. coli and spinach E3 data sets each showed that NAD+ acts only as an activator in acidic pH, which is then neutralized at increasing pH values (see Figs. 3F and 4C in Ref. 41), although the model best-fit for spinach E3 simulated a small amount of NAD+ inhibition at pH values above 7.5 (see Fig. 4C in Ref. 41).
Although a reasonable amount of data exist for E. coli (30) and spinach (32) E3 at more neutral and basic pH values, using various NAD+ concentrations, data sets in these conditions using mammalian sources of E3 are lacking (41). To gain more insight, we used the best-fit parameters for a human liver E3 kinetic data set, discussed previously (41), to simulate higher NAD+-containing conditions as a function of pH (supplemental Fig. S1). These simulations predict NAD+ inhibition at near neutral to basic pH values (supplemental Fig. S1B).
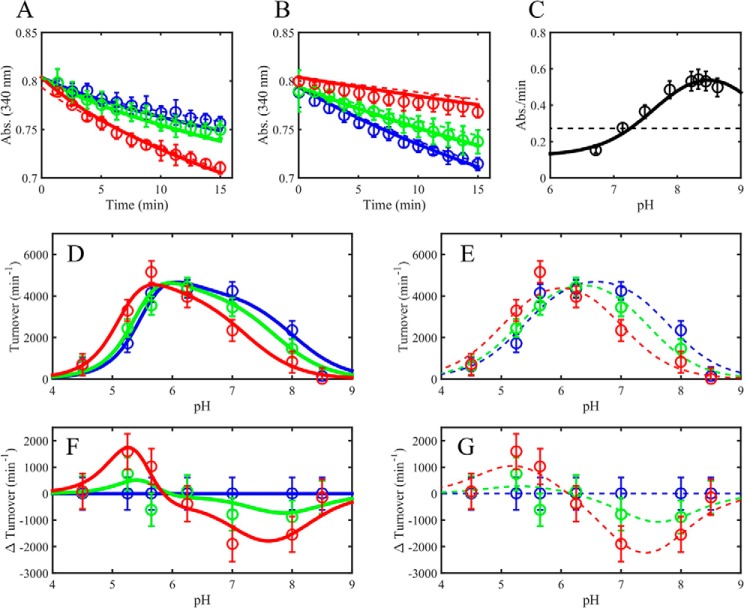
In light of these observations and lack of available mammalian E3 data, we collected pH-dependent kinetic data with pig heart E3 using a wider pH range that encompasses acidic, neutral, and basic values (Fig. 5). In doing so, we also observed activation by NAD+ at acidic pH (Fig. 5, A and D) and inhibition as the pH approaches more basic values (Fig. 5, B and D). This effect is more clearly seen in a difference plot (Fig. 5F), where positive and negative values indicate activation and inhibition, respectively. Altogether, these data demonstrate a pH-dependent switch between E3 NAD+ activation and inhibition near a pH of 6 (Fig. 5F).
FIGURE 5.
Mammalian E3 pH-dependent NAD+ activation/inhibition. A, pig heart E3 reverse reaction progress curves in acidic conditions (pH 5.25) in different initially added amounts of NAD+ (0, 100, and 500 μm), shown as blue, green, and red circles, respectively. Model simulations are shown as dashed (3-state model) and solid (4-state model) lines of the corresponding data marker color. B, pig heart E3 reverse reaction progress curves at basic conditions (pH 8) in different initially added amounts of NAD+ (0, 100, and 500 μm), shown as blue, green, and red circles, respectively. Model simulations are shown as dashed (3-state model) and solid (4-state model) lines of the corresponding data marker color. C, human liver E3 pH-dependent forward initial rates (black circles) taken from Fig. 5 of Ref. 33. Model simulations are shown as black dashed (3-state model) and solid (4-state model) lines. D, pig heart E3 pH-dependent reverse initial rates in different initially added amounts of NAD+ (0, 100, and 500 μm), shown as blue, green, and red circles, respectively, with 4-state model simulations shown as solid lines. E, pig heart E3 pH-dependent reverse initial rates (as in D) with 3-state model simulations shown as dashed lines of the corresponding data marker color. F, difference plots (observed turnover (NAD+ added) − observed turnover (no NAD+)) of data and simulations shown in D corresponding to the 4-state model. G, difference plots (observed turnover (NAD+ added) − observed turnover (no NAD+)) of data and simulations shown in E corresponding to the 3-state model. A–E, error bars represent standard deviations of the data from at least three experimental repeats, where error bars in F and G represent the propagation of error from the difference of the observed rates.
The previously described 3-state redox model (41), parameterized using human liver E3 data (33), is able to capture the pH dependence of both the forward and reverse E3-catalyzed reaction and predicts product inhibition of NAD+ at near neutral to more basic pH values (supplemental Fig. S1). But the model fails to reproduce our data from the pig heart enzyme to the 3-state redox model (Fig. 5C, dashed line, and see 3-state redox model fitting).
To circumvent the lack of fit to our data (Fig. 5, circles) to the 3-state redox model (Fig. 5, dashed lines), we first implemented a 6-state model that accounted for a documented (44) change in oligomeric state as a function of pH with pig heart E3. This model is described in supplemental Fig. S3. We discovered that this model can fit the core pH-dependent NAD+ activation/inhibition phenomenon with pH dependence of the forward reaction (supplemental Fig. S4), but it is significantly more complicated, adding six rate constants to the core 3-state model.
The simpler 4-state mechanism of Fig. 1A is better supported by the literature (47, 61, 62) and active site structure (Fig. 1B). This model, which accounts for the oxidation/reduction of the FAD cofactor (see FAD cofactor in Fig. 1B), is able to better fit the data (Fig. 5, solid lines). We also accurately fitted this data set using a 4-state redox model where the equilibrium dissociation constants (Kd) are not allowed to vary with the redox state of the enzyme (supplemental Fig. S2, solid lines), which suggests that the dissociation constants do not need to change as a function of E3 redox state to explain NAD+-positive and -negative regulation.
Global Fitting of Kinetic and Spectroscopic Data to a 4-State Redox Model
A 4-state redox-dependent model simulates the pH-dependent NAD+ activation/inhibition phenomenon of the reverse E3 reaction and forward pH-dependent data (Fig. 5, solid lines). To better characterize the NAD+ activation/inhibition phenomenon, we gathered more reverse E3 kinetic data, while also incorporating the fitting of the equilibrium spectroscopic experiments (Fig. 6).
In addition, to more accurately simulate forward E3 kinetics, we obtained forward pig heart E3 initial velocity data (Fig. 6O) from Ref. 63, which varied NAD+ in different concentrations of dihydrolipoamide. Dihydrolipoamide equilibrium titration data (47), described above, were also incorporated into this large data set by numerically integrating individual titration points to long times, which provides model consistency with FAD redox states as a function of dihydrolipoamide (Fig. 6M). Equilibrium titrations, described in Figs. 2 and 4, were incorporated into the fitting using fractional occupancies (Equation 3) to simulate the binding of NAD+ to enzyme states S1 (Fig. 6Q)and S2 (Fig. 6R) and dl-lipoamide binding to enzyme state S1 (Fig. 6P).
Fig. 6 shows the best fit of the 4-state redox-dependent Kd model. We also fit this large data set using a 4-state redox-independent Kd model (supplemental Fig. S5), so that equilibrium dissociation constants for substrates and products do not depend on the redox state of the enzyme. The 4-state redox-independent model primarily has trouble fitting the forward initial rates as a function of pH with all other data sets (supplemental Fig. S5 N).
The average difference between model fits and mean data shown in Fig. 6 is 12.6%. By computing the difference between model simulations and the error/uncertainty range of the data, the average deviation between model and data is 3.1%. Of 455 simulation points, 90 lie outside the range of uncertainty in the data. However, although the model fits are good, they are imperfect and do show biased error with respect to data in Fig. 6, G–L. The fits to these data could be improved by adding additional states to the model. The potential impact of these imperfections in the model fits is explored below.
Because our experiments use a dl-lipoamide mixture, a simple modification to the 4-state redox model to account for this mixture was used to investigate whether this detail in the model would improve the fit to the data (supplemental Figs. S11 and S12). We were unable to improve the fit accounting for this fact in the model, however. A discussion of this model and results canbe found in the supplemental material under “Lipoamide Stereochemistry.”
Calculation of Mammalian E3 4-State Redox Steady-state Distribution and Physiological Flux Surface
The 4-state redox-dependent Kd model, using best-fit parameters (Table 1), was used to calculate a physiological mam-E3 4-state redox steady-state distribution and flux surface (Figs. 7 and 8). These calculations used a physiologically relevant total NAD concentration of 3 mm (54) and lipoamide concentration of 10 mm (1). NAD+/NADH ratios were also chosen based on a range that spans conditions that may represent normal, abnormal, or diseased redox states (58), and were constrained by total NAD and lipoamide concentrations using Equations 8 and 9.
FIGURE 8.
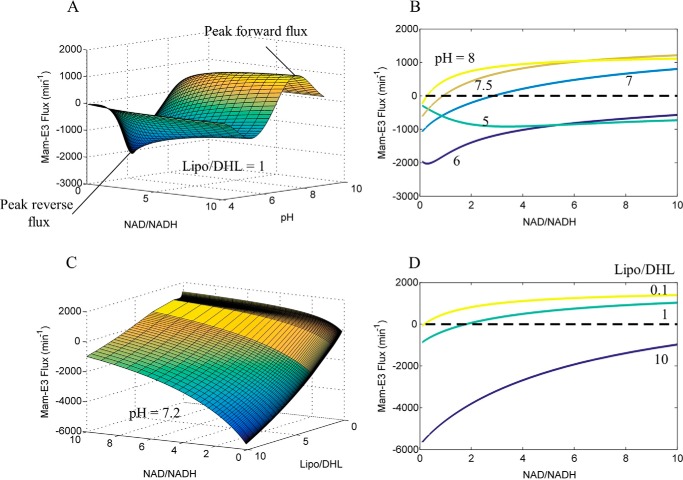
Calculated mammalian E3 NAD+/NADH, Lipo/DHL, and pH-dependent flux surface. The globally fitted parameters (Table 1) obtained by fitting the data in Fig. 6 to the 4-state redox model were used to calculate the mam-E3 NAD+/NADH, Lipo/DHL, and pH-dependent flux surfaces. A, Mam-E3 flux as a function of NAD+/NADH and pH, at a constant Lipo/DHL ratio of 1, was used to calculate the mammalian E3 flux surface. B, E3 flux (NAD+/NADH, pH, Lipo/DHL = 1) cross-sections at pH 5, 6, 7, 7.5, and 8. The black dashed line is a reference for zero flux. C, E3 flux as a function of NAD+/NADH and Lipo/DHL, at a constant pH of 7.2, was used to calculate the mam-E3 flux surface. D, E3 flux (NAD+/NADH, pH = 7.2, Lipo/DHL) cross-sections at Lipo/DHL ratios of 0.1, 1, and 10. The black dashed line is a reference for zero flux. In all panels, the forward and reverse fluxes are defined as being positive and negative, respectively. The forward flux is defined from left to right in Reaction 1.
The calculated mam-E3 4-state redox steady-state distribution (Fig. 7) has a similar profile to a previously calculated distribution (41), parameterized by a much smaller data set using human liver E3 data (33, 41). The model is validated by experimental observations using stopped-flow technology (46, 61) that show the redox state-3 (S3), or the FAD reduced state, is present in very low fractions relative to the remaining enzyme redox states.
We calculated the mam-E3 physiological flux surface by both treating the flux as a function of NAD+/NADH and pH, with fixed Lipo/DHL (Fig. 8A), and as a function of NAD+/NADH and Lipo/DHL at pH 7.2 (Fig. 8C). The flux surface was calculated to gain insight into conditions that either produce forward (positive) or reverse (negative) E3 flux. These calculations can then predict the point at which the readily reversible mam-E3 switches direction and magnitude in flux.
Cross-sections from the multidimensional mam-E3 flux surface at different fixed pH (Fig. 8B) and Lipo/DHL (Fig. 8D) show NAD+/NADH ratios that cross a zero flux (equilibrium) threshold, demonstrating inflection points of E3 forward and reverse flux. For example, the calculated mam-E3 flux is near zero at NAD+/NADH ratios of 2.5, 1.5, and 1, at fixed pH values of 7, 7.2, and 7.5, respectively, using a fixed Lipo/DHL ratio of 1 (Fig. 8, B and D). Therefore, mam-E3 has the potential to catalyze its reaction in both directions with similar magnitude at or near physiological pH, NAD+/NADH, and reasonable steady-state NAD and lipoamide pools. The steady-state value of the Lipo/DHL ratio is, of course, also an important dictator of E3 flux direction and magnitude (Fig. 8D).
To explore how the error and uncertainty in model fits to data affect these model predictions, we randomly perturbed adjustable parameter values to obtain 1000 new parameter sets within a 10% boundary of the best-fit values from Table 1 (see supplemental material for parameter perturbation). The maximum and minimum model output from the parameter sets shows a wider span of the model simulation, but the qualitative behavior of the model is unchanged. (Compare supplemental Fig. S8 with Fig. 6.) The effects of this parameter perturbation on the predictions shown in Fig. 8 are illustrated in supplemental Fig. S9, revealing that these predictions are largely insensitive to the uncertainty in the model parameterization.
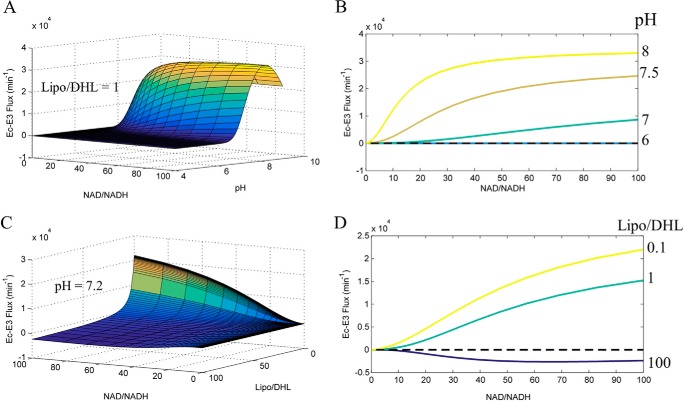
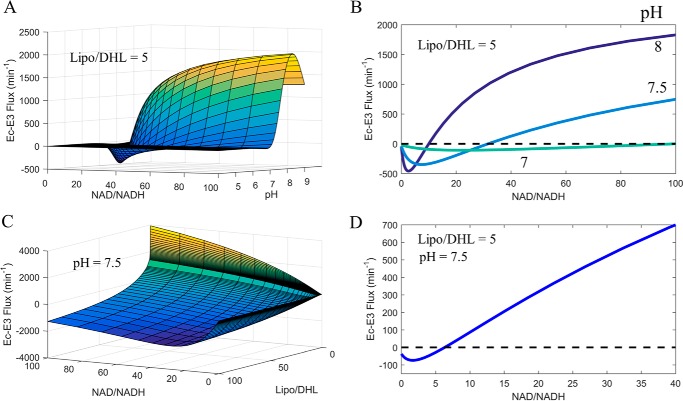
In comparison of the calculated mam-E3 flux surface (Fig. 8), we also computed the Ec-E3 flux surface (Fig. 9) using best-fit parameter values with the previously described (41) 3-state redox model. These calculations illustrate a stark difference between mammalian and E. coli E3 enzymes in their net flux as a function of NAD+/NADH, Lipo/DHL, and pH. Mam-E3 easily toggles between forward and reverse net flux (Fig. 8A), whereas Ec-E3 catalytically favors the forward reaction (Fig. 9A), requiring higher NAD+/NADH and Lipo/DHL ratios for net reverse catalysis at pH 7.2 (Fig. 9D). Despite this observation, we find that after increasing the Lipo/DHL ratio to 5 and/or the pH to 7.5, Ec-E3 is clearly able to switch catalytic direction (Fig. 10) within reasonable physiological conditions. Additional flux surface plots for both mam-E3 (supplemental Fig. S6) and Ec-E3 (supplemental Fig. S7) are given and further illustrate the flux as a multidimensional function of NAD+/NADH, Lipo/DHL, and pH.
FIGURE 9.
Calculated E. coli E3 NAD+/NADH, Lipo/DHL, and pH-dependent flux surface. The globally fitted parameters obtained from Moxley et al. (41), to the 3-state redox-dependent Kd model, were used to calculate the E. coli E3 NAD+/NADH, Lipo/DHL, and pH-dependent flux surfaces. A, E. coli E3 flux as a function of NAD+/NADH and pH, at a constant Lipo/DHL ratio of 1, was used to calculate the E. coli E3 flux surface. B, E. coli E3 flux (NAD+/NADH, pH, Lipo/DHL = 1) cross-sections at pH 5, 6, 7, 7.5, and 8. C, E. coli E3 flux as a function of NAD+/NADH and Lipo/DHL, at a constant pH of 7.2, was used to calculate the E. coli E3 flux surface. D, E. coli E3 flux (NAD+/NADH, pH = 7.2, Lipo/DHL) cross-sections at Lipo/DHL ratios of 0.1, 1, and 10. The black dashed line is a reference for zero flux. In all panels, the forward and reverse fluxes are defined as being positive and negative, respectively. The forward flux is defined from left to right in Reaction 1 in the text.
FIGURE 10.
Calculated E. coli E3 NAD+/NADH, Lipo/DHL, and pH-dependent flux surface. The globally fitted parameters obtained from Moxley et al. (41), to the 3-state redox-dependent Kd model, were used to calculate the E. coli E3 NAD+/NADH, Lipo/DHL, and pH-dependent flux surfaces. A, E. coli E3 flux as a function of NAD+/NADH and pH, at a constant Lipo/DHL ratio of 5, was used to calculate the E. coli E3 flux surface. B, E. coli E3 flux (NAD+/NADH, pH, Lipo/DHL = 5) cross-sections at pH 7, 7.5, and 8. C, E. coli E3 flux as a function of NAD+/NADH and Lipo/DHL, at a constant pH of 7.5, was used to calculate the E. coli E3 flux surface. D, E. coli E3 flux (NAD+/NADH, pH 7.5, and Lipo/DHL) cross-sections at a Lipo/DHL ratio of 1. The black dashed line is a reference for zero flux. In all panels, the forward and reverse fluxes are defined as being positive and negative, respectively. The forward flux is defined from left to right in Reaction 1 in the text.
Mammalian and E. coli E3 pH-dependent Flux Optimization as a Function of NAD+/NADH and Lipo/DHL
Maximal flux is typically determined by calculating the kcat for a specified condition (48, 59, 64). But the kcat is not the true maximum (48). It is the limit of the flux as enzyme substrates approach infinity. To illustrate this point, we calculated the kcat for mam-E3 as a function of pH using the 4-state redox model (using best-fit parameters in Table 1) in both the forward and reverse direction (Fig. 11, A and B, top); some of these results are included in Table 2. This calculation reveals that the reverse kcat produces rates less than the observed turnover (Fig. 6, G–L) at a given pH. The enzyme state fractions corresponding to each of these limits were also calculated (Fig. 11, A and B, bottom). In comparison, this calculation was also carried out with Ec-E3 (Fig. 12, A and B) using the 3-state redox model (41), producing a similar result that we have mentioned elsewhere (41).
Despite kcat producing a submaximal flux in the reverse direction for both mammalian (Fig. 11B) and E. coli E3 (Fig. 12B), the forward kcat (Figs. 11A and 12A) does not suffer from this issue. These calculations then illustrate the point that without substrate inhibition or possibly mechanistic randomness (64), this limit will produce the maximum amount of substrate-bound state (i.e. ES) leading to maximal flux. However, mechanisms that have a non-hyperbolic dependence of the rate on the substrate concentration (in this case in the reverse direction) need to be analyzed by other optimization methods rather than the traditional limit of substrate concentration.
To address this issue, mammalian and E. coli E3 reverse flux was maximized (Fig. 13, A and B), using the best-fit rate constants and equilibrium constants (Table 1) and by varying NAD+/NADH and Lipo/DHL (Ec-E3 best-fit rate constants were determined previously (41)). Importantly, NAD+/NADH and Lipo/DHL ratios were constrained as described under “Experimental Procedures” according to total physiological NAD and lipoamide concentrations. Thus, the maximal mam-E3 and Ec-E3 flux was determined by varying the NAD+/NADH and Lipo/DHL at different fixed pH values (Fig. 13) according to physiological constraints.
Mammalian E3 showed a reverse flux maximum at a pH near 6 (Fig. 13A), although the maximum for E. coli is near 7.5 (Fig. 13D). For pH below 6, NAD+/NADH ratios varied from 1 to 7 for mam-E3 but remain fixed at 0.04 for higher pH (Fig. 13B). However, Ec-E3 prefers more oxidized NAD+/NADH ratios for maximum reverse activity across all pH ranges, where NAD+/NADH values between 12 and 60 are most optimal around neutral pH (Fig. 13E). The NAD+/NADH ratios below pH 6 result in higher S2 and lower S4 fractions to optimize the reverse mam-E3 flux (Fig. 13C). In the case of Ec-E3, the reverse flux is maximized by more evenly distributing the enzyme redox states (Fig. 13F). The mam-E3 and Ec-E3 forward flux was also maximized at different fixed pH values (Fig. 14), demonstrating differences between mam-E3 and Ec-E3 fractional states, when the forward flux has been maximized.
Reverse/forward mammalian and E. coli E3 fluxes were also maximized by varying NAD+/NADH and Lipo/DHL, using wider boundaries for substrate/product ratios (Figs. 11 and 12; Table 2), without fixing pH. This approach illustrates that wider substrate/product ratios do allow the forward E3 flux to increase significantly for mam-E3 (compare Figs. 11C (top) with 14A) but not for Ec-E3 (compare Fig. 12C (top) to Fig. 14D). However, the reverse E3 flux does not benefit from going outside physiological substrate/product ratios (compare Figs. 11D with 13A) for mam-E3 or Ec-E3 (compare Figs. 12D (top) with 13D (top)).
Discussion
Early reports (39, 40) of pig heart E3 reverse reaction kinetics demonstrated a unique NAD+ product activation phenomenon, which is especially prominent at low pH and higher NADH concentrations. However, these earlier reports (39, 40) lacked assay conditions that varied NAD+/NADH or lipoamide and did not probe physiological pH values.
NAD+ product activation has also been observed in E. coli (30), spinach (32), and human liver (33) E3, in which we previously derived a 3-state redox kinetic model that accurately simulated these data sets (41). By analyzing mammalian data sets from rat (34) and human (33) liver E3, it was determined that the available data were not sufficient to accurately characterize mam-E3 NAD+/NADH pH-dependent regulation (41).
To address this void, pig heart E3 reverse kinetics were assayed in 162 initial conditions (Fig. 6, G–L) varying NAD+/NADH, dl-lipoamide, and pH ranging from 4.5 to 8.5, in physiological ionic strength (170 mm) using KCl as a background salt. We also conducted NAD+ and dl-lipoamide equilibrium titrations on oxidized pig heart E3 to more directly identify equilibrium dissociation constants that would be consistent with our kinetic model (Figs. 2 and 3). Other more sophisticated literature-derived (46, 47) active site (FAD) spectroscopic experiments were analyzed by linear algebraic methods (Fig. 4). These data sets (Fig. 4) were also incorporated into our large experimental ensemble (Fig. 6) to maintain consistency with observations that directly probe E3 active site redox states. Furthermore, forward reaction pH-dependent and dihydrolipoamide/NAD+-dependent data sets, from human liver (33) and pig heart (63) E3 (Fig. 6, N and O), were added to accurately model mam-E3 kinetic reversibility.
Our newly collected pig heart E3 reverse kinetic assays have demonstrated a NAD+ inhibitory effect in the physiological pH range (pH 7–7.5), rather than the activation effect traditionally reported at low pH (39, 40). Generally, we find that at a pH near 6, NAD+ switches between an activator and inhibitor (Fig. 5). We have not been able to find this effect demonstrated with any previous E3 kinetic data sets. NAD+ inhibition effects are more physiologically relevant in the grand scheme of PDHc regulation, because it is this type of regulation that manifests near neutral pH. Moreover, product inhibition is ubiquitous among enzyme kinetic characterization studies and is typically expected (59). Although we were unable to find reverse E3 kinetic data demonstrating a NAD+ inhibitory effect, we discovered that our previous 3-state model (41) predicts NAD+ inhibition (supplemental Fig. S1B) at physiological pH by extrapolating [NAD+] >100 μm using a previously determined (41) best-fit parameter set derived from fitting human liver E3 kinetic data (33, 41). Despite similar 3-state model predictions based on human liver E3 parameters to our pig heart E3 data, we were unable to accurately fit our data using the 3-state model (Fig. 5).
To account for the lack of fit to the data with the 3-state model, we developed a 4-state redox model (Fig. 1A) that accounts for a chemical step that was previously simplified in the 3-state redox model (41). The 4-state redox model accounts for the internal electron transfer between the active site disulfide and the FAD cofactor (Fig. 1, A and B). This added step decomposes the 2e− reduced state in the original 3-state redox model (41), creating an additional state. This mechanism is able to simulate both reverse reaction NAD+ activation/inhibition and reaction forward pH dependence (Fig. 5, solid lines).
All model simulations were subjected to thermodynamic constraints (2, 51) and to a global fitting (Fig. 6) approach rather than the more simple (and inconsistent) approach of individual data set fitting, which is ubiquitous in the field of enzyme kinetics (66).
Alternative parameter sets that fit the data (Fig. 6) equally as well from random independent starts are difficult to find. This result is consistent with parameters that are more constrained than our previous result in fitting a small human liver E3 data set (33, 41) that produced numerous best-fit examples with an extremely wide range of parameter values (41). Thus the breadth of the data set reported here facilitates a level of precision in model identification that was not possible based on previously available kinetic data (41).
Beyond data collection, model derivation, and parameterization, we also probed model predictions in flux and enzyme states as a function of NAD+/NADH, Lipo/DHL, and pH to gain insight into E3 kinetics (Figs. 7 and 8). Calculation of E3 redox states as a function of NAD+/NADH, Lipo/DHL, and pH (Fig. 7) reveals an interesting prediction that is consistent with stopped-flow experiments (46). The calculated mam-E3 state-3 (S3), irrespective of most conditions, is present at very low fractions (Fig. 7). This model prediction is consistent with stopped-flow spectroscopic studies, which were unable to observe this state due to its very transient nature using pig heart E3 (46).
To better understand E3 kinetic reversibility, we calculated the mam-E3 steady-state flux surface (Fig. 8) as a function of NAD+/NADH and pH, at Lipo/DHL = 1, which demonstrates a readily reversible catalytic surface. Of particular interest here are the conditions at which this enzyme switches direction in flux because of the kinetic control E3 has on lipoamide (in PDHc L2 domain) redox status (8); the lipoamide redox state is important for PDK binding (22) and thus PDHc phosphorylation status. Therefore, PDHc NAD+/NADH sensing is mediated through E3 and is closely linked to PDHc phosphoryl regulation.
Our 4-state model predicts, using constant NAD and lipoamide pool sizes (see “Experimental Procedures”), at physiological pH that NAD+/NADH values between 1 and 2.5 would begin to change E3 flux direction with a Lipo/DHL ratio set to one (Fig. 8B). In comparison with mam-E3, we also calculated the Ec-E3 flux surface (Fig. 9) and noticed a significant difference in the kinetic reversibility of these homologs in the simulated conditions. These simulations demonstrate the kinetic difficulty of Ec-E3 reverse (Fig. 9) catalysis compared with mam-E3 (Fig. 8). In this respect, Lipo/DHL ratios are very important in dictating flux direction and magnitude, whereas higher Lipo/DHL ratios for Ec-E3 relative to mam-E3 (Figs. 8D, 9, and 10 and supplemental Fig. S7) are more essential for reverse Ec-E3 catalysis. After increasing Lipo/DHL and pH, we found that Ec-E3 also demonstrates a reversible catalytic flux (Fig. 10), simulated using E. coli intracellular pH and NAD+/NADH ratios (55, 67). Sole E3 NAD+/NADH ratio regulation of the E. coli PDHc is expected due to the lack of PDK and PDP enzymes (30, 35).
In order for mam-E3 to kinetically control the lipoamide redox state, and thus PDK binding affinity (22), it needs to effectively catalyze both forward and reverse directions in physiological conditions. It follows then that the demonstration of a readily reversible mam-E3 physiological catalytic surface (Fig. 8) supports the overall mechanism of mam-E3 kinetic regulation of L2 domain redox status, important for PDK binding affinity and subsequent phosphoryl regulation (26).
Although rate laws have been developed for a large number of classical models of enzyme mechanisms (64), our analysis of E3 kinetics required the introduction of a novel mechanism to capture pH-dependent NAD+ product activation (30, 33, 39, 40) and inhibition (shown here in Fig. 5), as well as pH and NAD+-dependent progress curve lag phases (30, 33, 39, 68), substrate inhibition (30, 39), and pH-dependent oligomeric state regulation (44), as discussed elsewhere. In this model, as for many complex enzymatic mechanisms, the conventional method (kcat) to represent the optimal rate (48) fails to reveal the true catalytic maximum.
For example, in the case of simple substrate inhibition, it is traditional to ignore inhibitory terms to produce a kcat value. This value, however, does not reflect the actual mechanism, and thus it is a misrepresentation of the actual limit of enzymatic turnover. In the case of E3, calculating the theoretical reverse maximum flux with pH-dependent substrate inhibition (in NADH), pH-dependent product activation/inhibition (in NAD+), randomness in substrate/product binding, and more than one pathway to product requires solving a multivariate optimization problem to find maximal enzymatic flux.
Our results show that the forward E3 maximal flux with mam-E3 (Fig. 11C, top) and Ec-E3 (Fig. 12C, top) is similar to kcat (Figs. 11A and 12A, top), whereas the reverse E3 maximal flux (Figs. 11D and 12D, top), conditions, and enzyme states (Fig. 11D and 12D, bottom) are much different from the reverse kcat (Figs. 11B and 12B, top; Table 2). Our optimized conditions are constrained by reasonable physiological NAD and lipoamide pools (see “Experimental Procedures”) and NAD+/NADH and Lipo/DHL ratios, where kcat does not consider these constraints and produces results that may be submaximal and non-physiological in the extent of extrapolated infinite substrate (48).
We believe that the general numerical approach of optimizing enzyme substrate/product ratios, using a rigorously parameterized enzyme kinetic model, will be useful for understanding enzyme flux optima especially in the context of a mechanism that produces non-Michaelis-Menten behavior (hyperbolic deviation (64)). Furthermore, more physiologically feasible enzyme states and optimal conditions are revealed with the proper constraints. This approach should be of general interest to fields that rely on enzyme optimization such as enzymology and enzyme engineering, as well as more broadly scoped fields including systems biology and bioengineering.
Author Contributions
M. A. M. designed and conducted the experiments. M. A. M. and J. N. B. analyzed the experiments and wrote computer code for analysis. M. A. M. wrote the paper. J. N. B., D. A. B., and M. A. M. revised the paper. All authors approved the final manuscript.
Supplementary Material
Acknowledgment
M.A.M. acknowledges Dr. Kalyan Vinnakota for help with the Varioskan Flash multimode plate reader.
This work was supported by National Institutes of Health Grants R01-DK095210, R01-HL072011, T32-HL094273, and K99-HL121160. The authors declare that they have no conflicts of interest with the contents of this article. The content is solely the responsibility of the authors and does not necessarily represent the official views of the National Institutes of Health.

This article contains supplemental Equations S1–S5, Figs. S1–S12, and additional references.
- PDHc
- pyruvate dehydrogenase complex
- PDK
- pyruvate dehydrogenase kinase
- PDP
- pyruvate dehydrogenase phosphatase
- Ec-E3
- E. coli E3
- mam-E3
- mammalian E3
- Lipo/DHL
- lipoamide/dihydrolipoamide.
References
- 1.Perham R. N. (2000) Swinging arms and swinging domains in multifunctional enzymes: catalytic machines for multistep reactions. Annu. Rev. Biochem. 69, 961–1004 [DOI] [PubMed] [Google Scholar]
- 2.Massey V. (1960) The identity of diaphorase and lipoyl dehydrogenase. Biochim. Biophys. Acta 37, 314–322 [DOI] [PubMed] [Google Scholar]
- 3.Massey V., Gibson Q. H., and Veeger C. (1960) Intermediates in the catalytic action of lipoyl dehydrogenase (diaphorase). Biochem. J. 77, 341–351 [DOI] [PMC free article] [PubMed] [Google Scholar]
- 4.Brautigam C. A., Chuang J. L., Tomchick D. R., Machius M., and Chuang D. T. (2005) Crystal structure of human dihydrolipoamide dehydrogenase: NAD+/NADH binding and the structural basis of disease-causing mutations. J. Mol. Biol. 350, 543–552 [DOI] [PubMed] [Google Scholar]
- 5.Patel M. S., Nemeria N. S., Furey W., and Jordan F. (2014) The pyruvate dehydrogenase complexes: structure-based function and regulation. J. Biol. Chem. 289, 16615–16623 [DOI] [PMC free article] [PubMed] [Google Scholar]
- 6.Lopaschuk G. D., Ussher J. R., Folmes C. D., Jaswal J. S., and Stanley W. C. (2010) Myocardial fatty acid metabolism in health and disease. Physiol. Rev. 90, 207–258 [DOI] [PubMed] [Google Scholar]
- 7.Patel M. S., and Korotchkina L. G. (2006) Regulation of the pyruvate dehydrogenase complex. Biochem. Soc. Trans. 34, 217–222 [DOI] [PubMed] [Google Scholar]
- 8.Roche T. E., and Hiromasa Y. (2007) Pyruvate dehydrogenase kinase regulatory mechanisms and inhibition in treating diabetes, heart ischemia, and cancer. Cell. Mol. Life Sci. 64, 830–849 [DOI] [PMC free article] [PubMed] [Google Scholar]
- 9.Sidhu S., Gangasani A., Korotchkina L. G., Suzuki G., Fallavollita J. A., Canty J. M. Jr., and Patel M. S. (2008) Tissue-specific pyruvate dehydrogenase complex deficiency causes cardiac hypertrophy and sudden death of weaned male mice. Am. J. Physiol. Heart Circ. Physiol. 295, H946–H952 [DOI] [PMC free article] [PubMed] [Google Scholar]
- 10.Fillmore N., and Lopaschuk G. D. (2013) Targeting mitochondrial oxidative metabolism as an approach to treat heart failure. Biochim. Biophys. Acta 1833, 857–865 [DOI] [PubMed] [Google Scholar]
- 11.Sun W., Liu Q., Leng J., Zheng Y., and Li J. (2015) The role of pyruvate dehydrogenase complex in cardiovascular diseases. Life Sci. 121, 97–103 [DOI] [PubMed] [Google Scholar]
- 12.Constantin-Teodosiu D. (2013) Regulation of muscle pyruvate dehydrogenase complex in insulin resistance: effects of exercise and dichloroacetate. Diabetes Metab. J. 37, 301–314 [DOI] [PMC free article] [PubMed] [Google Scholar]
- 13.Rahimi Y., Camporez J. P., Petersen M. C., Pesta D., Perry R. J., Jurczak M. J., Cline G. W., and Shulman G. I. (2014) Genetic activation of pyruvate dehydrogenase alters oxidative substrate selection to induce skeletal muscle insulin resistance. Proc. Natl. Acad. Sci. U.S.A. 111, 16508–16513 [DOI] [PMC free article] [PubMed] [Google Scholar]
- 14.Kim J. W., Tchernyshyov I., Semenza G. L., and Dang C. V. (2006) HIF-1-mediated expression of pyruvate dehydrogenase kinase: a metabolic switch required for cellular adaptation to hypoxia. Cell Metab. 3, 177–185 [DOI] [PubMed] [Google Scholar]
- 15.McFate T., Mohyeldin A., Lu H., Thakar J., Henriques J., Halim N. D., Wu H., Schell M. J., Tsang T. M., Teahan O., Zhou S., Califano J. A., Jeoung N. H., Harris R. A., and Verma A. (2008) Pyruvate dehydrogenase complex activity controls metabolic and malignant phenotype in cancer cells. J. Biol. Chem. 283, 22700–22708 [DOI] [PMC free article] [PubMed] [Google Scholar]
- 16.Schulze A., and Downward J. (2011) Flicking the Warburg switch-tyrosine phosphorylation of pyruvate dehydrogenase kinase regulates mitochondrial activity in cancer cells. Mol. Cell 44, 846–848 [DOI] [PubMed] [Google Scholar]
- 17.Feron O. (2009) Pyruvate into lactate and back: from the Warburg effect to symbiotic energy fuel exchange in cancer cells. Radiother. Oncol. 92, 329–333 [DOI] [PubMed] [Google Scholar]
- 18.Sugden M. C., Bulmer K., and Holness M. J. (2001) Fuel-sensing mechanisms integrating lipid and carbohydrate utilization. Biochem. Soc. Trans. 29, 272–278 [DOI] [PubMed] [Google Scholar]
- 19.Linn T. C., Pettit F. H., and Reed L. J. (1969) α-Keto acid dehydrogenase complexes. X. Regulation of the activity of the pyruvate dehydrogenase complex from beef kidney mitochondria by phosphorylation and dephosphorylation. Proc. Natl. Acad. Sci. U.S.A. 62, 234–241 [DOI] [PMC free article] [PubMed] [Google Scholar]
- 20.Patel M. S., and Korotchkina L. G. (2001) Regulation of mammalian pyruvate dehydrogenase complex by phosphorylation: complexity of multiple phosphorylation sites and kinases. Exp. Mol. Med. 33, 191–197 [DOI] [PubMed] [Google Scholar]
- 21.Kolobova E., Tuganova A., Boulatnikov I., and Popov K. M. (2001) Regulation of pyruvate dehydrogenase activity through phosphorylation at multiple sites. Biochem. J. 358, 69–77 [DOI] [PMC free article] [PubMed] [Google Scholar]
- 22.Roche T. E., Hiromasa Y., Turkan A., Gong X., Peng T., Yan X., Kasten S. A., Bao H., and Dong J. (2003) Essential roles of lipoyl domains in the activated function and control of pyruvate dehydrogenase kinases and phosphatase isoform 1. Eur. J. Biochem. 270, 1050–1056 [DOI] [PubMed] [Google Scholar]
- 23.Green T., Grigorian A., Klyuyeva A., Tuganova A., Luo M., and Popov K. M. (2008) Structural and functional insights into the molecular mechanisms responsible for the regulation of pyruvate dehydrogenase kinase 2. J. Biol. Chem. 283, 15789–15798 [DOI] [PMC free article] [PubMed] [Google Scholar]
- 24.Kato M., Chuang J. L., Tso S. C., Wynn R. M., and Chuang D. T. (2005) Crystal structure of pyruvate dehydrogenase kinase 3 bound to lipoyl domain 2 of human pyruvate dehydrogenase complex. EMBO J. 24, 1763–1774 [DOI] [PMC free article] [PubMed] [Google Scholar]
- 25.Vassylyev D. G., and Symersky J. (2007) Crystal structure of pyruvate dehydrogenase phosphatase 1 and its functional implications. J. Mol. Biol. 370, 417–426 [DOI] [PMC free article] [PubMed] [Google Scholar]
- 26.Cate R. L., and Roche T. E. (1978) A unifying mechanism for stimulation of mammalian pyruvate dehydrogenase(a) kinase by reduced nicotinamide adenine dinucleotide, dihydrolipoamide, acetyl coenzyme A, or pyruvate. J. Biol. Chem. 253, 496–503 [PubMed] [Google Scholar]
- 27.Ravindran S., Radke G. A., Guest J. R., and Roche T. E. (1996) Lipoyl domain-based mechanism for the integrated feedback control of the pyruvate dehydrogenase complex by enhancement of pyruvate dehydrogenase kinase activity. J. Biol. Chem. 271, 653–662 [DOI] [PubMed] [Google Scholar]
- 28.Teodoro J. S., Gomes A. P., Varela A. T., Duarte F. V., Rolo A. P., and Palmeira C. M. (2013) Uncovering the beginning of diabetes: the cellular redox status and oxidative stress as starting players in hyperglycemic damage. Mol. Cell. Biochem. 376, 103–110 [DOI] [PubMed] [Google Scholar]
- 29.Ussher J. R., Jaswal J. S., and Lopaschuk G. D. (2012) Pyridine nucleotide regulation of cardiac intermediary metabolism. Circ. Res. 111, 628–641 [DOI] [PubMed] [Google Scholar]
- 30.Wilkinson K. D., and Williams C. H. Jr. (1981) NADH inhibition and NAD activation of Escherichia coli lipoamide dehydrogenase catalyzing the NADH-lipoamide reaction. J. Biol. Chem. 256, 2307–2314 [PubMed] [Google Scholar]
- 31.Sahlman L., and Williams C. H. Jr. (1989) Lipoamide dehydrogenase from Escherichia coli. Steady-state kinetics of the physiological reaction. J. Biol. Chem. 264, 8039–8045 [PubMed] [Google Scholar]
- 32.Matthews J., and Reed L. J. (1963) Purification and properties of a dihydrolipoic dehydrogenase from Spinacia oleracea. J. Biol. Chem. 238, 1869–1876 [PubMed] [Google Scholar]
- 33.Ide S., Hayakawa T., Okabe K., and Koike M. (1967) Lipoamide dehydrogenase from human liver. J. Biol. Chem. 242, 54–60 [PubMed] [Google Scholar]
- 34.Reed J. K. (1973) Studies on the kinetic mechanism of lipoamide dehydrogenase from rat liver mitochondria. J. Biol. Chem. 248, 4834–4839 [PubMed] [Google Scholar]
- 35.Schwartz E. R., and Reed L. J. (1970) Regulation of the activity of the pyruvate dehydrogenase complex of Escherichia coli. Biochemistry 9, 1434–1439 [DOI] [PubMed] [Google Scholar]
- 36.Kerbey A. L., Randle P. J., Cooper R. H., Whitehouse S., Pask H. T., and Denton R. M. (1976) Regulation of pyruvate dehydrogenase in rat heart. Mechanism of regulation of proportions of dephosphorylated and phosphorylated enzyme by oxidation of fatty acids and ketone bodies and of effects of diabetes: role of coenzyme A, acetyl-coenzyme A and reduced and oxidized nicotinamide-adenine dinucleotide. Biochem. J. 154, 327–348 [DOI] [PMC free article] [PubMed] [Google Scholar]
- 37.Hansford R. G. (1976) Studies on the effects of coenzyme A-SH: acetyl coenzyme A, nicotinamide adenine dinucleotide: reduced nicotinamide adenine dinucleotide, and adenosine diphosphate: adenosine triphosphate ratios on the interconversion of active and inactive pyruvate dehydrogenase in isolated rat heart mitochondria. J. Biol. Chem. 251, 5483–5489 [PubMed] [Google Scholar]
- 38.Frey P. A., and Hegeman A. D. (2007) Enzymatic Reaction Mechanisms, pp. 129–139, Oxford University Press, New York [Google Scholar]
- 39.Massey V., and Veeger C. (1961) Studies on the reaction mechanism of lipoyl dehydrogenase. Biochim. Biophys. Acta 48, 33–47 [DOI] [PubMed] [Google Scholar]
- 40.v Muiswinkel-Voetberg H., and Veeger C. (1973) Conformational studies on lipoamide dehydrogenase from pig heart. 4. The binding of NAD+ to non-equivalent sites. Eur. J. Biochem. 33, 285–291 [DOI] [PubMed] [Google Scholar]
- 41.Moxley M. A., Beard D. A., and Bazil J. N. (2014) A pH-dependent kinetic model of dihydrolipoamide dehydrogenase from multiple organisms. Biophys. J. 107, 2993–3007 [DOI] [PMC free article] [PubMed] [Google Scholar]
- 42.Tsai C. S., and Wand A. J. (1992) pH dependent kinetic studies of lipoamide dehydrogenase catalysis. Int. J. Biochem. 24, 1801–1806 [DOI] [PubMed] [Google Scholar]
- 43.Leichus B. N., and Blanchard J. S. (1992) Pig heart lipoamide dehydrogenase: solvent equilibrium and kinetic isotope effects. Biochemistry 31, 3065–3072 [DOI] [PubMed] [Google Scholar]
- 44.Klyachko N. L., Shchedrina V. A., Efimov A. V., Kazakov S. V., Gazaryan I. G., Kristal B. S., and Brown A. M. (2005) pH-dependent substrate preference of pig heart lipoamide dehydrogenase varies with oligomeric state: response to mitochondrial matrix acidification. J. Biol. Chem. 280, 16106–16114 [DOI] [PubMed] [Google Scholar]
- 45.Matthews R. G., Ballou D. P., Thorpe C., and Williams C. H. Jr. (1977) Ion pair formation in pig heart lipoamide dehydrogenase: rationalization of pH profiles for reactivity of oxidized enzyme with dihydrolipoamide and 2-electron-reduced enzyme with lipoamide and iodoacetamide. J. Biol. Chem. 252, 3199–3207 [PubMed] [Google Scholar]
- 46.Matthews R. G., Ballou D. P., and Williams C. H. Jr. (1979) Reactions of pig heart lipoamide dehydrogenase with pyridine nucleotides. Evidence for an effector role for bound oxidized pyridine nucleotide. J. Biol. Chem. 254, 4974–4981 [PubMed] [Google Scholar]
- 47.Matthews R. G., and Williams C. H. Jr. (1976) Measurement of the oxidation-reduction potentials for two-electron and four-electron reduction of lipoamide dehydrogenase from pig heart. J. Biol. Chem. 251, 3956–3964 [PubMed] [Google Scholar]
- 48.Cornish-Bowden A. (2012) Fundamentals of Enzyme Kinetics, 4th ed., pp. 33–34, Wiley-Blackwell, Weinheim [Google Scholar]
- 49.Lakowicz J. R. (2006) Principles of Fluorescence Spectroscopy, 3rd ed., pp. 55–57, Springer, New York [Google Scholar]
- 50.Massey V. (1966) Lipoyl dehydrogenase from pig heart. Methods Enzymol. 9, 272–278 [Google Scholar]
- 51.Beard D. A., and Qian H. (2008) in Chemical Biophysics: Quantitative Analysis of Cellular Systems (Saltzman W. M., and Chien S., eds) pp. 26–30, Cambridge University Press, Cambridge, UK [Google Scholar]
- 52.Clark W. M. (1960) Oxidation-Reduction Potentials of Organic Systems, pp. 321–329, Williams & Wilkins, Baltimore, MD [Google Scholar]
- 53.Goldberg R. N., Tewari Y. B., and Bhat T. N. (2004) Thermodynamics of enzyme-catalyzed reactions–a database for quantitative biochemistry. Bioinformatics 20, 2874–2877 [DOI] [PubMed] [Google Scholar]
- 54.Blinova K., Carroll S., Bose S., Smirnov A. V., Harvey J. J., Knutson J. R., and Balaban R. S. (2005) Distribution of mitochondrial NADH fluorescence lifetimes: steady-state kinetics of matrix NADH interactions. Biochemistry 44, 2585–2594 [DOI] [PubMed] [Google Scholar]
- 55.de Graef M. R., Alexeeva S., Snoep J. L., and Teixeira de Mattos M. J. (1999) The steady-state internal redox state (NADH/NAD) reflects the external redox state and is correlated with catabolic adaptation in Escherichia coli. J. Bacteriol. 181, 2351–2357 [DOI] [PMC free article] [PubMed] [Google Scholar]
- 56.Scott D. A., Grotyohann L. W., Cheung J. Y., and Scaduto R. C. Jr. (1994) Ratiometric methodology for NAD(P)H measurement in the perfused rat heart using surface fluorescence. Am. J. Physiol. 267, H636–H644 [DOI] [PubMed] [Google Scholar]
- 57.Williamson D. H., Lund P., and Krebs H. A. (1967) The redox state of free nicotinamide-adenine dinucleotide in the cytoplasm and mitochondria of rat liver. Biochem. J. 103, 514–527 [DOI] [PMC free article] [PubMed] [Google Scholar]
- 58.Stein L. R., and Imai S. (2012) The dynamic regulation of NAD metabolism in mitochondria. Trends Endocrinol. Metab. 23, 420–428 [DOI] [PMC free article] [PubMed] [Google Scholar]
- 59.Cook P. F., and Cleland W. W. (2007) Enzyme Kinetics and Mechanism, pp. 37–39, 128,–172, and 354–359, Garland Science, London [Google Scholar]
- 60.Maeder M., and Neuhold Y.-M. (2007) Practical Data Analysis in Chemistry, pp. 33–36, Elsevier, Amsterdam; London [Google Scholar]
- 61.Argyrou A., Blanchard J. S., and Palfey B. A. (2002) The lipoamide dehydrogenase from Mycobacterium tuberculosis permits the direct observation of flavin intermediates in catalysis. Biochemistry 41, 14580–14590 [DOI] [PubMed] [Google Scholar]
- 62.Argyrou A., Sun G., Palfey B. A., and Blanchard J. S. (2003) Catalysis of diaphorase reactions by Mycobacterium tuberculosis lipoamide dehydrogenase occurs at the EH4 level. Biochemistry 42, 2218–2228 [DOI] [PubMed] [Google Scholar]
- 63.Tsai C. S. (1980) Kinetic studies of multifunctional reactions catalysed by lipoamide dehydrogenase. Int. J. Biochem. 11, 407–413 [DOI] [PubMed] [Google Scholar]
- 64.Segel I. H. (1993) Enzyme Kinetics: Behavior and Analysis of Rapid Equilibrium and Steady State Enzyme Systems, pp. 657–660 and 884–941, “Wiley Classics Library Edition,” Wiley, New York [Google Scholar]
- 65.Bazil J. N., Vinnakota K. C., Wu F., and Beard D. A. (2013) Analysis of the kinetics and bistability of ubiquinol:cytochrome c oxidoreductase. Biophys. J. 105, 343–355 [DOI] [PMC free article] [PubMed] [Google Scholar]
- 66.Johson K. A. (2013) A century of enzyme kinetic analysis, 1913–2013. FEBS Lett. 587, 2753–2766 [DOI] [PMC free article] [PubMed] [Google Scholar]
- 67.Zilberstein D., Agmon V., Schuldiner S., and Padan E. (1984) Escherichia coli intracellular pH, membrane potential, and cell growth. J Bacteriol 158, 246–252 [DOI] [PMC free article] [PubMed] [Google Scholar]
- 68.Koike M., Reed L. J., and Carroll W. R. (1963) α-Keto acid dehydrogenation complexes. IV. Resolution and reconstitution of the Escherichia coli pyruvate dehydrogenation complex. J. Biol. Chem. 238, 30–39 [PubMed] [Google Scholar]
- 69.Argyrou A., and Blanchard J. S. (2004) Flavoprotein disulfide reductases: advances in chemistry and function. Prog. Nucleic Acids Res. Mol. Biol. 78, 89–142 [DOI] [PubMed] [Google Scholar]
- 70.Raddatz G., and Bisswanger H. (1997) Receptor site and stereospecificity of dihydrolipoamide dehydrogenase for R- and S-lipoamide: a molecular modeling study. J. Biotechnol. 58, 89–100 [DOI] [PubMed] [Google Scholar]
- 71.Bryk R., Arango N., Maksymiuk C., Balakrishnan A., Wu Y. T., Wong C. H., Masquelin T., Hipskind P., Lima C. D., and Nathan C. (2013) Lipoamide channel-binding sulfonamides selectively inhibit mycobacterial lipoamide dehydrogenase. Biochemistry 52, 9375–9384 [DOI] [PMC free article] [PubMed] [Google Scholar]
- 72.Schrödinger L. L. (2010) The PyMOL Molecular Graphics System, Version 0.99, Schrödinger, LLC, New York [Google Scholar]
Associated Data
This section collects any data citations, data availability statements, or supplementary materials included in this article.


