

Summary
We present genome‐wide gene expression patterns as a time series through the infection cycle of the fungal pine needle blight pathogen, Dothistroma septosporum, as it invades its gymnosperm host, Pinus radiata. We determined the molecular changes at three stages of the disease cycle: epiphytic/biotrophic (early), initial necrosis (mid) and mature sporulating lesion (late). Over 1.7 billion combined plant and fungal reads were sequenced to obtain 3.2 million fungal‐specific reads, which comprised as little as 0.1% of the sample reads early in infection. This enriched dataset shows that the initial biotrophic stage is characterized by the up‐regulation of genes encoding fungal cell wall‐modifying enzymes and signalling proteins. Later necrotrophic stages show the up‐regulation of genes for secondary metabolism, putative effectors, oxidoreductases, transporters and starch degradation. This in‐depth through‐time transcriptomic study provides our first snapshot of the gene expression dynamics that characterize infection by this fungal pathogen in its gymnosperm host.
Keywords: dothideomycete, Dothistroma needle blight, forest pathogen, gymnosperm pathogen, hemibiotroph, RNA sequencing, transcriptome
Introduction
Comparative genomic and transcriptomic studies of plant pathogens are increasingly providing insights into the genetics of virulence in fungi with different pathogenic lifestyles. These studies have revealed the importance of many types of molecule in the arsenal of plant pathogens, such as proteinaceous effectors, secondary metabolites and carbohydrate active enzymes (CAZys) (McDowell, 2013; O'Connell et al., 2012; Ohm et al., 2012; Stergiopoulos et al., 2013). A knowledge of these molecules and their interactions has led directly to the identification and deployment of hosts with increased resistance to these pathogens (Dangl et al., 2013; Vleeshouwers and Oliver, 2014). Most of these studies, however, have concerned the pathogens of angiosperms, and genetic information about how gymnosperm pathogens subdue their hosts and cause disease is only just starting to emerge (Kubisiak et al., 2011; Pendleton et al., 2014; Sniezko et al., 2014; Williams et al., 2014).
The dothideomycete fungus Dothistroma septosporum (Dorog.) Morelet is a foliar pathogen of pines. It causes Dothistroma needle blight (DNB), a disease that has increased dramatically in occurrence and severity over the last 20 years, particularly in the Northern Hemisphere (Bulman et al., 2013; Watt et al., 2009). Dothistroma septosporum has a hemibiotrophic lifestyle, with a long asymptomatic stage prior to the onset of host cell death (Kabir et al., 2015b). The D. septosporum genome sequence is available (de Wit et al., 2012) and a small number of comparative genomics studies have been carried out (Ohm et al., 2012; de Wit et al., 2012), but we still have only a poor understanding of how D. septosporum interacts with its host at the molecular level throughout the infection cycle.
Key aspects of the pathogen–plant interaction must be determined for both biotrophic and necrotrophic stages of the D. septosporum life cycle in order to identify virulence factors. During the biotrophic stages of infection in other pathosystems, proteinaceous effectors, such as CfAvr4 and CfEcp2 in the tomato pathogen Cladosporium fulvum, have virulence functions that enable the pathogen to overcome non‐specific immune defences of the plant (van den Burg et al., 2006; Laugé et al., 1997). Some of these effectors are recognized by plant immune receptors, enabling the host to mount a strong effector‐triggered immunity defence response against the pathogen (Stergiopoulos and de Wit, 2009). The D. septosporum genome contains orthologues of C. fulvum effector genes, including Avr4 and Ecp2, whose products are recognized by cognate tomato immune receptors, resulting in a localized cell death response (de Wit et al., 2012). Such recognition is remarkable considering the diverse hosts of these two pathogens (spanning angiosperms and gymnosperms), but it is not known whether there are cognate immune receptors in pines, or whether other more specific biotrophic effectors are functional in the D. septosporum–pine system. Similarly, it is not known how the transition to necrotrophy is triggered or how initial necrotic lesions are formed. The fungal toxin dothistromin facilitates lesion expansion during the necrotrophic stage, but is not required for lesion initiation (Kabir et al., 2015a). It is possible that different types of non‐host‐specific toxins or necrotrophic effectors function to kill host tissue, either directly or indirectly, as shown for other pathogens (Daub et al., 2005; Friesen et al., 2008).
Discerning plant–pathogen interactions in conifers, such as pines, presents many challenges. Their long life cycles complicate breeding studies, as it can take many years to reach sexual maturity (Wilcox, 1983). Although resistance (in the form of increased tolerance) to DNB is known to have a genetic component (Kennedy et al., 2014), no quantitative trait locus (QTL) mapping has been performed to identify loci associated with this resistance and no host cultivar–pathogen race specificities are known. The infection of pine seedlings with D. septosporum in controlled conditions is difficult to achieve, although improvements in methods have increased success rates (Kabir et al., 2013). The disease cycle is lengthy (6–12 weeks under controlled conditions), not all needles show symptoms and it is not possible to predict where necrotic lesions will appear, as most needle penetration events do not result in lesions (Kabir et al., 2015a). Thus, it remains difficult to obtain a synchronous infection in which replicate samples have the same stage of infection.
Next‐generation sequencing technologies make molecular studies of recalcitrant plant–pathogen systems, such as the pine–Dothistroma system, feasible (McDowell, 2013; Williams et al., 2014), but these are still far from easy. As a result of their large genome sizes (>20 Gb), genome sequencing of conifers remains in its infancy (Neale and Kremer, 2011); in 2013, the conifer Norway spruce (Picea abies) was the first gymnosperm genome to be sequenced (Nystedt et al., 2013), and only one pine genome sequence (Pinus taeda) is publically available today (Zimin et al., 2014). Both are very much draft genomes, still in tens of millions of pieces. In contrast, the genome sequence of Pinus radiata is not yet available at all. Transcriptomic studies of gymnosperm pathogens are therefore extremely challenging, as most reads derive from the host (>>99% early in the infection cycle) and few genomic resources are available to study them. Conversely, fungal reads are few (often comprising less than 0.1% of the sequence total), which makes attempts to obtain a sufficient depth of sequencing for gene expression analysis both challenging and expensive. Nevertheless, a time‐series study throughout the infection cycle is critical to provide our first glimpse of genome‐wide molecular dynamics as a fungal pathogen establishes itself in a gymnosperm host. Genome‐wide gene expression dynamics provide vital information for the identification of potential virulence factors for further functional analysis (Sperschneider et al., 2014; Vleeshouwers and Oliver, 2014). Thus, the aim of this work was to develop a time‐series transcriptomics resource for D. septosporum by RNA sequencing of a semi‐synchronized infection of P. radiata needles with samples taken at a biotrophic stage (‘early’) and two necrotrophic stages (‘mid’, ‘late’), and to perform a preliminary analysis of gene expression dynamics from these data. This resource will accelerate progress in the identification of molecular targets and facilitate the development of new tools for the management of DNB.
Results and Discussion
The transcriptome
The achievement of reliable and consistent levels of DNB infection by artificial inoculation under controlled conditions is difficult and the durations of the symptomless and lesion maturation stages vary both within and between experiments (Kabir et al., 2013). Thus a semi‐synchronized infection was established for this transcriptomic study. Clonal plants (cuttings) were used to minimize variation between replicates as a result of host genotype effects, and samples were taken at three clearly defined stages: early (hyphal network on needle surface and early penetration events), mid (initial lesions) and late (sporulating lesions) (Fig. 1). It was not possible to identify and select regions of the needle immediately prior to transition from biotrophy to necrotrophy based on macroscopic symptoms, as lesions appear in a seemingly random fashion at discrete points along a needle despite the epiphytic fungal growth being spread across the whole needle.
Figure 1.
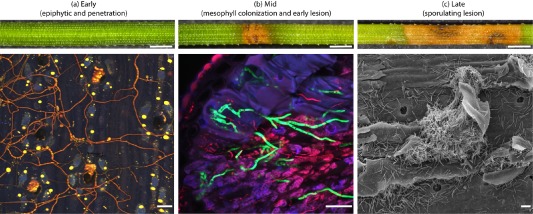
Stages of Dothistroma needle blight on Pinus radiata needles used for transcriptome samples. (a)–(c) Early, mid and late stages of disease caused by D. septosporum on P. radiata. (a) Confocal view of epiphytic fungal growth, stained with trypan blue, over the needle surface at early stage; hyphae have penetrated the needle through stomatal pores and colonized epistomatal chambers (bottom), but there are no macroscopic needle symptoms (top). (b) Confocal needle cross‐section showing mesophyll colonization by a green fluorescent protein‐labelled strain (Kabir et al., 2015b) at mid stage (bottom) when lesions are first evident on the needle surface (top). (c) Scanning electron microscopy image of needle surface at late stage when masses of spores are released from an erupted mature lesion in the needle (bottom). Extended necrotic bands with black fruiting bodies are evident on the needle surface (top). Macroscopic (top) and microscopic (bottom) size bars are 1 mm and 20 μm, respectively.
In total, more than three million reads from the in planta samples were mapped to D. septosporum coding sequences, and the percentages of fungal reads in the combined fungal–plant RNA mixture were estimated (Table 1). The increase in fungal reads from 0.5% at mid stage to 17.1% at late stage (Table 1) is consistent with the rapid increase in fungal biomass that occurs during this period (Kabir et al., 2015b), although differences between replicates occurred at each stage of sampling (Table S1, see Supporting Information). Attempts to validate gene expression levels with real‐time quantitative polymerase chain reaction (qPCR) were problematic because of the very low proportions of fungal reads at early and mid stages.
Table 1.
Dothistroma septosporum transcriptome statistics
| Total reads | Number of mapped fungal readsa | Fungal reads percentage of total readsb | |
|---|---|---|---|
| Fungal mycelium in vitro | 86 392 832 | 60 533 198 | 100 |
| Early in planta | 683 221 605 | 512 742 | 0.1 |
| Mid in planta | 1 033 815 851 | 871 668 | 0.5 |
| Late in planta | 17 146 358 | 1 883 653 | 17.1 |
| Total in planta | 1 734 183 814 | 3 268 063 |
Mapped to D. septosporum coding sequences.
Normalized based on the percentage of mapped reads in the in vitro samples (see Experimental procedures).
Comparisons between gene expression in vitro and in planta
The 100 most highly expressed D. septosporum genes in each plant infection stage (early, mid, late) or fungal mycelium (FM) in vitro are shown in Tables S2–S5 (see Supporting Information). Compared with growth in planta, in vitro mycelium showed more highly expressed genes encoding ribosomal proteins (41%) in the top 100, indicative of active growth. In contrast, all in planta samples showed high expression of fungal alcohol and aldehyde dehydrogenase genes (third and 10th most highly expressed in early samples, respectively). The tomato pathogen C. fulvum also showed elevated expression of these two gene types in planta (Coleman et al., 1997), although functional studies of the latter showed that it was not required for pathogenicity (Segers et al., 2001). Plants, including pines, can produce acetaldehyde and ethanol under stress (Karl et al., 2005; Kimmerer and Kozlowski, 1982). Pines also produce terpenoid defence chemicals; alcohol and aldehyde metabolism genes have been implicated in terpenoid processing in the pine pathogen Grossmania clavigera (DiGuistini et al., 2011). However, whether such enzymatic activity has any role in detoxification or pathogen nutrition during the growth of D. septosporum in planta is not known.
Many pathogenic fungi metabolize gluconeogenic carbon sources, such as alcohols and lipids, often found as nutrient stores in fungal spores, to provide nutrition during germination and host penetration (Divon and Fluhr, 2007). Key molecules involved in gluconeogenesis are the glyoxylate cycle enzymes isocitrate lyase (Ds70574) and malate synthase (Ds67442). Genes encoding both of these were significantly up‐regulated throughout all in planta stages compared with expression in vitro, consistent with a possible role in pathogenesis in D. septosporum, as shown previously for isocitrate lyase in Leptosphaeria maculans (Idnurm and Howlett, 2002).
Other D. septosporum genes of interest that were highly expressed in planta included C‐type lectin (carbohydrate‐binding domain) genes Ds75130 (fifth most highly expressed in early stage) and Ds72737 (most highly expressed in late stage), as well as signalling, stress and defence‐related genes (Tables S2–S5). Lectin domains are important components of many plant immunity receptors (Lannoo and Van Damme, 2014) and secreted fungal lectin proteins might bind to and mask fungal pathogen‐associated molecular patterns (PAMPs) to prevent recognition at the early stage of infection. Another gene showing very high expression at both mid and late stages (10th and eighth most highly expressed, respectively) is predicted to encode a class II hydrophobin (Ds75009; Hdp1). Fungal hydrophobins have been shown to have roles in adhesion and in lowering host immunity (Dagenais et al., 2010; Lacroix et al., 2008); however, in D. septosporum, deletion of the Hdp1 hydrophobin gene did not lead to any discernable loss of virulence (Text S1, see Supporting Information).
Amongst the top 20 most highly expressed genes, more secreted proteins were predicted for the early stage (13) compared with the mid (three) or late (six) stages (Tables S2–S5). Other genes highly expressed in planta that are predicted to encode secreted proteins, such as CAZys and short secreted cysteine‐rich proteins (SSCPs), are discussed below.
To determine which genes were up‐regulated in planta compared with in vitro, we compared the time‐series in planta samples with the in vitro FM samples. Of the 12 548 annotated gene models in the D. septosporum genome, 4019 were significantly up‐regulated in planta (Fig. 2), with 1607, 1699 and 3262 genes differentially expressed at early, mid and late stages compared with in vitro, respectively. As well as having the highest number of up‐regulated genes amongst the three pairwise comparisons, the FM–late comparison also had the largest proportion of unique up‐regulated genes (44%). In contrast, only 21% and 19% of up‐regulated genes in the FM–early and FM–mid stage comparisons were unique to those stages. These results suggest that the largest changes in gene expression in planta compared with in vitro occurred at the late stage of DNB, at least for the type of medium used in this study.
Figure 2.
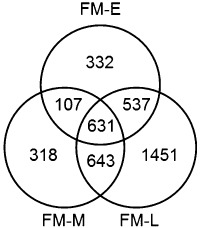
Numbers of Dothistroma septosporum genes up‐regulated in planta compared with in vitro. Venn diagram showing significantly up‐regulated genes at each in planta time point (E, early; M, mid; L, late) compared with the in vitro sample (FM, fungal mycelium).
Enrichment analysis was performed on the differentially expressed gene (DEG) sets to determine the major gene ontology (GO) (Biological Process) categories of genes up‐regulated in planta compared with in vitro, and the results were visualized using REVIGO (Fig. S1, see Supporting Information). Notable categories of up‐regulated genes included those involved in response to oxidative stress (early stage), cell division and secondary metabolism (mid stage) and catabolism of carbohydrates and organic acids (late stage).
To study differential gene expression in more detail, the most highly up‐regulated genes in each plant infection stage (early, mid, late) compared with in vitro were determined. The top 20 in each comparison are shown in Table 2 (full lists in Tables S6–S8, see Supporting Information). All three comparisons showed strong up‐regulation of oxidoreductases and hypothetical proteins (at least 15% and 32% of the top 100 up‐regulated genes, respectively). However, only a small proportion (less than 7%) of the up‐regulated hypothetical protein genes were unique to D. septosporum in each stage (Table S9). Closer analysis of the selected categories of genes generally considered to be involved in pathogenicity was then performed (Table 3). Here, we found enrichment in the necrotrophic stages (FM–mid and FM–late) for SSCPs, oxidoreductase, membrane transporter and secondary metabolism‐related genes. In contrast, a bimodal‐type pattern of enrichment for increased expression in both early and late stages was seen for predicted secreted proteins and CAZys (Table 3), suggestive of distinct phases of carbohydrate metabolism.
Table 2.
Top 20 up‐regulated genes in planta (early, mid, late) compared with in vitro
| Gene name | FM RPMK | E RPMK | FM–Ea fold change | Typeb |
|---|---|---|---|---|
| Ds74297 | 3.7 | 618.1 | 168.4 | Oxidoreductase |
| Ds141173 | 2.9 | 455.6 | 156.6 | Peroxidase |
| Ds26641 | 0.3 | 40.8 | 145.6 | Oxidoreductase |
| Ds135407 | 1.9 | 274.4 | 142.6 | Peroxidase (S) |
| Ds128201 | 0.7 | 96.9 | 129.3 | Hydrolase (S) |
| Ds73520 | 7.6 | 818.8 | 107.6 | Hypothetical protein (S) |
| Ds46004 | 0.9 | 89.6 | 102.8 | Oxidoreductase |
| Ds75970 | 5.3 | 502.8 | 94.8 | Peroxidase (S) |
| Ds81082 | 4.5 | 417.3 | 93.5 | Hypothetical protein |
| Ds74694 | 14.0 | 1210.2 | 86.7 | Membrane transporter |
| Ds130443 | 2.8 | 235.2 | 82.7 | Oxidoreductase (S) |
| Ds54448 | 3.4 | 227.4 | 66.7 | Catalase |
| Ds91245 | 6.8 | 446.3 | 66.0 | Hypothetical protein (S) |
| Ds169934 | 2.9 | 174.8 | 60.4 | Glycosyl hydrolase 18 (S) |
| Ds167942 | 1.6 | 93.4 | 59.0 | Oxidoreductase |
| Ds168452 | 3.5 | 204.8 | 58.0 | ATPase |
| Ds29350 | 2.4 | 132.5 | 56.3 | SSCPc (S) |
| Ds123585 | 6.9 | 353.4 | 51.0 | Transferase |
| Ds43598 | 9.0 | 448.3 | 50.0 | Oxidoreductase |
| Ds72090 | 73.9 | 3628.6 | 49.1 | Oxidoreductase (S) |
| Gene name | FM RPMK | M RPMK | FM–M fold change | Type |
|---|---|---|---|---|
| Ds74815 | 29.6 | 14686.0 | 496.1 | Hypothetical protein (S) |
| Ds151194 | 1.1 | 279.3 | 265.0 | Oxidoreductase |
| Ds131885 | 1.4 | 369.2 | 255.9 | SSCP (S) |
| Ds91219 | 7.0 | 1591.5 | 229.0 | Hypothetical protein |
| Ds62325 | 2.1 | 470.1 | 225.4 | Hydrolase |
| Ds178989 | 0.9 | 175.1 | 194.7 | Transaminase |
| Ds158381 | 1.3 | 243.6 | 185.8 | SSCP (S) |
| Ds74811 | 4.3 | 534.6 | 125.6 | Acetyltransferase |
| Ds72155 | 6.9 | 862.2 | 125.4 | Membrane transporter |
| Ds65936 | 1.6 | 180.2 | 113.8 | Hydrolase |
| Ds137959 | 3.5 | 390.7 | 111.0 | Glycosyl hydrolase 11 (S) |
| Ds123851 | 2.8 | 292.5 | 103.9 | Carbohydrate binding (S) |
| Ds73511 | 20.0 | 2063.1 | 103.0 | Oxidase |
| Ds75042 | 1.7 | 176.8 | 103.0 | Hypothetical protein (S) |
| Ds91360 | 3.2 | 334.2 | 102.9 | Oxidoreductase |
| Ds73744 | 5.7 | 580.6 | 101.3 | Hypothetical protein |
| Ds130807 | 1.0 | 101.4 | 101.0 | Hypothetical protein |
| Ds62319 | 1.0 | 91.2 | 94.9 | Oxidoreductase |
| Ds74810 | 3.7 | 340.1 | 92.0 | Acetyltransferase |
| Ds23844 | 3.2 | 279.5 | 86.6 | Oxidoreductase |
| Gene name | FM RPMK | L RPMK | FM–L fold change | Type |
|---|---|---|---|---|
| Ds73520 | 7.6 | 5421.0 | 712.5 | Hypothetical protein (S) |
| Ds70379 | 0.4 | 202.5 | 558.6 | Hypothetical protein (S) |
| Ds130443 | 2.8 | 1555.4 | 546.9 | Oxidoreductase (S) |
| Ds151194 | 1.1 | 523.3 | 496.5 | Oxidoreductase |
| Ds65621 | 1.9 | 884.4 | 466.0 | Glycosyl transferase 2 |
| Ds68817 | 2.2 | 876.1 | 393.2 | Membrane transporter |
| Ds71580 | 0.5 | 158.2 | 298.9 | Hypothetical protein |
| Ds134431 | 0.3 | 65.4 | 259.1 | Membrane transporter |
| Ds67488 | 1.7 | 420.3 | 250.2 | Hypothetical protein (S) |
| Ds72256 | 0.0 | 248.5 | 248.5 | Hypothetical protein |
| Ds90615 | 1.0 | 244.5 | 238.7 | Oxidoreductase |
| Ds62325 | 2.1 | 486.8 | 233.4 | Hydrolase |
| Ds72737 | 40.6 | 8994.5 | 221.6 | SSCP (S) |
| Ds129489 | 0.3 | 60.0 | 206.6 | Hypothetical protein (S) |
| Ds75953 | 10.3 | 2056.9 | 200.1 | Hypothetical protein |
| Ds57681 | 0.5 | 91.9 | 199.2 | Membrane protein |
| Ds74543 | 3.0 | 587.0 | 196.5 | Hypothetical protein |
| Ds47243 | 19.2 | 3507.3 | 182.7 | Hypothetical protein |
| Ds130807 | 1.0 | 174.0 | 173.2 | Hypothetical protein |
| Ds153258 | 0.2 | 38.7 | 155.3 | Glycosyl hydrolase 18 |
RPMK, reads per million per kilobase.
FM, fungal mycelium in vitro; E, early; M, mid; L, late stage in planta.
(S) indicates the protein is predicted to be secreted.
SSCP, short secreted cysteine‐rich protein.
Table 3.
Numbers of D othistroma septosporum genes in selected groups significantly up‐regulated in planta compared with in vitro
| Predicted protein typea | FM–earlyb | FM–mid | FM–late |
|---|---|---|---|
| Hypothetical proteins | 132 (22.6%) | 153 (24.1%) | 321 (25.6%) |
| Proteins with gene ontology (GO) terms | 451 (77.4%) | 482 (75.9%) | 932 (74.4%) |
| Secreted proteins | 112 (19.2%) | 94 (14.8%) | 222 (17.7%) |
| Non‐secreted proteins | 471 (80.8%) | 541 (85.2%) | 1031 (82.3%) |
| Oxidoreductase | 88 (15.1%) | 195 (30.7%) | 258 (20.6%) |
| Signalling | 42 (7.2%) | 12 (1.9%) | 19 (1.5%) |
| CAZy | 35 (6.0%) | 30 (4.7%) | 79 (6.3%) |
| Transcription factor | 10 (1.7%) | 10 (1.6%) | 42 (3.4%) |
| Oxidative stress | 9 (1.5%) | 8 (1.3%) | 1 (0.1%) |
| Translation | 8 (1.4%) | 13 (2.0%) | 6 (0.5%) |
| Membrane transporter | 6 (1.0%) | 14 (2.2%) | 29 (2.3%) |
| SSCP | 6 (1.0%) | 10 (1.6%) | 22 (1.8%) |
| Secondary metabolism | 4 (0.7%) | 29 (4.6%) | 25 (2.0%) |
| Dothistromin biosynthesis | 1 (0.2%) | 14 (2.2%) | 9 (0.7%) |
| Total genes significantly up‐regulated in planta | 583 | 635 | 1253 |
Broad categories of predicted proteins (hypothetical or GO function predicted, and secreted or non‐secreted) are shown, followed by specific protein categories of interest. Secreted proteins, CAZy (carbohydrate active enzymes), SSCP (short secreted cysteine‐rich proteins) and dothistromin genes are as defined previously (Chettri et al., 2013; de Wit et al., 2012). Others based on GO terms: oxidoreductase GO:0055114; membrane transporter GO:0022857; transcription factor GO:0000981; signalling GO:0023052; translation GO:0006412; response to oxidative stress GO:0006979; secondary metabolism GO:0044550.
Numbers of genes significantly up‐regulated in planta (early, mid or late) compared with in vitro (fungal mycelium, FM) as determined by DEGseq analysis (see section on Bioinformatics; Tables S6–S8) and a minimum of two‐fold up‐regulated. The percentages of total up‐regulated genes are shown in parentheses.
Comparisons of gene expression between early, mid and late stages in planta
We next investigated the main changes in D. septosporum gene expression between the three in planta stages. Similar numbers of genes were differentially expressed at each transition: 1172 genes from early to mid stage, and 977 from mid to late stage. However, REVIGO maps of the GO terms (Biological Process) enriched in these DEG sets (Fig. 3) showed significant changes in a much broader range of GO terms in the early to mid than in the mid to late in planta comparisons. These gene sets include those both up‐ and down‐regulated between stages and probably reflect the larger metabolic transition required to convert from epiphytic/biotrophic growth to initial necrotrophic growth in emerging disease lesions, compared with the transition between different stages of necrotrophy (Fig. 3; Tables S10 and S11, see Supporting Information).
Figure 3.
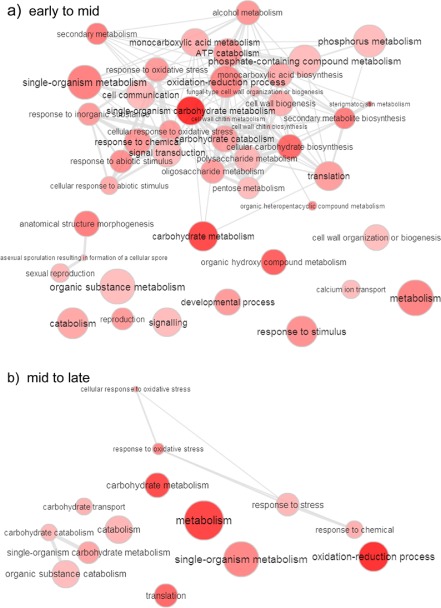
Differentially expressed gene ontology (GO) groups in planta. REVIGO interactive maps of enriched Biological Process GO terms determined from differentially expressed genes (up‐ and down‐regulated) between early to mid and mid to late stages of growth of Dothistroma septosporum in planta based on data in Tables S10 and S11. The data suggest more profound changes in the types of genes being expressed between early–mid than between mid–late stages. The sizes of the circles indicate the relative frequencies of GO terms in the dataset; darker shading indicates lower P values; highly similar GO terms are connected by lines, with thicker lines indicating closer similarity; the length of the lines is arbitrary (Supek et al., 2011).
To visualize some of the trends in gene expression over time in planta, the top 100 most highly expressed genes in selected classes of genes related to pathogenicity were profiled with heat maps (Figs 4 and S2, see Supporting Information). For each class of genes, waves of gene expression are seen across the three stages, similar to those reported for genes of the hemibiotrophic pathogen Colletotrichum higginsianum (O'Connell et al., 2012). The heat maps help to identify highly expressed genes that show stage‐specific expression in D. septosporum, and will be helpful in the search for genetic mechanisms of virulence at the various stages of disease.
Figure 4.
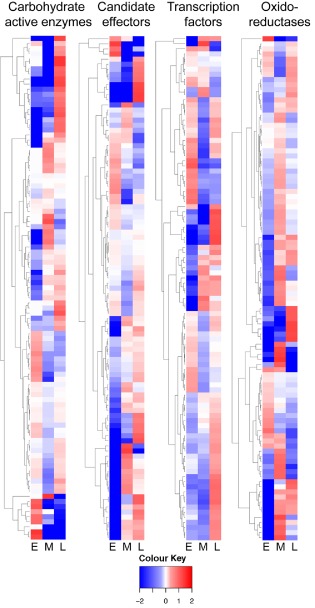
Heatmap profiles of Dothistroma septosporum gene expression in planta. Heatmaps showing expression of the top 100 most highly expressed genes [highest mean reads per million per kilobase (RPMK) in planta, but restricted to those with fold change > 2 and P < 0.05] in four functional categories. Fold (log2) increases (red) or decreases (blue) in expression of each gene are shown for each stage (E, early; M, mid; L, late) relative to the mean in planta expression of that gene (RPMK values) across all three in planta samples. Dendrograms indicate groups of genes with similar expression patterns. Gene categories and their GO terms are as listed in the footnote to Table 3.
Carbohydrate active enzymes
CAZys include glycosyl transferases, required for the biosynthesis of complex carbohydrates, as well as glycoside hydrolases (GH), polysaccharide lyases (PL) and carbohydrate esterases (CE), involved in carbohydrate catabolism (Lombard et al., 2014). The numbers of genes encoding GH, PL and CE enzymes are variable in the genomes of dothideomycetes with different lifestyles (Ohm et al., 2012), and can give clues about how fungi adapt to their hosts and derive nutrition (Brunner et al., 2013; Eastwood et al., 2011). The expression of D. septosporum CAZy genes (GH, PL and CE) in planta showed a high level of stage specificity (Fig. 4), similar to that observed in the related pathogen Zymoseptoria tritici (previously called Mycosphaerella graminicola) in wheat (Brunner et al., 2013). To analyse CAZy genes in more detail, they were grouped by enzyme substrate, and the numbers of genes in each group showing different patterns of gene expression in planta were determined. Genes in each substrate class showed a mixture of expression patterns (Fig. 5; Table S12, see Supporting Information).
Figure 5.
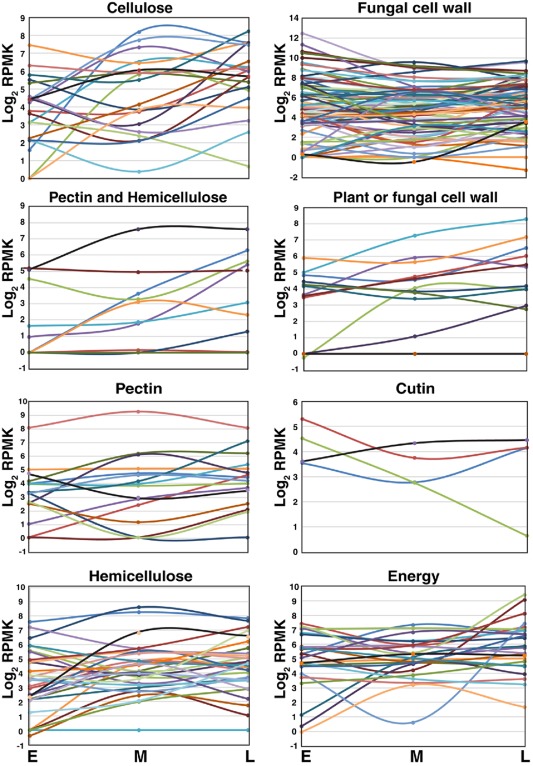
Expression of Dothistroma septosporum carbohydrate‐modifying enzyme genes in planta. Expression levels of D. septosporum CAZy (carbohydrate active enzyme) genes, grouped by predicted substrate, are shown as log2 RPMK (reads per million per kilobase) values at early (E), mid (M) and late (L) stages. Each arbitrarily coloured line represents one gene. Full data are given in Table S12.
Expression levels (reads per million per kilobase, RPMK) of D. septosporum CAZy genes over the three stages in planta (Fig. 5) provide some insight into the metabolism of this pathogen. Cutinase enzymes are virulence factors for some fungal pathogens (Lee et al., 2010), but the expression of cutinase genes in D. septosporum was low, consistent with penetration of the pathogen into the plant via stomata rather than through the cuticle. Genes involved in the degradation of plant cell wall components (pectin, cellulose, hemicellulose) are present in smaller numbers in D. septosporum compared with other hemibiotrophic and necrotrophic fungi (de Wit et al., 2012). Most of these genes are expressed in planta and, as expected, many show higher expression in the necrotrophic (mid and/or late) stages than in the biotrophic stage. Lower expression of certain enzymes during biotrophy might facilitate stealth pathogenesis, in which the pathogen evades host defence responses, as suggested for Z. tritici (Goodwin et al., 2011). Amongst the hemicellulose‐degrading enzymes, the levels of a GH11 endo‐1,4‐β‐xylanase (Xyl1) have been correlated with necrotic lesion development in Z. tritici (Siah et al., 2010); a D. septosporum orthologue, Ds137959 (65% amino acid identity to Xyl1), shows a 4.5‐fold increase in expression from early to mid stage (Table S12) and might possibly facilitate lesion development.
A group of CAZy genes with higher overall expression in the late necrotrophic stage are those involved with energy metabolism. Amongst these, two GH13 α‐amylase genes (Ds70643 and Ds75147) are of particular interest. They show 29‐fold and 16‐fold up‐regulation from mid to late stage, respectively (Table S12); we hypothesize that they might be needed to hydrolyse starch accumulated in green islands that are seen during lesion formation in DNB (Kabir et al., 2015a).
Most striking amongst the CAZy genes is the large number involved in fungal cell wall modification and the very high expression of some of these in the biotrophic stage (Fig. 5). Notable amongst these are two of the most highly expressed of all D. septosporum genes in the early stage: a GH17 gene (Ds73552, sixth highest) and a GH64 gene (Ds62617, 19th highest). The hemibiotroph Co. higginsianum also showed high induction of fungal cell wall‐modifying enzymes at an early stage of infection, which may be required for the remodelling of the fungal cell wall during appressorium formation (O'Connell et al., 2012). Although D. septosporum does not use appressoria for host infection, it does undergo a transition from epiphytic to endophytic growth during the early stage (Kabir et al., 2015b), which may require cell wall remodelling. Alternatively, fungal cell wall‐modifying enzymes might be deployed to inhibit the growth of other fungi that are present on or in the needle (Rovenich et al., 2014).
Effector candidates
SSCPs are generally regarded as candidate effectors that may function as virulence and/or avirulence factors. Typically, biotrophic effectors are secreted during the early stages of plant infection where they can reprogram the plant to enhance susceptibility (McDowell, 2013; Vleeshouwers and Oliver, 2014). Because the D. septosporum genome contains functional orthologues of C. fulvum Avr4 and Ecp2 SSCP‐type effector genes, we determined the expression profiles of SSCP genes in planta.
Similar to the hemibiotroph Co. higginsianum (O'Connell et al., 2012), in D. septosporum, there are waves of gene expression with SSCP genes showing a range of expression profiles (Fig. 4). More than one‐half of the predicted SSCP genes in the genome (86 of 159) were up‐regulated over two‐fold (with P < 0.05) in at least one stage in planta compared with in vitro. However, although small secreted proteins were predominantly up‐regulated in the biotrophic stage in Co. higginsianum and another hemibiotroph Co. orbiculare (Gan et al., 2013; O'Connell et al., 2012), we observed larger numbers of differentially expressed SSCP genes [Tables 3 and S13 (see Supporting Information); Fig. 6] and higher levels of expression (Tables S2–S4) in the late necrotrophic stage compared with the early biotrophic stage. The functions of most of the SSCP genes up‐regulated during the late stage could not be predicted by either blast or GO analysis, but some predicted functions include cerato‐platanin (Ds70155), hydrophobin (Ds75009) and a C‐type lectin (Ds72737; also the most highly expressed gene at late stage) (Tables S4 and S13). Eight genes were exclusively up‐regulated in mid stage; the pathogen might strategically deploy some effectors in this fashion to avoid early detection in colonization, whilst possibly needing them for the biotrophy–necrotrophy transition. Of the SSCP genes that are orthologues of known C. fulvum effectors, DsAvr4 (Ds36707) showed negligible expression at all stages, whereas DsEcp2‐1 (Ds158381) and DsEcp6 (Ds46236) were highly up‐regulated (31‐fold and 104‐fold, respectively) at mid stage compared with early stage (Table S10). These analyses reveal candidate effectors for future functional analysis.
Figure 6.
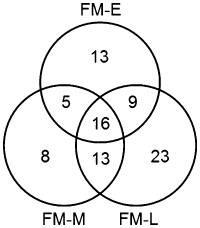
Numbers of Dothistroma septosporum effector candidate genes up‐regulated in planta. Venn diagram showing numbers of genes with expression differences [P < 0.05 and more than two‐fold increase in expression in planta (E, early; M, mid; L, late) compared with in vitro (FM, fungal mycelium)] amongst all predicted short secreted cysteine‐rich effector protein genes in the genome.
In some dothideomycetes, SSCP genes are near repetitive elements, which contribute to their plasticity (de Wit et al., 2012). As the expression of effector genes can be regulated at the chromatin level (Soyer et al., 2014) and chromosomal position can affect gene expression (Palmer and Keller, 2010), we surveyed the chromosomal locations of D. septosporum SSCP genes. No correlations of gene expression levels in planta with either distance from telomere or distance from repeats were found (Table S13).
Secondary metabolism
In D. septosporum, there are only 11 known key secondary metabolite backbone synthesis genes (such as polyketide synthase and non‐ribosomal peptide synthase genes), in contrast with other dothideomycetes that generally have at least 20 (de Wit et al., 2012). One of these genes, PksA, encodes a polyketide synthase necessary for the biosynthesis of the virulence factor dothistromin (Bradshaw et al., 2006). In vitro, PksA is co‐regulated, together with accessory dothistromin genes, despite them being distributed across a chromosome instead of clustered in the usual fashion for fungal secondary metabolite genes (Chettri et al., 2013), and dothistromin accumulates in needles mainly between the mid and late stages of infection (Kabir et al., 2015b). Figure 7a shows the co‐regulated expression of dothistromin genes in planta across the fragmented cluster on chromosome 12, with most genes having highest expression in the mid or late stages. No correlation was seen between the level of gene expression and either the position of the gene on the chromosome (distance from the telomere) or the order in which gene products function in the biosynthetic pathway, for any of the three in planta stages (Table S14, see Supporting Information).
Figure 7.
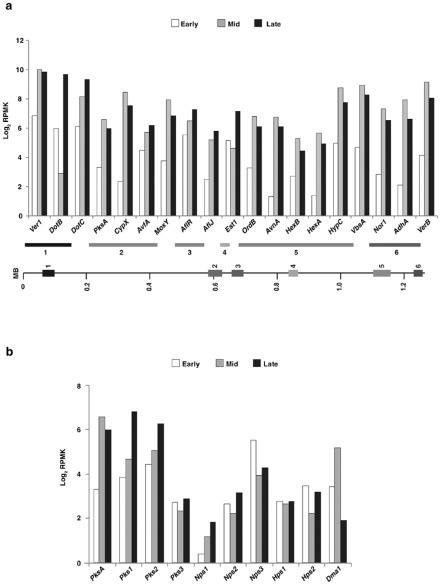
Expression of Dothistroma septosporum secondary metabolite genes in planta. (a) Expression levels of dothistromin biosynthetic and regulatory genes at early (E) (white), mid (M) (grey) and late (L) (black) stages of disease, shown as log2 RPMK (reads per million per kilobase) values. Differences in gene expression between stages were significant (P < 0.05), except for DsEst1 between E and M. Dothistromin genes are dispersed among six loci (indicated as blocks 1–6) across chromosome 12 (Chettri et al., 2013). (b) Expression levels of D. septosporum core secondary metabolite genes at the same stages as in (a). Differences in gene expression were significant (P < 0.05), except for DsPks3 and DsNps2 between E and M and DsHps1 at all stages.
In Co. higginsianum and Co. orbiculare, most key secondary metabolite genes were induced during the pre‐penetration and biotrophic phases (Gan et al., 2013; O'Connell et al., 2012); thus, we determined the expression patterns of key secondary metabolite genes for D. septosporum (Fig. 7b). Of the 11 core genes, only Nps3 (Ds71189) was significantly more highly expressed in the early stage compared with later stages. Amino acid analysis of Nps3 using Natural Product Domain Seeker (NaPDoS) suggests that it is a member of the cyclosporin synthase family (Ziemert et al., 2012). Expression of the other secondary metabolite core genes either did not differ more than two‐fold between stages (Pks3, Nps1, Hps1) or was highest in necrotrophic (mid and late) stages (Fig. 6b). However, it is possible that secondary metabolites produced by these core genes have a role in the disease process.
Other classes of genes
Oxidoreductase genes were amongst the most highly up‐regulated genes in planta (Tables 2, 3 and S6–S8). Dothistroma septosporum has over 1000 predicted oxidoreductase genes with, collectively, a wide variety of roles in the cell; most of the high expression was in mid and late stages (Fig. 4). In a comparative genome analysis of the class Dothideomycetes, oxidoreductase genes were found in a highly conserved syntenic block (Ohm et al., 2012). In the present study, the expression of all five of the oxidoreductase‐related genes within this syntenic block (Ds68642, Ds68644, Ds68651, Ds85192, Ds118862) increased significantly from early to mid stage. Orthologues of these genes were also up‐regulated in planta in Leptosphaeria maculans, and it was speculated that they may have a role in responding to oxidative stress (Ohm et al., 2012).
Secondary walls of gymnosperm cells are generally rich in lignin and glucomannans (Berg et al., 1995; Sarkar et al., 2009), and increased levels of these compounds have been correlated with resistance to foliar pathogens (Wallis et al., 2010). Dothistroma septosporum destroys plant cells during its necrotrophic stage and ruptures the needle epidermis to enable spore release (Kabir et al., 2015b), and so may be able to degrade lignin. Lignin degradation requires an initial step to weaken the strong lignocellulose complex, followed by hydrolysis by CAZy enzymes. In white rot fungi, the initial step involves laccases and lignin/manganese peroxidases, whereas, in brown rot fungi, non‐enzymatic attack by hydroxyl radicals is implicated (Eastwood et al., 2011). In D. septosporum, enzymatic loosening of lignocellulose complexes is unlikely as three candidate laccase genes had very low expression levels in planta and lignin/manganese peroxidase genes are absent from the genome (de Wit et al., 2012). Non‐enzymatic attack on lignocellulose complexes is more likely, and might be facilitated by dothistromin toxin that generates hydroxyl radicals (Youngman and Elstner, 1984), consistent with the reduced level of epidermal rupturing found in needles infected with dothistromin‐deficient mutants (Kabir et al., 2015a). After the lignocellulose complex is loosened, GH3, GH5 and GH28 enzymes can degrade hemicellulose and cellulose (Eastwood et al., 2011). Genes belonging to each of these GH families were up‐regulated at the late stage of DNB in D. septosporum (Table S11), consistent with a possible role in the breaching of host cell walls.
Transcription factor genes showed most up‐regulation of expression in the late stage (Table 3). However, some more highly expressed at mid stage are worthy of further investigation as possible biotrophy/necrotrophy transition regulators; these include a predicted basic‐leucine zipper protein (Ds74812; 22‐fold higher expression at mid than early stage) and a GAL4‐like Zn2Cys6 protein (Ds69328; 6.5‐fold higher expression at mid than late stage). Another regulatory protein, the pH‐responsive PacC (Caddick et al., 1986), is an important virulence determinant of Co. acutatum (You et al., 2007). A PacC orthologue (Ds68527) in D. septosporum showed highest expression in early and late stages of infection. Approximately 77% (9700) of all D. septosporum genes contain at least one, and up to nine, putative PacC‐binding sites in their upstream region, but no correlation was found between the number of PacC sites and gene expression (either as RPMK values at each stage or as fold differences between stages of infection).
Conclusions
High‐throughput sequencing methods have revolutionized the study of plant–pathogen interactions, enabling profiles of gene expression to be determined from mixed samples. So far, there have been few such studies of gymnosperm pathogens compared with those of angiosperms. To the best of our knowledge, this in planta transcriptome of D. septosporum is the first reported in‐depth RNA sequencing study of a fungal gymnosperm pathogen, and certainly the first showing the dynamics of gene expression through a time series of infection. Extremely few fungal reads at early and mid stages of infection (0.1% and 0.5% of total reads, respectively) necessitated deep sequencing to ensure a minimum of 500 000 mapped fungal reads at each of the in planta stages.
Many genes were identified with clear stage‐specific expression. The most abundant and highly up‐regulated CAZy genes at the early stage were those predicted to produce fungal cell wall‐degrading enzymes, suggestive of extensive cell wall remodelling or possibly a role in competition against other fungi. Alcohol and aldehyde dehydrogenase genes were also highly expressed, but their roles in infection are unknown. At the late stage, the up‐regulation of α‐amylase genes suggested a role in metabolism of starch in green islands that form around DNB lesions. Strikingly, a larger proportion of genes encoding candidate effectors (SSCPs) were preferentially expressed during necrotrophy than biotrophy. These data highlight many potential virulence and avirulence factors for future functional studies. This dataset will be a useful resource for the development of tools to manage DNB in pines, as well as a model system for other foliar gymnosperm pathogens.
Experimental Procedures
Plants, fungal strains, culture and inoculation conditions
Pinus radiata clones, provided by Scion Forest Research (Rotorua, New Zealand), were cuttings from a <1‐year‐old seedling from a DNB‐susceptible family. Cuttings were approximately 1 year old (post‐cutting) at the time of inoculation.
Spores of the wild‐type D. septosporum isolate NZE10 (de Wit et al., 2012) used in this study were obtained by growth on plates of pine needle minimal medium with glucose (PMMG) (McDougal et al., 2011) for 7 days at 22 °C. Fifteen clonal plants were inoculated on 24 January 2013 (Southern summer) by spraying 3 × 10⁶ spores/mL with a hand sprayer (approximately 25–30 mL per plant), allowed to stand for 15–20 min, and then incubated in one of three replicate humidity chambers at 20 °C. After an initial 4‐day period of high wetness (with individual plants enclosed in plastic sleeves), continuous misting was maintained as described previously (Kabir et al., 2013), with ambient glasshouse light conditions (average 14 h day length).
Sampling procedures
Samples for RNA sequencing (RNA‐seq) were taken 3, 8 and 12 weeks after inoculation when fungal surface growth, new immature lesions and sporulating lesions were seen, respectively (Fig. 1). These stages are termed early, mid and late throughout the text. To determine the timing of the early stage samples, the fungal surface growth was monitored over time by clearing and trypan blue staining of two needles from each tree (Mehrabi et al., 2006) and imaging fungal growth using a confocal microscope (Leica SP5 DM6000B, Leica Microsystems, Wetzlar, Germany). One tree, which had even fungal growth over needle surfaces, was selected from each replicate chamber. Whole needles were collected for RNA and DNA extraction at the early stage, as the positions of future lesions could not be predicted. For later stage samples, newly appeared immature lesions (mid stage) and mature sporulating lesions (late stage) were identified by eye and confirmed using a binocular microscope (Leica MZ10F) at weeks 8 and 12 after inoculation. In these cases, approximately 120 lesions were cut from needles taken from up to four tree clones within each replicate chamber. Lesions were sampled instead of whole needles to maximize the ratio of fungal to plant RNA.
RNA extraction and quality control
Fresh whole needles (early stage) or lesions (mid and late stages) were ground in liquid nitrogen, and RNA was extracted using a Spectrum™ plant total RNA kit (Sigma‐Aldrich, St. Louis, MO, USA). RNA was checked for integrity on a 1% formaldehyde denaturing gel (Sambrook et al., 1989) and a 2100 Bioanalyser with an RNA 6000 Nano Kit (Agilent, Santa Clara, CA, USA). RNA concentration was determined using a Qubit fluorometer and Qubit® RNA assay kit (Life Technologies, Carlsbad, CA, USA); the absence of DNA and protein was checked using Qubit® dsDNA and Qubit® protein assay kits (Life Technologies). RNA was extracted from FM grown in Dothistroma liquid medium (Bradshaw et al., 2000) for 7 days at 22 °C (in vitro FM samples) in the same way as described for in planta samples.
Because the proportion of D. septosporum to pine biomass was estimated to be 1% or less, and differs between the stages of infection (Kabir et al., 2015b), quantitative reverse transcription (RT)‐PCR was used to estimate the percentage of fungal reads in the mixed plant–fungal RNA samples prior to sequencing. TURBO™ DNase (Life Technologies) and qSCRIPT cDNA Super mix (Quanta Biosciences, Gaithersburg, MD, USA) were used to prepare cDNA. Relative quantitative RT‐PCR was performed using a 5 × q.EvaGreen® qPCR Mix (Qarta Bio, Carson, CA, USA) and 45 cycles of PCR (10 s at 95 °C, then 30 s at each of 60 °C and 72 °C) with an acquisition temperature of 72 °C. Two technical replicates of each of three biological replicates were used. The reference gene was P. radiata Ubiquitin Activating Enzyme (UAE) [primers UAE_F (5′‐GGGACAAGAGAACTCCCTCC‐3′) and UAE_R (5′‐TTGCCTTGATGACTTCCTGG‐3′)]; the target gene was D. septosporum β‐tubulin (Tub1) [primers rt_TUB1F (5′‐CCGGCGTGTACAATGG‐3′) and rt_TUB1R (5′‐CATGCGGTCTGGGAAC‐3′)]. The ratio was converted to a percentage, which gave an estimate of the relative abundance of fungal transcripts in the mixture as early (0.04%), mid (2.9%) and late (21.7%).
RNA sequencing
Two biological replicates were sequenced from each of the in planta time points (early, mid, late) and in vitro FM. A unique 6‐bp index tag was added to each sample during library construction with an Illumina mRNA sample preparation kit (Illumina, San Diego, CA, USA). Different proportions of libraries were combined for multiplex sequencing, based on the proportions of fungal to plant reads as estimated by qRT‐PCR, and with the aim of obtaining similar numbers of fungal reads in each sample. To check proportions, a preliminary MiSeq run (150 base paired‐end reads) was carried out with mixed libraries run in one lane, reads mapped to D. septosporum genome coding sequences and the proportions of libraries adjusted to equalize the fungal read output for each stage. A further three consecutive Illumina MiSeq flow cell runs were used to check adjusted library proportions and to ensure that the colour balance of G/T and A/C bases (sequenced using green and red lasers, respectively) in the index tags of unevenly pooled libraries was not so skewed that index read failure occurred. Finally, Illumina HiSeq runs of one lane of 100 base paired‐end reads, followed by 10 lanes of 100 base single‐end sequencing, were performed with the multiplexed libraries. Library preparation and sequencing were carried out by New Zealand Genomics Limited, Palmerston North and Dunedin.
Bioinformatics
The expression of D. septosporum genes was determined using the general approach described previously (Cox et al., 2010a). Read quality was checked using SolexaQA (Cox et al., 2010b); reads were trimmed such that all bases had a probability of error of ≤0.05, and only reads ≥40 bases long were retained. Reads were mapped, for each sample and biological replicate separately, to the 3 July 2013 frozen gene catalogue of coding sequences (n = 12 558) (http://genome.jgi‐psf.org/Dotse1/) using the Burrows–Wheeler mapping algorithm implemented in Bowtie2 v.2.0.2 (Langmead et al., 2009). Reads that did not map uniquely to a single gene reference were excluded, and the number of reads that mapped to each gene was determined using custom software (code available at http://mpcox.github.io/mapcount/). Paired‐end reads were counted as only a single ‘hit’. Accession numbers shown for D. septosporum genes are Joint Genome Institute (JGI) protein identification numbers (http://genome.jgi‐psf.org/Dotse1/). The probability of each predicted protein having a secretion signal was determined using SignalP (Petersen et al., 2011).
To check that fungal reads that mapped to D. septosporum coding sequences were specific for D. septosporum, and not other organisms associated with pine needles, the top taxonomic hit for each of 1% of all reads was determined using the metagenomics search program PAUDA (Huson and Xie, 2014). No more than 0.2% of all reads from the early stage sample mapped to other species of fungi, and this rate was even lower in later stages, probably because of the whole needle sampling method used at the early stage. The most abundant other fungi were Basidiomycota, including brown and white rot fungi, and Ascomycota in the Eurotiomycetes and Sordariomycetes classes. Although some cross‐mapping to the D. septosporum coding sequences cannot be ruled out, the nucleotide identity of conserved housekeeping (actin and β‐tubulin) genes between D. septosporum and fungi in the taxa listed above did not exceed 89%; these would have been screened out by the high mapping stringency (97%–98%) used.
To estimate the ratio of fungal to plant sequences, the numbers of reads that mapped to D. septosporum were expressed as a percentage of the total trimmed reads, because the P. radiata genome sequence was not available for read mapping. Furthermore, because the D. septosporum reads were mapped to coding sequences (excluding untranslated regions and introns), only a proportion of the fungal reads in each sample were actually mapped. Thus, in calculating the fungal to plant read ratio, proportions were normalized based on the percentage of mapped fungal reads (70.15%) in the FM in vitro sample (i.e. with no plant reads present).
The statistical significance of gene expression between different samples, accounting for variance between replicates, was calculated using Fisher's exact test as implemented in the R package DEGseq v.1.14.0 (Wang et al., 2010). A correction for multiple testing was applied using the false discovery rate (Storey and Tibshirani, 2003). The fold difference (FD) for each gene i was calculated from the raw read counts normalized by the total number of mapped reads as:
where s 1 and s 2 are temporally adjacent samples (or an in planta sample versus an in vitro sample). Minimum fold differences are reported for genes with expression in one sample, but zero expression in the other. Overlaps between DEG lists were displayed in a Venn diagram.
The original GO annotations provided by JGI (http://genome.jgi‐psf.org/Dotse1/) were updated using Blast2GO, using standard parameters and an expect value threshold of 10−3 (Conesa et al., 2005); gene annotation increased from 46% to 61% of gene models with GO terms. Enrichment analysis was performed on DEG sets using the enrichment tool in Blast2GO (Conesa et al., 2005). The gene sets were derived from DEGseq analysis of each time‐series comparison, as well as in vitro FM comparisons. Numbers of DEGs were limited by a conservative statistical test that predicts expected numbers (Schmid et al., 2014); all genes discarded in this way were considered as non‐differentially expressed. The background set was the entire D. septosporum gene set. GO terms were filtered using the false discovery rate (Storey and Tibshirani, 2003), as implemented in Blast2GO, in a one‐tailed test to detect overenrichment. The enriched terms were then passed into REVIGO to consolidate the list and produce graphs highlighting the similarity between the terms (Supek et al., 2011).
Heat maps were constructed in R using the gPlots library (R Team, 2013). RPMK from the top 100 D. septosporum genes in a functional category (highest mean RPMK in planta but restricted to those with fold change > 2 and P < 0.05) were used. These categories were either generated from GOs or prior manual annotations (de Wit et al., 2012). Heat maps were coloured based on a gene's fold difference compared with the mean of that gene's values across all three in planta samples.
Supporting information
Fig. S1 Differentially expressed gene ontology (GO) groups in planta compared with in vitro. REVIGO interactive maps of enriched GO terms determined from genes significantly up‐regulated between culture‐grown Dothistroma septosporum mycelium (FM) and early, mid or late stages in planta, based on the data in Tables S6–S8.
Fig. S2 Heatmap profiles of Dothistroma septosporum gene expression in planta with protein ID numbers. Heatmaps showing expression of the top 100 most highly expressed genes [highest mean reads per million per kilobase (RPMK) in planta, but restricted to those with fold change > 2 and P < 0.05] in seven functional categories. Protein ID numbers (http://genome.jgi‐psf.org/Dotse1/) are shown for each gene. Fold (log2) increases (red) or decreases (blue) in gene expression are shown for each stage (E, early; M, mid; L, late) relative to the mean in planta expression for each gene. The gene categories and their gene ontology (GO) terms are as listed in the footnote to Table 3. Dendrograms indicate groups of genes with similar expression patterns.
Table S1 Dothistroma septosporum transcriptome statistics.
Tables S2–S5 Top 100 expressed genes in planta (early, mid, late) and in vitro.
Tables S6–S8 Differentially expressed genes in planta (early, mid, late) compared with in vitro.
Table S9 Top five blast hits for hypothetical protein‐encoding genes up‐regulated in planta.
Tables S10–S11 Differentially expressed genes between stages in planta (early–mid, mid–late).
Table S12 Expression values for carbohydrate active enzyme genes.
Table S13 Expression values and distances from telomeres and repeats for short secreted cysteine‐rich protein genes.
Table S14 Expression values, distances from telomeres and order of gene function for dothistromin genes.
Text S1 Functional analysis of the Dothistroma septosporum hydrophobin gene Hdp1.
Acknowledgements
This work was funded by the Bio‐Protection Research Centre (Palmerston North, New Zealand) and Massey University (Palmerston North, New Zealand). Robin Ohm (DOE Joint Genome Institute, Walnut Creek, CA, USA), Claudia Voelckel, Pierre‐Yves Dupont, Dave Wheeler and Jan Schmid (Massey University) are thanked for advice with bioinformatics and statistics; Lorraine Berry (New Zealand Genomics Limited, Palmerston North) is thanked for help with library preparation and sequence analysis; Ronald de Vries and Carl Mesarich are thanked for advice on the analysis of carbohydrate active enzyme and short secreted cysteine‐rich protein data, respectively.
References
- Berg, B. , Deanta, R.C. , Escudero, A. , Gardenas, A. , Johansson, M.B. , Laskowski, R. , Madeira, M. , Malkonen, E. , McClaugherty, C. , Meentemeyer, V. and Desanto, A.V. (1995) The chemical composition of newly shed needle litter of scots pine and some other pine species in a climatic transect. X Long‐term decomposition in a scots pine forest. Can. J. Bot. 73, 1423–1435. [Google Scholar]
- Bradshaw, R.E. , Ganley, R.J. , Jones, W.T. and Dyer, P.S. (2000) High levels of dothistromin toxin produced by the forest pathogen Dothistroma pini . Mycol. Res. 104, 325–332. [Google Scholar]
- Bradshaw, R.E. , Jin, H.P. , Morgan, B.S. , Schwelm, A. , Teddy, O.R. , Young, C.A. and Zhang, S.G. (2006) A polyketide synthase gene required for biosynthesis of the aflatoxin‐like toxin, dothistromin. Mycopathologia, 161, 283–294. [DOI] [PubMed] [Google Scholar]
- Brunner, P.C. , Torriani, S.F. , Croll, D. , Stukenbrock, E.H. and McDonald, B.A. (2013) Coevolution and life cycle specialization of plant cell wall degrading enzymes in a hemibiotrophic pathogen. Mol. Biol. Evol. 30, 1337–1347. [DOI] [PMC free article] [PubMed] [Google Scholar]
- Bulman, L.S. , Dick, M.A. , Ganley, R.J. , McDougal, R.L. , Schwelm, A. and Bradshaw, R.E. (2013) Dothistroma needle blight In: Infectious Forest Diseases (Gonthier P. and Nicolotti G., eds), pp. 436–457. Wallingford, UK: CAB International. [Google Scholar]
- van den Burg, H.A. , Harrison, S.J. , Joosten, M. , Vervoort, J. and de Wit, P. (2006) Cladosporium fulvum Avr4 protects fungal cell walls against hydrolysis by plant chitinases accumulating during infection. Mol. Plant–Microbe Interact. 19, 1420–1430. [DOI] [PubMed] [Google Scholar]
- Caddick, M.X. , Brownlee, A.G. and Arst Jr, H.N. (1986) Regulation of gene expression by pH of the growth medium in Aspergillus nidulans . Mol. Gen. Genet. 203, 346–353. [DOI] [PubMed] [Google Scholar]
- Chettri, P. , Ehrlich, K.C. , Cary, J.W. , Collemare, J. , Cox, M.P. , Griffiths, S.A. , Olson, M.A. , de Wit, P.J.G.M. and Bradshaw, R.E. (2013) Dothistromin genes at multiple separate loci are regulated by AflR. Fungal Genet. Biol. 51, 12–20. [DOI] [PubMed] [Google Scholar]
- Coleman, M. , Henricot, B. , Arnau, J. and Oliver, R.P. (1997) Starvation‐induced genes of the tomato pathogen Cladosporium fulvum are also induced during growth in planta . Mol. Plant–Microbe Interact. 10, 1106–1109. [DOI] [PubMed] [Google Scholar]
- Conesa, A. , Gotz, S. , Garcia‐Gomez, J. , Terol, J. , Talon, M. and Robles, M. (2005) Blast2GO: a universal tool for annotation, visualization and analysis in functional genomics research. Bioinformatics, 21, 3674–3676. [DOI] [PubMed] [Google Scholar]
- Cox, M.P. , Eaton, C.J. and Scott, D.B. (2010a) Exploring molecular signaling in plant–fungal symbioses using high throughput RNA sequencing. Plant Signal. Behav. 5, 1353–1358. [DOI] [PMC free article] [PubMed] [Google Scholar]
- Cox, M.P. , Peterson, D.A. and Biggs, P.J. (2010b) SolexaQA: at‐a‐glance quality assessment of Illumina second‐generation sequencing data. BMC Bioinformatics, 11, 485. [DOI] [PMC free article] [PubMed] [Google Scholar]
- Dagenais, T.R. , Giles, S.S. , Aimanianda, V. , Latge, J.‐P. , Hull, C.M. and Keller, N.P. (2010) Aspergillus fumigatus LaeA‐mediated phagocytosis is associated with a decreased hydrophobin layer. Infect. Immun. 78, 823–829. [DOI] [PMC free article] [PubMed] [Google Scholar]
- Dangl, J.L. , Horvath, D.M. and Staskawicz, B.J. (2013) Pivoting the plant immune system from dissection to deployment. Science, 341, 746–751. [DOI] [PMC free article] [PubMed] [Google Scholar]
- Daub, M.E. , Herrero, S. and Chung, K.R. (2005) Photoactivated perylenequinone toxins in fungal pathogenesis of plants. FEMS Microbiol. Lett. 252, 197–206. [DOI] [PubMed] [Google Scholar]
- DiGuistini, S. , Wang, Y. , Liao, N.Y. , Taylor, G. , Tanguay, P. , Feau, N. , Henrissat, B. , Chan, S.K. , Hesse‐Orce, U. , Alamouti, S.M. , Tsui, C.K.M. , Docking, R.T. , Levasseur, A. , Haridas, S. , Robertson, G. , Birol, I. , Holt, R.A. , Marra, M.A. , Hamelin, R.C. , Hirst, M. , Jones, S.J.M. , Bohlmann, J. and Breuil, C. (2011) Genome and transcriptome analyses of the mountain pine beetle–fungal symbiont Grosmannia clavigera, a lodgepole pine pathogen. Proc. Natl. Acad. Sci. USA, 108, 2504–2509. [DOI] [PMC free article] [PubMed] [Google Scholar]
- Divon, H.H. and Fluhr, R. (2007) Nutrition acquisition strategies during fungal infection of plants. FEMS Microbiol. Lett. 266, 65–74. [DOI] [PubMed] [Google Scholar]
- Eastwood, D.C. , Floudas, D. , Binder, M. , Majcherczyk, A. , Schneider, P. , Aerts, A. , Asiegbu, F.O. , Baker, S.E. , Barry, K. , Bendiksby, M. , Blumentritt, M. , Coutinho, P.M. , Cullen, D. , de Vries, R.P. , Gathman, A. , Goodell, B. , Henrissat, B. , Ihrmark, K. , Kauserud, H. , Kohler, A. , LaButti, K. , Lapidus, A. , Lavin, J.L. , Lee, Y.H. , Lindquist, E. , Lilly, W. , Lucas, S. , Morin, E. , Murat, C. , Oguiza, J.A. , Park, J. , Pisabarro, A.G. , Riley, R. , Rosling, A. , Salamov, A. , Schmidt, O. , Schmutz, J. , Skrede, I. , Stenlid, J. , Wiebenga, A. , Xie, X.F. , Kues, U. , Hibbett, D.S. , Hoffmeister, D. , Hogberg, N. , Martin, F. , Grigoriev, I.V. and Watkinson, S.C. (2011) The plant cell wall‐decomposing machinery underlies the functional diversity of forest fungi. Science, 333, 762–765. [DOI] [PubMed] [Google Scholar]
- Friesen, T.L. , Faris, J.D. , Solomon, P.S. and Oliver, R.P. (2008) Host‐specific toxins: effectors of necrotrophic pathogenicity. Cell. Microbiol. 10, 1421–1428. [DOI] [PubMed] [Google Scholar]
- Gan, P. , Ikeda, K. , Irieda, H. , Narusaka, M. , O'Connell, R.J. , Narusaka, Y. , Takano, Y. , Kubo, Y. and Shirasu, K. (2013) Comparative genomic and transcriptomic analyses reveal the hemibiotrophic stage shift of Colletotrichum fungi. New Phytol. 197, 1236–1249. [DOI] [PubMed] [Google Scholar]
- Goodwin, S.B. , M'Barek, S.B. , Dhillon, B. , Wittenberg, A.H.J. , Crane, C.F. , Hane, J.K. , Foster, A.J. , Van der Lee, T.A.J. , Grimwood, J. , Aerts, A. , Antoniw, J. , Bailey, A. , Bluhm, B. , Bowler, J. , Bristow, J. , van der Burgt, A. , Canto‐Canche, B. , Churchill, A.C.L. , Conde‐Ferraez, L. , Cools, H.J. , Coutinho, P.M. , Csukai, M. , Dehal, P. , De Wit, P. , Donzelli, B. , van de Geest, H.C. , Van Ham, R. , Hammond‐Kosack, K.E. , Henrissat, B. , Kilian, A. , Kobayashi, A.K. , Koopmann, E. , Kourmpetis, Y. , Kuzniar, A. , Lindquist, E. , Lombard, V. , Maliepaard, C. , Martins, N. , Mehrabi, R. , Nap, J.P.H. , Ponomarenko, A. , Rudd, J.J. , Salamov, A. , Schmutz, J. , Schouten, H.J. , Shapiro, H. , Stergiopoulos, I. , Torriani, S.F.F. , Tu, H. , de Vries, R.P. , Waalwijk, C. , Ware, S.B. , Wiebenga, A. , Zwiers, L.H. , Oliver, R.P. , Grigoriev, I.V. and Kema, G.H.J. (2011) Finished genome of the fungal wheat pathogen Mycosphaerella graminicola reveals dispensome structure, chromosome plasticity, and stealth pathogenesis. PLoS Genet. 7, e1002070. [DOI] [PMC free article] [PubMed] [Google Scholar]
- Huson, D.H. and Xie, C. (2014) A poor man's BLASTX—high‐throughput metagenomic protein database search using PAUDA. Bioinformatics, 30, 38–39. [DOI] [PMC free article] [PubMed] [Google Scholar]
- Idnurm, A. and Howlett, B.J. (2002) Isocitrate lyase is essential for pathogenicity of the fungus Leptosphaeria maculans to canola (Brassica napus). Eukaryot. Cell, 1, 719–724. [DOI] [PMC free article] [PubMed] [Google Scholar]
- Kabir, M.S. , Ganley, R.J. and Bradshaw, R.E. (2013) An improved artificial pathogenicity assay for Dothistroma needle blight on Pinus radiata . Australas. Plant Pathol. 42, 503–510. [Google Scholar]
- Kabir, M.S. , Ganley, R.J. and Bradshaw, R.E. (2015a) Dothistromin toxin is a virulence factor in dothistroma needle blight of pines. Plant Pathol. 64, 225–234. [Google Scholar]
- Kabir, M.S. , Ganley, R.J. and Bradshaw, R.E. (2015b) The hemibiotrophic lifestyle of the fungal pine pathogen Dothistroma septosporum . For. Pathol.. doi: 10.1111/efp.12153. [DOI] [Google Scholar]
- Karl, T. , Harley, P. , Guenther, A. , Rasmussen, R. , Baker, B. , Jardine, K. and Nemitz, E. (2005) The bi‐directional exchange of oxygenated VOCs between a loblolly pine (Pinus taeda) plantation and the atmosphere. Atmos. Chem. Phys. 5, 3015–3031. [Google Scholar]
- Kennedy, S.G. , Yanchuk, A.D. , Stackpole, D.J. and Jefferson, P.A. (2014) Incorporating non‐key traits in selecting the Pinus radiata production population. N. Z. J. For. Sci. 44, 1–9. [Google Scholar]
- Kimmerer, T.W. and Kozlowski, T.T. (1982) Ethylene, ethane, acetaldehyde, and ethanol production by plants under stress. Plant Physiol. 69, 840–847. [DOI] [PMC free article] [PubMed] [Google Scholar]
- Kubisiak, T.L. , Anderson, C.L. , Amerson, H.V. , Smith, J.A. , Davis, J.M. and Nelson, C.D. (2011) A genomic map enriched for markers linked to Avr1 in Cronartium quercuum f.sp. fusiforme . Fungal Genet. Biol. 48, 266–274. [DOI] [PubMed] [Google Scholar]
- Lacroix, H. , Whiteford, J.R. and Spanu, P.D. (2008) Localization of Cladosporium fulvum hydrophobins reveals a role for HCf‐6 in adhesion. FEMS Microbiol. Lett. 286, 136–144. [DOI] [PubMed] [Google Scholar]
- Langmead, B. , Trapnell, C. , Pop, M. and Salzberg, S.L. (2009) Ultrafast and memory‐efficient alignment of short DNA sequences to the human genome. Genome Biol. 10, R25. [DOI] [PMC free article] [PubMed] [Google Scholar]
- Lannoo, N. and Van Damme, E.J. (2014) Lectin domains at the frontiers of plant defense. Front. Plant Sci. 5, 1–16. [DOI] [PMC free article] [PubMed] [Google Scholar]
- Laugé, R. , Joosten, M.H.A.J. , van den Ackerveken, G.F.J.M. , Van den Broek, H.W.J. and de Wit, P.J.G.M. (1997) The in planta‐produced extracellular proteins ECP1 and ECP2 of Cladosporium fulvum are virulence factors. Mol. Plant–Microbe Interact. 10, 725–734. [Google Scholar]
- Lee, M.‐H. , Chiu, C.‐M. , Roubtsova, T. , Chou, C.‐M. and Bostock, R.M. (2010) Overexpression of a redox‐regulated cutinase gene, MfCUT1, increases virulence of the brown rot pathogen Monilinia fructicola on Prunus spp. Mol. Plant–Microbe Interact. 23, 176–186. [DOI] [PubMed] [Google Scholar]
- Lombard, V. , Ramulu, H.G. , Drula, E. , Coutinho, P.M. and Henrissat, B. (2014) The carbohydrate‐active enzymes database (CAZy) in 2013. Nucleic Acids Res. 42, D490–D495. [DOI] [PMC free article] [PubMed] [Google Scholar]
- McDougal, R.L. , Yang, S. , Schwelm, A. , Stewart, A. and Bradshaw, R.E. (2011) A novel GFP‐based approach for screening biocontrol microorganisms in vitro against Dothistroma septosporum . J. Microbiol. Methods, 87, 32–37. [DOI] [PubMed] [Google Scholar]
- McDowell, J.M. (2013) Genomic and transcriptomic insights into lifestyle transitions of a hemi‐biotrophic fungal pathogen. New Phytol. 197, 1032–1034. [DOI] [PubMed] [Google Scholar]
- Mehrabi, R. , Zwiers, L.‐H. , Waard, M.A. and Kema, G.H.J. (2006) MgHog1 regulates dimorphism and pathogenicity in the fungal wheat pathogen Mycosphaerella graminicola . Mol. Plant–Microbe Interact. 19, 1262–1269. [DOI] [PubMed] [Google Scholar]
- Neale, D.B. and Kremer, A. (2011) Forest tree genomics: growing resources and applications. Nat. Rev. Genet. 12, 111–122. [DOI] [PubMed] [Google Scholar]
- Nystedt, B. , Street, N.R. , Wetterbom, A. , Zuccolo, A. , Lin, Y.‐C. , Scofield, D.G. , Vezzi, F. , Delhomme, N. , Giacomello, S. , Alexeyenko, A. , Vicedomini, R. , Sahlin, K. , Sherwood, E. , Elfstrand, M. , Gramzow, L. , Holmberg, K. , Hallman, J. , Keech, O. , Klasson, L. , Koriabine, M. , Kucukoglu, M. , Kaller, M. , Luthman, J. , Lysholm, F. , Niittyla, T. , Olson, A. , Rilakovic, N. , Ritland, C. , Rossello, J.A. , Sena, J. , Svensson, T. , Talavera‐Lopez, C. , Theiszen, G. , Tuominen, H. , Vanneste, K. , Wu, Z.‐Q. , Zhang, B. , Zerbe, P. , Arvestad, L. , Bhalerao, R. , Bohlmann, J. , Bousquet, J. , Garcia Gil, R. , Hvidsten, T.R. , de Jong, P. , MacKay, J. , Morgante, M. , Ritland, K. , Sundberg, B. , Lee Thompson, S. , Van de Peer, Y. , Andersson, B. , Nilsson, O. , Ingvarsson, P.K. , Lundeberg, J. and Jansson, S. (2013) The Norway spruce genome sequence and conifer genome evolution. Nature, 497, 579–584. [DOI] [PubMed] [Google Scholar]
- O'Connell, R.J. , Thon, M.R. , Hacquard, S. , Amyotte, S.G. , Kleemann, J. , Torres, M.F. , Damm, U. , Buiate, E.A. , Epstein, L. , Alkan, N. , Altmueller, J. , Alvarado‐Balderrama, L. , Bauser, C.A. , Becker, C. , Birren, B.W. , Chen, Z. , Choi, J. , Crouch, J.A. , Duvick, J.P. , Farman, M.A. , Gan, P. , Heiman, D. , Henrissat, B. , Howard, R.J. , Kabbage, M. , Koch, C. , Kracher, B. , Kubo, Y. , Law, A.D. , Lebrun, M.‐H. , Lee, Y.‐H. , Miyara, I. , Moore, N. , Neumann, U. , Nordstroem, K. , Panaccione, D.G. , Panstruga, R. , Place, M. , Proctor, R.H. , Prusky, D. , Rech, G. , Reinhardt, R. , Rollins, J.A. , Rounsley, S. , Schardl, C.L. , Schwartz, D.C. , Shenoy, N. , Shirasu, K. , Sikhakolli, U.R. , Stueber, K. , Sukno, S.A. , Sweigard, J.A. , Takano, Y. , Takahara, H. , Trail, F. , van der Does, H.C. , Voll, L.M. , Will, I. , Young, S. , Zeng, Q. , Zhang, J. , Zhou, S. , Dickman, M.B. , Schulze‐Lefert, P. , van Themaat, E.V.L. , Ma, L.‐J. and Vaillancourt, L.J. (2012) Lifestyle transitions in plant pathogenic Colletotrichum fungi deciphered by genome and transcriptome analyses. Nat. Genet. 44, 1060–1067. [DOI] [PMC free article] [PubMed] [Google Scholar]
- Ohm, R.A. , Feau, N. , Henrissat, B. , Schoch, C.L. , Horwitz, B.A. , Barry, K.W. , Condon, B.J. , Copeland, A.C. , Dhillon, B. , Glaser, F. , Hesse, C.N. , Kosti, I. , Labutti, K. , Lindquist, E.A. , Lucas, S. , Salamov, A.A. , Bradshaw, R.E. , Ciuffetti, L. , Hamelin, R.C. , Kema, G.H.J. , Lawrence, C. , Scott, J.A. , Spatafora, J.W. , Turgeon, B.G. , de Wit, P.J.G.M. , Zhong, S. , Goodwin, S.B. and Grigoriev, I.V. (2012) Diverse lifestyles and strategies of plant pathogenesis encoded in the genomes of eighteen Dothideomycetes fungi. Plos Pathog. 8, e1003037. [DOI] [PMC free article] [PubMed] [Google Scholar]
- Palmer, J.M. and Keller, N.P. (2010) Secondary metabolism in fungi: does chromosomal location matter? Curr. Opin. Microbiol. 13, 431–436. [DOI] [PMC free article] [PubMed] [Google Scholar]
- Pendleton, A.L. , Smith, K.E. , Feau, N. , Martin, F.M. , Grigoriev, I.V. , Hamelin, R. , Nelson, C.D. , Burleigh, J.G. and Davis, J.M. (2014) Duplications and losses in gene families of rust pathogens highlight putative effectors. Front. Plant Sci. 5, 1–13. [DOI] [PMC free article] [PubMed] [Google Scholar]
- Petersen, T.N. , Brunak, S. , von Heijne, G. and Nielsen, H. (2011) SignalP 4.0: discriminating signal peptides from transmembrane regions. Nat. Methods, 8, 785–786. [DOI] [PubMed] [Google Scholar]
- Rovenich, H. , Boshoven, J.C. and Thomma, B.P.H.J. (2014) Filamentous pathogen effector functions: of pathogens, hosts and microbiomes. Curr. Opin. Plant Biol. 20, 96–103. [DOI] [PubMed] [Google Scholar]
- R Team (2013) R: a Language and Environment for Statistical Computing. Vienna: R Foundation for Statistical Computing. [Google Scholar]
- Sambrook, J. , Fritsch, E.F. and Maniatis, T. (1989) Molecular Cloning: a Laboratory Manual. New York: Cold Spring Harbor Laboratory Press. [Google Scholar]
- Sarkar, P. , Bosneaga, E. and Auer, M. (2009) Plant cell walls throughout evolution: towards a molecular understanding of their design principles. J. Exp. Bot. 60, 3615–3635. [DOI] [PubMed] [Google Scholar]
- Schmid, J. , Day, R. , Zhang, N. , Cox, M. , Dupont, P.‐Y. and Truglio, M. (2014) Tissue‐specific interactions between the transcriptomes of the fungal endophyte Neotyphodium lolii and its perennial ryegrass host In: International Mycological Congress 10, p. 407 Bangkok: International Mycological Society. [Google Scholar]
- Segers, G. , Bradshaw, N. , Archer, D. , Blissett, K. and Oliver, R. (2001) Alcohol oxidase is a novel pathogenicity factor for Cladosporium fulvum, but aldehyde dehydrogenase is dispensable. Mol. Plant–Microbe Interact. 14, 367–377. [DOI] [PubMed] [Google Scholar]
- Siah, A. , Deweer, C. , Duyme, F. , Sanssene, J. , Durand, R. , Halama, P. and Reignault, P. (2010) Correlation of in planta endo‐beta‐1,4‐xylanase activity with the necrotrophic phase of the hemibiotrophic fungus Mycosphaerella graminicola . Plant Pathol. 59, 661–670. [Google Scholar]
- Sniezko, R.A. , Smith, J. , Liu, J.‐J. and Hamelin, R.C. (2014) Genetic resistance to fusiform rust in southern pines and white pine blister rust in white pines—a contrasting tale of two rust pathosystems—current status and future prospects. Forests, 5, 2050–2083. [Google Scholar]
- Soyer, J.L. , El Ghalid, M. , Glaser, N. , Ollivier, B. , Linglin, J. , Grandaubert, J. , Balesdent, M.‐H. , Connolly, L.R. , Freitag, M. , Rouxel, T. and Fudal, I. (2014) Epigenetic control of effector gene expression in the plant pathogenic fungus Leptosphaeria maculans . PLoS Genet. 10, e1004227. [DOI] [PMC free article] [PubMed] [Google Scholar]
- Sperschneider, J. , Ying, H. , Dodds, P.N. , Gardiner, D.M. , Upadhyaya, N.M. , Singh, K.B. , Manners, J.M. and Taylor, J.M. (2014) Diversifying selection in the wheat stem rust fungus acts predominantly on pathogen‐associated gene families and reveals candidate effectors. Front. Plant Sci. 5, 372. [DOI] [PMC free article] [PubMed] [Google Scholar]
- Stergiopoulos, I. and de Wit, P.J.G. (2009) Fungal effector proteins. Annu. Rev. Phytopathol. 47, 233–263. [DOI] [PubMed] [Google Scholar]
- Stergiopoulos, I. , Collemare, J. , Mehrabi, R. and de Wit, P.J.G.M. (2013) Phytotoxic secondary metabolites and peptides produced by plant pathogenic Dothideomycete fungi. FEMS Microbiol. Rev. 37, 67–93. [DOI] [PubMed] [Google Scholar]
- Storey, J.D. and Tibshirani, R. (2003) Statistical significance for genomewide studies. Proc. Natl. Acad. Sci. USA, 100, 9440–9445. [DOI] [PMC free article] [PubMed] [Google Scholar]
- Supek, F. , Bosnjak, M. , Skunca, N. and Smuc, T. (2011) REVIGO summarizes and visualizes long lists of Gene Ontology terms. PLoS ONE, 6, e21800. [DOI] [PMC free article] [PubMed] [Google Scholar]
- Vleeshouwers, V.G.A.A. and Oliver, R.P. (2014) Effectors as tools in disease resistance breeding against biotrophic, hemibiotrophic, and necrotrophic plant pathogens. Mol. Plant–Microbe Interact. 27, 196–206. [DOI] [PubMed] [Google Scholar]
- Wallis, C.M. , Reich, R.W. , Lewis, K.J. and Huber, D.P.W. (2010) Lodgepole pine provenances differ in chemical defense capacities against foliage and stem diseases. Can. J. For. Res. 40, 2333–2344. [Google Scholar]
- Wang, L. , Feng, Z. , Wang, X. , Wang, X. and Zhang, X. (2010) DEGseq: an R package for identifying differentially expressed genes from RNA‐seq data. Bioinformatics, 26, 136–138. [DOI] [PubMed] [Google Scholar]
- Watt, M.S. , Kriticos, D.J. , Alcaraz, S. , Brown, A.V. and Leriche, A. (2009) The hosts and potential geographic range of Dothistroma needle blight. For. Ecol. Manag. 257, 1505–1519. [Google Scholar]
- Wilcox, M.D. (1983) Forestry In: Plant Breeding in New Zealand (Wratt G. and Smith H.C., eds), pp. 181–194. Wellington: Butterworths. [Google Scholar]
- Williams, H.L. , Sturrock, R.N. , Islam, M.A. , Hammett, C. , Ekramoddoullah, A.K.M. and Leal, I. (2014) Gene expression profiling of candidate virulence factors in the laminated root rot pathogen Phellinus sulphurascens . BMC Genomics, 15, 603. [DOI] [PMC free article] [PubMed] [Google Scholar]
- de Wit, P.J.G.M. , van der Burgt, A. , Okmen, B. , Stergiopoulos, I. , Abd‐Elsalam, K.A. , Aerts, A.L. , Bahkali, A.H. , Beenen, H.G. , Chettri, P. , Cox, M.P ., Datema, E. , de Vries, R.P ., Dhillon, B. , Ganley, A.R. , Griffiths, S.A. , Guo, Y. , Hamelin, R.C. , Henrissat, B. , Kabir, M.S. , Jashni, M.K. , Kema, G. , Klaubauf, S. , Lapidus, A. , Levasseur, A. , Lindquist, E. , Mehrabi, R. , Ohm, R.A. , Owen, T.J. , Salamov, A. , Schwelm, A. , Schijlen, E. , Sun, H. , van den Burg, H.A. , van Ham, R.C.H.J. , Zhang, S. , Goodwin, S.B. , Grigoriev, I.V. , Collemare, J. and Bradshaw, R.E. (2012) The genomes of the fungal plant pathogens Cladosporium fulvum and Dothistroma septosporum reveal adaptation to different hosts and lifestyles but also signatures of common ancestry. PloS Genet. 8, e1003088. [DOI] [PMC free article] [PubMed] [Google Scholar]
- You, B.‐J. , Choquer, M. and Chung, K.‐R. (2007) The Colletotrichum acutatum gene encoding a putative pH‐responsive transcription regulator is a key virulence determinant during fungal pathogenesis on citrus. Mol. Plant–Microbe Interact. 20, 1149–1160. [DOI] [PubMed] [Google Scholar]
- Youngman, R.J. and Elstner, E.F. (1984) Photodynamic and reductive mechanisms of oxygen activation by the fungal phytotoxins, cercosporin and dothistromin In: Oxygen Radicals in Chemistry and Biology (Bors W. and Saran M., eds), pp. 501–508. Berlin, New York: Walter de Gruyter and Co. [Google Scholar]
- Ziemert, N. , Podell, S. , Penn, K. , Badger, J.H. , Allen, E. and Jensen, P.R. (2012) The natural product domain seeker NaPDoS: a phylogeny based bioinformatic tool to classify secondary metabolite gene diversity. PLoS ONE, 7, e34064. [DOI] [PMC free article] [PubMed] [Google Scholar]
- Zimin, A. , Stevens, K.A. , Crepeau, M.W. , Holtz‐Morris, A. , Koriabine, M. , Marcais, G. , Puiu, D. , Roberts, M. , Wegrzyn, J.L. and de Jong, P.J. (2014) Sequencing and assembly of the 22‐Gb loblolly pine genome. Genetics, 196, 875–890. [DOI] [PMC free article] [PubMed] [Google Scholar]
Associated Data
This section collects any data citations, data availability statements, or supplementary materials included in this article.
Supplementary Materials
Fig. S1 Differentially expressed gene ontology (GO) groups in planta compared with in vitro. REVIGO interactive maps of enriched GO terms determined from genes significantly up‐regulated between culture‐grown Dothistroma septosporum mycelium (FM) and early, mid or late stages in planta, based on the data in Tables S6–S8.
Fig. S2 Heatmap profiles of Dothistroma septosporum gene expression in planta with protein ID numbers. Heatmaps showing expression of the top 100 most highly expressed genes [highest mean reads per million per kilobase (RPMK) in planta, but restricted to those with fold change > 2 and P < 0.05] in seven functional categories. Protein ID numbers (http://genome.jgi‐psf.org/Dotse1/) are shown for each gene. Fold (log2) increases (red) or decreases (blue) in gene expression are shown for each stage (E, early; M, mid; L, late) relative to the mean in planta expression for each gene. The gene categories and their gene ontology (GO) terms are as listed in the footnote to Table 3. Dendrograms indicate groups of genes with similar expression patterns.
Table S1 Dothistroma septosporum transcriptome statistics.
Tables S2–S5 Top 100 expressed genes in planta (early, mid, late) and in vitro.
Tables S6–S8 Differentially expressed genes in planta (early, mid, late) compared with in vitro.
Table S9 Top five blast hits for hypothetical protein‐encoding genes up‐regulated in planta.
Tables S10–S11 Differentially expressed genes between stages in planta (early–mid, mid–late).
Table S12 Expression values for carbohydrate active enzyme genes.
Table S13 Expression values and distances from telomeres and repeats for short secreted cysteine‐rich protein genes.
Table S14 Expression values, distances from telomeres and order of gene function for dothistromin genes.
Text S1 Functional analysis of the Dothistroma septosporum hydrophobin gene Hdp1.