

SUMMARY
The estrogen receptor α (ERα) controls cell proliferation and tumorigenesis by recruiting various cofactors to estrogen response elements (EREs) to control gene transcription. A deeper understanding of these transcriptional mechanisms may uncover therapeutic targets for ERα-dependent cancers. We show that BRD4 regulates ERα-induced gene expression by affecting elongation-associated phosphorylation of RNA polymerase II (RNAPII) and histone H2B monoubiquitination. Consistently, BRD4 activity is required for proliferation of ER+ breast and endometrial cancer cells and uterine growth in mice. Genome-wide studies revealed an enrichment of BRD4 on transcriptional start sites of active genes and a requirement of BRD4 for H2B monoubiquitination in the transcribed region of estrogen-responsive genes. Importantly, we demonstrate that BRD4 occupancy on distal EREs enriched for H3K27ac is required for recruitment and elongation of RNAPII on EREs and the production of ERα-dependent enhancer RNAs. These results uncover BRD4 as a central regulator of ERα function and potential therapeutic target.
INTRODUCTION
Estrogen receptor-positive (ER+) breast cancers represent a significant challenge to modern health care. ERα-dependent transcription in these cancers potentiates cell proliferation and malignancy. Estrogen (E2) binding leads to conformational changes within ERα that promote dimerization, binding to estrogen response elements (EREs), and subsequent cofactor recruitment (Deroo and Korach, 2006). Binding of ERα to EREs is promoted by the pioneer factor, Forkhead protein FOXA1 (HNF3α) (Carroll et al., 2005; Hurtado et al., 2011). ERα also functions along with Cohesin (Schmidt et al., 2010) to facilitate long-range chromosomal interactions between EREs (Fullwood et al., 2009).
The regulation of transcriptional elongation plays an essential role in E2-dependent gene transcription. This is largely regulated by the activity of the Positive Transcription Elongation Factor-b (P-TEFb) complex (Peterlin and Price, 2006). P-TEFb promotes elongation in part by relieving negative regulation by phosphorylating negative elongation factor (NELF) and dichloro-1-β-D-ribofuranosylbenzimidazole (DRB)-sensitivity inducing factor (DSIF) complexes. Pausing of RNA polymerase II (RNAPII) by NELF just downstream of the transcriptional start site (TSS) is a critical determinant of ERα-dependent transcription (Aiyar et al., 2004). P-TEFb also phosphorylates Ser2 (p-Ser2) within the heptapeptide repeat of the RNAPII carboxy-terminal domain (CTD). This in turn promotes elongation-associated histone modifications including histone H2B monoubiquitination (H2Bub1) (Karpiuk et al., 2012; Pirngruber et al., 2009), which is required for E2-dependent transcription (Bedi et al., 2014; Prenzel et al., 2011). Consistently, E2-dependent transcription was shown to be regulated at a post-RNAPII recruitment step involving increased RNAPII p-Ser2 by P-TEFb (Kininis et al., 2009).
The Bromodomain-containing Protein 4 (BRD4) binds to acetylated histones at both enhancers and promoters and recruits P-TEFb to support lineage-specific gene transcription (Zippo et al., 2009; Zhang et al., 2012b). Importantly, inhibition of BRD4 by pan-bromodomain and extraterminal domain (BET) inhibitors such as JQ1 (Filippakopoulos et al., 2010), PFI-1 (Picaud et al., 2013), and IBET revealed the involvement of BRD4 in various cancers in animal models (Herrmann et al., 2012; Lockwood et al., 2012; Ott et al., 2012; Zhang et al., 2012a; Zuber et al., 2011). Moreover, a BRD4-dependent gene expression signature was reported to be a positive predictor of breast cancer survival (Crawford et al., 2008) and has been implicated as an inherent susceptibility gene for metastasis in breast cancers (Alsarraj et al., 2011).
Recent findings describe a role for enhancer RNA (eRNA) production from ERα-bound enhancers during E2-regulated transcription (Hah et al., 2013; Li et al., 2013). eRNAs are noncoding RNAs that promote transcription by an unknown mechanism (Kim et al., 2010). Interestingly, cyclin-dependent kinase 9 (CDK9) is required for E2-regulated eRNA synthesis (Hah et al., 2013).
In this study, we investigated a role for BRD4 as a transcriptional cofactor of ERα-induced transcription by regulating transcriptional elongation and revealed its recruitment both to gene promoters as well as FOXA1-ERα-bound enhancers in ER+ breast cancer cells. Moreover, we demonstrate that distal EREs that produce eRNAs are enriched for BRD4 occupancy and uncover a role for BRD4 in eRNA synthesis.
RESULTS
BRD4 Regulates E2-Induced Transcriptional Activity in ER+ Cancers
To analyze the importance of BRD4 in ERα-dependent gene regulation, we performed mRNA sequencing (mRNA-seq) analyses in ER+ breast cancer cells following E2 stimulation in cells depleted for BRD4 or treated with the BRD4 inhibitor, JQ1 (Figure S1A). Heatmap analysis shows a nearly global decrease of E2-stimulated gene expression following BRD4 depletion and inhibition (Figures 1A and S1C), whereas the effects of BRD4 perturbation in this time frame were less apparent for E2-downregulated genes (Figure S1D). The inhibition of E2-induced transcription by BRD4 perturbation was further verified for representative E2-upregulated genes (Figure S1B). Strikingly, in addition to the known targets of BRD4 such as cell proliferation-specific and tumor necrosis factor-nuclear factor κB target genes (Mochizuki et al., 2008; Zou et al., 2014), gene set enrichment analyses (GSEAs) identified multiple E2- and ERα-related pathways as being significantly enriched following BRD4 knockdown or inhibition under vehicle (Veh) as well as E2-treated conditions (Figures 1B, S1E, and S1F). Similar effects were also seen in the ER+ Ishikawa endometrial cancer cell line (Figure S1G), whereas BRD4 depletion had little or no effect on transforming growth factor β1 (TGF-β1)-induced gene expression (Figure S1H). Together, these findings indicate a specific and central role for BRD4 in regulating E2-induced transcription in ER+ cancers.
Figure 1. BRD4 Perturbation Impairs E2-Induced Gene Expression, RNA Polymerase Ser2 Phosphorylation, and H2Bub1.
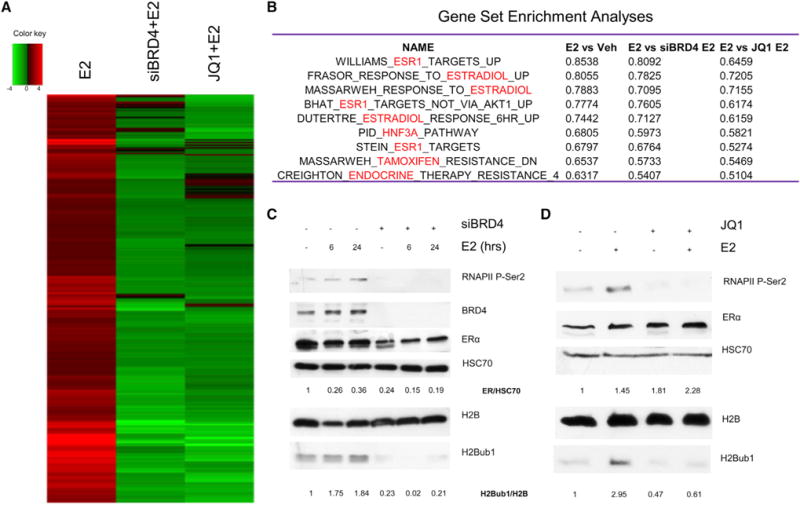
(A) Heatmap made with log2-fold changes from mRNA-seq of MCF7 cells. E2 denotes siCont and E2-treated samples relative to cells transfected with siCont and Veh treated. siBRD4+E2 denotes siBRD4 and E2-treated samples relative to siCont with E2 induction. JQ1+E2 denotes siCont, JQ1, and E2-treated samples relative to siCont with E2 induction. Only E2-upregulated genes ≥ 1.5-fold are shown. Adjusted p value is ≤ 0.05.
(B) GSEA of mRNA expression data from RNA-seq. The table shows the enrichment score for the topmost estrogen-related pathways in each condition. Nominal p value is ≤0.05, FDR ≤25%.
(C and D) Western blot analyses with specific antibodies on whole MCF7 protein extracts after transfection with negative control (−) or siBRD4 with 6 or 24 hr of E2 induction (C) or DMSO (−) or JQ1 and/or E2 induction for 24 hr (D). Relative quantified values of H2Bub1 normalized with H2B and ERα with HSC70 are indicated under the respective blots.
See also Figures S1A–S1J.
BRD4 Regulates RNAPII Phosphorylation and H2Bub1
Given the importance of BRD4 in controlling RNAPII elongation (Liu et al., 2013; Patel et al., 2013), and the established roles for RNAPII p-Ser2 (Kininis et al., 2009) and H2Bub1 (Prenzel et al., 2011) in E2-induced gene transcription, we examined whether BRD4 depletion or inhibition affects RNAPII p-Ser2 or H2Bub1. Interestingly, both RNAPII p-Ser2 and H2Bub1 substantially increased upon E2 treatment, and depletion or inhibition of BRD4 decreased their levels under basal as well as E2-induced conditions (Figures 1C, 1D, and S1J). Similar effects were also observed in Ishikawa and H1299 cells upon BRD4 depletion (Figure S1I).
BRD4 Regulates ERα-Dependent Cell Proliferation and Uterine Growth
In order to investigate the physiological function of BRD4 in controlling ERα activity, we examined cell proliferation after knockdown or inhibition of BRD4 in both MCF7 and Ishikawa cells. Notably, consistent with gene expression results (Figures 1A, 1B, and S1B–S1F), BRD4 perturbation decreased cell proliferation in a manner similar to the pure anti estrogen ICI182780 both in the presence and absence of E2 (Figures 2A, S2A, and S2B).
Figure 2. Inhibition and Knockdown of BRD4 Affect Proliferation and Uterine Growth.
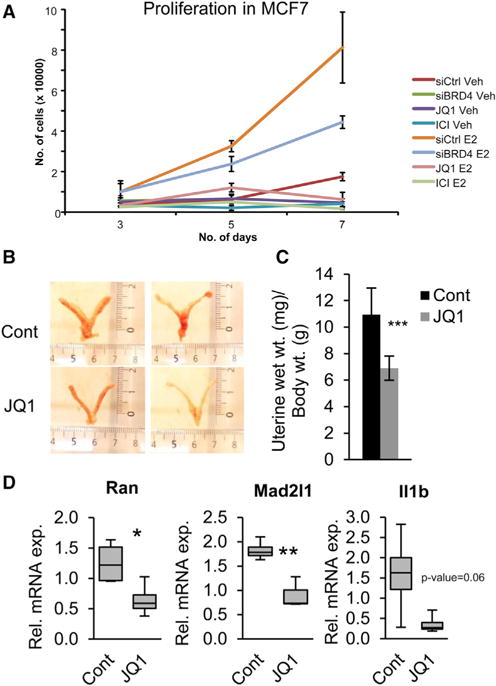
(A) Cell proliferation assays in MCF7 cells upon E2 as well as basal conditions under negative siCont, siBRD4, JQ1, and ICI182780 treatment.
(B–D) Three-week-old mice injected with Veh (Cont [control]) and JQ1 for 3 weeks were dissected, and uteri were analyzed for their size (B) and wet weight (wt.) (C). ***p ≤ 0.001. Data are represented as mean ± SD (n = 8). (D) Single-gene expression analyses of E2-induced genes (Ran, Mad2l1, and Il1b) after Veh (cont) or JQ1-injected mouse uteri. *p ≤ 0.05; **p ≤ 0.01. The data are represented as median ± SD (n = 4). Rel. mRNA exp., relative mRNA expression.
See also Figures S2A–S2C.
Decreased uterine weight is a hallmark of diminished estrogen signaling in vivo. Consistent with in vitro experiments, JQ1-injected mice demonstrated a substantial decrease in uterine growth (Figure 2B) and uterine wet weight (Figure 2C), without significant changes in total body weight (Figure S2C). Gene expression analyses confirmed decreased expression of E2-dependent genes in uteri from JQ1-injected mice (Figure 2D), confirming a central role for BRD4 in controlling E2-induced proliferation and growth both in vitro and in vivo.
BRD4 Occupancy Is Associated with an Active Epigenetic Context and Transcription
To gain mechanistic insight into the function of BRD4 and H2Bub1 in ERα-regulated transcription, we performed genome-wide chromatin immunoprecipitation (ChIP) and sequencing (ChIP-seq) analyses. Consistent with its role in E2-induced gene transcription, genome-wide profiling and single-gene analyses revealed increased BRD4 occupancy slightly downstream of the TSS and continuing into the transcribed region of E2-induced genes (Figures 3A, 3B, and S3A–S3G). This occupancy is decreased upon JQ1 treatment (Figure S3B). Conversely, E2 reduced BRD4 recruitment on E2-repressed genes (Figures S3D and S3F). Consistent with a previous study by Minsky et al. (2008), H2Bub1 preferentially occupied gene bodies (Figures 3C, 3D, and S3H–S3L). Notably, E2 treatment increased H2Bub1 levels on E2-stimulated genes significantly, and this effect was reduced by JQ1 treatment (Figures 3C, S3I, and S3K–S3M). Interestingly, the effect of JQ1 on H2Bub1 occupancy was most pronounced on genes exhibiting de novo RNAPII recruitment, such as GREB1 and TFF1, but less on RNAPII-recruited and -preloaded and -constitutively bound genes like XBP1 (Figures S3K and S3N).
Figure 3. BRD4 Occupies Promoters and Correlates with Active Transcription.

(A) Genomic binding profiles of BRD4 on E2-induced genes (GREB1 and TFF1) and a housekeeping gene (ACTB). Red indicates E2-treated and green indicates Veh-treated conditions.
(B) Aggregate plots showing genomic binding profiles of BRD4 on E2-upregulated gene-specific TSS upon Veh and E2-treated conditions. x axis shows the distance from the TSS of E2-upregulated genes in kilobase pairs. y axis shows the average BRD4 signal of the reads normalized per hundred million base pairs. TSS is marked with a black dotted line.
(C) Aggregate plots showing genomic profiles of H2Bub1 on E2-upregulated genes upon Veh, JQ1, as well as Veh (JQ1 Veh), E2, and JQ1 as well as E2 (JQ1 E2)-treated conditions. Weighted averages for each E2-upregulated gene, 1.5–2.5 kb downstream of each TSS, were used to calculate the p values using ANOVA with multiple-regression model. ***p ≤ 0.001.
(D) Genomic profiles of H2Bub1 on GREB1, TFF1, and ACTB. Red indicates E2-treated and green indicates JQ1 as well as E2 (JQ1 E2)-treated conditions.
(E) Correlation plot on E2-regulated gene-specific TSS +3 kb showing the association of BRD4, H3K27ac, H3K4me3, nascent RNA transcription (GRO-seq), RNAPII, H2Bub1, and DNase I-hypersensitivity sites (DNase-seq) and H3K27me3.
(F) Aggregate plot analyses of BRD4, H3K27ac, RNAPII, and H2Bub1 on GRO-seq-based groups (high, medium, low, and null), at specific TSSs on E2-regulated genes. “High” group corresponds to E2-upregulated TSS having a weighted average of GRO-seq signal from E2-treated MCF7 cells >0.3, “medium” ≥0.15 <0.3, “low” >0 <0.15, and “null” with no value of average. A class of H3K27me3-positive summits was examined as a negative control of active transcription.
See also Figures S3A–S3R.
Correlation and aggregate plots confirmed an association of BRD4 and active transcription on E2-induced TSSs (Figures 3E, 3F, and S3O–S3R). Moreover, BRD4 occupancy positively correlated with histone marks H3K27ac and H3K4me3, which are hallmarks of active transcription, as well as RNAPII, H2Bub1, and DHSs (DNase I-hypersensitivity sites), but not with H3K27me3 (Figures 3E and S3O). Similarly, H2Bub1 also correlated with transcription, H3K4me3, BRD4, H3K27ac, and RNAPII (Figures 3E and S3O). Grouping of TSSs according to the level of nascent RNA expressed (high, medium, low, and null) and aggregate plot and heatmap analyses revealed a clear association of BRD4, H3K27ac, H3K4me3, RNAPII, and H2Bub1 occupancy as well as DHSs and gene transcription (Figures 3F and S3P–S3R).
BRD4 Functions Downstream of ERα, H3K27ac, and Cohesin
Because BRD4 inhibition prevents E2-dependent gene induction without appreciably affecting ERα protein levels (Figures 1D and S4A), we also examined the effects of JQ1 treatment on the recruitment of ERα and the Cohesin subunit RAD21. Single-gene analyses of ERα binding suggested that ERα binding is not affected at specific EREs after BRD4 inhibition (Figures 4A and S4B). Consistent with a recent report describing an effect of BRD4 inhibition on androgen receptor (AR) recruitment (Asangani et al., 2014), genome-wide analyses confirmed that JQ1 treatment decreases ERα binding at most EREs (Figures 4B, S4D, and S4E). However, these effects are only partial, and substantial levels of ERα are still bound to EREs after JQ1 treatment (Figure S4F). Consistent with the recent studies that BRD4 does not promote chromosomal looping between enhancers and promoters (Liu et al., 2013), RAD21 binding to three different EREs known to serve as hubs for ERα-dependent looping (Fullwood et al., 2009) was unaffected by JQ1 treatment (Figure S4C). Interestingly, whereas BRD4 binding correlated with H3K27ac (Figure 3E) (Zhang et al., 2012b), BRD4 inhibition did not influence the E2-induced H3K27ac on individual E2-regulated enhancers and promoters (Figures 4C and S4H). These results suggest that BRD4 is recruited to E2-regulated genes subsequent to ERα binding, histone acetylation, and Cohesin recruitment.
Figure 4. BRD4 Binds to ER+ Enhancers after ERα Recruitment and H3K27ac and Regulates eRNA Synthesis.
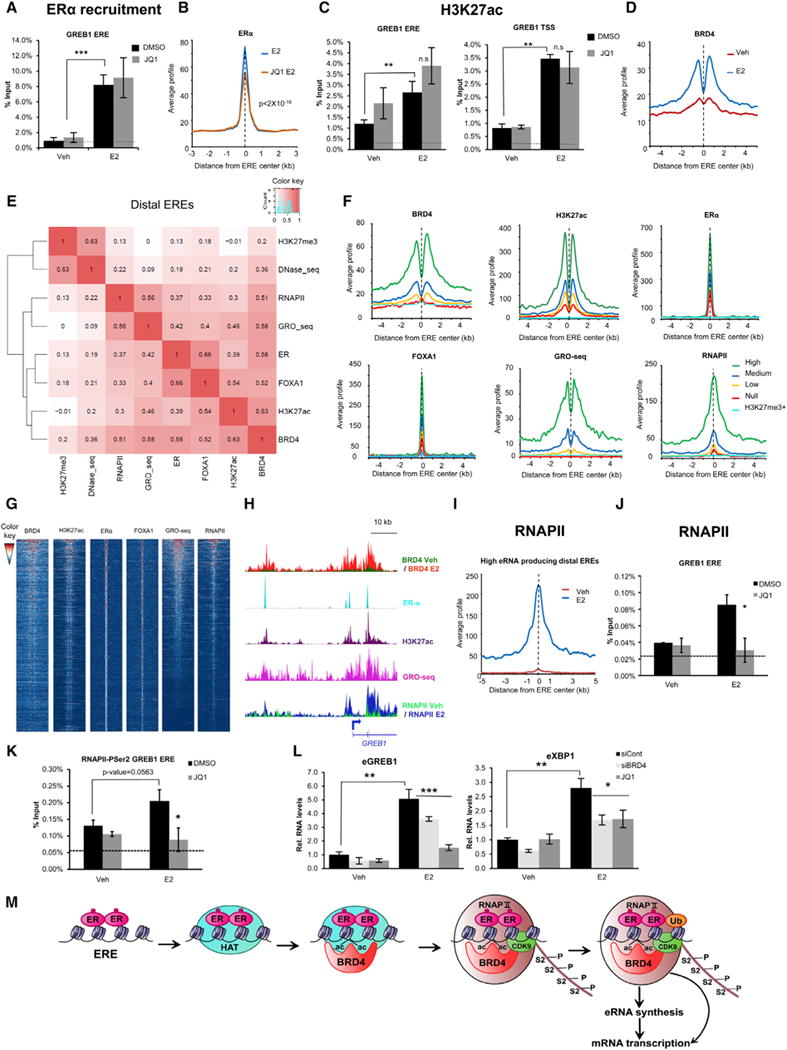
(A) ChIP-quantitative PCR (ChIP-qPCR) analyses of ERα occupancy on GREB1 ERE after DMSO or JQ1 treatment with Veh or E2 induction. ***p ≤ 0.001. Data are represented as mean ± SD (n = 3). Dotted line indicates background.
(B) Aggregate plot showing genomic binding profiles of ERα on distal EREs upon E2-treated and JQ1 as well as E2 (JQ1 E2)-treated conditions. x axis shows the distance from the center of ERE in kilobase pairs. y axis shows the average ERα signal of the reads normalized per hundred million base pairs. Weighted averages for each ERE ±100 bp were used to calculate the p values using ANOVA with repeated measures with ANOVA with multiple-regression model. p value is mentioned in the plot.
(C) ChIP-qPCR analyses of H3K27ac after DMSO or JQ1 treatment with Veh or E2 induction on GREB1 ERE overlapping region and GREB1 TSS. The data are represented as mean ± SD (n = 3). **p ≤ 0.01; n.s., not significant.
(D) Aggregate plot showing genomic binding profiles of BRD4 on distal EREs upon Veh and E2-treated conditions.
(E) Correlation plot on distal EREs ±1.5 kb showing the association of BRD4, H3K27ac, ERα, FOXA1, nascent RNA transcription (GRO-seq), RNAPII, DNase-seq, and H3K27me3.
(F) Aggregate plot analyses of BRD4, H3K27ac, ERα, FOXA1, and RNAPII occupancy on GRO-seq-based classified distal EREs. “High” group corresponds to distal EREs having a weighted average >0.45, “medium” >0.25 <0.45, “low” >0 ≤ 0.25, and “null” with no value of average.
(G) Heatmap profiles of BRD4, H3K27ac, ERα, FOXA1, nascent RNA transcription (GRO-seq), and RNAPII occupancy on ±5 kb of distal EREs aligned from high to null GRO-seq signals. Center of each heatmap denotes center of distal EREs.
(H) Binding profiles of BRD4, H3K27ac, ERα, GRO-seq, and RNAPII on GREB1 proximal and distal EREs and promoter. BRD4 with red peaks indicates E2-treated and green indicates Veh-treated conditions. RNAPII with blue peaks indicates E2-treated and light green indicates Veh-treated conditions.
(I) Aggregate plot showing genomic binding profiles of RNAPII on distal EREs that produce high eRNA (GRO-seq group “high”) upon Veh and E2-treated conditions. (J and K) ChIP-qPCR analyses of RNAPII
(J) and RNAPII-PSer2 (K) occupancy on GREB1 ERE after DMSO or JQ1 treatment with Veh or E2 induction. *p ≤ 0.05. Data are represented as mean ± SD (n = 3). Dotted line indicates background.
(L) eRNA-qPCR results showing E2-induced eRNA (eGREB1 and eXBP1) upon negative siCont, siBRD4, or JQ1 treatment with Veh or E2 induction. Relative RNA levels are shown as “Rel. RNA levels.” Data are represented as mean ± SD (n = 3).
(M) Model depicting the role of BRD4 on E2-induced transcription. ER, ERα; HAT, histone acetyltransferase; ac, histone acetylation; S2P, RNAPII p-Ser2; Ub, H2Bub1.
See also Figures S4A–S4N.
BRD4 Occupies Enhancers and Regulates eRNA Synthesis by Affecting RNAPII Recruitment and Elongation
BRD4 was recently shown to occupy and regulate enhancer function (Liu et al., 2013; Zhang et al., 2012b). Thus, we examined BRD4 occupancy at distal EREs and observed that BRD4 is recruited to distal EREs in an E2-dependent manner and correlated with H3K27ac, ERα, FOXA1, RNAPII, and DHS (Figures 4D, 4E, 4H, S4G, and S4I–S4L). Surprisingly, nascent RNA transcription on enhancers correlated with BRD4 occupancy to a greater extent than the other investigated profiles (Figures 4E–4H). RNAPII occupancy is also well associated with BRD4 on enhancers (Figure 4E). Interestingly, high eRNA-producing EREs exhibited high E2-induced RNAPII recruitment that extended to more than 5 kb upstream and downstream of the ERE summits, suggesting a tight association between RNAPII recruitment and elongation at eRNA-producing enhancers (Figures 4I and S4N). ChIP analyses confirmed that E2-induced RNAPII recruitment and elongation at the GREB1 ERE are decreased by JQ1 treatment (Figures 4J, 4K, and S4O). Altogether, these studies suggest that in addition to its role in transcriptional elongation, BRD4 affects both recruitment and elongation of RNAPII on ERα-dependent enhancers.
Importantly, BRD4 depletion or inhibition significantly decreased eRNA synthesis from E2-regulated enhancers (Figure 4L). This suggests that in addition to its reported cis-regulatory function, BRD4 may stimulate E2-induced mRNA transcription by promoting eRNA production at distal EREs.
DISCUSSION
The hierarchical epigenetic regulation of transcriptional activation involves an intricate network of interactions among various transcription factors, histone-modifying enzymes, epigenetic readers, and the transcriptional machinery. In this study, we investigated the function of the epigenetic reader BRD4 in controlling E2-regulated gene transcription. Our findings support a model in which ERα recruits histone acetyltransferases to a subset of EREs enriched for FOXA1 to facilitate histone acetylation and subsequent recruitment of BRD4 and RNAPII in order to promote eRNA synthesis (Figure 4M).
To date, most studies have focused largely on the role of BRD4 as a promoter proximal regulator of mRNA synthesis by increasing P-TEFb recruitment. Consistent with a direct function of BRD4 on target gene transcription, we show that BRD4 promotes elongation-associated phosphorylation of RNAPII and monoubiquitination of histone H2B. These results are consistent with an established essential role for H2Bub1 in E2-stimulated transcription (Prenzel et al., 2011) and the dependence of H2Bub1 upon CDK9 (Pirngruber et al., 2009). In addition to a cis-regulatory function of BRD4, our results uncover a role for BRD4 on enhancers. This is consistent with a previous finding that CDK9 is recruited by BRD4 to distal intergenic enhancer regions marked by H3K27ac (Lovén et al., 2013). Notably, we show that BRD4 co-occupies eRNA-producing enhancers with ERα, FOXA1, and H3K27ac, regulates RNAPII recruitment on ERα-bound enhancers, and is required for the production of eRNA transcripts. These findings support a role for BRD4 in hormone-dependent cancers (Asangani et al., 2014) and suggest a model in which eRNA synthesis requires a coordinated epigenetic hierarchy that culminates in the recruitment of BRD4 and RNAPII and subsequent transcription from a select subset of distal EREs.
The importance of BRD4 in E2-regulated transcription is consistent with previously identified interactions between BRD4 and ERα (Wu et al., 2013) as well as ERα and CDK9 (Sharp et al., 2006) or cyclin T1 (Wittmann et al., 2005). Furthermore, the 7SK component HEXIM1, which suppresses P-TEFb activity, negatively regulates ERα transcriptional activity (Wittmann et al., 2005), and its overexpression induces tamoxifen resistance (Ketchart et al., 2011). Importantly, recent data showed that CDK9 activity is required for the production of eRNAs at distal EREs (Hah et al., 2013) and the role of eRNA and MED1 in regulating AR-dependent transcription and looping (Hsieh et al., 2014). Thus, consistent with our model, P-TEFb and BRD4 likely promote ERα-mediated transcriptional activation at least in part by promoting eRNA transcription.
ERα functions together with Cohesin to nucleate chromosomal looping that promotes E2-regulated transcription (Full-wood et al., 2009; Schmidt et al., 2010). Our previous study showed that proteasomal inhibition specifically decreases ERα-regulated transcription by decreasing H2Bub1 and transcriptional elongation without affecting long-range chromosomal interactions (Prenzel et al., 2011). Consistently, CDK9 inhibition decreased ERα-dependent gene expression without affecting ERα occupancy, coactivator recruitment, or chromosomal looping (Hah et al., 2013). Similarly, our data show that BRD4 inhibition had little or no effect on ERα recruitment, E2-stimulated H3K27 acetylation, or Cohesin recruitment, indicating that BRD4 functions along with CDK9 downstream of early enhancer activation events but precedes RNAPII recruitment and elongation.
Numerous recent studies have shown a substantial therapeutic potential for BRD4 inhibition in various malignant diseases (Asangani et al., 2014; Filippakopoulos et al., 2010; Herrmann et al., 2012; Lockwood et al., 2012; Ott et al., 2012; Zhang et al., 2012a; Zuber et al., 2011), leading to the testing of several BET domain inhibitors in a clinical setting for certain types of tumors (Filippakopoulos and Knapp, 2014). However, the utility of BET inhibitors in ERα+ breast cancer has not been investigated. Here, we describe a function of BRD4 in specifically controlling E2-dependent gene transcription in ERα+ normal and malignant cells in vitro and in vivo. We provide mechanistic insight to support a previously unknown mechanism by which BRD4 controls distal enhancer activity and target gene expression by promoting eRNA synthesis. We hypothesize that this BRD4-dependent mechanism likely controls other enhancer-driven transcriptional programs directing processes such as lineage specification during cell differentiation and development. Moreover, these findings may potentially serve to provide a mechanistic-based approach to the treatment of ERα+ breast cancer.
EXPERIMENTAL PROCEDURES
Cell Culture, Transfections, Inhibitors, and siRNAs
MCF7 cells were provided by K. Pantel (University Medical Center, Hamburg-Eppendorf), Ishikawa from T. Spelsberg (Mayo Clinic, Rochester), and H1299 from M. Dobbelstein (University Medical Center, Göttingen). They were grown in phenol red-free high-glucose Dulbecco’s modified Eagle’s media (DMEMs; Invitrogen) supplemented with 10% bovine growth serum (Thermo Scientific), 1% sodium pyruvate, and 1% penicillin/streptomycin (Sigma-Aldrich). Forward and reverse transfections were performed using DharmaFECT 1 (Thermo Scientific) for small interfering RNAs (siRNAs) according to the manufacturer’s instructions. Nontargeting (negative control) and BRD4 siRNAs (siBRD4s) were obtained from Dharmacon (Thermo Scientific). BRD4 SmartPool siRNA (Dharmacon) contained the sequences 5′-AGCUGAACCUCCCUGAUUA-3′, 5′-UGAGAAAUCUGCCAGUAAU-3′, 5′-UAAAUGAGCUACCCACAGA-3′, and 5′-GAACCUCCCUGAUUACUAU-3′. JQ1 (150 nM) was used to pretreat the cells 30 min before E2 induction. 17 β-estradiol and ethinyl estradiol (Sigma-Aldrich) were used at the concentration of 10 nM. DMSO or ethanol was used as Veh. ICI182780 (Fulvestrant) was used at the concentration of 1 μM. TGF-β1 (2 ng/ml) treatment was done on H1299 cells for 90 min.
E2-induction experiments were carried out by changing the media to DMEM supplemented with 5% charcoal-dextran-treated fetal bovine serum (CSS; Sigma-Aldrich), 1% sodium pyruvate, and 1% penicillin/streptomycin after 24 hr of cell growth. After 48 hr of hormone deprivation, they were treated with 17 β-estradiol for 2, 6, or 24 hr. Ethinyl estradiol was used for proliferation assays in Ishikawa cells. TGF-β1 treatment in H1299 cells was given after growing the cells in serum-free media for 48 hr.
MCF-7 cells were harvested for RNA upon Veh or E2 treatment, and negative control siRNA (siCont), siBRD4, or JQ1 transfection. JQ1-treated cells were also transfected with negative siCont. Ishikawa and H1299 cells were harvested for RNA under Veh or E2 treatment, or TGF-β1 treatment and negative siCont or siBRD4.
RNA-Seq
RNA integrity was checked using Bioanalyzer 2100 (Agilent Technologies). A total of 500 ng of total RNA was used for preparing libraries using TruSeq RNA Sample Preparation Kit (Illumina), and the size range was checked to be 280 bp using Bioanalyzer. These samples were amplified and sequenced by using cBot and HiSeq 2000 from Illumina, respectively, for 51 bp single-ended tags with single indexing. Images from the sequencing results were processed using BaseCaller to bcl files function in Illumina software. These were demultiplexed to fastq files using CASAVA 1.8.2 and mapped to the human reference transcriptome (UCSC HG19) using Bowtie 2 (version 2.1.0) (Langmead and Salzberg, 2012). Read counts for each sample and each gene were aggregated using a custom Ruby script. DESeq (version 1.14.0) was used for measuring differential expression (Anders and Huber, 2010).
Gene Set Enrichment Analysis
Pathway enrichment scores were calculated by GSEA (Subramanian et al., 2005). The gene expression data from RNA sequencing (RNA-seq) analyses are sorted by correlation with log2-fold changes between different conditions. This sorted expression data set was compared with C2-curated gene sets that include published gene sets from pathways of chemical and genetic perturbations, canonical pathways, BIOCARTA, Reactome, and KEGG. WILLIAMS_ESR1_TARGETS_UP (Williams et al., 2008), FRASOR_RESPONSE_TO_ESTRADIOL_UP (Frasor et al., 2004), MASSERWEH_RESPONSE_TO_ESTRADIOL (Massarweh et al., 2008), BHAT_ESR1_TARGETS_NOT_VIA_AKT1_UP (Bhat-Nakshatri et al., 2008), DUTERTRE_ESTRADIOL_RESPONSE_6HR_UP (Dutertre et al., 2010), PID_HNF3A_PATHWAY (Schaefer et al., 2009), STEIN_ESR1_TARGETS (Stein et al., 2008), MASSERWEH_TAMOXIFEN_RESISTANCE_DN (Massarweh et al., 2008), and CREIGHTON_ENDOCRINE_THERAPY_RESISTANCE_4 (Creighton et al., 2008) are shown as E2-related topmost enriched pathways under BRD4 perturbation.
ChIP
ChIP and subsequent real-time PCR analyses with specific primers (Table S3) were performed as before (Prenzel et al., 2011; Bedi et al., 2014) for BRD4, ERα, RAD21, H3K27ac, and H2Bub1. ChIP-seq was performed for BRD4, ERα, and H2Bub1. BRD4 ChIP was performed by crosslinking the chromatin for 20 min in 1% formaldehyde. Other antibodies and their dilutions were used as described before (Table S1) (Prenzel et al., 2011; Bedi et al., 2014).
ChIP-Seq and Bioinformatic Analyses
Prior to library preparation, immunoprecipitated DNA was sonicated an additional time to ensure fragment sizes less than 200 bp. Libraries were prepared using the NEBNext Ultra DNA library preparation kit according to the manufacturer’s instructions. Size range was verified to be 280–300 bp using Bioanalyzer 2100. A total of 50 cycles were used for amplification in cBot, and 101 bp single-ended tags for BRD4 and 51 bp single-ended tags for other ChIP samples were sequenced with single indexing using Illumina HiSeq 2500. Raw data for FOXA1, H3K4me3, H3K27me3 (Joseph et al., 2010), H3K27ac (Theodorou et al., 2013), RNAPII (Welboren et al., 2009), DNase sequencing (DNase-seq) (Thurman et al., 2012), and global run-on (GRO) sequencing (GRO-seq) (Hah et al., 2013) were downloaded from the European Nucleotide Archive, and their accession numbers are listed in Table S4. The reads were mapped to the human reference genome (UCSC HG19) using Bowtie (version 1.0.0) (Langmead et al., 2009). Peak calling was done by Model-based Analysis of ChIP-Seq (version 1.4.2) (Zhang et al., 2008). Coverage was determined by normalizing the total number of mapped reads per hundred million. For plotting correlation, aggregation, ChIP enrichment signals over specific genomic features, and heatmaps, Cistrome (Liu et al., 2011) based on the Galaxy framework was used. Data were visualized in Integrative Genomics Viewer (version 2.3.14) (Thorvaldsdóttir et al., 2013). Common TSS and gene body coordinates were obtained from UCSC Table Browser (Karolchik et al., 2004). Distal EREs were defined as ERα binding sites not within gene bodies or regions 5 kb upstream or downstream thereof. Regions covering the TSS and 3 kb downstream of it were used for TSS-oriented correlation plots and 1.5 kb up- and downstream to distal EREs for distal ERE-oriented correlation plots. Average signals of GRO-seq data with E2 treatment were calculated using assign weighted average function in Cistrome surrounding TSS (plus 3 kb) or ERE (±1.5 kb). These values were used to group the TSS or ERE coordinates as high, medium, low, and null. For distal EREs, the “high” group corresponds to distal EREs having a weighted average greater than 0.45, “medium” has >0.25 <0.45, “low” has >0 ≤.25, and “null” has a zero (0) average. For TSSs, the “high” group corresponds to distal EREs having a weighted average greater than 0.3, “medium” has ≥.15 <0.3, “low” has >0 <0.15, “null” has a zero (0) average. The range for these groups was chosen according to the similar number of TSSs or EREs in each group and adequate GRO-seq enrichment signal defined for each group. H3K27me3-positive coordinates were obtained using the summits of H3K27me3 ChIP-seq signal (Joseph et al., 2010). For measuring statistical significance of aggregate plots, weighted averages for each E2-up-regulated gene, 1.5–2.5 kb downstream of each TSS or distal ERE ±100 bp, were used to compute a multiple-linear regression model. Within the multiple-linear regression model, the weighted average within a 1 kb window was used as a dependent variable, given the independent variables of condition and gene. The condition variable was tested for significant impact using an ANOVA. Groups of E2-upregulated genes based on RNAPII occupancy (RNAPII recruited de novo, RNAPII preloaded and recruited, and RNAPII constitutively bound) were kindly provided by W. Lee Kraus. E2 up- (≥ 1.5-fold), down- (≤0.8-fold), and nonregulated genes were retrieved from RNA-seq data.
In Vivo Experiments in JQ1-Injected Mice
Three-week-old C57BL/6 female mice were injected intraperitoneally with JQ1 (50 mg/kg) or Veh (5% DMSO in 5% dextrose) for 3 weeks (n = 8 for each group). Mice were sacrificed via CO2 inhalation, and uteri were collected to examine differences in their size and weight. Difference in the uterine weight between control (DMSO) and JQ1-injected mice was calculated by normalizing the uterine wet weight (in milligrams) with respect to body weight (in grams). Uteri (n = 4 for each group) were homogenized using beads by FastPrep FP120 homogenizer (Thermo Scientific), and RNA was isolated using TRIzol (QIAGEN) according to manufacturer’s instructions. Normalization was done using starting quantity values of glyceraldehyde 3-phosphate dehydrogenase. Relative mRNA expression analyses were done as mentioned before (but not normalized for control conditions) using gene-specific primers for the E2-dependent and cell-cycle-related genes Ran and Mad2l1 (Suzuki et al., 2007) and the reproduction-related gene Il1b (Weihua et al., 2000). Primers are listed in Table S2. Statistical significance was analyzed using Student’s t test. All animal studies were performed in compliance with the requirements of the German Animal Welfare Act.
Supplementary Material
Acknowledgments
The authors thank G. Salinas-Riester for performing RNA-seq, F. Kramer, T. Beissbarth, and S. Joosse for help in statistical analysis, W.L. Kraus for the list of RNAPII groups, members of the S.A.J. group for thoughtful discussions, and V. Manickam for help with graphic design. This work was funded by the German Academic Exchange Service (to S.N.); the SGC, a registered charity (1097737) that receives funds from the Canadian Institutes for Health Research, the Canada Foundation for Innovation, Genome Canada, AbbVie, Boehringer Ingelheim, Bayer, Janssen, GlaxoSmithKline, Pfizer, Eli Lilly, the Novartis Research Foundation, Takeda, the Ontario Ministry of Research and Innovation, and the Wellcome Trust (092309/Z/10/Z to S.K.); NIH (CA103867), CPRIT (RP110471), and Welch Foundation (I-1805) (to C.-M.C.); German Research Foundation HE 5208/2-1 (to E.H.); the Alexander-von-Humboldt Foundation and EMBO (to H.T.); and the Deutsche Krebshilfe (109088 to S.A.J.).
Footnotes
ACCESSION NUMBERS
The NCBI Gene Expression Omnibus accession number for RNA- and ChIP-seq data reported in this paper is GSE55923.
SUPPLEMENTAL INFORMATION
Supplemental Information includes Supplemental Experimental Procedures, four figures, and four tables and can be found with this article online at http://dx.doi.org/10.1016/j.celrep.2014.06.016.
AUTHOR CONTRIBUTIONS
S.N. and S.A.J. designed the experiments and wrote the manuscript. S.N. and T.H. performed the experiments. S.N. and M.A. performed bioinformatic analyses. Z.N., H.T., I.B.-B., and M.S. performed mouse injection and dissection. D.I. and A.G. performed next-generation sequencing. S.K. provided JQ1. C.-M.C. generated the BRD4 antibody for ChIP-seq. All authors provided intellectual input and edited the manuscript.
References
- Aiyar SE, Sun JL, Blair AL, Moskaluk CA, Lu YZ, Ye QN, Yamaguchi Y, Mukherjee A, Ren DM, Handa H, Li R. Attenuation of estrogen receptor α-mediated transcription through estrogen-stimulated recruitment of a negative elongation factor. Genes Dev. 2004;18:2134–2146. doi: 10.1101/gad.1214104. [DOI] [PMC free article] [PubMed] [Google Scholar]
- Alsarraj J, Walker RC, Webster JD, Geiger TR, Crawford NPS, Simpson RM, Ozato K, Hunter KW. Deletion of the proline-rich region of the murine metastasis susceptibility gene Brd4 promotes epithelial-to-mesenchymal transition- and stem cell-like conversion. Cancer Res. 2011;71:3121–3131. doi: 10.1158/0008-5472.CAN-10-4417. [DOI] [PMC free article] [PubMed] [Google Scholar]
- Anders S, Huber W. Differential expression analysis for sequence count data. Genome Biol. 2010;11:R106. doi: 10.1186/gb-2010-11-10-r106. [DOI] [PMC free article] [PubMed] [Google Scholar]
- Asangani IA, Dommeti VL, Wang X, Malik R, Cieslik M, Yang R, Escara-Wilke J, Wilder-Romans K, Dhanireddy S, Engelke C, et al. Therapeutic targeting of BET bromodomain proteins in castration-resistant prostate cancer. Nature. 2014;510:278–282. doi: 10.1038/nature13229. [DOI] [PMC free article] [PubMed] [Google Scholar]
- Bedi U, Scheel AH, Hennion M, Begus-Nahrmann Y, Rüschoff J, Johnsen SA. SUPT6H controls estrogen receptor activity and cellular differentiation by multiple epigenomic mechanisms. Oncogene. 2014 doi: 10.1038/onc.2013.558. [DOI] [PubMed] [Google Scholar]
- Bhat-Nakshatri P, Wang G, Appaiah H, Luktuke N, Carroll JS, Geistlinger TR, Brown M, Badve S, Liu Y, Nakshatri H. AKT alters genome-wide estrogen receptor alpha binding and impacts estrogen signaling in breast cancer. Mol Cell Biol. 2008;28:7487–7503. doi: 10.1128/MCB.00799-08. [DOI] [PMC free article] [PubMed] [Google Scholar]
- Carroll JS, Liu XS, Brodsky AS, Li W, Meyer CA, Szary AJ, Eeckhoute J, Shao W, Hestermann EV, Geistlinger TR, et al. Chromosome-wide mapping of estrogen receptor binding reveals long-range regulation requiring the forkhead protein FoxA1. Cell. 2005;122:33–43. doi: 10.1016/j.cell.2005.05.008. [DOI] [PubMed] [Google Scholar]
- Crawford NP, Alsarraj J, Lukes L, Walker RC, Officewala JS, Yang HH, Lee MP, Ozato K, Hunter KW. Bromodomain 4 activation predicts breast cancer survival. Proc Natl Acad Sci USA. 2008;105:6380–6385. doi: 10.1073/pnas.0710331105. [DOI] [PMC free article] [PubMed] [Google Scholar]
- Creighton CJ, Massarweh S, Huang S, Tsimelzon A, Hilsenbeck SG, Osborne CK, Shou J, Malorni L, Schiff R. Development of resistance to targeted therapies transforms the clinically associated molecular profile subtype of breast tumor xenografts. Cancer Res. 2008;68:7493–7501. doi: 10.1158/0008-5472.CAN-08-1404. [DOI] [PMC free article] [PubMed] [Google Scholar]
- Deroo BJ, Korach KS. Estrogen receptors and human disease. J Clin Invest. 2006;116:561–570. doi: 10.1172/JCI27987. [DOI] [PMC free article] [PubMed] [Google Scholar]
- Dutertre M, Gratadou L, Dardenne E, Germann S, Samaan S, Lidereau R, Driouch K, de la Grange P, Auboeuf D. Estrogen regulation and physiopathologic significance of alternative promoters in breast cancer. Cancer Res. 2010;70:3760–3770. doi: 10.1158/0008-5472.CAN-09-3988. [DOI] [PubMed] [Google Scholar]
- Filippakopoulos P, Knapp S. Targeting bromodomains: epigenetic readers of lysine acetylation. Nat Rev Drug Discov. 2014;13:337–356. doi: 10.1038/nrd4286. [DOI] [PubMed] [Google Scholar]
- Filippakopoulos P, Qi J, Picaud S, Shen Y, Smith WB, Fedorov O, Morse EM, Keates T, Hickman TT, Felletar I, et al. Selective inhibition of BET bromodomains. Nature. 2010;468:1067–1073. doi: 10.1038/nature09504. [DOI] [PMC free article] [PubMed] [Google Scholar]
- Frasor J, Stossi F, Danes JM, Komm B, Lyttle CR, Katzenellenbogen BS. Selective estrogen receptor modulators: discrimination of agonistic versus antagonistic activities by gene expression profiling in breast cancer cells. Cancer Res. 2004;64:1522–1533. doi: 10.1158/0008-5472.can-03-3326. [DOI] [PubMed] [Google Scholar]
- Fullwood MJ, Liu MH, Pan YF, Liu J, Xu H, Mohamed YB, Orlov YL, Velkov S, Ho A, Mei PH, et al. An oestrogen-receptor-alpha-bound human chromatin interactome. Nature. 2009;462:58–64. doi: 10.1038/nature08497. [DOI] [PMC free article] [PubMed] [Google Scholar]
- Hah N, Murakami S, Nagari A, Danko CG, Kraus WL. Enhancer transcripts mark active estrogen receptor binding sites. Genome Res. 2013;23:1210–1223. doi: 10.1101/gr.152306.112. [DOI] [PMC free article] [PubMed] [Google Scholar]
- Herrmann H, Blatt K, Shi J, Gleixner KV, Cerny-Reiterer S, Müllauer L, Vakoc CR, Sperr WR, Horny HP, Bradner JE, et al. Small-molecule inhibition of BRD4 as a new potent approach to eliminate leukemic stem- and progenitor cells in acute myeloid leukemia AML. Oncotarget. 2012;3:1588–1589. doi: 10.18632/oncotarget.733. [DOI] [PMC free article] [PubMed] [Google Scholar]
- Hsieh CL, Fei T, Chen Y, Li T, Gao Y, Wang X, Sun T, Sweeney CJ, Lee GS, Chen S, et al. Enhancer RNAs participate in androgen receptor-driven looping that selectively enhances gene activation. Proc Natl Acad Sci USA. 2014;111:7319–7324. doi: 10.1073/pnas.1324151111. [DOI] [PMC free article] [PubMed] [Google Scholar]
- Hurtado A, Holmes KA, Ross-Innes CS, Schmidt D, Carroll JS. FOXA1 is a key determinant of estrogen receptor function and endocrine response. Nat Genet. 2011;43:27–33. doi: 10.1038/ng.730. [DOI] [PMC free article] [PubMed] [Google Scholar]
- Joseph R, Orlov YL, Huss M, Sun W, Kong SL, Ukil L, Pan YF, Li G, Lim M, Thomsen JS, et al. Integrative model of genomic factors for determining binding site selection by estrogen receptor-α. Mol Syst Biol. 2010;6:456. doi: 10.1038/msb.2010.109. [DOI] [PMC free article] [PubMed] [Google Scholar]
- Karolchik D, Hinrichs AS, Furey TS, Roskin KM, Sugnet CW, Haussler D, Kent WJ. The UCSC Table Browser data retrieval tool. Nucleic Acids Res. 2004;32:D493–D496. doi: 10.1093/nar/gkh103. Database issue. [DOI] [PMC free article] [PubMed] [Google Scholar]
- Karpiuk O, Najafova Z, Kramer F, Hennion M, Galonska C, König A, Snaidero N, Vogel T, Shchebet A, Begus-Nahrmann Y, et al. The histone H2B monoubiquitination regulatory pathway is required for differentiation of multipotent stem cells. Mol Cell. 2012;46:705–713. doi: 10.1016/j.molcel.2012.05.022. [DOI] [PubMed] [Google Scholar]
- Ketchart W, Ogba N, Kresak A, Albert JM, Pink JJ, Montano MM. HEXIM1 is a critical determinant of the response to tamoxifen. Oncogene. 2011;30:3563–3569. doi: 10.1038/onc.2011.76. [DOI] [PMC free article] [PubMed] [Google Scholar]
- Kim TK, Hemberg M, Gray JM, Costa AM, Bear DM, Wu J, Harmin DA, Laptewicz M, Barbara-Haley K, Kuersten S, et al. Widespread transcription at neuronal activity-regulated enhancers. Nature. 2010;465:182–187. doi: 10.1038/nature09033. [DOI] [PMC free article] [PubMed] [Google Scholar]
- Kininis M, Isaacs GD, Core LJ, Hah N, Kraus WL. Postrecruitment regulation of RNA polymerase II directs rapid signaling responses at the promoters of estrogen target genes. Mol Cell Biol. 2009;29:1123–1133. doi: 10.1128/MCB.00841-08. [DOI] [PMC free article] [PubMed] [Google Scholar]
- Langmead B, Salzberg SL. Fast gapped-read alignment with Bowtie 2. Nat Methods. 2012;9:357–359. doi: 10.1038/nmeth.1923. [DOI] [PMC free article] [PubMed] [Google Scholar]
- Langmead B, Trapnell C, Pop M, Salzberg SL. Ultrafast and memory-efficient alignment of short DNA sequences to the human genome. Genome Biol. 2009;10:R25. doi: 10.1186/gb-2009-10-3-r25. [DOI] [PMC free article] [PubMed] [Google Scholar]
- Li W, Notani D, Ma Q, Tanasa B, Nunez E, Chen AY, Merkurjev D, Zhang J, Ohgi K, Song X, et al. Functional roles of enhancer RNAs for oestrogen-dependent transcriptional activation. Nature. 2013;498:516–520. doi: 10.1038/nature12210. [DOI] [PMC free article] [PubMed] [Google Scholar]
- Liu T, Ortiz JA, Taing L, Meyer CA, Lee B, Zhang Y, Shin H, Wong SS, Ma J, Lei Y, et al. Cistrome: an integrative platform for transcriptional regulation studies. Genome Biol. 2011;12:R83. doi: 10.1186/gb-2011-12-8-r83. [DOI] [PMC free article] [PubMed] [Google Scholar]
- Liu W, Ma Q, Wong K, Li W, Ohgi K, Zhang J, Aggarwal AK, Rosenfeld MG. Brd4 and JMJD6-associated anti-pause enhancers in regulation of transcriptional pause release. Cell. 2013;155:1581–1595. doi: 10.1016/j.cell.2013.10.056. [DOI] [PMC free article] [PubMed] [Google Scholar]
- Lockwood WW, Zejnullahu K, Bradner JE, Varmus H. Sensitivity of human lung adenocarcinoma cell lines to targeted inhibition of BET epigenetic signaling proteins. Proc Natl Acad Sci USA. 2012;109:19408–19413. doi: 10.1073/pnas.1216363109. [DOI] [PMC free article] [PubMed] [Google Scholar]
- Lovén J, Hoke HA, Lin CY, Lau A, Orlando DA, Vakoc CR, Bradner JE, Lee TI, Young RA. Selective inhibition of tumor oncogenes by disruption of super-enhancers. Cell. 2013;153:320–334. doi: 10.1016/j.cell.2013.03.036. [DOI] [PMC free article] [PubMed] [Google Scholar]
- Massarweh S, Osborne CK, Creighton CJ, Qin L, Tsimelzon A, Huang S, Weiss H, Rimawi M, Schiff R. Tamoxifen resistance in breast tumors is driven by growth factor receptor signaling with repression of classic estrogen receptor genomic function. Cancer Res. 2008;68:826–833. doi: 10.1158/0008-5472.CAN-07-2707. [DOI] [PubMed] [Google Scholar]
- Minsky N, Shema E, Field Y, Schuster M, Segal E, Oren M. Monoubiquitinated H2B is associated with the transcribed region of highly expressed genes in human cells. Nat Cell Biol. 2008;10:483–488. doi: 10.1038/ncb1712. [DOI] [PubMed] [Google Scholar]
- Mochizuki K, Nishiyama A, Jang MK, Dey A, Ghosh A, Tamura T, Natsume H, Yao H, Ozato K. The bromodomain protein Brd4 stimulates G1 gene transcription and promotes progression to S phase. J Biol Chem. 2008;283:9040–9048. doi: 10.1074/jbc.M707603200. [DOI] [PMC free article] [PubMed] [Google Scholar]
- Ott CJ, Kopp N, Bird L, Paranal RM, Qi J, Bowman T, Rodig SJ, Kung AL, Bradner JE, Weinstock DM. BET bromodomain inhibition targets both c-Myc and IL7R in high-risk acute lymphoblastic leukemia. Blood. 2012;120:2843–2852. doi: 10.1182/blood-2012-02-413021. [DOI] [PMC free article] [PubMed] [Google Scholar]
- Patel MC, Debrosse M, Smith M, Dey A, Huynh W, Sarai N, Heightman TD, Tamura T, Ozato K. BRD4 coordinates recruitment of pause release factor P-TEFb and the pausing complex NELF/DSIF to regulate transcription elongation of interferon-stimulated genes. Mol Cell Biol. 2013;33:2497–2507. doi: 10.1128/MCB.01180-12. [DOI] [PMC free article] [PubMed] [Google Scholar]
- Peterlin BM, Price DH. Controlling the elongation phase of transcription with P-TEFb. Mol Cell. 2006;23:297–305. doi: 10.1016/j.molcel.2006.06.014. [DOI] [PubMed] [Google Scholar]
- Picaud S, Da Costa D, Thanasopoulou A, Filippakopoulos P, Fish PV, Philpott M, Fedorov O, Brennan P, Bunnage ME, Owen DR, et al. PFI-1, a highly selective protein interaction inhibitor, targeting BET Bromodomains. Cancer Res. 2013;73:3336–3346. doi: 10.1158/0008-5472.CAN-12-3292. [DOI] [PMC free article] [PubMed] [Google Scholar]
- Pirngruber J, Shchebet A, Schreiber L, Shema E, Minsky N, Chapman RD, Eick D, Aylon Y, Oren M, Johnsen SA. CDK9 directs H2B monoubiquitination and controls replication-dependent histone mRNA 3′-end processing. EMBO Rep. 2009;10:894–900. doi: 10.1038/embor.2009.108. [DOI] [PMC free article] [PubMed] [Google Scholar]
- Prenzel T, Begus-Nahrmann Y, Kramer F, Hennion M, Hsu C, Gorsler T, Hintermair C, Eick D, Kremmer E, Simons M, et al. Estrogen-dependent gene transcription in human breast cancer cells relies upon proteasome-dependent monoubiquitination of histone H2B. Cancer Res. 2011;71:5739–5753. doi: 10.1158/0008-5472.CAN-11-1896. [DOI] [PubMed] [Google Scholar]
- Schaefer CF, Anthony K, Krupa S, Buchoff J, Day M, Hannay T, Buetow KH. PID: the Pathway Interaction Database. Nucleic Acids Res. 2009;37:D674–D679. doi: 10.1093/nar/gkn653. Database issue. [DOI] [PMC free article] [PubMed] [Google Scholar]
- Schmidt D, Schwalie PC, Ross-Innes CS, Hurtado A, Brown GD, Carroll JS, Flicek P, Odom DT. A CTCF-independent role for cohesin in tissue-specific transcription. Genome Res. 2010;20:578–588. doi: 10.1101/gr.100479.109. [DOI] [PMC free article] [PubMed] [Google Scholar]
- Sharp ZD, Mancini MG, Hinojos CA, Dai F, Berno V, Szafran AT, Smith KP, Lele TP, Ingber DE, Mancini MA. Estrogen-receptor-alpha exchange and chromatin dynamics are ligand- and domain-dependent. J Cell Sci. 2006;119:4101–4116. doi: 10.1242/jcs.03161. [DOI] [PubMed] [Google Scholar]
- Stein RA, Chang CY, Kazmin DA, Way J, Schroeder T, Wergin M, Dewhirst MW, McDonnell DP. Estrogen-related receptor alpha is critical for the growth of estrogen receptor-negative breast cancer. Cancer Res. 2008;68:8805–8812. doi: 10.1158/0008-5472.CAN-08-1594. [DOI] [PMC free article] [PubMed] [Google Scholar]
- Subramanian A, Tamayo P, Mootha VK, Mukherjee S, Ebert BL, Gillette MA, Paulovich A, Pomeroy SL, Golub TR, Lander ES, Mesirov JP. Gene set enrichment analysis: a knowledge-based approach for interpreting genome-wide expression profiles. Proc Natl Acad Sci USA. 2005;102:15545–15550. doi: 10.1073/pnas.0506580102. [DOI] [PMC free article] [PubMed] [Google Scholar]
- Suzuki A, Urushitani H, Watanabe H, Sato T, Iguchi T, Kobayashi T, Ohta Y. Comparison of estrogen responsive genes in the mouse uterus, vagina and mammary gland. J Vet Med Sci. 2007;69:725–731. doi: 10.1292/jvms.69.725. [DOI] [PubMed] [Google Scholar]
- Theodorou V, Stark R, Menon S, Carroll JS. GATA3 acts upstream of FOXA1 in mediating ESR1 binding by shaping enhancer accessibility. Genome Res. 2013;23:12–22. doi: 10.1101/gr.139469.112. [DOI] [PMC free article] [PubMed] [Google Scholar]
- Thorvaldsdóttir H, Robinson JT, Mesirov JP. Integrative Genomics Viewer (IGV): high-performance genomics data visualization and exploration. Brief Bioinform. 2013;14:178–192. doi: 10.1093/bib/bbs017. [DOI] [PMC free article] [PubMed] [Google Scholar]
- Thurman RE, Rynes E, Humbert R, Vierstra J, Maurano MT, Haugen E, Sheffield NC, Stergachis AB, Wang H, Vernot B, et al. The accessible chromatin landscape of the human genome. Nature. 2012;489:75–82. doi: 10.1038/nature11232. [DOI] [PMC free article] [PubMed] [Google Scholar]
- Weihua Z, Saji S, Mäkinen S, Cheng G, Jensen EV, Warner M, Gustafsson J-Å. Estrogen receptor (ER) β, a modulator of ERalpha in the uterus. Proc Natl Acad Sci USA. 2000;97:5936–5941. doi: 10.1073/pnas.97.11.5936. [DOI] [PMC free article] [PubMed] [Google Scholar]
- Welboren WJ, van Driel MA, Janssen-Megens EM, van Heeringen SJ, Sweep FC, Span PN, Stunnenberg HG. ChIP-Seq of ERalpha and RNA polymerase II defines genes differentially responding to ligands. EMBO J. 2009;28:1418–1428. doi: 10.1038/emboj.2009.88. [DOI] [PMC free article] [PubMed] [Google Scholar]
- Williams C, Edvardsson K, Lewandowski SA, Ström A, Gustafsson JA. A genome-wide study of the repressive effects of estrogen receptor beta on estrogen receptor alpha signaling in breast cancer cells. Oncogene. 2008;27:1019–1032. doi: 10.1038/sj.onc.1210712. [DOI] [PubMed] [Google Scholar]
- Wittmann BM, Fujinaga K, Deng H, Ogba N, Montano MM. The breast cell growth inhibitor, estrogen down regulated gene 1, modulates a novel functional interaction between estrogen receptor alpha and transcriptional elongation factor cyclin T1. Oncogene. 2005;24:5576–5588. doi: 10.1038/sj.onc.1208728. [DOI] [PubMed] [Google Scholar]
- Wu SY, Lee AY, Lai HT, Zhang H, Chiang CM. Phospho switch triggers Brd4 chromatin binding and activator recruitment for gene-specific targeting. Mol Cell. 2013;49:843–857. doi: 10.1016/j.molcel.2012.12.006. [DOI] [PMC free article] [PubMed] [Google Scholar]
- Zhang Y, Liu T, Meyer CA, Eeckhoute J, Johnson DS, Bernstein BE, Nusbaum C, Myers RM, Brown M, Li W, Liu XS. Model-based analysis of ChIP-Seq (MACS) Genome Biol. 2008;9:R137. doi: 10.1186/gb-2008-9-9-r137. [DOI] [PMC free article] [PubMed] [Google Scholar]
- Zhang Y, Chen A, Yan XM, Huang G. Disordered epigenetic regulation in MLL-related leukemia. Int J Hematol. 2012a;96:428–437. doi: 10.1007/s12185-012-1180-0. [DOI] [PubMed] [Google Scholar]
- Zhang W, Prakash C, Sum C, Gong Y, Li Y, Kwok JJT, Thiessen N, Pettersson S, Jones SJM, Knapp S, et al. Bromodomain-containing protein 4 (BRD4) regulates RNA polymerase II serine 2 phosphorylation in human CD4+ T cells. J Biol Chem. 2012b;287:43137–43155. doi: 10.1074/jbc.M112.413047. [DOI] [PMC free article] [PubMed] [Google Scholar]
- Zippo A, Serafini R, Rocchigiani M, Pennacchini S, Krepelova A, Oliviero S. Histone crosstalk between H3S10ph and H4K16ac generates a histone code that mediates transcription elongation. Cell. 2009;138:1122–1136. doi: 10.1016/j.cell.2009.07.031. [DOI] [PubMed] [Google Scholar]
- Zou Z, Huang B, Wu X, Zhang H, Qi J, Bradner J, Nair S, Chen LF. Brd4 maintains constitutively active NF-κB in cancer cells by binding to acetylated RelA. Oncogene. 2014;33:2395–2404. doi: 10.1038/onc.2013.179. [DOI] [PMC free article] [PubMed] [Google Scholar]
- Zuber J, Shi J, Wang E, Rappaport AR, Herrmann H, Sison EA, Magoon D, Qi J, Blatt K, Wunderlich M, et al. RNAi screen identifies Brd4 as a therapeutic target in acute myeloid leukaemia. Nature. 2011;478:524–528. doi: 10.1038/nature10334. [DOI] [PMC free article] [PubMed] [Google Scholar]
Associated Data
This section collects any data citations, data availability statements, or supplementary materials included in this article.