

See Raethjen and Muthuraman (doi:10.1093/brain/awv238) for a scientific commentary on this article.
In the first task-free fMRI study of inter-regional connectivity in essential tremor, Gallea et al. reveal that the supplementary motor area has decreased functional connectivity with the M1 hand area, and also shows increased grey matter and corticospinal projections. Changes correlate with clinical severity and cerebellar grey matter loss.
Keywords: cerebellar function, motor cortex, movement disorder: imaging, tremor, frontal lobe
See Raethjen and Muthuraman (doi:10.1093/brain/awv238) for a scientific commentary on this article.
In the first task-free fMRI study of inter-regional connectivity in essential tremor, Gallea et al. reveal that the supplementary motor area has decreased functional connectivity with the M1 hand area, and also shows increased grey matter and corticospinal projections. Changes correlate with clinical severity and cerebellar grey matter loss.
Abstract
See Raethjen and Muthuraman (doi:10.1093/brain/awv238) for a scientific commentary on this article.
Essential tremor is a movement disorder characterized by tremor during voluntary movements, mainly affecting the upper limbs. The cerebellum and its connections to the cortex are known to be involved in essential tremor, but no task-free intrinsic signatures of tremor related to structural cerebellar defects have so far been found in the cortical motor network. Here we used voxel-based morphometry, tractography and resting-state functional MRI at 3 T to compare structural and functional features in 19 patients with essential tremor and homogeneous symptoms in the upper limbs, and 19 age- and gender-matched healthy volunteers. Both structural and functional abnormalities were found in the patients' cerebellum and supplementary motor area. Relative to the healthy controls, the essential tremor patients' cerebellum exhibited less grey matter in lobule VIII and less effective connectivity between each cerebellar cortex and the ipsilateral dentate nucleus. The patient's supplementary motor area exhibited (i) more grey matter; (ii) a lower amplitude of low-frequency fluctuation of the blood oxygenation level-dependent signal; (iii) less effective connectivity between each supplementary motor area and the ipsilateral primary motor hand area, and (iv) a higher probability of connection between supplementary motor area fibres and the spinal cord. Structural and functional changes in the supplementary motor area, but not in the cerebellum, correlated with clinical severity. In addition, changes in the cerebellum and supplementary motor area were interrelated, as shown by a correlation between the lower amplitude of low-frequency fluctuation in the supplementary motor area and grey matter loss in the cerebellum. The structural and functional changes observed in the supplementary motor area might thus be a direct consequence of cerebellar defects: the supplementary motor area would attempt to reduce tremor in the motor output by reducing its communication with M1 hand areas and by directly modulating motor output via its corticospinal projections.
Introduction
Essential tremor is one of the most prevalent movement disorders. It is characterized by postural and action tremor preferentially involving the upper limbs. The pathophysiology of essential tremor is poorly understood. It has been suggested that the inferior olivary nucleus generates an abnormal rhythmic output that affects the synchronization of Purkinje cell firing (Hansel, 2009) and then propagates passively through the cerebello-thalamic tract (Colebatch et al., 1990; Boecker et al., 1996; Passamonti et al., 2012; Bhalsing et al., 2013), which tunes motor cortex activity (Molnar et al., 2005a, b; Popa et al., 2013). However, such a passive role of the cerebellum in tremor propagation was recently challenged, as abnormalities of Purkinje neurons might actually be a primary defect in essential tremor (Lin et al., 2014; Louis, 2014; Louis et al., 2014). Regardless of the olivary or cerebellar origin of tremor generation, abnormal rhythmic output travels from the dentate nucleus to M1 via the ventral intermediate nucleus of the thalamus (Middleton and Strick, 2000; Kelly and Strick, 2003). These regions constitute the oscillatory network, the activity of which is coherent with tremor during task execution (Deuschl et al., 2000; Hellwig et al., 2001; Schnitzler et al., 2009; Contarino et al., 2012; Raethjen and Deuschl, 2012; Neely et al., 2014).
Beside its projections to M1, the multiple cortical targets of the cerebellum include the secondary motor cortices (Akkal et al., 2007; Bostan et al., 2013). These secondary motor cortices, namely the medial premotor cortex (supplementary motor area, SMA), the lateral premotor cortex and the cingulate motor area, may also be involved in transmitting oscillatory activity to muscles, either through their corticospinal projections (Galea and Darian-Smith, 1994; Maier et al., 2002; Shimazu et al., 2004) or through their connections to M1 (Dum and Strick, 2005). Secondary motor cortices might therefore also be part of the oscillatory network. Accordingly, patients with essential tremor exhibit (i) abnormal SMA activation during the execution of motor tasks (Neely et al., 2014); and (ii) premotor activity coherent with the tremor frequency (Schnitzler et al., 2009). In a recent study, modulation of cerebellar output by non-invasive cerebellar stimulation repeated over several days was found to affect long-range connections between the cerebellum and both the primary motor cortex and secondary motor areas (Popa et al., 2013). However, the specific contribution of the SMA or lateral premotor cortex to the oscillatory network is unclear, as is the influence of abnormal cerebellar output on cortical motor processes.
Neuroimaging studies have shown structural (Quattrone et al., 2008; Benito-León et al., 2009; Cerasa et al., 2009; Bagepally et al., 2012) and task-related functional changes (Hellwig et al., 2001; Raethjen and Deuschl, 2012; Neely et al., 2014) in the oscillatory network of patients with essential tremor. Task-based functional studies have several limitations, however. In particular, the occurrence of tremor during voluntary movements may affect the activation of motor areas constituting the oscillatory network (Hellwig et al., 2001; Schnitzler et al., 2009; Raethjen and Deuschl, 2012; Neely et al., 2014), thereby preventing correct evaluation of the functional integrity of the motor system, owing to non-equivalent behaviour. Measurement of intrinsic resting-state functional connectivity allows motor system integrity to be investigated without confounding factors of task-related changes in the blood oxygenation level-dependent signal (Albert et al., 2009; Dayan and Cohen, 2011; Vahdat et al., 2011). Information is always circulating in brain networks, and functional connectivity is affected by structural defects, regardless of whether or not symptoms are present. Task-free recordings in patients with essential tremor indicate abnormal intraregional connectivity within the oscillatory network (Fang et al., 2013), but long-range inter-regional connectivity between the cerebellum and motor areas has not yet been investigated.
The aims of this study were: (i) to characterize structural and functional defects in the cerebellum and motor-related cortical areas of patients with essential tremor; and (ii) to investigate whether and how, changes in cortical motor areas relate to cerebellar impairment and tremor characteristics. We first used voxel-based morphometry and tractography to detect abnormalities in the structure and anatomical connectivity of the cerebello-dentato- thalamo-cortical (CDTC) network. Then, to determine whether the observed structural abnormalities were restricted to the CDTC network or also involved circuits responsible for propagating motor output, we also studied cortico-cortical and corticospinal projections. We also analysed the amplitude of low-frequency fluctuations (ALFF) at rest, as an indicator of spontaneous neural activity within these regions (Biswal et al., 1995; Wang et al., 2012; Di and Biswal, 2014; Zhou et al., 2014). Finally, we studied effective connectivity to characterize functional connections within the nodes of the CDTC and the cortico-cortical motor network. The links between these structural and functional changes were analysed, together with their relation with clinical tremor characteristics.
Materials and methods
Subjects
We studied 20 patients with essential tremor (seven females) and 20 healthy volunteers matched for age and gender (seven females). The diagnosis of essential tremor was based on the Movement Disorders Consensus Criteria (Deuschl et al., 1998). All the patients had prominent bilateral upper limb tremor, usually associated with discrete head and/or voice tremor (Table 1). None of the patients were taking benzodiazepine, antidepressant or antiepileptic medication. All participants gave their written informed consent. The study protocol was approved by the local ethics committee.
Table 1.
Characteristics of the patients
| Patient ID | Demographics |
Clinical score (FHM) |
Tremor recordings |
Beta-blocker therapy | |||||||||
|---|---|---|---|---|---|---|---|---|---|---|---|---|---|
| Wrist extension |
Bat-wing position |
||||||||||||
| Age | Disease duration | Part A | Part B | Part C | Total score | F | W | A | F | W | A | ||
| TE01 | 62 | 5 | 9 | 11 | 14 | 34 | 5.2 | 0.4 | 1.0 | 4.9 | 0.2 | −1.15 | Yes |
| TE02 | 39 | 18 | 15 | 8 | 7 | 30 | 6.2 | 0.4 | 0.2 | 7.2 | 0.6 | −1.30 | / |
| TE03 | 47 | 37 | 24 | 18 | 10 | 52 | 4.8 | 0.9 | 1.2 | 6.8 | 0.9 | −0.63 | / |
| TE04 | 65 | 35 | 25 | 18 | 23 | 66 | 5.1 | 05 | 1.7 | 4.5 | 0.5 | 0.90 | Yes |
| TE05 | 28 | 15 | 9 | 15 | 36 | 60 | 7.3 | 0.3 | −0.4 | 8.1 | 2.0 | −1.35 | Yes |
| TE06 | 60 | 48 | 6 | 9 | 21 | 36 | 6.2 | 0.3 | −0.6 | 6.7 | 0.5 | −1.15 | Yes |
| TE07 | 57 | 28 | 17 | 20 | 56 | 93 | 6.4 | 0.4 | 1.0 | 5.2 | 0.5 | 3.01 | Yes |
| TE08 | 72 | 18 | 15 | 32 | 15 | 62 | 5.3 | 0.4 | 3.0 | 5.1 | 0.2 | 2.44 | / |
| TE09 | 52 | 40 | 13 | 14 | 12 | 39 | 6.8 | 1.3 | −1.2 | 5.8 | 0.3 | 1.95 | / |
| TE10 | 33 | 14 | 33 | 13 | 6 | 52 | 6.1 | 1.2 | 0.4 | 6.5 | 1.5 | −0.22 | / |
| TE11 | 68 | 5 | 15 | 8 | 6 | 29 | 6.1 | 1.6 | −1.2 | 4.2 | 2.9 | −1.15 | / |
| TE12 | 70 | 4 | 6 | 12 | 3 | 21 | 6.2 | 1.3 | −0.1 | 5.4 | 0.2 | −0.55 | / |
| TE13 | 37 | 23 | 6 | 4 | 0 | 10 | 7.4 | 0.3 | −0.1 | 8.2 | 0.5 | −0.55 | / |
| TE14 | 41 | 25 | 6 | 4 | 5 | 15 | 7.0 | 0.8 | −0.2 | 7.8 | 0.7 | −1.40 | Yes |
| TE15 | 27 | 13 | 10 | 3 | 6 | 19 | 6.3 | 0.5 | −0.5 | 9.4 | 1.6 | −0.82 | / |
| TE16 | 57 | 6 | 13 | 20 | 15 | 48 | 5.9 | 0.4 | −1.1 | 4.0 | 0.2 | 0.07 | Yes |
| TE17 | 49 | 43 | 14 | 14 | 11 | 39 | 6.0 | 1.0 | −1.2 | 5.7 | 0.3 | −0.60 | Yes |
| TE18 | 30 | 23 | 4 | 7 | 8 | 19 | 8.3 | 0.7 | −0.9 | 8.1 | 0.4 | −1.70 | / |
| TE19 | 64 | 4 | 6 | 7 | 2 | 15 | 6.2 | 0.7 | 0.8 | 6.3 | 0.8 | −0.50 | / |
FHM = Fahn Tolosa Marin rating scale; F = peak tremor frequency; W = width of the power spectrum; A = area under the curve (see ‘Materials and methods’ section). Age and disease duration are in years.
Clinical examination and evaluation of essential tremor
Clinical assessment was performed by two movement disorders specialists (B.D. and C.H.) using the Fahn-Tolosa-Marin tremor rating scales (tremor severity: subscore A; specific writing/drawing tasks: subscore B; functional disability: subscore C). Electrophysiological quantification of tremor was performed with a triaxial accelerometer (PCB Piezotronics) taped to the first phalange of the index finger of the worst-affected hand, with the z-axis parallel to the axis of the hand and the y-axis perpendicular to the plane of the palm.
Accelerometer signals were recorded during two 30-s sessions of active wrist and finger extension and of ‘bat-wing’ position holding (i.e. with the indexes pointing at each other). The samples were anonymized and presented to an expert physicist (A.P.L.). Each recording was analysed in frequency space and characterized by the peak frequency (F), area (A), and width (w) of a Gaussian curve fitting the tremor peak of the power spectrum.
The values analysed for correlations were subscore B of the Fahn-Tolosa-Marin tremor rating scale (motor impairment), disease duration, and the three values quantifying tremor in wrist extension. We considered the wrist extension position because it was dominated by distal tremor and characterized hand tremor better than the bat-wing position, which was also influenced by proximal tremor. These measures were used to evaluate tremor severity and to seek correlations with MRI findings.
Neuroimaging experiments
Data acquisition
MRI data were collected on a Siemens 3 T MAGNETOM Trio equipped with a 12-channel head coil. We first acquired high-resolution T1-MPRAGE images (repetition time/echo time/flip angle = 6.2 s/3 ms/9°, 1-mm3 isotropic voxel size, field of view = 256 × 256 × 176 mm3, 144 sagittal images). Diffusion-weighted data were acquired using echo planar high-angular-resolution diffusion images (repetition time/echo time/flip angle = 12 s/87 ms/90°, b value = 1500 s/mm2, 50 directions) from 60 interleaved axial slices with a 2-mm mm3 isotropic voxel size (field of view = 256 × 256 mm2). Resting-state functional images were acquired by T2*-weighted fast echo planar imaging (repetition time/echo time/flip angle = 3.3 s/30 ms/90°, voxel size = 1.5 × 1.5 × 2.5 mm3, 200 volumes acquired per subject) from 46 interleaved axial slices. The resting-state functional MRI experiment consisted of a 10-min run in which participants were asked to relax with their eyes closed, without falling asleep. A field map was acquired to correct for echo planar image distortions induced by each subject’s individual magnetic susceptibilities.
Data analysis and statistics
We first looked for structural differences between the patients and controls in grey matter and diffusion properties by using voxel-based analyses [voxel-based morphometry (VBM), and voxel-based diffusion tensor analysis], both in the whole brain and in specific regions of interest. Regions of interest were selected along the CDTC network, including the cerebellum and cerebellar peduncles (Nicoletti et al., 2010; Paris-Robidas et al., 2012), the dentate nucleus, the thalamus (the ventral intermediate and ventro-lateral nuclei connected with the cerebellum and the motor cortex), and the secondary and primary motor cortices. We then examined differences in anatomical and functional connectivity between regions that showed significant structural differences by using voxel-based and region of interest analysis within the CDTC network. Finally, we sought correlations between structural and functional differences on the one hand and between structural/functional differences, and both clinical and electrophysiological variables on the other hand.
Regions of interest
We used atlases in the MNI space to define regions of interest containing all the regions of the CDTC loop involved in motor functions, except the thalamic nuclei. For the VBM and the ALFF analyses, the masks of the bilateral cortical motor regions (precentral gyri, and SMA the bilateral dentate and bilateral cerebellar lobules VI and VIII) were extracted from wfupickatlas (http://fmri.wfubmc.edu/software/PickAtlas). For the DCM and the tractography analyses, we specifically considered the hand areas of the primary motor cortex as defined in the Neurosynth atlas (http://neurosynth.org/; Yarkoni et al., 2011), and the hand area of the SMA localized in the anterior part of SMA proper (Nachev et al., 2008). For the tractography analysis, the regions extracted from the wfupickatlas (cerebellar lobules VI and VII, and dentate) and the Neurosynth atlases (hand area in M1 and anterior SMA proper) were denormalized from the MNI space to the individual space using the inverse transformation obtained from the VBM8 toolbox.
To define regions of interest in the thalamic nuclei, we considered the YEB atlas for subcortical structures (Yelnik et al., 2007), with which the ventro-lateral (VL) and ventral intermediate (VIM) thalamic nuclei were automatically registered on the individual space of each participant’s T1 image. For the resting state analysis, thalamic nuclei were normalized in the MNI space using the transformation obtained from the VBM8 toolbox. To consider the equivalent regions of interest in the two groups throughout the resting state analysis, the final ventro-lateral and ventral intermediate regions were calculated as the voxels in MNI space considered in the regions of interest that were present in at least 50% of the total population.
The superior cerebellar peduncles were manually segmented on the individual fractional anisotropy color map of each participant. These regions of interest were used as way-point to reconstruct the tract connecting the dentate to the contralateral thalamus in the tractography analysis. The volume of the cerebellar peduncle regions of interest was calculated for each participant. We looked at possible group difference of volume of the cerebellar peduncle region of interest performing a two sample t-test (threshold of significance at P < 0.05).
Voxel-based morphometry
Images were processed with the VBM8 toolbox (http://dbm.neuro.uni-jena.de/vbm/), of SPM8 software (http://www.fil.ion.ucl.ac.uk/spm/) running under MATLAB R2010b (The MathWorks, Inc.). Normalized and modulated grey and white matter probability maps were obtained from T1-weighted images. Processing included denoising (Manjón et al., 2010), partial volume estimation (Tohka et al., 2004) and normalization to the Montreal Neurological Institute (MNI) space using Dartel toolbox (Ashburner and Friston, 2005). The normalized maps were smoothed with a 10-mm filter width at half-maximum Gaussian kernel.
The individual smoothed-normalized grey matter maps were included in a two-sample t-test for group comparison. Age and gender were incorporated in the design matrix to remove the variance percentage related to variables of non-interest that could interfere with group differences. Individual values of total intracranial volume were considered in the group model in the ‘global calculation’ option in the designation of the two-sample t-test in SPM8 to allow dealing with brain of different sizes. Results were considered significant at P < 0.05, with family-wise error correction (FWE) for multiple comparisons. Regression analysis was performed at the group level to test whether VBM individual measures within the whole brain (grey matter values) correlated with clinical scores (total subscore B, disease duration) and with tremor frequency and amplitude of the frequency peak recorded offline. Correlations were plotted and Pearson's or Spearman's correlation coefficient was calculated, depending on the normality of data distribution (considered significant at P < 0.05, corrected for multiple comparisons). We also sought correlations between individual VBM measures in the cerebellum and in the cortical motor areas. Age and gender were incorporated in the design matrix of the regression analysis to remove the variance percentage related to variables of non-interest that could interfere with the correlation.
Tractography analysis
Fibre-tracking maps were created for each subject by using the FMRIB software library for data preprocessing and MRtrix software to process diffusion images (Supplementary material) (Tournier et al., 2007). Using a voxel-wise model of diffusion (the Q-ball model), the maximum-likelihood solution for fibre orientation within each voxel was represented in the form of an orientation distribution function on the location of the fibre trajectory. The orientation distribution function characterizes the orientation dependency of the diffusion probability density function of water molecules in several possible directions for each voxel. This model can be used to track complex fibre configurations such as crossings. Tracts were reconstructed from the orientation distribution function by using the regions of interest included in the VBM and resting-state analysis, registered in the native individual space (Supplementary material). We calculated the mean fractional anisotropy within each tract, independently in each hemisphere, as described in detail in the Supplementary material.
Resting-state functional MRI analyses
Statistical parametric mapping software (SPM8, Wellcome Department of Cognitive Neurology, London, UK) was used for image processing (http://www.fil.ion.ucl.ac.uk/spm/). The functional images were interpolated in time to correct for phase advance during volume acquisition, and were realigned with the first image of each session. The anatomical image and the realigned functional images of each subject were normalized to a common standard space by using the MNI template. The functional data were spatially smoothed with an 8-mm filter width at half-maximum Gaussian filter and temporally filtered with a 128-s period high-pass filter.
Amplitude of low frequency fluctuations
We modelled the ALFF by using the procedures described in (Di and Biswal, 2014) (see Supplementary material for details). A global linear model was defined for each subject, and the contrast of interest was defined as the effect of the variance of the ALFF fluctuations in each subject. The resulting contrast maps were included in a two-sample t-test to identify the regions of the CDTC loop (see ‘Regions of interest’ section) in which ALFF variance was significantly different between the patients and the healthy volunteers.
Multiple regression analyses were used to identify correlations between the whole-brain ALFF and clinical scores, cerebellar VBM changes, tremor frequency and amplitude of the frequency peak recorded offline (significance at P < 0.05, FWE-corrected for multiple comparisons).
Effective connectivity using dynamic causal modeling
Effective connectivity analysis used dynamic causal modelling (DCM) with the DCM10 routine implemented in SPM8. The first eigenvectors were extracted from the same regions of interest of the CDTC network as for VBM analysis (see ‘Regions of interest’ section). The a priori models were based on anatomical connections, considering the thalamus as a relay between the cerebellum and cortex. Intrinsic connectivity was defined as the endogenous connectivity parameter without driving input (Di and Biswal, 2014). The intrinsic connectivity values obtained for each subject in the best model were considered for group analysis.
The thalamus was considered as the relay between the cerebellum and the cortical motor systems. Thus, we defined two types of models: the cerebello-thalamic model and the thalamo-cortical model. Each type of model included simple (unilateral) and complex (bilateral) connections (Supplementary Fig. 1). Bayesian model selection (BMS) (Stephan et al., 2009, 2010) was used to determine the best model between simple and complex connections. Expected posterior model probabilities and exceedance probabilities were computed. The group analysis on the DCM parameters included only the model of each family (cerebello-thalamic or thalamo-corticals) that best fitted the data.
Within each group, one sample t-tests were conducted to examine whether the parameters of the model that best fitted the data have significantly non-zero values. Two-sample t-tests were used to identify group differences in intrinsic connectivity.
Results
Results for one patient were withdrawn from the analysis because of MRI artefacts, and one healthy volunteer was excluded because of excessive head movement during MRI. Thus, 19 patients with essential tremor (seven females; 50.4 ± 15 years) and 19 healthy volunteers matched for age and gender (seven females; 50.1 ± 16.4 years) were included in the analyses. All the patients had bilateral upper limb tremor (see Table 1 for clinical details). The tremor predominated in the left hand in eight patients and the right hand in seven patients, and was symmetrical in four patients. The age of patients at the disease onset correlated with the tremor frequency measured both under wrist extension (r = − 0.58, P = 0.009) and in bat-wing position (r = −0.84, P = 0.0001): older patients had lower tremor frequency. This was found in previous studies (Elble et al., 2000; Hellwig et al., 2009). However, disease duration did not correlate with tremor frequency (wrist extension: P = 0.96; bat-wing position: P = 0.63).
Voxel-based morphometry
Results and statistical analyses are shown in Fig. 1A and Table 2. Compared to the healthy volunteers, the whole-brain analysis showed that essential tremor patients had a bilateral decrease in the grey matter volume of cerebellar lobules IV/V and VIII. In the reverse contrast, the patients exhibited a bilateral increase in grey matter volume in the SMA proper, predominating in the right hemisphere. There was only a tendency for an increase of grey matter volume in M1 hand area (M1 left: t = 2.03, P = 0.07; M1 right: t = 1.97, P = 0.08).
Figure 1.

Group differences in VBM and correlation with clinical scores and tremor severity. (A) Statistical parametric maps of the comparison between patients and healthy volunteers, showing (clusters are significant at P < 0.05, corrected for multiple comparisons) decreased grey matter (GM) volume in the cerebellum (blue) and increased grey matter volume in both SMAs (yellow). Lob = cerebellar lobule. (B) Multiple regression showing the correlations between grey matter volume in the cerebellum and grey matter volume in the contralateral SMA proper of essential tremor patients. (C) Multiple regression showing that grey matter volume correlated with disease duration, clinical scores and tremor characteristics. Disease duration correlated positively with grey matter volume in the preSMA; tremor frequency correlated positively with grey matter volume in the bilateral vermis VIII but negatively with grey matter volume in both SMAs proper; subscore B correlated positively with grey matter volume in both SMAs proper. The cerebral parameters (individual values) showing the correlations with clinical parameters were calculated voxel-by-voxel in the regions of interest of CDTC: the cerebellum, dentate, thalamus and cortical motor areas.
Table 2.
| Anatomical location of the cluster | Hemisphere | Brodmann area / cerebellar lobule | MNI coordinates of global maxima |
Cluster volume | T-value | ||
|---|---|---|---|---|---|---|---|
| x | y | z | |||||
| GM: ET<HV | |||||||
| Cerebellum | R | Lobule IV, V | 21 | −28 | −24 | 63 | 4.83 |
| L | Lobule VIII | −27 | −48 | −56 | 797 | 4.34 | |
| GM: ET>HV | |||||||
| SMA | Bilateral | Medial BA 6 | 10 | 3 | 54 | 233 | 5.10 |
| −10 | −1 | 60 | 3.87 | ||||
| Multiple regression GM in patients | |||||||
| Negative correlation with GM in left cerebellum | |||||||
| SMA proper | R | Medial BA 6 | 10 | −20 | 57 | 194 | 3.70 |
| Negative correlation with GM in right cerebellum | |||||||
| SMA proper | L | Medial BA 6 | −10 | −12 | 48 | 36 | 3.38 |
| Positive correlation with disease duration | |||||||
| preSMA/SMA proper | R/bilateral | 8 | 11 | 75 | 1150 | 3.76 | |
| Positive correlation with tremor frequency | |||||||
| Cerebellar vermis | Bilateral | VIII | 2 | −63 | −39 | 967 | 3.80 |
| Negative correlation with tremor frequency | |||||||
| SMA proper | R | 15 | −1 | 57 | 1653 | 6.10 | |
| L | −18 | 0 | 66 | 407 | 3.12 | ||
| ALFF: ET<HV | |||||||
| SMA | R | BA 6 | 10 | 10 | 58 | 2557 | 4.09 |
| L | −10 | 16 | 58 | 3.91 | |||
| Multiple regression ALFF in essential tremor | |||||||
| Negative correlation with total B score | |||||||
| Precentral gyrus | R | BA 4,6 | 32 | −20 | 72 | 2853 | 4.84 |
| L | −36 | −12 | 51 | 2176 | 4.68 | ||
| SMA | Bilateral | BA 6 | 0 | −2 | 60 | 1288 | 4.20 |
| Positive correlation with cerebellar GM | |||||||
| Precentral gyrus | L | BA 4,6 | −32 | −16 | 70 | 93 | 3.09 |
| R | 36 | −26 | 68 | 43 | 3.04 | ||
| SMA | Bilateral | BA 6 | 2 | 2 | 60 | 34 | 2.94 |
| Positive correlation with tremor frequency | |||||||
| Precentral gyrus | R | BA 4,6 | 36 | −12 | 57 | 1085 | 4.09 |
| L | −30 | −20 | 48 | 692 | 3.06 | ||
| SMA | Bilateral | BA 6 | 3 | −3 | 50 | 973 | 3.59 |
GM = grey matter; R = right; L = left; BA = Brodmann area; ET = essential tremor patients; HV = healthy volunteers. Global maxima without cluster volume are included in the cluster above.
Grey matter volume in the SMA proper correlated negatively with cerebellar grey matter atrophy in the contralateral cerebellum (SMA properright cerebellumleft: Rho = −0.71, P = 0.008; SMA properleft cerebellumright: Rho = −0.54, P = 0.01; Fig. 1B). Thus, higher grey matter volume in right SMA proper was associated with lower grey matter volume in the left cerebellum. Grey matter volumes in the SMA proper did not correlate with grey matter atrophy in the ipsilateral cerebellum (SMA properleft cerebellumleft: Rho = −0.11, P = 0.65; SMA properright cerebellumright: Rho = −0.15, P = 0.54).
Grey matter volume in the left and right SMA proper correlated positively with Fahn-Tolosa-Marin subscore B (SMA properright: Rho = 0.52, P = 0.02; SMA properleft: Rho = 0.59, P = 0.009) (Fig. 1C). Grey matter volume in the SMA properright correlated negatively with tremor frequency (Rho = −0.63, P = 0.004) (Fig. 1C) while grey matter volume in the cerebellar vermis VIII correlated positively with tremor frequency (Rho = 0.53, P = 0.01) (Fig. 1C). Grey matter volume in the preSMAright correlated positively with disease duration (Rho = 0.54, P = 0.01)
Diffusion imaging
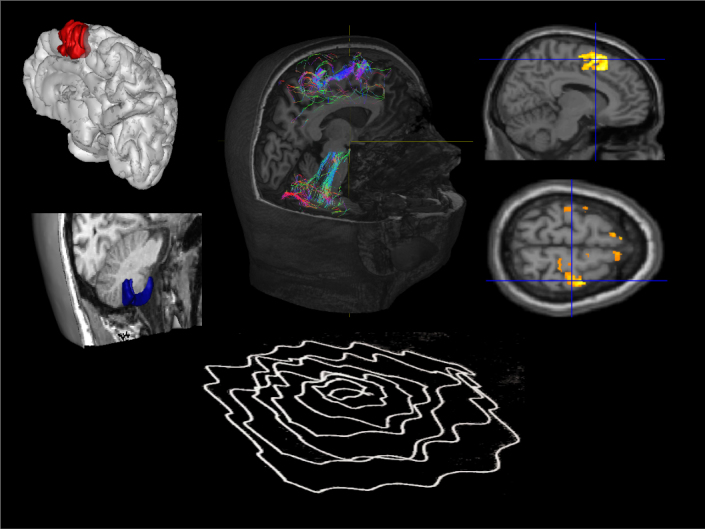
Only the corticospinal tract originating from the SMA properright showed a higher mean fractional anisotropy in the patients than in the controls (t = 2.99, P = 0.0078; green histogram in Fig. 2). In the following section we refer to this result as reflecting a higher probability of connection, because mean fractional anisotropy values in the corticospinal tract were weighted by the probability of connection (see Supplementary material for details). There were no group effects in mean fractional anisotropy values for any of the tracts along the CDTC network (Supplementary material and Supplementary Fig. 1), including the tracts connecting the thalamus to the cortex, the intracortical tract connecting the SMA proper and the M1 hand area (0.45 < P < 0.72; Fig. 2), and the corticospinal tract originating from the M1 hand area (0.12 < P < 0.34; Fig. 2).
Figure 2.

Group differences in cortico-cortical and corticospinal tracts. (A) Regions of interest, and tractographic reconstructions of the cortico-cortical (blue) and cortico-spinal (red and green) tracts. Regions of interest are superimposed on the anatomical image of a representative subject. Regions of interest include the cortical representation of the hand area in M1 (red), the anterior part of the SMA proper containing the hand area (green), the ventro-lateral nucleus of the thalamus (dark yellow), and the internal capsule (bright yellow). Individual tracts (red: M1 tracts, green: SMA tracts, blue: cortico-cortical tract between M1 and the anterior SMA proper) are superimposed on a fractional anisotropy (FA) image of a representative subject. (B) The histograms show the group results for the mean fractional anisotropy on cortico-cortical tracts (blue) and the mean fractional anisotropy weighted by the probability of connection on the long tracts (red and green). The asterisks indicate significant group differences at P < 0.05. Note that only the mean weighted fractional anisotropy on the corticospinal tract (CST) originating in the anterior SMA proper (Ant SMA proper) in the right hemisphere showed such a difference. In the histograms, light colours represent patients and dark colours healthy volunteers.
Resting-state functional MRI
Amplitude of low-frequency fluctuations
ALFF group analysis showed that the patients had a lower bilateral ALFF in the SMA proper (Fig. 3A), whereas no difference was found in the M1 hand area or the lateral premotor cortex of the bilateral precentral gyri, or in any other region of interest of the CDTC network.
Figure 3.

Group differences in ALFF and correlation with clinical scores. (A) Statistical parametric maps showing the decrease in ALFF in both SMAs of the essential tremor patients (ET) as compared with the healthy volunteers (HV) (clusters are significant at P < 0.05, corrected for multiple comparisons). (B) Multiple regression showing the correlation between the SMA ALFF and cerebellar grey matter atrophy in the opposite hemisphere (P < 0.05, FWE correction). (C) Multiple regression showing that ALFF in the SMA and precentral gyrus correlated with disease duration (red), clinical scores (green) and tremor characteristics (yellow). Clusters are superimposed on the SPM canonical brain. Plots show the correlation between the global maximum in both SMAs and in the right precentral gyrus (PreC) (see Table 2 for statistical details and MNI coordinates). The cerebral parameters (individual values) showing the correlations with clinical parameters were calculated voxel-by-voxel in the regions of interest of cerebellar- motor circuit: the cerebellum, dentate, thalamus and cortical motor areas.
ALFF in both SMAs proper and the precentral gyri (including the M1 hand area) correlated (i) negatively with tremor severity, as assessed by part B of the tremor score on the Fahn-Tolosa-Marin scale; (ii) positively with tremor frequency; and (iii) positively with cerebellar grey matter loss (Fig. 3B and C). ALFF in the precentral gyri and in the preSMAright, correlated positively with disease duration (Fig. 3C).
In both SMAs proper, ALFF correlated with grey matter volume: the higher the grey matter volume, the lower the ALFF (Supplementary material and Supplementary Fig. 3).
Effective connectivity
Effective connectivity values were evaluated for each segment of the CDTC network, including intracortical connections between secondary and primary motor areas; corticospinal connections were not included because the acquisition of resting state data did not allow having relevant blood oxygenation level-dependent signal in the spinal cord. In the two-sample t-test of effective connectivity values in the best DCM models, the patients exhibited a bilateral decrease in positive drive between the SMA and the ipsilateral M1 hand area, and a bilateral decrease in negative drive from cerebellar lobule VIII to the ipsilateral dentate nucleus (Fig. 4). No difference was found between the patients and controls regarding connections from cerebellar lobule VI to the ipsilateral dentate nucleus, or from the dentate to the contralateral ventral intermediate nuclei.
Figure 4.

Results of DCM analysis. (A) Template of cortical motor, thalamic and cerebellar regions involved, a priori, in the CDTC loop and considered in the DCM model definition. (B) Structure of the DCM models including the thalamo-cortical models (top) and the cerebello-thalamic models (bottom). Only the winning models of the thalamo-cortical (left and right hemispheres) and cerebello-thalamic models are represented, with the group averaged endogenous connectivity parameters (red = patients; blue = healthy volunteers). Thick arrows represent significant group differences in the average strength of connectivity (*P < 0.05, corrected for multiple comparisons).
Discussion
This study highlights the contribution of the SMA to essential tremor and provides new information on how cerebellar defects affect the structure and function of cortical secondary motor areas. As expected, the essential tremor patients exhibited bilateral structural changes in the cerebellum (lobules IV/V and VIII). Structural and functional changes were also observed in the SMA proper, and the extent of these changes correlated with offline measures of tremor severity and the degree of cerebellar atrophy. Functional activity in the primary motor cortex and preSMA areas correlated with disease duration. Furthermore, the connection probability of the corticospinal tract originating from the SMA proper was higher in the patients than in the healthy controls.
The patients with essential tremor exhibited cerebellar atrophy, as revealed by lower grey matter volumes in cerebellar lobules IV/V and VIII. This confirms the results of previous VBM studies (Quattrone et al., 2008; Benito-León et al., 2009; Cerasa et al., 2009; Bagepally et al., 2012), although the latter showed loss of grey matter in different parts of the cerebellum, possibly because of differences in the patient populations, magnetic field strength, or data analysis. We identified the precise cerebellar regions involved in sensorimotor function (Schmahmann et al., 1999) rather than using large cerebellar regions of interest. This was facilitated by the use of high-field (3 T) MRI and the enrolment of a homogenous patient population. The observed reduction in negative drive from the cerebellar cortex to the dentate nucleus highlights the functional significance of the structural changes in the cerebellar cortex. Based on post-mortem analysis, structural changes in the cerebellar cortex of patients with essential tremor have been described (Lin et al., 2014; Louis et al., 2014) yet the question arises whether they have slowly developed secondary to the tremor (Lee et al., 2014) or reflect a primary damage. Is the relatively low percentage of 15% of Purkinje cell loss found in the cerebellar cortex of essential tremor patients (Louis et al., 2013) sufficient to lead to the changes in functional connectivity between the cerebellar hemisphere and the dentate, as observed in our study? In many diseases, functional connectivity changes are observed after large neuronal loss. For instance abnormal functional connectivity between the basal ganglia and the cortex was observed in Parkinson’s disease, in subjects already presenting 60–80% of loss of dopaminergic neurons in the substantia nigra (Fearnley and Lees, 1990). However, other diseases that do not present gross brain volume reduction also present functional connectivity changes. In Tourette’s syndrome that may be a developmental disease with little neuronal loss in specific brain regions [27% loss of neurons in the caudate in Kalanithi et al. (2005)], abnormal caudate connection to the cortex was observed (Worbe et al., 2010). To our knowledge, there is no general rule so far linking a giving neuronal loss to a particular change in connectivity. Not only the type of cells that degenerate matters, but also the synaptic weight of their connections. Purkinje cells have a large number of dendrites and dendritic spines and receive powerful excitatory inputs from the climbing fibres. In addition, Purkinje cells constitute the sole output to deep cerebellar nuclei of all motor input in the cerebellar cortex. Thus, it is conceivable that a small loss of Purkinje cell not seen using tractography methods can induce drastic changes of functional connectivity.
Atrophy of the cerebellar hemispheres did not correlate with tremor scores or amplitude of the frequency peak, as it would be expected if cerebellar atrophy was secondary to a long history of tremor. Lower grey matter volume in vermis VIII was associated with a lower tremor frequency. Thus, it is likely that this part of the cerebellar vermis and its long-range looping connections with the thalamus and the SMA proper (Coffman et al., 2011) play a role in determining tremor frequency. That the cerebellar vermis contributes to set the tremor frequency is compatible with the correlation found between tremor frequency and age of the patients or age at onset (Elble et al., 1994; Elble, 2000), as cerebellar vermis volume declines with age following a logarithmic regression curve (Bernard et al., 2015). While modulation of tremor amplitude is made possible by using thalamic deep brain stimulation (depending then on the tremor phase at which stimulation was applied) (Cagnan et al., 2014) or by using repeated sessions of repetitive transcranial magnetic stimulation (rTMS) over the cerebellar lobules VIII (Popa et al., 2013), tremor frequency is hardly influenced by deep brain stimulation or rTMS. Such a steadiness and the narrow frequency tolerance profile of essential tremor tremor have led to the view of multiple oscillators coupled by a strong unique driving oscillator center (Brittain et al., 2015). The existence of both an oscillator in the cerebellum responsible for the tremor frequency and driving downstream oscillators in the cortex is supported by the following findings: (i) the positive and negative correlations between the tremor frequency and grey matter volumes of the cerebellar vermis and SMA, respectively; and (ii) the negative correlation between SMA and cerebellum grey matter volumes. Further studies will have to implement longitudinal paradigm to link the evolution of tremor frequency with variation of functional and anatomical properties of the CDTC network.
This study reveals the existence of structural and functional changes in the SMA proper of patients with essential tremor, and their close relationship with tremor severity. Previously, only indirect results had suggested functional involvement of the secondary motor cortices (including the lateral premotor cortex and SMA) in tremor. Probabilistic tractography had shown that thalamic voxels exhibiting a high probability of connection with the lateral premotor cortex co-localized with the electrode site that most efficiently suppressed symptoms during deep brain stimulation (Pouratian et al., 2011). Likewise, increased local-regional homogeneity of blood oxygenation level-dependent signals in the left SMA had been found on resting-state functional MRI (Fang et al., 2013). Finally, in parkinsonian tremor, it had been suggested that the SMA might play a role in desynchronizing tremor-related oscillations transmitted by the primary sensorimotor cortex (Shibasaki, 2012).
Structural changes observed here in the SMA proper were associated with a reduction in blood oxygenation level-dependent signal fluctuations in the same area. ALFF reflects local spontaneous neuronal activity and thereby provides information on low-frequency blood oxygenation level-dependent signal fluctuations (Zhou et al., 2010, 2014; Li et al., 2014). The reduced ALFF in the SMA proper correlated with the observed increase in SMA grey matter volume, while no relationship between structural and functional changes was observed in M1 or the cerebellum. The precise neuronal correlates of ALFF/blood oxygenation level-dependent signal and their relationship with grey matter volume are not known. The ALFF signal may correlate, modestly, with brain perfusion, as assessed by arterial spin labelling techniques in healthy volunteers (Zou et al., 2009). Age has also been linked to ALFF and grey matter volume in some brain regions (Filippini et al., 2009; Maillet and Rajah, 2013; Ide et al., 2014). Here, we introduced age as a nuisance variable, making all the results independent of an age effect.
While structural and functional changes of the SMA proper correlated with tremor severity and frequency (larger SMA grey matter volume correlated with lower ALFF, higher B subscores of the FTM scale, and lower tremor frequency peak) yet not with disease duration, different association patterns between structural and functional changes and clinical features were observed in the preSMA, the cerebellum and the precentral gyri regions. It highlights the different pathophysiological roles played by these regions in essential tremor. In the preSMA and precentral gyri there was no structural changes or change in the ALFF yet higher ALFF were associated with longer disease duration. In addition, structural changes in the SMA and cerebellum varied in opposite directions, as shown by the correlation between atrophy of cerebellar lobule VIII and increased SMA proper grey matter volume. Cerebellum grey matter volume decrease was not accompanied by any change in ALFF and did not correlate with clinical features or disease duration. It suggests that cerebellar structural changes are more likely part of the primary disorder than secondary to tremor. They might begin long before symptoms onset, and functional compensatory mechanisms in the primary and secondary motor cortices might develop during this asymptomatic period. Accordingly neuronal activity, as assessed by ALFF, in the preSMA and precentral gyri increases with disease duration. When the compensatory mechanisms are overwhelmed, oscillatory activity is transmitted through the primary motor cortices to the corticospinal pathways and clinical manifestations would emerge. SMA proper opposes the enhanced motor drive by structural and functional changes. The SMA is a good candidate for exerting this compensatory effect. First, secondary motor areas have more integrative properties than M1 (Rizzolatti and Luppino, 2001; Nachev et al., 2008), and would play a more active role than simply mediating tremor oscillations. Second, the SMA plays a particular role in controlling fine hand movements (Brinkman and Porter, 1983; Gallea et al., 2008; Chen et al., 2013; Entakli et al., 2014).
Despite technical limitations (see below), the tractography findings suggest that the SMA proper might bypass M1 to reduce propagation of the oscillations (i) by a decreased drive to the motor cortex; and (ii) by an increased drive to the spinal cord. We have shown that during resting conditions, the connection between SMA and M1 is downregulated in patients with essential tremor. It may reflect a tentative compensation for the enhanced functional connectivity between the SMA and M1 that has been described in other studies during movement-related facilitation (Czarnecki et al., 2011; Neely et al., 2014). The SMA changes may also play a role in desynchronizing tremor-related oscillation transmitted by the primary sensorimotor cortex during tremor (Shibasaki, 2012). Second we also found that the drive from the SMA proper to the spinal cord was reinforced in the essential tremor patients, which might be a sign of direct corticospinal control. Recent studies suggest that the SMA proper plays an important role in fine-tuning motor output during the execution of precise hand movements through its direct corticospinal projections (Chen et al., 2013; Entakli et al., 2014). Recruitment of this pathway could contribute to counteracting tremor during hand movement.
Some limitations and uncertainties need to be mentioned. First, we cannot completely rule out the scenario of the structural and functional changes in the SMA preceding the cerebellar changes. Indeed, the SMA and cerebellar lobule VIII are interconnected and influence one another (Ghez and Thach, 2000; Coffman et al., 2011). However, it is difficult to see how an increase in grey matter volume in the SMA could cause cerebellar atrophy. Second, the lack of significant structural or functional changes in the primary motor cortex contrasts with the obvious changes seen in the SMA. The absence of structural change in the primary motor cortex was already reported in essential tremor (Cerasa et al., 2014), possibly due to the sample size. Here, we report only a tendency of abnormal grey matter volume in M1 hand area. Functional local inhomogeneity was found in the primary motor cortex of essential tremor at rest (Fang et al., 2013), but we did not replicate this finding while studying the amplitude of low frequency fluctuations. A possible explanation is that the primary motor cortex passively propagates the oscillations via the corticospinal tract. Alternatively, the premotor cortex may be more amenable to neuroplastic change than the primary motor cortex, and thus more influenced by the consequence of cerebellar output dysfunctions. Third, the corticospinal tract originating from SMA had a smaller representation on the internal capsule than the corticospinal tract originating from M1. As a consequence, the mean fractional anisotropy on SMA territory of the internal capsule had a smaller standard deviation than the than the one of M1, a possible explanation for significant increase of grey matter volume in the SMA and only a trend for M1 hand area.
Overall, this study identifies how structural changes in the cerebellum influence the cortical motor system, as the intrinsic signature of essential tremor. We propose that the structural and functional changes observed in the SMA reflect compensatory phenomena to a primary damage in the cerebellar cortex.
Supplementary Material
Acknowledgements
The authors thank the patient association Association des Personnes concernées par le Tremblement Essentiel (APTES) for their participation and help. We also thank the Center for Clinical Investigations (CIC, Pitié Neurosciences 1422, Hôpital de la Pitié-Salpêtrière, Paris, France) and the platform ‘Gait, Equilibrium, Posture, Movement, TMS and Navigated Brain Stimulation’ of the CENIR (Institut du Cerveau et de la Moëlle Epinière, Paris, France) for their invaluable support with the recordings.
Funding
This work received financial support from Fondation pour la Recherche Médicale (programme ‘Espoir de la recherche’, ‘Postdoctorat en France’ grant attributed to C.G.), Association des Personnes concernées par le Tremblement Essentiel (APTES), Fondation Motrice, Lilly Institute, Groupama, Contrats d’interface INSERM/APHP (S.M.) and interface CNRS/APHP (E.R.), Investissements d’avenir ANR-10-IAIHU-06 (Paris Institute of Neurosciences – IHU), and IFR49 Institut d’Imagerie Neurofonctionnelle.
Glossary
Abbreviation
- ALFF
amplitude of low-frequency fluctuation
- CDTC
cerebello-dentato-thalamo-cortical
- MI
primary motor cortex
- SMA
supplementary motor area
- VBM
voxel-based morphometry
Supplementary material
Supplementary material is available at Brain online.
References
- Akkal D, Dum RP, Strick PL. Supplementary motor area and presupplementary motor area: targets of basal ganglia and cerebellar output. J Neurosci 2007; 27: 10659–73. [DOI] [PMC free article] [PubMed] [Google Scholar]
- Albert NB, Robertson EM, Miall RC. The resting human brain and motor learning. Curr Biol 2009; 19: 1023–7. [DOI] [PMC free article] [PubMed] [Google Scholar]
- Ashburner J, Friston KJ. Unified segmentation. Neuroimage 2005; 26: 839–51. [DOI] [PubMed] [Google Scholar]
- Bagepally BS, Bhatt MD, Chandran V, Saini J, Bharath RD, Vasudev MK, et al. Decrease in cerebral and cerebellar gray matter in essential tremor: a voxel-based morphometric analysis under 3T MRI. J Neuroimaging 2012; 22: 275–8. [DOI] [PubMed] [Google Scholar]
- Benito-León J, Alvarez-Linera J, Hernández-Tamames JA, Alonso-Navarro H, Jiménez-Jiménez FJ, Louis ED. Brain structural changes in essential tremor: voxel-based morphometry at 3-Tesla. J Neurol Sci 2009; 287: 138–42. [DOI] [PubMed] [Google Scholar]
- Bernard JA1, Leopold DR, Calhoun VD, Mittal VA. Regional cerebellar volume and cognitive function from adolescence to late middle age. Hum Brain Mapp 2015; 36: 1102–20. [DOI] [PMC free article] [PubMed] [Google Scholar]
- Bhalsing KS, Saini J, Pal PK. Understanding the pathophysiology of essential tremor through advanced neuroimaging: a review. J Neurol Sci 2013; 335: 9–13. [DOI] [PubMed] [Google Scholar]
- Biswal B, Yetkin FZ, Haughton VM, Hyde JS. Functional connectivity in the motor cortex of resting human brain using echo-planar MRI. Magn Reson Med 1995; 34: 537–41. [DOI] [PubMed] [Google Scholar]
- Boecker H, Wills AJ, Ceballos-Baumann A, Samuel M, Thompson PD, Findley LJ, et al. The effect of ethanol on alcohol-responsive essential tremor: a positron emission tomography study. Ann Neurol 1996; 39: 650–8. [DOI] [PubMed] [Google Scholar]
- Bostan AC, Dum RP, Strick PL. Cerebellar networks with the cerebral cortex and basal ganglia. Trends Cogn Sci 2013; 17: 241–54. [DOI] [PMC free article] [PubMed] [Google Scholar]
- Brinkman C, Porter R. Supplementary motor area and premotor area of monkey cerebral cortex: functional organization and activities of single neurons during performance of a learned movement. Adv Neurol 1983; 39: 393–420. [PubMed] [Google Scholar]
- Brittain JS, Cagnan H, Mehta AR, Saifee TA, Edwards MJ, Brown P. Distinguishing the central drive to tremor in Parkinson's disease and essential tremor. J Neurosci 2015; 35: 795–806. [DOI] [PMC free article] [PubMed] [Google Scholar]
- Cagnan H, Little S, Foltynie T, Limousin P, Zrinzo L, Hariz M, et al. The nature of tremor circuits in parkinsonian and essential tremor. Brain 2014; 137: 3223–34. [DOI] [PMC free article] [PubMed] [Google Scholar]
- Cerasa A, Messina D, Nicoletti G, Novellino F, Lanza P, Condino F, et al. Cerebellar atrophy in essential tremor using an automated segmentation method. Am J Neuroradiol 2009; 30: 1240–3. [DOI] [PMC free article] [PubMed] [Google Scholar]
- Cerasa A, Nisticò R, Salsone M, Bono F, Salvino D, Morelli M, et al. Neuroanatomical correlates of dystonic tremor: a cross-sectional study. Parkinsonism Relat Disord 2014; 20: 314–17. [DOI] [PubMed] [Google Scholar]
- Chen S, Entakli J, Bonnard M, Berton E, De Graaf JB. Functional corticospinal projections from human supplementary motor area revealed by corticomuscular coherence during precise grip force control. PloS One 2013; 8: e60291. [DOI] [PMC free article] [PubMed] [Google Scholar]
- Coffman KA, Dum RP, Strick PL. Cerebellar vermis is a target of projections from the motor areas in the cerebral cortex. Proc Natl Acad Sci USA 2011; 108: 16068–73. [DOI] [PMC free article] [PubMed] [Google Scholar]
- Colebatch JG, Findley LJ, Frackowiak RS, Marsden CD, Brooks DJ. Preliminary report: activation of the cerebellum in essential tremor. Lancet 1990; 336: 1028–30. [DOI] [PubMed] [Google Scholar]
- Contarino MF, Groot PFC, van der Meer JN, Bour LJ, Speelman JD, Nederveen AJ, et al. Is there a role for combined EMG-fMRI in exploring the pathophysiology of essential tremor and improving functional neurosurgery? PloS One 2012; 7: e46234. [DOI] [PMC free article] [PubMed] [Google Scholar]
- Czarnecki K, Jones DT, Burnett MS, Mullan B, Matsumoto JY. SPECT perfusion patterns distinguish psychogenic from essential tremor. Parkinsonism Relat Disord 2011; 17: 328–32. [DOI] [PubMed] [Google Scholar]
- Dayan E, Cohen LG. Neuroplasticity subserving motor skill learning. Neuron 2011; 72: 443–54. [DOI] [PMC free article] [PubMed] [Google Scholar]
- Deuschl G, Bain P, Brin M. Consensus statement of the movement disorder society on tremor. Ad Hoc Scientific Committee. Mov Disord 1998; 13 (Suppl 3): 2–23. [DOI] [PubMed] [Google Scholar]
- Deuschl G, Wenzelburger R, Löffler K, Raethjen J, Stolze H. Essential tremor and cerebellar dysfunction clinical and kinematic analysis of intention tremor. Brain J Neurol 2000; 123 (Pt 8): 1568–80. [DOI] [PubMed] [Google Scholar]
- Di X, Biswal BB. Identifying the default mode network structure using dynamic causal modeling on resting-state functional magnetic resonance imaging. Neuroimage 2014; 86: 53–9. [DOI] [PMC free article] [PubMed] [Google Scholar]
- Dum RP, Strick PL. Frontal lobe inputs to the digit representations of the motor areas on the lateral surface of the hemisphere. J Neurosci 2005; 25: 1375–86. [DOI] [PMC free article] [PubMed] [Google Scholar]
- Elble RJ. Essential tremor frequency decreases with time. Neurology 2000; 55: 1547–51. [DOI] [PubMed] [Google Scholar]
- Elble RJ, Higgins C, Leffler K, Hughes L. Factors influencing the amplitude and frequency of essential tremor. Mov Disord 1994; 9: 589–96. [DOI] [PubMed] [Google Scholar]
- Entakli J, Bonnard M, Chen S, Berton E, De Graaf JB. TMS reveals a direct influence of spinal projections from human SMAp on precise force production. Eur J Neurosci 2014; 39: 132–40. [DOI] [PubMed] [Google Scholar]
- Fang W, Lv F, Luo T, Cheng O, Liao W, Sheng K, et al. Abnormal regional homogeneity in patients with essential tremor revealed by resting-state functional MRI. PloS One 2013; 8: e69199. [DOI] [PMC free article] [PubMed] [Google Scholar]
- Fearnley JM, Lees AJ. Striatonigral degeneration. A clinicopathological study. Brain 1990; 113: 1823–42. [DOI] [PubMed] [Google Scholar]
- Filippini N, Rao A, Wetten S, Gibson RA, Borrie M, Guzman D, et al. Anatomically-distinct genetic associations of APOE epsilon4 allele load with regional cortical atrophy in Alzheimer’s disease. Neuroimage 2009; 44: 724–8. [DOI] [PubMed] [Google Scholar]
- Galea MP, Darian-Smith I. Multiple corticospinal neuron populations in the macaque monkey are specified by their unique cortical origins, spinal terminations, and connections. Cereb Cortex 1994; 4:166–94. [DOI] [PubMed] [Google Scholar]
- Gallea C, Graaf JB, Pailhous J, Bonnard M. Error processing during online motor control depends on the response accuracy. Behav Brain Res 2008; 193: 117–25. [DOI] [PubMed] [Google Scholar]
- Ghez C, Thach WT. The cerebellum. In: Kandel ER, Schwartz JH, Jessell TM, editors. Principles of Neural Science, 4th edn New York: McGraw-Hill; 2000. pp. 832–52. [Google Scholar]
- Hansel C. Reading the clock: how Purkinje cells decode the phase of olivary oscillations. Neuron 2009; 62: 308–9. [DOI] [PubMed] [Google Scholar]
- Hellwig B, Häussler S, Schelter B, Lauk M, Guschlbauer B, Timmer J, et al. Tremor-correlated cortical activity in essential tremor. Lancet 2001; 357: 519–23. [DOI] [PubMed] [Google Scholar]
- Hellwig B, Mund P, Schelter B, Guschlbauer B, Timmer J, Lücking CH. A longitudinal study of tremor frequencies in Parkinson's disease and essential tremor. Clin Neurophysiol 2009; 120: 431–5. [DOI] [PubMed] [Google Scholar]
- Ide JS, Zhang S, Hu S, Matuskey D, Bednarski SR, Erdman E, et al. Gray matter volume correlates of global positive alcohol expectancy in non-dependent adult drinkers. Addict Biol 2014; 19: 895–906. [DOI] [PMC free article] [PubMed] [Google Scholar]
- Kalanithi PS, Zheng W, Kataoka Y, DiFiglia M, Grantz H, Saper CB, et al. Gender differences in the functional and structural neuroanatomy of mathematical cognition. Neuroimage 2009; 47: 342–52. [DOI] [PMC free article] [PubMed] [Google Scholar]
- Kelly RM, Strick PL. Cerebellar loops with motor cortex and prefrontal cortex of a nonhuman primate. J Neurosci 2003; 23: 8432–44. [DOI] [PMC free article] [PubMed] [Google Scholar]
- Lee M, Cheng MM, Lin CY, Louis ED, Faust PL, Kuo SH. Decreased EAAT2 protein expression in the essential tremor cerebellar cortex. Acta Neuropathol Commun 2014; 2: 157. [DOI] [PMC free article] [PubMed] [Google Scholar]
- Li C, Liu C, Yin X, Yang J, Gui L, Wei L, et al. Frequency-dependent changes in the amplitude of low-frequency fluctuations in subcortical ischemic vascular disease (SIVD): a resting-state fMRI study. Behav Brain Res 2014; 274: 205–10. [DOI] [PubMed] [Google Scholar]
- Lin CY, Louis ED, Faust PL, Koeppen AH, Vonsattel JPG, Kuo SH. Abnormal climbing fibre-Purkinje cell synaptic connections in the essential tremor cerebellum. Brain J Neurol 2014; 137: 3149–59. [DOI] [PMC free article] [PubMed] [Google Scholar]
- Louis ED. Essential tremor: from bedside to bench and back to bedside. Curr Opin Neurol 2014; 27: 461–7. [DOI] [PMC free article] [PubMed] [Google Scholar]
- Louis ED, Lee M, Babij R, Ma K, Cortés E, Vonsattel JPG, et al. Reduced Purkinje cell dendritic arborization and loss of dendritic spines in essential tremor. Brain J Neurol 2014; 137: 3142–8. [DOI] [PMC free article] [PubMed] [Google Scholar]
- Louis ED1, Babij R, Lee M, Cortés E, Vonsattel JP. Quantification of cerebellar hemispheric purkinje cell linear density: 32 ET cases versus 16 controls. Mov Disord 2013; 28: 1854–9. [DOI] [PMC free article] [PubMed] [Google Scholar]
- Maier MA, Armand J, Kirkwood PA, Yang HW, Davis JN, Lemon RN. Differences in the corticospinal projection from primary motor cortex and supplementary motor area to macaque upper limb motoneurons: an anatomical and electrophysiological study. Cereb Cortex 2002; 12: 281–96. [DOI] [PubMed] [Google Scholar]
- Maillet D, Rajah MN. Association between prefrontal activity and volume change in prefrontal and medial temporal lobes in aging and dementia: a review. Ageing Res Rev 2013; 12: 479–89. [DOI] [PubMed] [Google Scholar]
- Manjón JV, Coupé P, Martí-Bonmatí L, Collins DL, Robles M. Adaptive non-local means denoising of MR images with spatially varying noise levels. J. Magn Reson Imaging 2010; 31: 192–203. [DOI] [PubMed] [Google Scholar]
- Middleton FA, Strick PL. Basal ganglia and cerebellar loops: motor and cognitive circuits. Brain Res Brain Res Rev 2000; 31: 236–50. [DOI] [PubMed] [Google Scholar]
- Molnar GF, Pilliar A, Lozano AM, Dostrovsky JO. Differences in neuronal firing rates in pallidal and cerebellar receiving areas of thalamus in patients with Parkinson’s disease, essential tremor, and pain. J Neurophysiol 2005a; 93: 3094–101. [DOI] [PubMed] [Google Scholar]
- Molnar GF, Sailer A, Gunraj CA, Cunic DI, Lang AE, Lozano AM, et al. Changes in cortical excitability with thalamic deep brain stimulation. Neurology 2005b; 64: 1913–19. [DOI] [PubMed] [Google Scholar]
- Nachev P, Kennard C, Husain M. Functional role of the supplementary and pre-supplementary motor areas. Nat Rev Neurosci 2008; 9: 856–69. [DOI] [PubMed] [Google Scholar]
- Neely KA, Kurani AS, Shukla P, Planetta PJ, Wagle Shukla A, Goldman JG, et al. Functional brain activity relates to 0-3 and 3-8 Hz force oscillations in essential tremor. Cereb Cortex 2014. Advance Access published on June 24, 2014, doi:10.1093/cercor/bhu142. [DOI] [PMC free article] [PubMed] [Google Scholar]
- Nicoletti G, Manners D, Novellino F, Condino F, Malucelli E, Barbiroli B, et al. Diffusion tensor MRI changes in cerebellar structures of patients with familial essential tremor. Neurology 2010; 74: 988–94. [DOI] [PubMed] [Google Scholar]
- Paris-Robidas S, Brochu E, Sintes M, Emond V, Bousquet M, Vandal M, et al. Defective dentate nucleus GABA receptors in essential tremor. Brain J Neurol 2012; 135: 105–16. [DOI] [PubMed] [Google Scholar]
- Passamonti L, Cerasa A, Quattrone A. Neuroimaging of essential tremor: what is the evidence for cerebellar involvement? Tremor Other Hyperkinetic Mov (N Y) 2012; 2. [DOI] [PMC free article] [PubMed] [Google Scholar]
- Popa T, Russo M, Vidailhet M, Roze E, Lehéricy S, Bonnet C, et al. Cerebellar rTMS stimulation may induce prolonged clinical benefits in essential tremor, and subjacent changes in functional connectivity: an open label trial. Brain Stimulat 2013; 6: 175–9. [DOI] [PubMed] [Google Scholar]
- Pouratian N, Zheng Z, Bari AA, Behnke E, Elias WJ, Desalles AAF. Multi-institutional evaluation of deep brain stimulation targeting using probabilistic connectivity-based thalamic segmentation. J. Neurosurg 2011; 115: 995–1004. [DOI] [PubMed] [Google Scholar]
- Quattrone A, Cerasa A, Messina D, Nicoletti G, Hagberg GE, Lemieux L, et al. Essential head tremor is associated with cerebellar vermis atrophy: a volumetric and voxel-based morphometry MR imaging study. AJNR Am. J. Neuroradiol. 2008; 29: 1692–7. [DOI] [PMC free article] [PubMed] [Google Scholar]
- Raethjen J, Deuschl G. The oscillating central network of Essential tremor. Clin Neurophysiol 2012; 123: 61–4. [DOI] [PubMed] [Google Scholar]
- Rizzolatti G, Luppino G. The cortical motor system. Neuron 2001; 31: 889–901. [DOI] [PubMed] [Google Scholar]
- Schmahmann JD, Doyon J, McDonald D, Holmes C, Lavoie K, Hurwitz AS, et al. Three-dimensional MRI atlas of the human cerebellum in proportional stereotaxic space. Neuroimage 1999; 10: 233–60. [DOI] [PubMed] [Google Scholar]
- Schnitzler A, Münks C, Butz M, Timmermann L, Gross J. Synchronized brain network associated with essential tremor as revealed by magnetoencephalography. Mov Disord 2009; 24: 1629–35. [DOI] [PubMed] [Google Scholar]
- Shibasaki H. Cortical activities associated with voluntary movements and involuntary movements. Clin Neurophysiol 2012; 123: 229–43. [DOI] [PubMed] [Google Scholar]
- Shimazu H, Maier MA, Cerri G, Kirkwood PA, Lemon RN. Macaque ventral premotor cortex exerts powerful facilitation of motor cortex outputs to upper limb motoneurons. J Neurosci 2004; 424: 1200–11. [DOI] [PMC free article] [PubMed] [Google Scholar]
- Stephan KE, Penny WD, Daunizeau J, Moran RJ, Friston KJ. Bayesian model selection for group studies. Neuroimage 2009; 46, 1004–17. [DOI] [PMC free article] [PubMed] [Google Scholar]
- Stephan KE, Penny WD, Moran RJ, den Ouden HEM, Daunizeau J, Friston KJ. Ten simple rules for dynamic causal modeling. Neuroimage 2010; 49: 3099–109. [DOI] [PMC free article] [PubMed] [Google Scholar]
- Tohka J, Zijdenbos A, Evans A. Fast and robust parameter estimation for statistical partial volume models in brain MRI. Neuroimage 2004; 23: 84–97. [DOI] [PubMed] [Google Scholar]
- Tournier JD, Calamante F, Connelly A. Robust determination of the fibre orientation distribution in diffusion MRI: non-negativity constrained super-resolved spherical deconvolution. Neuroimage 2007; 35: 1459–72. [DOI] [PubMed] [Google Scholar]
- Vahdat S, Darainy M, Milner TE, Ostry DJ. Functionally specific changes in resting-state sensorimotor networks after motor learning. J Neurosci 2011; 31: 16907–15. [DOI] [PMC free article] [PubMed] [Google Scholar]
- Wang L, Dai W, Su Y, Wang G, Tan Y, Jin Z, et al. Amplitude of low-frequency oscillations in first-episode, treatment-naive patients with major depressive disorder: a resting-state functional MRI study. PloS One 2012; 7: e48658. [DOI] [PMC free article] [PubMed] [Google Scholar]
- Worbe Y, Gerardin E, Hartmann A, Valabrégue R, Chupin M, Tremblay L, et al. Distinct structural changes underpin clinical phenotypes in patients with Gilles de la Tourette syndrome. Brain 2010; 133: 3649–60. [DOI] [PubMed] [Google Scholar]
- Yarkoni T, Poldrack RA, Nichols TE, Van Essen DC, Wager TD. Large-scale automated synthesis of human functional neuroimaging data. Nat Methods 2011; 8: 665–70. [DOI] [PMC free article] [PubMed] [Google Scholar]
- Yelnik J, Bardinet E, Dormont D, Malandain G, Ourselin S, Tandé D, et al. A three-dimensional, histological and deformable atlas of the human basal ganglia. I. Atlas construction based on immunohistochemical and MRI data. Neuroimage 2007; 34: 618–38. [DOI] [PubMed] [Google Scholar]
- Zhou B, Chen Q, Zhang Q, Chen L, Gong Q, Shang H, et al. Hyperactive putamen in patients with paroxysmal kinesigenic choreoathetosis: a resting-state functional magnetic resonance imaging study. Mov Disord 2010; 25: 1226–31. [DOI] [PubMed] [Google Scholar]
- Zhou Y, Lui YW, Zuo XN, Milham MP, Reaume J, Grossman RI, et al. Characterization of thalamo-cortical association using amplitude and connectivity of functional MRI in mild traumatic brain injury. J Magn Reson Imaging 2014; 39: 1558–68. [DOI] [PMC free article] [PubMed] [Google Scholar]
- Zou Q, Changwei WW, Stein EA, Zang Y, Yang Y. Static and dynamic characteristics of cerebral blood flow during the resting state. Neuroimage 2009; 48:515–24. [DOI] [PMC free article] [PubMed] [Google Scholar]
Associated Data
This section collects any data citations, data availability statements, or supplementary materials included in this article.