

Abstract
Benzene is an established cause of adult leukemia, but whether it is associated with childhood leukemia remains unclear. We conducted a meta-analysis in which we reviewed the epidemiologic literature on this topic and explored causal inference, bias, and heterogeneity. The exposure metrics that we evaluated included occupational and household use of benzenes and solvents, traffic density, and traffic-related air pollution. For studies of occupational and household product exposure published from 1987 to 2014, the summary relative risk for childhood leukemia was 1.96 (95% confidence interval (CI): 1.53, 2.52; n = 20). In these studies, the summary relative risk was higher for acute myeloid leukemia (summary relative risk (sRR) = 2.34, 95% CI: 1.72, 3.18; n = 6) than for acute lymphoblastic leukemia (sRR = 1.57; 95% CI: 1.21, 2.05; n = 14). The summary relative risk was higher for maternal versus paternal exposure, in studies that assessed benzene versus all solvents, and in studies of gestational exposure. In studies of traffic density or traffic-related air pollution published from 1999 to 2014, the summary relative risk was 1.48 (95% CI: 1.10, 1.99; n = 12); it was higher for acute myeloid leukemia (sRR = 2.07; 95% CI: 1.34, 3.20) than for acute lymphoblastic leukemia (sRR = 1.49; 95% CI: 1.07, 2.08) and in studies that involved detailed models of traffic pollution (sRR = 1.70; 95% CI: 1.16, 2.49). Overall, we identified evidence of associations between childhood leukemia and several different potential metrics of benzene exposure.
Keywords: benzene, cancer, childhood, leukemia, occupation
Millions of people in the United States and worldwide are exposed to benzene, either in occupational settings or environmentally (1, 2). The International Agency for Research on Cancer has classified benzene as a human carcinogen based primarily on research that linked occupationally exposed workers to elevated risks of acute myeloid leukemia (AML) (3). Children and fetuses might also be exposed to benzene either through air pollution, exposure sources near residences (such as gas stations or automotive repair facilities), maternal workplace exposure during pregnancy, or home use of products that contain benzene. Despite the sufficient evidence linking benzene to leukemia in adults, it is less clear whether there is an association in exposed children.
Childhood cancer is one of the leading causes of death by disease in children (4), and acute leukemia accounts for 30% of childhood malignancies (5). The most common form is acute lymphoblastic leukemia (ALL), with AML being less common but more fatal (6). Risk factors include genetic conditions such as Li-Fraumeni syndrome or Down syndrome, radiation therapy, chemotherapy, and possibly tobacco smoke (5, 7). To date however, the causes of most childhood leukemias are unknown, and no single chemical agent has been conclusively linked to this cancer.
Although the links between benzene and childhood leukemia have been evaluated in several studies (8–12), the results have been mixed. The reasons for this are not well defined but could be attributed to differences in study design, exposure levels, leukemia subtypes, and the methods used to assess benzene exposure. Another possible reason is that exposures in children might be much lower than occupational exposures in adults. Studies of low exposures are likely to have relative risks closer to 1.0, and inadequate sample sizes, bias, or confounding can be especially important when increases in relative risks are small (13).
We examined current epidemiologic studies of parental or childhood exposure to benzene and childhood leukemia. Our goals were to perform a systematic literature review, evaluate each study for the basic tenets of epidemiologic validity, and summarize this literature using meta-analysis. Another goal was to evaluate sources of heterogeneity, including heterogeneity based on study design, confounding, leukemia subtype, and methods and timing of exposure assessment.
METHODS
Literature search
Two authors conducted independent literature searches. Databases including PubMed, Google Scholar, Melvyl, and Embase were searched for epidemiologic studies on benzene and childhood leukemia before age 20 years. Key words included childhood cancer, childhood leukemia, childhood ALL, childhood AML, benzene, occupational setting, traffic, traffic density, hazardous air pollution, vehicle exhaust, hydrocarbons, solvents, ambient air, parental occupation and offspring, home exposure, and in utero exposure. The bibliographies of relevant review articles (1, 5, 14–25) and all studies included in the present meta-analysis were also searched.
Study selection
We included studies that were focused on benzene or common sources or surrogates of benzene exposure. All cohort and case-control studies that provided a relative risk estimate, an estimate of variance, and an assessment of benzene exposure or related surrogates were included. Studies in which exposures after cancer diagnosis were assessed were excluded. Only studies that were published in peer-reviewed journals were used. Studies of mortality and not incidence were excluded because childhood leukemia is typically not fatal. Studies that involved populations in which all members were exposed to another potential risk factor (e.g., Down syndrome or residence near a nuclear facility) were also excluded.
Two authors evaluated each study and abstracted relative risk estimates independently. Discrepancies were discussed and resolved through consensus. Study inclusion criteria are detailed in the Appendix.
Exposure assessment
None of the selected studies involved personal measurements of benzene exposure. In all studies, exposure levels were based on indirect measures, such as job titles, self-reports of benzene or related product use, or other potential surrogates. To identify the most appropriate metrics of benzene exposure, we referred to the US Environmental Protection Agency's Toxicity and Exposure Assessments for Children's Health (26) and the Center for Disease Control and Prevention's Toxicological Profile for Benzene (27). On the basis of this information, we included studies in which the following metrics were assessed: estimates of occupational exposure based on job titles and expert evaluations that linked job titles to probable high exposure to benzene, aromatic hydrocarbons, solvents, or petroleum products; personal interviews in which self-reported exposure to benzene, aromatic hydrocarbon, solvent, or petroleum products at work or home were assessed; automotive repair or gas station attendant work; residential proximity to high traffic density; models of residential ambient air concentrations of benzene based on traffic density or other factors; or residential proximity to gas stations and automotive repair facilities. Because some of these metrics might be more accurate indicators of benzene exposure than others, we performed subgroup analyses based on each metric. In addition, because of potential differences in exposure levels and exposure scenarios, studies of occupational and household product use were analyzed separately from studies of proximity to gas stations or studies of traffic-related exposures.
Some publications included relative risk estimates for several different exposure metrics for the same study subjects. In our analysis of occupational and household product exposure, we selected which relative risk to include for each metric in the following order: benzene, aromatic hydrocarbons, solvents, petroleum products, and related occupations (e.g., automotive repair). In our analysis of traffic density or ambient air exposure, the selection order was ambient air benzene measurements, traffic-related pollution models (e.g., California Line Source Dispersion Model, version 4), and traffic density.
Tobacco smoke is a major source of benzene exposure in smokers and has been linked to childhood leukemia in some studies, although the increases in risks are usually small and not seen in all studies (7). Because tobacco smoke contains multiple carcinogens and because the association of tobacco smoke with childhood leukemia has been reviewed elsewhere (7, 28), we excluded studies that focused on smoking. Potential confounding by smoking and socioeconomic status was evaluated in subgroup analyses.
Data abstraction
From each study, we abstracted information on location, dates, study design, sample size, participation rates, exposure assessment, timing of exposure, diagnosis, and statistical adjustments. Different studies assessed exposure during different life stages. We categorized these exposure periods into 5 time frames: preconception (≥2 years before birth), periconception (approximately 1 year before birth), gestation, postnatal (any point after pregnancy), and overall (any or all life stages). In several studies, separate relative risks for different time periods were provided. For our analyses of occupational and household product exposures, we selected 1 result using the following order: overall, gestational, and postnatal. For studies of paternal occupational exposure, data from the preconception period were selected first because this time frame might involve more direct and higher exposures (i.e., to the gamete). Because a previous analysis of traffic studies suggested that postnatal exposure was associated with higher risks (29), the selection order in our traffic-related analyses was postnatal, overall, and gestational, although subgroup analyses by exposure period were also performed.
In several studies, separate results by leukemia subtype were provided. When this occurred, we selected a subtype in the following order: AML, all types combined, and ALL. AML was selected first because this is the type most strongly linked to benzene exposure in adults (1, 3, 30); ALL results were also evaluated using subgroup analyses. In 1 study, only results for leukemia and lymphomas combined were reported (31). This study was included because leukemia represented the large majority of cases. Some studies reported separate results for exposures in mothers and fathers combined, either parent, mothers only, or fathers only; in this case, 1 result was selected using the following order: both parents, mother only, either parent, and father only. Several studies also reported separate results for different exposure levels (e.g., low, medium, or high). We extracted the result for the highest exposure level because associations are best initially evaluated in groups with high levels of exposure (13).
Some publications included separate results for several different exposure metrics, several different leukemia types, different parents, or different periods of exposure for the same study subjects. In the analyses of all studies combined, 1 result was selected based on the following factors in the following order: the more direct exposure metric (e.g., benzene exposure was selected before exposure to solvents, occupational exposure before home exposure, or more detailed models of traffic pollution before simple traffic density information); leukemia subtype (e.g., AML, all types combined, and then ALL); highest exposure category; parent (both parents before mother only and mother only before father only); exposure period (as described above); largest number of cases; and statistical adjustment (adjusted before unadjusted) (Web Figures 1 and 2, available at http://aje.oxfordjournals.org/). Results that were not selected for the combined analyses were still used in the subgroup analyses when appropriate.
Statistical methods
Summary relative risks were calculated using the fixed- and random-effects methods (32). Heterogeneity was assessed using the methods described by Petitti (33). Some believe that the random-effects model is more conservative than the fixed-effects model because it accounts for variance between studies. However, unlike the fixed-effects model, the random-effects model does not weight studies directly on precision; it assigns smaller, less precise studies greater relative weight than does the fixed-effect model. To weight studies directly on precision while still incorporating between-study variance, we used the fixed-effects model to calculate the summary relative risks and then adjusted their 95% confidence intervals for between-study heterogeneity using the method described by Shore et al. (34). Publication bias was evaluated using funnel plots and the tests described by Begg and Mazumdar (35) and Egger et al. (36). All calculations were performed using Excel 2010 (Microsoft Corporation, Redmond, Washington) or STATA, version 12 (StataCorp LP, College Station, Texas), and all P values are 2-sided.
RESULTS
The literature review is summarized in Web Figure 3. The initial literature search yielded 506 articles. Title screenings filtered out obviously unrelated articles and studies that did not include humans, resulting in 354 articles. We then filtered out studies specifically about smoking, as well as additional laboratory, animal, or nonrelevant studies. The remaining 185 studies were further reviewed, and studies with possible data on childhood leukemia and benzene exposure or a surrogate thereof were retained. This left 85 papers that were reviewed in detail. On the basis of the inclusion and exclusion criteria listed in the Appendix, 44 of these studies were excluded from our meta-analyses (Web Table 1). The remaining 41 studies were eligible for inclusion in the meta-analysis. Eight of these involved subjects who potentially overlapped with those in another included study and therefore were not included in the meta-analyses of all studies combined; however, they had data that could be used in subgroup analyses (Web Table 2). This left a total of 20 studies for the meta-analysis of all studies of occupational and household product exposure combined (Table 1), 12 studies for the meta-analysis of all traffic density and traffic-related pollution studies combined, and 3 studies for the meta-analysis of residential proximity to gas stations (Table 2).
Table 1.
Studies Included in the Overall Analysis of Occupational and Household Exposure to Benzene and Childhood Leukemia, 1987–2014
| First Author, Year (Reference No.) | RR | 95% CI | Type of Leukemia | No. of Exposed Cases | Study Location | Study Years | Children's Ages, years | Exposure |
||
|---|---|---|---|---|---|---|---|---|---|---|
| Parent | Period | Exposure Assessed | ||||||||
| Studies of Occupational Exposures | ||||||||||
| Abadi-Korek et al., 2006 (8) | 2.11 | 1.10, 4.20 | ALL | 112a | Israel | 1984–2002 | 0–19 | Either | Overall | Solvents, based on detailed histories of parental occupations and exposures, every job held, and specific exposures |
| Buckley et al., 1989 (44) | 2.0 | 1.2, 3.8 | AML | 57 | United States and Canada | 1980–1984 | 0–18 | Father | Overall | Solvents, based on lifetime occupational history; 52 agents in 9 categories |
| Castro-Jiménez and Orozco-Vargas 2011 (9) | 11.65 | 2.98, 45.59 | ALL | 85a | Colombia | 2000–2005 | 0–15 | Both | Unknown | Benzene, based on occupations, JEM, and expert evaluation; conception to diagnosis |
| Cocco et al., 1996 (45) | 1.5 | 0.3, 8.0 | ALL | 3 | Italy | 1980–1989 | Unknown | Father | Unknown | Solvents, based on occupations, JEM, and expert evaluation |
| Feingold et al., 1992 (37) | 1.6 | 0.5, 5.8 | ALL | 9 | United States | 1976–1983 | 0–14 | Father | Periconception | Benzene, based on occupations and expert evaluation |
| Feychting et al., 2001 (38) | 1.23 | 0.39, 3.85 | Leukemia | 3 | Sweden | Children born 1976, 1977, 1981, 1982 | 0–14 | Father | Preconception | Benzene, based on father's occupation in the census 1–2 years before the child's birth, JEM, and expert evaluation |
| Infante-Rivard et al., 1991 (46) | 0.62 | 0.20, 1.91 | ALL | 6 | Spain | 1983–1985 | 0–15 | Mother | Gestation | Solvents, based on occupation, specific substances during pregnancy, and expert evaluation |
| Infante-Rivard et al., 2005 (39) | 1.47 | 0.25, 8.85 | ALL | 790a | Canada | 1980–2000 | 0–9, 0–14 | Mother | Any or ever before birth | Benzene, based on occupations and specific exposures from 2 years before pregnancy to birth and on expert evaluation (highest exposure category) |
| Lowengart et al., 1987 (49) | 1.00 | 0.33, 3.06 | Leukemia | 123a | United States | 1980–1984 | 0–10 | Father | Overall | Petroleum chemicals, based on occupations and specific agents from 1 year before conception to 1 year before diagnosis |
| McKinney et al., 1991 (31) | 4.00 | 0.30, 118 | Leukemia and NHL | 2 | United Kingdom | 1974–1988 | 0–14 | Mother | Preconception | Benzene, based on occupations and specific questions about benzene |
| McKinney et al., 2008 (47) | 2.0 | 0.7, 5.8 | AML | 256a | United Kingdom | 1991–1996 | 0–14 | Mother | Gestation | Solvents, based on occupations and expert evaluation |
| Miligi et al., 2013 (43) |
3.1 | 0.8, 12.4 | Leukemia | 6 | Italy | 1998–2001 | 0–10 | Mother | Overall | Benzene, based on occupations, specific chemical exposures, and expert evaluation |
| Perez-Saldivar et al., 2008 (50) | 2.81 | 0.48, 16.43 | Leukemia (acute) | 9 | Mexico | 1999–2000 | 0–15 | Father | Preconception | Work as a mechanic, based on occupational history before conception |
| Reid et al., 2011 (40) |
0.93 | 0.42, 2.09 | ALL | 9 | Australia | 2003–2006 | 0–14 | Mother | Before birth | Benzene, based on occupations and expert evaluations |
| Shu et al., 1988 (41) |
4.0 | 1.8, 9.3 | AML | 11 | China | 1974–1986 | 0–15 | Mother | Gestation | Benzene, based on occupations and specific exposures |
| Shu et al., 1999 (42) |
0.7 | 0.3, 1.6 | ALL | 11 | United States | 1989–1993 | 0–15 | Mother | Any | Benzene, based on occupations and specific exposures |
| Smulevich et al., 1999 (48) | 3.1 | 1.5, 6.3 | Leukemia | 20 | Russia | 1986–1988 | 0–14 | Mother | Any | Solvents, based on occupations and job categories |
| Studies of Household Product Use | ||||||||||
| Kishi et al., 1993 (51) |
2.73 | 1.21, 6.31 | ALL | 147a | Japan | 1980–1990 | 0–15 | Mother | Gestation | Benzene, based on home exposures |
| Scélo et al., 2009 (10) |
2.23 | 1.01, 4.93 | AML | 100a | United States | 1995–2005 | 0–14 | Family | Overall | Solvents, based on personal interviews on household use, from gestation to age 3 years (higher frequency category) |
| Slater et al., 2011 (11) | 2.33 | 1.30, 4.18 | AML | 29 | United States and Canada | 1996–2006 | 0–1 | Mother | Any | Petroleum products, based on personal interview about household exposures 1 month before and during pregnancy |
Abbreviations: ALL, acute lymphoblastic leukemia; AML, acute myeloid leukemia; CI, confidence interval; JEM, job exposure matrix; NHL, non-Hodgkin lymphoma; RR, relative risk estimate.
a Total number of cases, including unexposed cases.
Table 2.
Studies Included in the Overall Analysis of Traffic Density, Traffic-Related Air Pollution Models, or Gas Station Residential Proximity and Childhood Leukemia, 1999–2014
| First Author, Year (Reference No.) | RR | 95% CI | Type of Leukemia | No. of Exposed Cases | Study Location | Years | Child Age, Years | Exposure |
|
|---|---|---|---|---|---|---|---|---|---|
| Period | Exposure Assessed or Model Used | ||||||||
| Studies of Traffic Density or Traffic-Related Air Pollution Models | |||||||||
| Amigou et al., 2011 (52) | 3.1 | 0.8, 11.6 | AML | 3 | France | 2003–2004 | 0–14 | At diagnosis | Composite (density, proximity, and nitrogen dioxide) |
| Badaloni et al., 2013 (53) | 1.30 | 0.79, 2.12 | Leukemia | 74 | Italy | 1998–2001 | 0–10 | Lifetime (never moved) | Land-use regression models (nitrogen dioxide) |
| Crosignani et al., 2004 (54) | 4.31 | 1.47, 12.62 | Leukemia | 7 | Italy | 1978–1997 | 0–14 | At diagnosis | California LINE Source Dispersion Model, version 4 |
| Harrison et al., 1999 (55) | 1.16 | 0.74, 1.72 | Leukemia | 24 | United Kingdom | 1990–1994 | 0–15 | At diagnosis | Traffic density |
| Heck et al., 2014 (60) | 1.94 | 0.89, 4.19 | AML | 66 | United States | 1990–2007 | 0–5 | Birth | Air monitoring data for benzene (per IQR) |
| Langholz et al., 2002 (61) | 1.4 | 0.7, 3.0 | Leukemia | 46 | United States | 1978–1984 | 0–10 | Residence of longest duration | Traffic density |
| Pearson et al., 2000 (62) | 8.28 | 2.09, 32.8 | Leukemia | 8 | United States | 1976–1983 | 0–14 | At diagnosis | Traffic density (distance-weighted) |
| Raaschou-Nielsen et al., 2001 (56) | 0.4 | 0.1, 1.6 | Leukemia | 870a | Denmark | 1968–1991 | 0–14 | Childhood (all residences) | Operational Street Pollution Model (benzene) |
| Steffen et al., 2004 (12) | 1.1 | 0.8, 1.6 | Leukemia | 155 | France | 1995–1999 | 0–14 | Childhood (all residences) | Traffic density (heavy traffic roads) |
| Vinceti et al., 2012 (57) | 1.92 | 0.64, 5.78 | AML | 19 | Italy | 1998–2009 | 0–14 | At diagnosis | California LINE Source Dispersion Model, version 4 (per 1 µg/m3 benzene) |
| Visser et al., 2004 (58) | 4.9 | 1.6, 11.4 | ALL | 5 | Netherlands | 1989–1997 | 0–14 | At diagnosis | Traffic density (traffic intensity score) |
| Whitworth et al., 2008 (63) | 2.02 | 1.03, 3.96 | AML | 31 | United States | 1995–2004 | 0–19 | At diagnosis | Assessment System for Pollution Exposure Nationwide |
| Studies of Residential Proximity to Gas Stations | |||||||||
| Brosselin et al., 2009 (59) | 1.1 | 0.5, 2.5 | AML | 7 | France | 2003–2004 | 0–18 | Any | Residential proximity to garages or gas stations based on personal interviews; all residences from pregnancy to diagnosis |
| Harrison et al., 1999 (55) | 1.48 | 0.65, 2.93 | Leukemia | 8 | United Kingdom | 1990–1994 | 0–15 | At diagnosis | Living within 100 m of a gas station |
| Steffen et al., 2004 (12) | 7.7 | 1.7, 34.3 | AML | 4 | France | 1995–1999 | 0–14 | Childhood | Proximity to repair garages or gas stations, based on interviews about residential history from conception to diagnosis |
Abbreviations: ALL, acute lymphoblastic leukemia; AML, acute myeloid leukemia; CI, confidence interval; IQR, interquartile range; RR, relative risk.
a Total number of cases, including unexposed cases.
Occupational and household product exposure studies
Of the studies in the meta-analysis of all studies of occupational and household product exposure, 8 were conducted in North America, 1 in South America, 7 in Europe, 3 in Asia, and 1 in Australia (Table 1). Most of the 17 occupational exposure studies assessed exposure using job records and job exposure matrices or direct questions about exposure to benzene (n = 9) (9, 31, 37–43), solvents (n = 6) (8, 44–48), petroleum chemicals (n = 1) (49), or work as a mechanic (n = 1) (50). The 3 studies of household product exposure assessed exposure to benzene (51), solvents (10), or petroleum products (11).
The summary relative risk for all 20 studies of occupational and household product exposure combined was 1.96 (95% confidence interval (CI): 1.53, 2.52; P < 0.001; χ2 = 28.42; P for heterogeneity = 0.08) (Table 3 and Figure 1A). Removing the study that included lymphomas (31) had little impact on results (summary relative risk (sRR) = 1.96; 95% CI: 1.51, 2.53). Sixteen of the 20 studies (80%) reported a relative risk estimate greater than 1.0, of which 8 (40%) were statistically significant. For the 6 studies that provided data on AML, the summary relative risk was 2.34 (95% CI: 1.72, 3.18; P < 0.001; χ2 = 2.08; P for heterogeneity = 0.84). All 6 reported a relative risk of 2.0 or higher (Figure 1B). In the 14 studies of occupational and household product use in which data on ALL were provided, the summary relative risk was 1.57 (95% CI: 1.21, 2.05; χ2 = 24.73; P for heterogeneity = 0.03).
Table 3.
Results of the Meta-Analyses of Studies of Childhood Leukemia and Parental and Early Childhood Exposure to Benzene in Occupational and Household Products, 1987–2014
| Group and Subgroup | No. of Studies | Fixed Effects |
Shore-Adjusteda |
Random Effectsa |
Heterogeneity |
|||
|---|---|---|---|---|---|---|---|---|
| sRR | 95% CI | 95% CI | sRR | 95% CI | χ2 | P Value | ||
| Outcome | ||||||||
| All studies combined | 20 | 1.96 | 1.60, 2.41 | 1.53, 2.52 | 1.94 | 1.48, 2.53 | 28.42 | 0.08 |
| AML only | 6 | 2.34 | 1.72, 3.18 | NA | NA | NA | 2.08 | 0.84 |
| ALL only | 14 | 1.57 | 1.30, 1.90 | 1.21, 2.05 | 1.63 | 1.21, 2.21 | 24.73 | 0.03 |
| Parent | ||||||||
| Mother | 13 | 1.96 | 1.52, 2.55 | 1.39, 2.78 | 1.94 | 1.34, 2.80 | 21.55 | 0.04 |
| Father | 14 | 1.23 | 1.08, 1.39 | 1.07, 1.41 | 1.27 | 1.08, 1.50 | 16.23 | 0.24 |
| Exposure metric | ||||||||
| Maternal occupational exposure | ||||||||
| Benzene | 7 | 1.71 | 1.14, 2.58 | 0.91, 3.24 | 1.94 | 0.97, 3.91 | 14.51 | 0.02 |
| Solvents | 7 | 1.17 | 0.94, 1.46 | 0.84, 1.63 | 1.25 | 0.87, 1.80 | 13.66 | 0.03 |
| Paternal occupational exposure | ||||||||
| Benzene | 6 | 1.18 | 1.00, 1.41 | 0.94, 1.50 | 1.27 | 0.89, 1.80 | 9.43 | 0.09 |
| Solvents | 9 | 1.18 | 1.00, 1.39 | NA | NA | NA | 6.65 | 0.57 |
| Household product useb | 6 | 1.67 | 1.24, 2.26 | 1.01, 2.78 | 1.88 | 1.10, 3.21 | 14.16 | 0.01 |
| Adjustmentsc | ||||||||
| Smoking | 8 | 1.94 | 1.43, 2.64 | 1.30, 2.90 | 1.94 | 1.27, 2.97 | 11.97 | 0.10 |
| Socioeconomic status | 13 | 1.94 | 1.50, 2.51 | 1.39, 2.71 | 1.95 | 1.37, 2.71 | 20.44 | 0.06 |
| Time of exposure | ||||||||
| Preconception | ||||||||
| Maternal | 6 | 1.32 | 0.92, 1.89 | 0.84, 2.08 | 1.38 | 0.83, 2.27 | 7.98 | 0.16 |
| Paternal | 8 | 1.31 | 1.11, 1.54 | NA | NA | NA | 6.64 | 0.47 |
| Periconception | ||||||||
| Maternal | 3 | 1.29 | 0.97, 1.71 | NA | NA | NA | 1.26 | 0.53 |
| Paternal | 4 | 1.13 | 0.94, 1.37 | NA | NA | NA | 1.53 | 0.67 |
| Gestation (maternal exposure) | 9 | 2.06 | 1.51, 2.81 | 1.41, 3.02 | 1.93 | 1.29, 2.88 | 12.12 | 0.15 |
| Postnatal | 6 | 1.51 | 0.99, 2.30 | NA | NA | NA | 3.95 | 0.56 |
Abbreviations: ALL, acute lymphoblastic leukemia; AML, acute myeloid leukemia; CI, confidence interval; NA, not applicable; sRR, summary relative risk.
a The Shore-adjusted and random-effects models were used if the χ2 statistic was greater than the degrees of freedom (the number of studies minus 1).
b Includes benzene, aromatic hydrocarbon, solvent, and petroleum product use.
c Includes adjusted results and results from studies in which the authors stated that the adjustments had little or no impact on the results.
Figure 1.
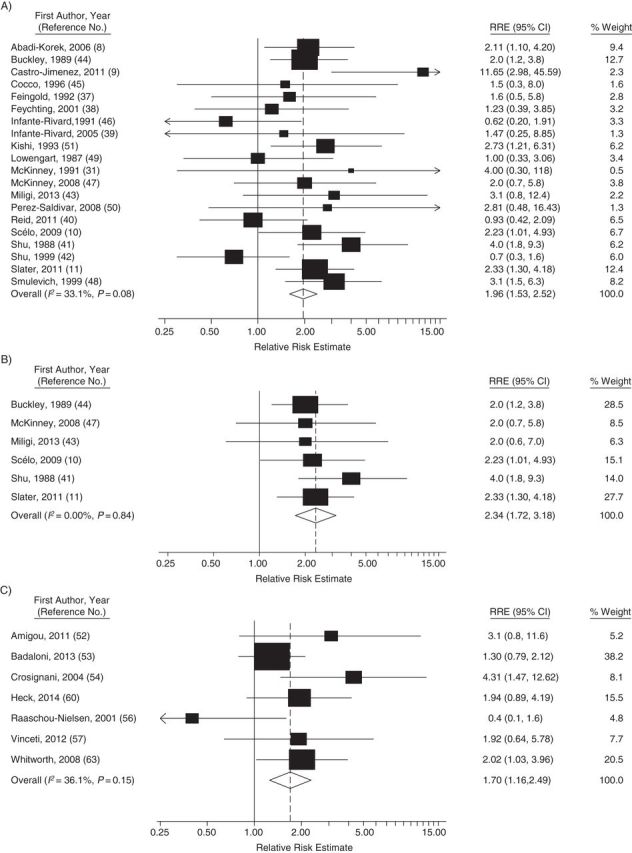
Forest plots of studies included in the meta-analyses of benzene and childhood leukemia, 1987–2014. A) All studies of occupational or household product use; B) studies of acute myeloid leukemia and occupational or household product use; and C) studies of more detailed traffic-related pollution models. CI, confidence interval; RRE, relative risk estimate.
Summary relative risks were higher in studies of maternal exposure (sRR = 1.96; 95% CI: 1.39, 2.78; n = 13) than in studies of paternal exposure (sRR = 1.23; 95% CI: 1.07, 1.41; n = 14). They were also higher in studies of exposure during gestation than in studies of other periods. In analyses by exposure metric, the summary relative risk was highest for those studies in which maternal occupational exposure to benzene (sRR = 1.71; 95% CI: 0.91, 3.24; n = 7) or household product use (sRR = 1.67; 95% CI: 1.01, 2.78; n = 6) was assessed. In the 6 studies of maternal exposures (household or occupational) and AML, the summary relative risk was 2.31 (95% CI: 1.62, 3.28; P for heterogeneity = 0.77) (data not shown). Summary relative risks were also higher in studies in which there was adjustment for either direct measures of smoking (sRR = 1.94; 95% CI: 1.30, 2.90; n = 8) or an indicator of socioeconomic status (sRR = 1.94; 95% CI: 1.39, 2.71; n = 13).
Traffic-related and gas station studies
Nine of these studies were done in Europe (12, 52–59) and 4 in North America (60–63) (Table 2). Two of the gas station studies used the same study populations as a study in our traffic analyses (12, 55). Five of the traffic-related studies assessed relatively simple metrics of traffic density (12, 55, 58, 61, 62), and 7 used more complex exposure assessment models including California LINE Dispersion Model, version 4 (52–54, 56, 57, 60, 63).
In the meta-analysis of all traffic-related studies combined, the summary relative risk was 1.48 (95% CI: 1.10, 1.99; n = 12; P = 0.005; χ2 = 27.49; P for heterogeneity = 0.004) (Table 4). The summary relative risk was higher for studies of AML (2.07; 95% CI: 1.34, 3.20; P = 0.001) than for studies of ALL (1.49; 95% CI: 1.07, 2.08; P = 0.01). In analyses by exposure metric, the highest summary relative risks were seen in studies that used more detailed metrics of traffic-related pollution (1.70; 95% CI: 1.16, 2.49; n = 7; P = 0.003). The summary relative risk was also higher in studies in which exposure at diagnosis was assessed (sRR = 1.46; 95% CI: 1.03, 2.08) than in those in which exposure at birth was assessed (sRR = 0.92; 95% CI: 0.73, 1.17). It was also higher in US studies (sRR = 2.02) than in the European studies (sRR = 1.35). The summary relative risks in the 3 studies of residential proximity to gas stations were above 1.0, but they were not statistically significant.
Table 4.
Results of the Meta-Analyses of Studies of Childhood Leukemia and Traffic Density, Traffic-Related Air Pollution Models, or Gas Station Residential Proximity, 1999–2014
| Group and Subgroup | No. of Studies | Fixed Effects |
Shore-Adjusteda |
Random Effectsa |
Heterogeneity |
|||
|---|---|---|---|---|---|---|---|---|
| sRR | 95% CI | 95% CI | sRR | 95% CI | χ2 | P Value | ||
| Outcome | ||||||||
| All studies combined | 12 | 1.48 | 1.23, 1.78 | 1.10, 1.99 | 1.80 | 1.29, 2.52 | 27.49 | <0.01 |
| AML only | 4 | 2.07 | 1.34, 3.20 | NA | NA | NA | 0.40 | 0.94 |
| ALL only | 7 | 1.49 | 1.20, 1.84 | 1.07, 2.08 | 1.79 | 1.21, 2.65 | 14.96 | 0.02 |
| Exposure metric | ||||||||
| Traffic density | 11 | 0.97 | 0.88, 1.07 | 0.82, 1.15 | 1.25 | 0.96, 1.62 | 29.92 | <0.01 |
| Traffic density (excluding Heck et al. (85))b | 10 | 1.17 | 0.99, 1.40 | 0.89, 1.55 | 1.38 | 0.96, 1.62 | 23.26 | 0.01 |
| Traffic pollution models (e.g., CALINE4)c | 7 | 1.70 | 1.25, 2.30 | 1.16, 2.49 | 1.77 | 1.17, 2.68 | 9.38 | 0.15 |
| Adjustmentsd | ||||||||
| Socioeconomic status | 9 | 1.49 | 1.19, 1.86 | 1.07, 2.08 | 1.77 | 1.20, 2.62 | 18.05 | 0.02 |
| Area | ||||||||
| Europe | 8 | 1.35 | 1.09, 1.68 | 0.95, 1.93 | 1.65 | 1.09, 2.52 | 19.51 | 0.01 |
| United States | 4 | 2.02 | 1.35, 3.00 | 1.20, 3.38 | 2.13 | 1.25, 3.64 | 5.02 | 0.17 |
| Time of exposure | ||||||||
| Birth or gestation only | 4 | 0.92 | 0.75, 1.14 | 0.73, 1.17 | 0.94 | 0.73, 1.22 | 3.93 | 0.27 |
| Postnatal (any) | 13 | 1.36 | 1.15, 1.60 | 1.05, 1.76 | 1.59 | 1.19, 2.13 | 29.19 | <0.01 |
| At diagnosis only | 9 | 1.46 | 1.19, 1.80 | 1.03, 2.08 | 1.94 | 1.30, 2.91 | 22.91 | <0.01 |
| Residential proximity to gas stations | 3 | 1.59 | 0.95, 2.67 | 0.70, 3.62 | 1.88 | 0.78, 4.55 | 5.08 | 0.08 |
Abbreviations: ALL, acute lymphoblastic leukemia; AML, acute myeloid leukemia; CALINE4, California LINE Source Dispersion Model, version 4; CI, confidence interval; NA, not applicable; sRR, summary relative risk.
a The Shore-adjusted and random-effects models were used if the χ2 statistic was greater than the degrees of freedom (the number of studies minus 1).
b Heck et al. (85) contributed 69% of the total weight in the traffic-density analysis.
c Includes studies with more detailed modeling of traffic pollution or ambient air levels of benzene.
d Includes adjusted results and results from studies in which the authors stated that the adjustments had little or no impact on results. Few of these studies were adjusted for tobacco smoking.
Publication bias
No evidence of publication bias was seen in the meta-analysis of all studies of occupational or household product exposures, whether in the funnel plot (Figure 2A), when using the test by Egger et al. (36) (bias coefficient = −0.075; P = 0.93), or when using Begg and Mazumdar's test (35) (P = 0.97). Possible evidence of publication bias is seen in the funnel plot of the traffic-related studies using more detailed models (Figure 2B) (i.e., a lack of studies in lower left corner), although the number of studies is small. No indication of bias was seen using the test by Egger et al. (bias coefficient = 0.61; P = 0.69) or Begg and Mazumdar's test (P = 0.88), and removing the largest study (53) resulted in a pattern less consistent with publication bias (Web Figure 4).
Figure 2.

Funnel plots of studies included in the meta-analyses of benzene and childhood leukemia, 1987–2014. A) Studies of occupational or household product use; and B) studies of more detailed traffic-related pollution models. Funnel plots are graphical representations of the logarithm of each study's relative risk estimate versus the standard error of the logarithm of each study's relative risk estimate. The dotted lines are pseudo 95% confidence intervals.
DISCUSSION
Overall, the present meta-analysis provides new evidence that benzene exposure might be associated with a higher risk of childhood leukemia. Summary relative risks greater than 1.0 were seen for several different potential metrics of benzene exposure, including maternal occupational exposure, household use of benzene-related products, and traffic-related air pollution. This evidence was particularly strong and heterogeneity was particularly low for studies of AML. In our analysis of occupational and household product studies, all 6 AML studies had relative risk estimates greater than 2.0. In our analysis of the traffic-related pollution studies, all 4 AML studies reported relative risk estimates greater than 1.9. Overall, the low P values, confidence intervals that excluded 1.0, and large proportion of individual relative risk estimates greater than 1.0 all provide evidence that our major findings are not due to chance. In addition, the finding of higher relative risks in studies of more direct or detailed indicators of exposure (e.g., exposure to benzene vs. solvents and detailed traffic models vs. simple traffic density models) and the positive results in studies that included adjustment for smoking and socioeconomic status also support the validity of these findings. Our finding of a higher summary relative risk for AML than for ALL is consistent with previous findings in adults (64), which helps supports the biologic plausibility of our results. Although benzene exposures in children are likely lower than those in occupationally exposed adults, there are a variety of reasons that children or fetuses might be particularly susceptible to these exposures, including their undeveloped detoxification or excretion pathways or their markedly higher intakes or inhalation rates per body weight compared with adults (65). These factors and others could explain why children might be affected at lower benzene levels than adults.
Mechanistic studies further support our findings. The higher summary relative risk for maternal versus paternal exposure and the higher summary relative risk for gestational exposure are consistent with a greater association in the fetal period. For childhood ALL and AML, it has been shown that the disease is usually initiated in utero: The leukemic translocations and other genetic changes have been shown to be present in blood spots collected at birth (66–68). Because the genotoxic action of benzene metabolites induces multiple genetic abnormalities, it seems probable that benzene exposure could initiate both AML and ALL in utero by causing the chromosomal rearrangements and mutations that are on the causal pathway to these malignancies in fetal hematopoietic stem cells. This hypothesis is supported by human and animal studies that show the following: 1) benzene and its metabolites cross the placenta into the fetuses of exposed humans and mice (69–71); 2) low levels of benzene exposure alter the growth of myeloid and erythroid progenitor cells in fetal tissue in mice (70) and decrease CD4 and CD8 T-cell counts in neonatal beef calves (72); 3) in utero benzene exposure increases the frequency of micronuclei and DNA recombination events in hematopoietic tissue of fetal and postnatal mice (70, 71, 73, 74); and 4) benzene exposure causes oxidative stress and disrupts hematopoietic cell signaling pathways in the fetal blood progenitor cells of exposed mice (70, 75). Taken together, these data strongly suggest that benzene can initiate childhood leukemia in utero and that early life exposures might cause the leukemic clone to proliferate further.
Most of the studies used here were adjusted or matched for age and sex. The higher summary relative risks in our analyses of studies that included adjustment for smoking or socioeconomic status suggest that these factors did not cause the positive associations seen in our meta-analysis. Overadjustment related to socioeconomic status is possible, although the summary relative risk changed minimally when only studies adjusted for socioeconomic status were examined. Other factors, such as radiation, genetics, and viral infections, have also been linked to childhood leukemia (15). However, we found no clear evidence that these factors were sufficiently prevalent or strongly related to benzene exposure in the studies we reviewed to have caused major confounding. Benzene exposure might be highly correlated with other toxic agents, including other solvents or common air pollutants (63). For this reason, our findings might not represent the effects of benzene and could be due to these other factors. For example, air pollution can contain a number of carcinogenic agents, including diesel exhaust and polycyclic aromatic hydrocarbons. Less research has been done on these other agents than on benzene, so the possibility that some other agent is responsible for some or all of the associations we identified cannot be ruled out. However, benzene seems the most plausible agent because it, and not these other agents, has been clearly linked to leukemia in exposed adults (1). The strong links between benzene and leukemia in adults, the data on biologic plausibility presented in previous studies, and the fact that we identified elevated summary relative risks for a variety of different potential benzene exposure metrics combine to support the hypothesis that benzene is responsible for the associations identified here.
None of the studies included in this meta-analysis involved personal prospective measurements of benzene exposure. Most of the occupational studies used self-reports of job histories and expert evaluations or self-reports of specific exposures. Self-reported job histories have been shown to correlate reasonably well with company, pension, or union records (76). Results of some studies have also shown fairly good agreement between self-reported exposures and industrial hygiene measurements, employer reports, and expert evaluations (77, 78), although results varied widely across studies (76). For traffic-related exposure studies, Raaschou-Nielsen et al. (79) reported a correlation of 0.55 for the association between traffic density and weekly average benzene air concentrations, which rose to 0.68 when more complex models that included street configuration and meteorological data were used. In other studies, investigators have reported somewhat similar correlations for yearly mean and yearly median benzene concentrations (57, 80). It is important to note that because in all of the included studies exposure was assessed similarly in cases and controls, most exposure misclassification likely biased results towards finding no association. Our use of studies that included different exposure metrics might have caused some bias. However, some metrics are likely to be better indicators of true exposure than others, and including less accurate metrics would most likely bias results towards the null. That we found a lower summary relative risk in studies in which all solvents were assessed together than in those in which only benzene was assessed and that we found a lower summary relative risk in studies of simple traffic density than in those that included more detailed metrics of traffic pollution might be evidence of this bias. This might also explain why we saw a higher summary relative risk for gestational exposures in our analysis of studies of occupational and household product exposure (sRR = 1.91) than in our analysis of exposures at birth in the traffic studies (sRR = 0.92). Because most studies of traffic exposure at birth were based on the residence listed on the birth certificate and studies have shown that many women change residences during pregnancy (9%–32%) (81), exposure misclassification in these studies might have caused some bias towards the null.
There was some suggestion of publication bias in the funnel plot of studies that included more detailed assessments of traffic-related air pollution (Figure 2B). However, closer inspection suggests that this might be due to the largest study (Badaloni et al. (53)) rather than publication bias, which typically affects smaller studies. In that study, the authors reported an odds ratio of 1.30 (95% CI: 0.97, 2.12) and used land-use regression models to estimate nitrogen dioxide exposure. Although residences before diagnosis were assessed, data from the traffic pollution models were obtained 4–7 years after case diagnosis (53). Although publication bias cannot be entirely excluded, the fact that this large study affected the interpretation of the funnel plot highlights the possibility that the funnel plot asymmetry might be due to other factors.
In several of the studies used in the present meta-analysis, benzene exposure was assessed based on self-reports, and thus the studies were susceptible to recall bias. This bias could cause false associations if the parents of case children were more likely to recall past exposures than were parents of controls. Our finding of an elevated summary relative risk for studies of benzene but not for studies of all solvents (Table 3) provides some evidence that this was generally not the case. Using retrospectively collected information about occupations and self-reported exposure to solvents and other agents, the authors of a large case-control study of parental occupation and childhood cancer found some evidence of this type of bias. However, the results suggested that its magnitude was small (i.e., causing relative risks between 1.1 and 1.2), and the authors concluded that “… it is unlikely that recall bias can entirely explain associations in the order of 1.5–2.0” (82, p. 715). In another comprehensive review of recall bias, the authors also concluded that this issue was unlikely to cause major bias in occupational studies (76).
Our results generally agree with those from several previous meta-analyses (29, 83, 84). For example, in a meta-analysis of 8 studies of traffic density published up to July 2011, Boothe et al. (83) reported a summary odds ratio for leukemia of 1.53 (95% CI: 1.12, 2.10) for postnatal exposures. This is similar to the summary relative risk of 1.46 (95% CI: 1.03, 2.08) that we reported for a collection of studies that included studies of traffic density, studies of more complex traffic pollution models, 4 studies published since 2011, and findings by leukemia subtype. In a meta-analysis, Zhou et al. (84) reported a pooled odds ratio for ALL and solvents of 1.25 (95% CI: 1.09, 1.45), but they did not evaluate AML or specific data on benzene.
In conclusion, although confounding, recall bias, and publication bias are possible, the overall findings of the present meta-analysis provide evidence that exposure to benzene is associated with childhood leukemia. Both laboratory research and epidemiologic findings in adults support the associations found here. Our findings suggest that future studies on this issue should examine specific subtypes of leukemia, include maternal exposures during gestation, and involve exposure assessment methods that focus more directly on benzene. Occupational and environmental exposure to benzene is widespread, and leukemia is the most common type of cancer in children. Our findings could help guide future research and policies that could eventually help reduce the worldwide burden of this cancer.
Supplementary Material
ACKNOWLEDGMENTS
Author affiliations: Superfund Research Program, School of Public Health, University of California, Berkeley, Berkeley, California (Frolayne M. Carlos-Wallace, Luoping Zhang, Martyn T. Smith, Gabriella Rader, Craig Steinmaus); and Office of Environmental Health Hazard Assessment, California Environmental Protection Agency, Oakland, California (Craig Steinmaus).
F.M.C.-W. was supported by funds provided to the University of California, Berkeley, by the Council for Education and Research on Toxics. This work was supported in part by National Institute of Environmental Health Sciences grant P42ES004705.
The views expressed are those of the authors and do not necessarily represent those of the Office of Environmental Health Hazard Assessment, the California Environmental Protection Agency, or the State of California.
F.M.C.-W. sits on the advisory board of the Filipino American Coalition for Environmental Solidarity. M.T.S. has received consulting and expert testimony fees from law firms representing both plaintiffs and defendants in cases involving exposure to benzene. Other authors have no potential conflicts of interest.
APPENDIX
Inclusion and Exclusion Criteria for Studies in the Meta-Analysis of Benzene and Childhood Cancer, 1987–2014
Inclusion Criteria
Was epidemiologic in nature and assessed childhood leukemia (younger than 20 years of age) and benzene exposure
Assessed occupational or home benzene exposure or a surrogate of benzene exposure, including aromatic hydrocarbon use, solvent use, petroleum product use, residential proximity to gas stations or automotive repair facilities, work in an automotive repair shop or gas station, residential traffic density, and modeled residential ambient traffic pollution or air benzene concentrations
Was published in a peer-reviewed journal
Provided a relative risk estimate and variance estimate for leukemia incidence or the data to estimate them
For studies with overlapping populations, 1 result was selected based on the following factors in the following order: most appropriate exposure metric, leukemia type, higher exposure category, type of parental exposure, exposure period, largest number of cases, or statistical adjustment (details in Web Figures 1 and 2 and in the Methods section).
Exclusion Criteria
Assessed exposure only after a cancer diagnosis
Did not report relative risk or variance estimates or the data to calculate them
Reported on only leukemia mortality
Included smoking as the sole benzene source
Was published only in a government or industry report or as an abstract
Was conducted in populations with another potential major risk factor for leukemia (e.g., Down syndrome or residence near power lines)
Involved broad occupational categories (e.g., drivers or painters) or unclear exposure situations (e.g., residential proximity to a petrochemical plant or hazardous air pollution scores)
REFERENCES
- 1.Smith MT. Advances in understanding benzene health effects and susceptibility. Annu Rev Public Health. 2010;31:133–148. [DOI] [PMC free article] [PubMed] [Google Scholar]
- 2.McHale CM, Zhang L, Smith MT. Current understanding of the mechanism of benzene-induced leukemia in humans: implications for risk assessment. Carcinogenesis. 2012;332:240–252. [DOI] [PMC free article] [PubMed] [Google Scholar]
- 3.Baan R, Grosse Y, Straif K, et al. A review of human carcinogens—Part F: chemical agents and related occupations. Lancet Oncol. 2009;1012:1143–1144. [DOI] [PubMed] [Google Scholar]
- 4.Kaatsch P. Epidemiology of childhood cancer. Cancer Treat Rev. 2010;364:277–285. [DOI] [PubMed] [Google Scholar]
- 5.Eden T. Aetiology of childhood leukaemia. Cancer Treat Rev. 2010;364:286–297. [DOI] [PubMed] [Google Scholar]
- 6.Howlader N, Noone AM, Krapcho M, et al. eds. SEER Cancer Statistics Review, 1975–2010. Bethesda, MD: National Cancer Institute; http://seer.cancer.gov/csr/1975_2010/ Published April 2013. Updated June 14, 2013. Accessed March 1, 2015. [Google Scholar]
- 7.Liu R, Zhang L, McHale CM, et al. Paternal smoking and risk of childhood acute lymphoblastic leukemia: systematic review and meta-analysis. J Oncol. 2011;2011:854584. [DOI] [PMC free article] [PubMed] [Google Scholar]
- 8.Abadi-Korek I, Stark B, Zaizov R, et al. Parental occupational exposure and the risk of acute lymphoblastic leukemia in offspring in Israel. J Occup Environ Med. 2006;482:165–174. [DOI] [PubMed] [Google Scholar]
- 9.Castro-Jiménez MA, Orozco-Vargas LC. Parental exposure to carcinogens and risk for childhood acute lymphoblastic leukemia, Colombia, 2000–2005. Prev Chronic Dis. 2011;85:A106. [PMC free article] [PubMed] [Google Scholar]
- 10.Scélo G, Metayer C, Zhang L, et al. Household exposure to paint and petroleum solvents, chromosomal translocations, and the risk of childhood leukemia. Environ Health Perspect. 2009;1171:133–139. [DOI] [PMC free article] [PubMed] [Google Scholar]
- 11.Slater ME, Linabery AM, Spector LG, et al. Maternal exposure to household chemicals and risk of infant leukemia: a report from the Children's Oncology Group. Cancer Causes Control. 2011;228:1197–1204. [DOI] [PMC free article] [PubMed] [Google Scholar]
- 12.Steffen C, Auclerc MF, Auvrignon A, et al. Acute childhood leukaemia and environmental exposure to potential sources of benzene and other hydrocarbons; a case-control study. Occup Environ Med. 2004;619:773–778. [DOI] [PMC free article] [PubMed] [Google Scholar]
- 13.Greenland S. Causation and causal inference. In: Rothman K, Greenland S, eds. Modern Epidemiology. 2nd ed Philadelphia, PA: Lippincott Raven; 1998:7–28. [Google Scholar]
- 14.Anderson LM. Environmental genotoxicants/carcinogens and childhood cancer: bridgeable gaps in scientific knowledge. Mutat Res. 2006;6082:136–156. [DOI] [PubMed] [Google Scholar]
- 15.Belson M, Kingsley B, Holmes A. Risk factors for acute leukemia in children: a review. Environ Health Perspect. 2007;1151:138–145. [DOI] [PMC free article] [PubMed] [Google Scholar]
- 16.Buffler PA, Kwan ML, Reynolds P, et al. Environmental and genetic risk factors for childhood leukemia: appraising the evidence. Cancer Invest. 2005;231:60–75. [PubMed] [Google Scholar]
- 17.Colt JS, Blair A. Parental occupational exposures and risk of childhood cancer. Environ Health Perspect. 1998;106(suppl 3):909–925. [DOI] [PMC free article] [PubMed] [Google Scholar]
- 18.McBride ML. Childhood cancer and environmental contaminants. Can J Public Health. 1998;89(suppl 1):S53–S62. [PubMed] [Google Scholar]
- 19.McNally RJ, Parker L. Environmental factors and childhood acute leukemias and lymphomas. Leuk Lymphoma. 2006;474:583–598. [DOI] [PubMed] [Google Scholar]
- 20.O'Leary LM, Hicks AM, Peters JM, et al. Parental occupational exposures and risk of childhood cancer: a review. Am J Ind Med. 1991;201:17–35. [DOI] [PubMed] [Google Scholar]
- 21.Pyatt D, Hays S. A review of the potential association between childhood leukemia and benzene. Chem Biol Interact. 2010;184(1-2):151–164. [DOI] [PubMed] [Google Scholar]
- 22.Raaschou-Nielsen O, Reynolds P. Air pollution and childhood cancer: a review of the epidemiological literature. Int J Cancer. 2006;11812:2920–2929. [DOI] [PubMed] [Google Scholar]
- 23.Savitz DA, Andrews KW. Review of epidemiologic evidence on benzene and lymphatic and hematopoietic cancers. Am J Ind Med. 1997;313:287–295. [DOI] [PubMed] [Google Scholar]
- 24.Savitz DA, Chen JH. Parental occupation and childhood cancer: review of epidemiologic studies. Environ Health Perspect. 1990;88:325–337. [DOI] [PMC free article] [PubMed] [Google Scholar]
- 25.Smith MT, Zhang L, McHale CM, et al. Benzene, the exposome and future investigations of leukemia etiology. Chem Biol Interact. 2011;192(1-2):155–159. [DOI] [PMC free article] [PubMed] [Google Scholar]
- 26.US Environmental Protection Agency. Benzene: TEACH chemical summary. Toxicity and Exposure Assessments for Children's Health. Chicago, IL: US Environmental Protection Agency; 2009. [Google Scholar]
- 27.Agency for Toxic Substances and Disease Registry. Toxicological Profile for Benzene. Atlanta, GA: US Department of Health and Human Services, Public Health Service, Agency for Toxic Substances and Disease Registry; 2007. [Google Scholar]
- 28.Milne E, Greenop KR, Scott RJ, et al. Parental prenatal smoking and risk of childhood acute lymphoblastic leukemia. Am J Epidemiol. 2012;1751:43–53. [DOI] [PubMed] [Google Scholar]
- 29.Sun XX, Zhang SS, Ma XL. No association between traffic density and risk of childhood leukemia: a meta-analysis. Asian Pac J Cancer Prev. 2014;1513:5229–5232. [DOI] [PubMed] [Google Scholar]
- 30.Pyatt D. Benzene and hematopoietic malignancies. Clin Occup Environ Med. 2004;43:529–555, vii. [DOI] [PubMed] [Google Scholar]
- 31.McKinney PA, Alexander FE, Cartwright RA, et al. Parental occupations of children with leukaemia in west Cumbria, north Humberside, and Gateshead. BMJ. 1991;3026778:681–687. [DOI] [PMC free article] [PubMed] [Google Scholar]
- 32.DerSimonian R, Laird N. Meta-analysis in clinical trials. Control Clin Trials. 1986;73:177–188. [DOI] [PubMed] [Google Scholar]
- 33.Petitti D. 1999. Meta-Analysis, Decision Analysis, and Cost-Effectiveness Analysis: Methods for Quantitative Synthesis in Medicine. 2nd ed New York, NY: Oxford University Press. [Google Scholar]
- 34.Shore RE, Gardner MJ, Pannett B. Ethylene oxide: an assessment of the epidemiological evidence on carcinogenicity. Br J Ind Med. 1993;5011:971–997. [DOI] [PMC free article] [PubMed] [Google Scholar]
- 35.Begg CB, Mazumdar M. Operating characteristics of a rank correlation test for publication bias. Biometrics. 1994;504:1088–1101. [PubMed] [Google Scholar]
- 36.Egger M, Davey Smith G, Schneider M, et al. Bias in meta-analysis detected by a simple, graphical test. BMJ. 1997;3157109:629–634. [DOI] [PMC free article] [PubMed] [Google Scholar]
- 37.Feingold L, Savitz DA, John EM. Use of a job-exposure matrix to evaluate parental occupation and childhood cancer. Cancer Causes Control. 1992;32:161–169. [DOI] [PubMed] [Google Scholar]
- 38.Feychting M, Plato N, Nise G, et al. Paternal occupational exposures and childhood cancer. Environ Health Perspect. 2001;1092:193–196. [DOI] [PMC free article] [PubMed] [Google Scholar]
- 39.Infante-Rivard C, Siemiatycki J, Lakhani R, et al. Maternal exposure to occupational solvents and childhood leukemia. Environ Health Perspect. 2005;1136:787–792. [DOI] [PMC free article] [PubMed] [Google Scholar]
- 40.Reid A, Glass DC, Bailey HD, et al. Parental occupational exposure to exhausts, solvents, glues and paints, and risk of childhood leukemia. Cancer Causes Control. 2011;2211:1575–1585. [DOI] [PubMed] [Google Scholar]
- 41.Shu XO, Gao YT, Brinton LA, et al. A population-based case-control study of childhood leukemia in Shanghai. Cancer. 1988;623:635–644. [DOI] [PubMed] [Google Scholar]
- 42.Shu XO, Stewart P, Wen WQ, et al. Parental occupational exposure to hydrocarbons and risk of acute lymphocytic leukemia in offspring. Cancer Epidemiol Biomarkers Prev. 1999;89:783–791. [PubMed] [Google Scholar]
- 43.Miligi L, Benvenuti A, Mattioli S, et al. Risk of childhood leukaemia and non-Hodgkin's lymphoma after parental occupational exposure to solvents and other agents: the SETIL Study. Occup Environ Med. 2013;709:648–655. [DOI] [PubMed] [Google Scholar]
- 44.Buckley JD, Robison LL, Swotinsky R, et al. Occupational exposures of parents of children with acute nonlymphocytic leukemia: a report from the Childrens Cancer Study Group. Cancer Res. 1989;4914:4030–4037. [PubMed] [Google Scholar]
- 45.Cocco P, Rapallo M, Targhetta R, et al. Analysis of risk factors in a cluster of childhood acute lymphoblastic leukemia. Arch Environ Health. 1996;513:242–244. [DOI] [PubMed] [Google Scholar]
- 46.Infante-Rivard C, Mur P, Armstrong B, et al. Acute lymphoblastic leukaemia among Spanish children and mothers’ occupation: a case-control study. J Epidemiol Community Health. 1991;451:11–15. [DOI] [PMC free article] [PubMed] [Google Scholar]
- 47.McKinney PA, Raji OY, van Tongeren M, et al. The UK Childhood Cancer Study: maternal occupational exposures and childhood leukaemia and lymphoma. Radiat Prot Dosimetry. 2008;1322:232–240. [DOI] [PubMed] [Google Scholar]
- 48.Smulevich VB, Solionova LG, Belyakova SV. Parental occupation and other factors and cancer risk in children: II. Occupational factors. Int J Cancer. 1999;836:718–722. [DOI] [PubMed] [Google Scholar]
- 49.Lowengart RA, Peters JM, Cicioni C, et al. Childhood leukemia and parents’ occupational and home exposures. J Natl Cancer Inst. 1987;791:39–46. [PubMed] [Google Scholar]
- 50.Perez-Saldivar ML, Ortega-Alvarez MC, Fajardo-Gutierrez A, et al. Father's occupational exposure to carcinogenic agents and childhood acute leukemia: a new method to assess exposure (a case-control study). BMC Cancer. 2008;8:7. [DOI] [PMC free article] [PubMed] [Google Scholar]
- 51.Kishi R, Katakura Y, Yuasa J, et al. Association of parents’ occupational exposure to cancer in children. A case-control study of acute lymphoblastic leukemia [in Japanese] Sangyo Igaku. 1993;356:515–529. [DOI] [PubMed] [Google Scholar]
- 52.Amigou A, Sermage-Faure C, Orsi L, et al. Road traffic and childhood leukemia: the ESCALE Study (SFCE). Environ Health Perspect. 2011;1194:566–572. [DOI] [PMC free article] [PubMed] [Google Scholar]
- 53.Badaloni C, Ranucci A, Cesaroni G, et al. Air pollution and childhood leukaemia: a nationwide case-control study in Italy. Occup Environ Med. 2013;7012:876–883. [DOI] [PubMed] [Google Scholar]
- 54.Crosignani P, Tittarelli A, Borgini A, et al. Childhood leukemia and road traffic: a population-based case-control study. Int J Cancer. 2004;1084:596–599. [DOI] [PubMed] [Google Scholar]
- 55.Harrison RM, Leung PL, Somervaille L, et al. Analysis of incidence of childhood cancer in the West Midlands of the United Kingdom in relation to proximity to main roads and petrol stations. Occup Environ Med. 1999;5611:774–780. [DOI] [PMC free article] [PubMed] [Google Scholar]
- 56.Raaschou-Nielsen O, Hertel O, Thomsen BL, et al. Air pollution from traffic at the residence of children with cancer. Am J Epidemiol. 2001;1535:433–443. [DOI] [PubMed] [Google Scholar]
- 57.Vinceti M, Rothman KJ, Crespi CM, et al. Leukemia risk in children exposed to benzene and PM10 from vehicular traffic: a case-control study in an Italian population. Eur J Epidemiol. 2012;2710:781–790. [DOI] [PMC free article] [PubMed] [Google Scholar]
- 58.Visser O, van Wijnen JH, van Leeuwen FE. Residential traffic density and cancer incidence in Amsterdam, 1989–1997. Cancer Causes Control. 2004;154:331–339. [DOI] [PubMed] [Google Scholar]
- 59.Brosselin P, Rudant J, Orsi L, et al. Acute childhood leukaemia and residence next to petrol stations and automotive repair garages: the ESCALE Study (SFCE). Occup Environ Med. 2009;669:598–606. [DOI] [PubMed] [Google Scholar]
- 60.Heck JE, Park AS, Qiu J, et al. Risk of leukemia in relation to exposure to ambient air toxics in pregnancy and early childhood. Int J Hyg Environ Health. 2014;2176:662–668. [DOI] [PMC free article] [PubMed] [Google Scholar]
- 61.Langholz B, Ebi KL, Thomas DC, et al. Traffic density and the risk of childhood leukemia in a Los Angeles case-control study. Ann Epidemiol. 2002;127:482–487. [DOI] [PubMed] [Google Scholar]
- 62.Pearson RL, Wachtel H, Ebi KL. Distance-weighted traffic density in proximity to a home is a risk factor for leukemia and other childhood cancers. J Air Waste Manag Assoc. 2000;502:175–180. [DOI] [PubMed] [Google Scholar]
- 63.Whitworth KW, Symanski E, Coker AL. Childhood lymphohematopoietic cancer incidence and hazardous air pollutants in southeast Texas, 1995–2004. Environ Health Perspect. 2008;11611:1576–1580. [DOI] [PMC free article] [PubMed] [Google Scholar]
- 64.Vlaanderen J, Lan Q, Kromhout H, et al. Occupational benzene exposure and the risk of lymphoma subtypes: a meta-analysis of cohort studies incorporating three study quality dimensions. Environ Health Perspect. 2011;1192:159–167. [DOI] [PMC free article] [PubMed] [Google Scholar]
- 65.Miller MD, Marty AM, Arcus A, et al. Differences between children and adults: implications for risk assessment at California EPA. Int J Toxicol. 2001;215:403–418. [DOI] [PubMed] [Google Scholar]
- 66.Greaves MF, Wiemels J. Origins of chromosome translocations in childhood leukaemia. Nat Rev Cancer. 2003;39:639–649. [DOI] [PubMed] [Google Scholar]
- 67.Wiemels JL, Cazzaniga G, Daniotti M, et al. Prenatal origin of acute lymphoblastic leukaemia in children. Lancet. 1999;3549189:1499–1503. [DOI] [PubMed] [Google Scholar]
- 68.McHale CM, Wiemels JL, Zhang L, et al. Prenatal origin of TEL-AML1-positive acute lymphoblastic leukemia in children born in California. Genes Chromosomes Cancer. 2003;371:36–43. [DOI] [PubMed] [Google Scholar]
- 69.Dowty BJ, Laseter JL, Storer J. The transplacental migration and accumulation in blood of volatile organic constituents. Pediatr Res. 1976;107:696–701. [DOI] [PubMed] [Google Scholar]
- 70.Badham HJ, Winn LM. In utero exposure to benzene disrupts fetal hematopoietic progenitor cell growth via reactive oxygen species. Toxicol Sci. 2010;1131:207–215. [DOI] [PubMed] [Google Scholar]
- 71.Ciranni R, Barale R, Marrazzini A, et al. Benzene and the genotoxicity of its metabolites. I. Transplacental activity in mouse fetuses and in their dams. Mutat Res. 1988;2081:61–67. [DOI] [PubMed] [Google Scholar]
- 72.Bechtel DG, Waldner CL, Wickstrom M. Associations between in utero exposure to airborne emissions from oil and gas production and processing facilities and immune system outcomes in neonatal beef calves. Arch Environ Occup Health. 2009;641:59–71. [DOI] [PubMed] [Google Scholar]
- 73.Lau A, Belanger CL, Winn LM. In utero and acute exposure to benzene: investigation of DNA double-strand breaks and DNA recombination in mice. Mutat Res. 2009;676(1-2):74–82. [DOI] [PubMed] [Google Scholar]
- 74.Ning H, Kado NY, Kuzmicky PA, et al. Benzene-induced micronuclei formation in mouse fetal liver blood, peripheral blood, and maternal bone marrow cells. Environ Mol Mutagen. 1991;181:1–5. [DOI] [PubMed] [Google Scholar]
- 75.Stokes SE, Winn LM. NF-κB signaling is increased in HD3 cells following exposure to 1,4-benzoquinone: role of reactive oxygen species and p38-MAPK. Toxicol Sci. 2014;1372:303–310. [DOI] [PubMed] [Google Scholar]
- 76.Teschke K, Olshan AF, Daniels JL, et al. Occupational exposure assessment in case-control studies: opportunities for improvement. Occup Environ Med. 2002;599:575–593. [DOI] [PMC free article] [PubMed] [Google Scholar]
- 77.Ahlborg GA., Jr Validity of exposure data obtained by questionnaire. Two examples from occupational reproductive studies. Scand J Work Environ Health. 1990;164:284–288. [DOI] [PubMed] [Google Scholar]
- 78.Hertzman C, Teschke K, Dimich-Ward H, et al. Validity and reliability of a method for retrospective evaluation of chlorophenate exposure in the lumber industry. Am J Ind Med. 1988;146:703–713. [DOI] [PubMed] [Google Scholar]
- 79.Raaschou-Nielsen O, Hertel O, Vignati E, et al. An air pollution model for use in epidemiological studies: evaluation with measured levels of nitrogen dioxide and benzene. J Expo Anal Environ Epidemiol. 2000;101:4–14. [DOI] [PubMed] [Google Scholar]
- 80.Reynolds P, Von Behren J, Gunier RB, et al. Residential exposure to traffic in California and childhood cancer. Epidemiology. 2004;151:6–12. [DOI] [PubMed] [Google Scholar]
- 81.Bell ML, Belanger K. Review of research on residential mobility during pregnancy: consequences for assessment of prenatal environmental exposures. J Expo Sci Environ Epidemiol. 2012;225:429–438. [DOI] [PMC free article] [PubMed] [Google Scholar]
- 82.Schüz J, Spector LG, Ross JA. Bias in studies of parental self-reported occupational exposure and childhood cancer. Am J Epidemiol. 2003;1587:710–716. [DOI] [PubMed] [Google Scholar]
- 83.Boothe VL, Boehmer TK, Wendel AM, et al. Residential traffic exposure and childhood leukemia: a systematic review and meta-analysis. Am J Prev Med. 2014;464:413–422. [DOI] [PMC free article] [PubMed] [Google Scholar]
- 84.Zhou Y, Zhang S, Li Z, et al. Maternal benzene exposure during pregnancy and risk of childhood acute lymphoblastic leukemia: a meta-analysis of epidemiologic studies. PLoS One. 2014;910:e110466. [DOI] [PMC free article] [PubMed] [Google Scholar]
- 85.Heck JE, Wu J, Lombardi C, et al. Childhood cancer and traffic-related air pollution exposure in pregnancy and early life. Environ Health Perspect. 2013;121(11–12):1385–1391. [DOI] [PMC free article] [PubMed] [Google Scholar]
Associated Data
This section collects any data citations, data availability statements, or supplementary materials included in this article.