

Abstract
Behavioral studies have reported reduced spatial attention in amblyopia, a developmental disorder of spatial vision. However, the neural populations in the visual cortex linked with these behavioral spatial attention deficits have not been identified. Here, we use functional MRI–informed electroencephalography source imaging to measure the effect of attention on neural population activity in the visual cortex of human adult strabismic amblyopes who were stereoblind. We show that compared with controls, the modulatory effects of selective visual attention on the input from the amblyopic eye are substantially reduced in the primary visual cortex (V1) as well as in extrastriate visual areas hV4 and hMT+. Degraded attentional modulation is also found in the normal-acuity fellow eye in areas hV4 and hMT+ but not in V1. These results provide electrophysiological evidence that abnormal binocular input during a developmental critical period may impact cortical connections between the visual cortex and higher level cortices beyond the known amblyopic losses in V1 and V2, suggesting that a deficit of attentional modulation in the visual cortex is an important component of the functional impairment in amblyopia. Furthermore, we find that degraded attentional modulation in V1 is correlated with the magnitude of interocular suppression and the depth of amblyopia. These results support the view that the visual suppression often seen in strabismic amblyopia might be a form of attentional neglect of the visual input to the amblyopic eye.
Keywords: attentional neglect, electroencephalography source imaging, interocular suppression, V1 extrastriate cortex
Introduction
Amblyopia (“lazy eye”) is a visual impairment secondary to abnormal visual experience during early childhood. About 3% of the population suffers from this disorder. The causes can be strabismus (crossed eye), anisometropia (unequal refractive error in the two eyes), or form deprivation (congenital cataract or ptosis). For more than half a century, the neural basis of amblyopia in humans has been studied with animal models. Much of this work has indicated that the amblyopic deficits due to strabismus and/or anisometropia are largely cortical, mainly located in early cortical areas V1 and V2 (Bi et al., 2011; Chino, Bi, & Zhang, 2004; Kiorpes, Kiper, O'Keefe, Cavanaugh, & Movshon, 1998; Kiorpes & Movshon, 2003; Movshon et al., 1987; Schmidt & Lowel, 2008; Shooner et al., 2015; Tychsen, Wong, & Burkhalter, 2004). These deficits include fewer fine-scale (high spatial frequency) neurons driven by the amblyopic eye, physiological and anatomical disruption of binocular organization, and interocular suppression. Importantly, these studies have reported that the cortical abnormalities in V1 and V2 do not entirely explain the behavioral deficits associated with the amblyopic eye, suggesting that additional losses must arise beyond V1 and V2 (Kiorpes, 2006; Shooner et al., 2015). Indeed, in a large body of tasks that activate the extrastriate cortex, amblyopic individuals showed abnormal performance as assessed by behavioral measures (Chandna, Pennefather, Kovacs, & Norcia, 2001; Hess, McIlhagga, & Field, 1997; Ho & Giaschi, 2006; Ho et al., 2006; Kovacs, Polat, Pennefather, Chandna, & Norcia, 2000; Popple & Levi, 2000; Simmers, Ledgeway, & Hess, 2005; Simmers, Ledgeway, Hess, & McGraw, 2003; Simmers, Ledgeway, Mansouri, Hutchinson, & Hess, 2006; Tripathy & Levi, 2008), functional imaging (Ho & Giaschi, 2009; Lerner et al., 2003, 2006; Muckli et al., 2006; Secen, Culham, Ho, & Giaschi, 2011; Thompson, Villeneuve, Casanova, & Hess, 2012; Wang et al., 2012), and electrophysiological measures (Hou, Pettet, & Norcia, 2008, 2014). These extrastriate deficits appear more severe in strabismic amblyopes than in anisometropic amblyopes (Ho & Giaschi, 2009; Wang et al., 2012). The normal-acuity fellow eye also showed abnormal performance for motion tasks (Aaen-Stockdale, Ledgeway, & Hess, 2007; Davis et al., 2008; Giaschi, Regan, Kraft, & Hong, 1992; Ho & Giaschi, 2007, 2009; Ho et al., 2005; Hou et al., 2008; Secen et al., 2011; Simmers et al., 2003) and for stimuli defined by illusory contours (Hou et al., 2014). The fellow eye deficits were seen more often in strabismic amblyopes than in anisometropic amblyopes (Hou et al., 2014).
Furthermore, a number of behavioral studies have reported deficits in the amblyopic eye for tasks demanding spatial attention: object tracking (Ho & Giaschi, 2009; Ho et al., 2006; Secen et al., 2011; Tripathy & Levi, 2008), object enumeration (Sharma, Levi, & Klein, 2000), attentional blink (Popple & Levi, 2008), decision making (Farzin & Norcia, 2011), and line bisection (Thiel & Sireteanu, 2009). The abnormal performances on these tasks suggest that functional connections between the visual cortex and the posterior parietal and frontal cortices may be degraded due to abnormal visual development during a critical period in amblyopes because the posterior parietal (Battelli et al., 2001; Culham et al., 1998) and frontal (Gold & Shadlen, 2007; Heekeren, Marrett, & Ungerleider, 2008) cortices are believed to underlie attention and decision-making processes, respectively. The first goal of our study was to determine whether there are modulatory effects of spatial attention in the visual cortex of humans with naturally occurring amblyopia due to strabismus. Because visual input from the amblyopic eye is often ignored during visual development, we speculated that a long-term attentional neglect of the visual input to the amblyopic eye may weaken the modulatory effects of selective attention in the visual cortex. The effect of selective visual attention can be measured as enhanced neural responses in the visual cortex to attended stimuli (Desimone & Duncan, 1995; Kim & Verghese, 2012; Lauritzen, Ales, & Wade, 2010; Reynolds & Chelazzi, 2004; Verghese, Kim, & Wade, 2012). Thus, in the present study, we used functional magnetic resonance imaging (MRI)-informed electroencephalography (EEG) source-imaging methods (Kim & Verghese, 2012; Lauritzen et al., 2010; Verghese et al., 2012) to measure attentional modulation of neural population activity in V1 and the extrastriate cortex in a group of human adult strabismic amblyopes as well as controls.
The second goal of our study was to investigate whether there is a correlation between degraded attentional modulation of the visual cortex and amblyopic suppression. For example, in the case of strabismus, where the two eyes point in different directions, visual perception from the deviating eye typically is suppressed to eliminate visual confusion due to diplopia (double vision). This chronic suppression of the nonpreferred eye is believed by some to be responsible for the development of amblyopia (Hess, Thompson, & Baker, 2014; Jampolsky, 1955; Sireteanu, 1982b; Travers, 1938). Physiological studies in strabismic animals have shown that interocular suppression is robust in V1 (Bi et al., 2011; Sengpiel & Blakemore, 1994; Sengpiel, Jirmann, Vorobyov, & Eysel, 2006; Zhang et al., 2005) and V2 (Bi et al., 2011) and that the magnitude of interocular suppression in individual monkeys was correlated with the depth of their amblyopia (Bi et al., 2011). As a result of suppression, humans with early onset (i.e., during early childhood) strabismus rarely are aware of double vision unless they attend to the input from the amblyopic eye. However, little is known about the mechanisms of how the brain suppresses the visual input from the amblyopic eye. Perhaps the perception of the amblyopic eye is ignored while the perception of the fellow eye is attended. Support for this conjecture comes from both single-unit studies in monkey and functional MRI studies in humans, which report that visual attention operates through facilitation of responses at the attended location and suppression of responses at the unattended location (Moran & Desimone, 1985; Motter, 1993; Slotnick, Schwarzbach, & Yantis, 2003). These findings open the possibility that amblyopic suppression may be a form of attentional neglect of visual input from the amblyopic eye. If so, feedback from higher level cortical areas, such as selective visual attention, may be partially responsible for the early cortical visual area deficits in strabismic amblyopia. To test this hypothesis, we used visual psychophysics to measure interocular suppression in strabismic amblyopes and then determined whether suppression was correlated with the strength of attentional modulation of neural populations in the early visual cortex.
Method
Participants
Thirteen patients with strabismic amblyopia (amblyopes) between 24 and 62 years of age (mean ± SD: 42.5 ± 12.9; six males, seven females) and 12 observers with normal vision (controls) between 25 and 60 years of age (mean ± SD: 40.1 ± 9.82; seven males, five females) participated. All participants were given eye examinations and were refracted under noncycloplegic conditions by a pediatric ophthalmologist before the experiments. Visual acuity was evaluated with a logMAR chart (Bailey-Lovie) and was measured with best optical correction. Controls had acuity corrected to 20/20 or better in each eye and stereoacuity of at least 40 arcsec (random-dot stereo butterfly with 2000 arcsec as maximum measurable stereoacuity; Stereo Optical, Chicago, IL). All strabismic amblyopes had a constant ocular deviation onset before 5 years of age (based on personal report) with or without anisometropia. The fellow eye had 20/20 or better acuity, and the amblyopic eye had an average acuity of 20/60 (mean ± SD: 0.5 ± 0.18 logMAR), with the range between 20/40 and 20/125. Patients with eccentric fixation, latent or manifest nystagmus, and other eye diseases were excluded. All patients had nonmeasurable stereoacuity (worse than 2000 arcsec). Clinical details of the patients are shown in Table 1. Note that the majority of the patients had anisometropia as well as strabismus. The research protocol was approved by the institutional review board of The Smith-Kettlewell Eye Research Institute and conformed to the tenets of the Declaration of Helsinki. Written informed consent was obtained before any testing and after the EEG recording and MRI scan procedures were explained.
Table 1.
Clinical details of the patients. Ocular deviation was measured by cover–uncover test at near distance with best correction. Notes: ET = esotropia; XT = exotropia; L/R = left eye hypertropia; R/L = right eye hypertropia.

EEG experiment
Display
Figure 1 illustrates the EEG stimuli used in this study, which were essentially the same design as in a previous study of attention in normal vision (Lauritzen et al., 2010). The sinusoidal grating stimuli (Figure 1) were presented on a 19W LaCie Electron Blue II cathode ray tube monitor (100-Hz refresh rate; LaCie USA, Hillsboro, OR) driven by a PowerPC MacG4 (Apple Computers, Cupertino, CA). Contrasts here are reported as Michelson luminance contrast with a mean luminance of 32.5 cd/m2. Observers viewed a display with two large gratings presented simultaneously on the left and the right of fixation that flickered on and off at 16.67 and 12.5 Hz, respectively. The gratings had a spatial frequency of 2 cycles/deg and had a pedestal contrast at 50%. A cue (100% valid) indicated whether the observer should attend to the left or the right grating while maintaining central fixation.
Figure 1.
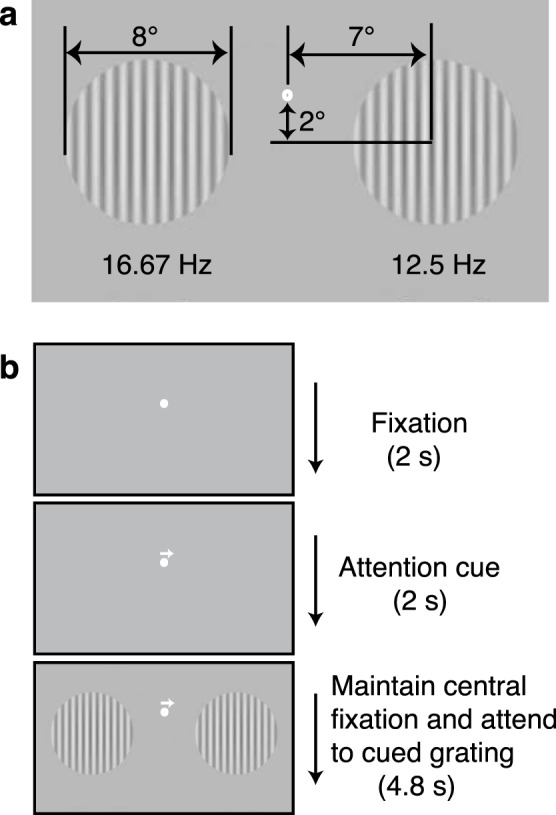
Stimulus layout and trial sequence. (a) Two gratings with different temporal frequencies were presented simultaneously in both the left and right hemifields. (b) Each trial was initiated by a 2-s fixation at the center marker, followed by a central arrow (100% valid cue) indicating the grating to be attended and then a 4.8-s presentation of the flickering gratings. The participant indicated whether a contrast increment was present or absent on the attended grating.
Procedure
Each trial was initiated by a 2-s fixation at the center marker, followed by a central arrow (attention cue) indicating which grating was to be attended and then a 4.8-s presentation of the flickering gratings. Within a block, 40% of trials contained a contrast increment relative to the pedestal contrast (50%) that lasted 1 s and was displayed randomly during the 4.8-s trial. The remaining 60% of trials contained no contrast increment. Trials with and without contrast increments occurred with equal probability in the left and right hemifields. Therefore, each block included six possible conditions—2 attend conditions (left, right) × 3 contrast increment configurations (no increment, increment occurring at one of two times in the 4.8-s trial—that were randomly interleaved. Observers made yes/no judgments that indicated with a button press either the presence or the absence of a contrast increment on the attended (cued) grating. The trials with contrast increment were not analyzed to exclude any potential contamination of the response due to the increment.
Before we initiated our EEG measurements of the influence of attention on neural activity, we determined the contrast increment levels in both the left and right hemifields that produced a detectability of d prime (d′) = 0.6 in each eye of each observer to equate difficulty. Detectability d′ is the z score of the hits minus the z sore of the false alarms (Green & Swets, 1966). Figure 2 plots the contrast increment values used in the EEG experiment for each eye of all observers. On average, the amblyopic eye needed a higher contrast increment to be able to reach a d′ of about 0.6 compared with the fellow eye (p < 0.001, two-tailed paired t test) and the dominant eye and nondominant eye of controls (p < 0.001, two-tailed heteroscedastic t tests). There was no significant difference between the increment values of the fellow eye of the amblyopes and those of the two eyes of controls.
Figure 2.
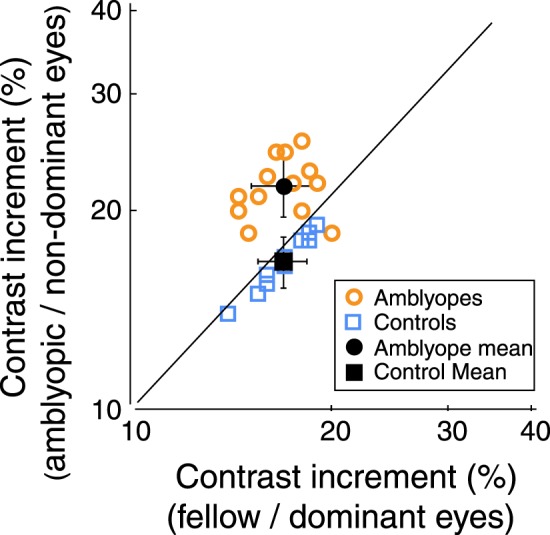
Contrast increment values required for criterion performance for each eye of all participants. The y-axis plots values for the amblyopic eye or the nondominant eye of controls, and the x-axis plots values for the fellow eye of amblyopes or the dominant eye of controls. Filled symbols represent the mean. The solid line indicates a 1:1 ratio between the two eyes. Data above the solid line indicate higher contrast increment values for the amblyopic eye or nondominant eye, and data below the solid line indicate higher contrast increment values for the fellow eye or dominant eye. Note that 12 out of 13 amblyopes required higher contrast increment values in the amblyopic eye to equate performance between the eyes.
EEG data acquisition
EEG was recorded under monocular viewing at a 70-cm distance with the untested eye fully patched. The EEG data were collected with 128-channel HydroCel Sensor Nets (Electrical Geodesics, Eugene, OR). Signals were 0.1-Hz high-pass and 50-Hz (Bessel) low-pass filtered and digitized at 500 Hz. Following the EEG session, the three-dimensional (3D) locations of all electrodes and three major fiducials (nasion, left and right periauricular points) were digitized using a 3Space Fastrack 3D digitizer (Polhemus, Colchester, VT). These 3D digitized locations were used to coregister the electrodes to their T1-weighted anatomical MRI scans. EEG raw data and artifact rejection (including blink rejection and eye movement artifact detection) were evaluated offline based on a sample-by-sample thresholding procedure using the software package designed by the Norcia research group (Ales, Appelbaum, Cottereau, & Norcia, 2013; Cottereau, Ales, & Norcia, 2014b; Cottereau, McKee, Ales, & Norcia, 2011, 2012). Noisy sensors were replaced by the average of the six nearest spatial neighbors. Once noisy sensors were substituted, the EEG was rereferenced to the common average of all the sensors.
Eye movement monitoring
To minimize eye movement artifacts, EEG raw data were monitored and rejected in the following ways. First, EEG epochs that contained a large percentage of data samples exceeding threshold (30 μV), including horizontal and vertical eye channels, were excluded on a sensor-by-sensor basis. This threshold rejected any large eye movements (>∼1.5°) toward the relevant target. We also used the horizontal electro-oculogram, which is the voltage difference between sensors placed at the left and right outer canthi of participants' eyes, to monitor eye movements (Kim & Verghese, 2012; Verghese et al., 2012). Trials from observers whose eye movements were larger than 1° were discarded in a trial-by-trial procedure. Our previous study indicated that with suitable calibration, the horizontal electro-oculogram can reliably detect eye movements as small as 0.5° (Verghese et al., 2012).
Structural and functional MRI and visual area definition
Each observer had structural and functional MRI scanning conducted on a 3T Tim Trio scanner (Siemens, Munich, Germany) using a 12-channel head coil. We measured a T1-weighted MRI data set (3D MP-RAGE sequence, 0.8 × 0.8 × 0.8 mm3) and a 3D T2-weighted data set (spin echo sequence at 1 × 1 × 1 mm3 resolution) for tissue segmentation and registration with the functional scans. For functional MRI, we used a single-shot, gradient-echo EPI sequence. We acquired 30 slices without gaps, positioned between the coronal and axial planes, roughly tangent to the cortical surface near the parieto-occipital sulci at the midline, which maximized cerebral coverage at the expense of the cerebellum.
The FreeSurfer software package (http://surfer.nmr.mgh.harvard.edu) was used to perform gray and white matter segmentation and extraction of the midgray cortical surface that was used for source locations. We made separate models for each observer using the boundary element method, with boundary surfaces derived from the T1- and T2-weighted MRI scans of each observer (Jenkinson, Pechaud, & Smith, 2005; Smith, 2002) using the FMRIB Software Library (http://fsl.fmrib.ox.ac.uk/fsl/). Forward and inverse electrical models were made with MNE (http://martinos.org/mne/stable/index.html) using a standard set of conductances (0.33, 0.025, and 0.33 S/m for the scalp, skull, and brain compartment, respectively). Retinotopic regions of interest (ROI) corresponding to areas in early visual cortical areas V1, V2v, V2d, V3v, V3d, V3a, and hV4 in each hemisphere (Engel, Glover, & Wandell, 1997; Huk & Heeger, 2002; Press, Brewer, Dougherty, Wade, & Wandell, 2001; Sereno et al., 1995; Tootell et al., 1997; Wade, Brewer, Rieger, & Wandell, 2002) were mapped using rotating wedges and expanding rings of contrast-reversing checkerboards (Brewer, Liu, Wade, & Wandell, 2005) created with VISTADISP (http://web.stanford.edu/group/vista/cgi-bin/wiki/index.php/Software#Vistadisp). Stimuli were presented on a liquid crystal display behind the bore, viewed through a mirror at a distance of 122 cm, providing a 14° diameter field of view. ROI corresponding to hMT+ were identified using low-contrast motion stimuli similar to those described by Huk and Heeger (2002).
Cortically constrained inverse
This procedure was described in detail in previous studies (Cottereau et al., 2011; Cottereau, McKee, et al., 2012; Kim & Verghese, 2012; Lauritzen et al., 2010; Verghese et al., 2012). In brief, an L2 minimum norm inverse was computed with sources constrained to the location and orientation of the cortical surface (Hämäläinen, Hari, Ilmoniemi, Knuutila, & Lounasmaa, 1993). In addition, we modified the source covariance matrix to decrease the tendency of the minimum norm procedure to place sources outside of visual areas (Cottereau et al., 2011; Verghese et al., 2012). These constraints involved (a) increasing the variance allowed within the visual areas by a factor of two relative to other vertices and (b) enforcing a local smoothness constraint within an area using the first- and second-order neighborhoods on the mesh with a weighting function equal to 0.5 for the first order and 0.25 for the second (Cottereau, Ales, & Norcia, 2012), which greatly increases the confidence in our estimates of source activity (for review see Cottereau et al., 2014b).
ROI-based analysis
We specifically looked at the ROI in visual areas V1, hV4, and hMT+ because these areas have shown attentional modulation in previous single neuron studies (Martinez-Trujillo & Treue, 2002; Motter, 1993; Reynolds, Pasternak, & Desimone, 2000), human EEG source-imaging studies (Kim & Verghese, 2012; Lauritzen et al., 2010; Verghese et al., 2012), and brain imaging studies (Jack, Shulman, Snyder, McAvoy, & Corbetta, 2006; Sprague & Serences, 2013; Tootell et al., 1998; for review see Corbetta & Shulman, 2002; Yantis & Serences, 2003). A discrete Fourier transform was conducted to estimate the response amplitude associated with each functionally defined ROI (V1, hV4, and hMT+) for each observer. We analyzed the first harmonic component of the stimulus-driven frequencies (16.67 and 12.5 Hz). Responses at 16.67 and 12.5 Hz were separated in the initial coherent averaging in the same observer, but the scalar averaging was conducted in later analysis steps across the observers. In this way, attended and ignored conditions were averaged by combining the data from both frequencies (Lauritzen et al., 2010). To take into account the different noise levels for each observer (Vialatte, Maurice, Dauwels, & Cichocki, 2010), we computed the signal-to-noise ratio (SNR) by dividing peak amplitudes by the associated noise, which was defined for a given frequency by the average amplitude of the two neighbor frequencies (stimulus frequencies ± 0.5 Hz).
Cross-talk in the ROI
The theoretical cross-talk among visual areas V1, hV4, and hMT+ in our study was estimated using the calculation described by Lauritzen et al. (2010) and Cottereau et al. (2011), as seen in Figure 3. Cross-talk refers to the neural activities generated in different areas that are attributed to a particular ROI due to the smoothing of the electric field by the head volume. Ideally, the cortical current densities would show zero cross-talk and the associated matrix would be equal to the identity, but the skull, dura, and intervening media smear our source localization. Nevertheless, the visual areas (V1, hV4, and hMT+) chosen for our study received on average less than 20% cross-talk for both study groups, allowing us to conclude that the results we observed arise predominantly in the designated areas.
Figure 3.

Simulation estimates of cross-talk between source-imaged EEG signals in retinotopically defined ROI. Cross-talk matrix averaged from (a) 12 controls and (b) 13 strabismic amblyopes (b). The columns show activation in the receiving area (j) when a particular seed area (i) is activated. Activation in the seed areas (the diagonal terms) is much stronger than in other areas (off-diagonal terms), indicating that the cross-talk is modest in both observers with normal vision and amblyopic observers within visual areas V1, hV4, and hMT+ reported in the study.
Behavioral experiment
This experiment was specifically designed to measure interocular suppression in individuals with strabismic amblyopia. We presented stimuli of equal contrast in each eye and compared the percept of objects seen monocularly and binocularly. The experiment was conducted in a mirror stereoscope, in which the visual angle was adjustable for strabismic amblyopes so that they could see each screen. Eleven of our 13 amblyopes participated in this experiment.
Display
The stimuli for each eye were presented on two identical cathode ray tube monitors (Sony, Tokyo, Japan). A single stimulus (either a horizontal or a vertical rectangle ranging in size from 0.23° × 0.94° to 1.64° × 5.16°) was presented to each eye at 35% contrast for 60 ms followed by a noise mask for 500 ms at a viewing distance of 86 cm. The duration of presentation of the rectangles was too brief (60 ms) to produce rivalry, which is thought to require 150 ms of stimulation (Wolfe, 1983). The size of the rectangle was adjusted so that its orientation was identified correctly on 75% of the trials when presented monocularly to the amblyopic eye. In each block, half the trials had two rectangles—one rectangle presented to each of the two eyes, with the horizontal rectangle randomly assigned to one eye and the vertical rectangle to the other. The other half of the trials had only one rectangle (either horizontal or vertical) presented to either the left or the right eye with equal probability.
Procedure
The observers' tasks were to report how many rectangles they saw (one or two) and, if they saw only one, to report its orientation. The binocular presentation trials measure suppression by determining whether the rectangle in the amblyopic eye is suppressed when a rectangle is presented in the fellow eye. If the observer reported both targets in the binocular condition, the response was counted as a hit; if the observer reported two rectangles when only one rectangle was presented, the response was a false alarm. The binocular suppression index was defined as d′ = z(hits) – z(false alarms). A smaller d′ represents less binocularity and indicates stronger interocular suppression. Monocular presentation trials are included for two reasons: to measure monocular visibility (adjusted to be 75% correct or better) and to prevent bias toward a two response. On a given trial, the observer did not know whether only one rectangle was presented or whether two were presented binocularly and only one was visible.
Statistical analysis
The primary analyses were conducted using a between-subjects design multivariate analysis of variance (ANOVA) followed by a further within-subject design ANOVA in each eye of amblyopes (Figure 5). Both multivariate ANOVA and ANOVA were conducted in R. The Bonferroni correction was used to control the familywise error rate for repeated ANOVA in each eye of amblyopes, in which the significance level was at 0.05/2 = 0.0125. Significant differences in the attention index between amblyopes and controls (Figure 6) were identified by two-tailed heteroscedastic t tests, in which the propagation uncertainties of the attention index were corrected by using the equation
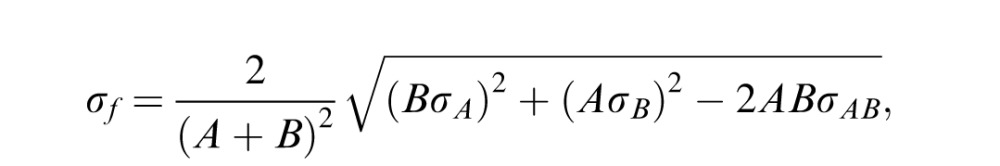 |
where σf is the variance of simple functions of the real variables A and B, σA is the standard deviation of variable A, σB is the standard deviation of variable B, and σAB is the covariance of variables A and B. Bonferroni correction was used to control the familywise error rate for the comparison of three visual areas, for which the significance level was 0.05/3 = 0.0167. Correlations in Figures 7 and 8 were calculated by nonparametric measures of association (Spearman's coefficient test) using Real Statistics Data Analysis Tools (http://www.real-statistics.com).
Figure 5.

Individual SNRs along with the mean in attended and ignored conditions in visual areas (a) V1, (b) hV4, and (c) hMT+. The y-axis plots the attended condition, and the x-axis plots the ignored condition. Black symbols present the mean of values. The solid line indicates a 1:1 ratio between attended and ignored conditions. Data above the solid line indicate neural response enhancement by attention (attentional modulation); data below the solid line indicate response reduction. The error bars indicate standard error of the mean. Note that both eyes of controls and the majority of amblyopes show neural enhancement when attended to the grating, except for two or three amblyopes who show mild response reduction. The SNR group mean in the attended condition was stronger than that in the ignored condition in each eye of amblyopes (p < 0.05, see details in text).
Figure 6.

Attention index in each eye in visual areas (a) V1, (b) hV4, and (c) hMT+. Open circle = amblyopic eye; filled circle = fellow eye; open square = nondominant eye of controls; filled square = dominant eye of controls. The error bars indicate standard error of the mean. * indicates p < 0.05, ** indicates p < 0.01, and *** indicates p < 0.001 with Bonferroni correction by two-tailed heteroscedastic t tests.
Figure 7.
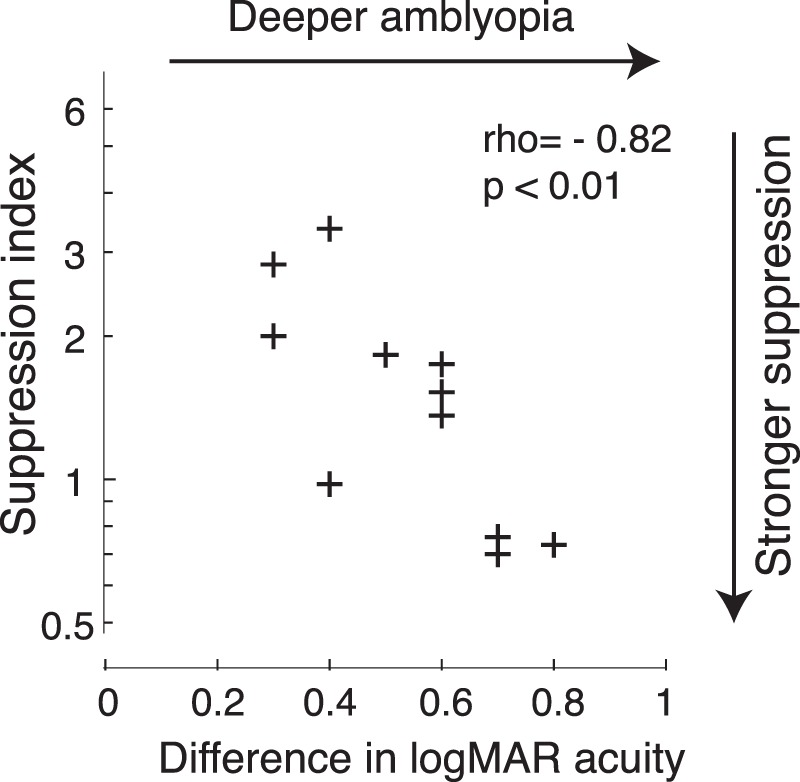
Correlation between suppression index and interocular difference in logMAR acuity in strabismic amblyopes. A lower suppression index indicates stronger interocular suppression. Data show a negative correlation between suppression index and the interocular difference in logMAR acuity (Spearman's rho = −0.82, p < 0.01), indicating that individuals with stronger visual suppression had deeper amblyopia.
Figure 8.

Correlation between neural modulation of attention in V1 and perception in strabismic amblyopes. (a) Correlation between attention index ratio and suppression index (rho = 0.71, p < 0.05). (b) Correlation between attention index ratio and the interocular difference in logMAR acuity (rho = −0.52, p < 0.05). These data indicate that (a) stronger suppression or (b) deeper amblyopia in strabismic amblyopes had weaker neural modulation of attention in V1.
Results
EEG experiment results
Scalp topography
Figure 4 shows the examples of SSVEP scalp topographies from one observer with normal vision (top row) and two amblyopes (middle row: mild amblyopia; bottom row: deep amblyopia). As expected (Kim, Grabowecky, Paller, Muthu, & Suzuki, 2007; Verghese et al., 2012), the SSVEP scalp topographies for the responses to the attended grating showed maximal amplitudes over the contralateral posterior cortex.
Figure 4.

Examples of scalp topographies at the first harmonic responses for 16.67- and 12.5-Hz grating under attended and ignored conditions. Top row: normal control. Middle row: mild amblyopia (0.3 logMAR). Bottom row: deep amblyopia (0.8 logMAR). For both gratings from each eye, maximal responses and maximal attention effects occurred at contralateral posterior scalp locations.
Attentional modulation
We compared the SNR of the SSVEP responses in the ROI (V1, hV4, and hMT+) when the gratings were attended or ignored (Verghese et al., 2012) by collapsing over the two driving frequencies (Lauritzen et al., 2010; see details in Method). Figure 5 plots the individual SNRs along with the mean in attended and ignored conditions in visual areas V1, hV4, and hMT+. The SNRs above the solid lines in Figure 5 indicate the enhancement by attention (referred to as attentional modulation). These areas showed enhanced responses to the attended grating, relative to the ignored grating, in both eyes of controls and the majority of amblyopes. Control observers showed a robust enhancement to the attended grating, similar to the findings from Lauritzen et al. (2010). An initial between-subjects multivariate ANOVA was conducted with the factors group (controls vs. amblyopes), eye (dominant eye vs. nondominant eye), ROI (V1, hV4, and hMT+), and attention (attended vs. ignored). As expected, the interaction of attention, eye, and group was significant, F(1, 23) = 6.34, p < 0.05, suggesting that the modulation due to attention is different among the groups and the tested eyes. This difference was likely driven by the weak attentional modulation and overall reduced SNRs in both the attended and ignored conditions in the amblyopic eye relative to the other eyes. To confirm that there is significant attentional modulation in the amblyopic eye, we conducted a further analysis—a within-subject ANOVA with the factors ROI and attention—in each eye of amblyopes. There was a significant main effect of attention in each eye of amblyopes: amblyopic eye, F(1, 12) = 6.83, p < 0.05; fellow eye, F(1, 12) = 8.74, p < 0.05, with Bonferroni correction. Thus, attention modulated the response in both the amblyopic and the fellow eye, although the modulation in the amblyopic eye was weak. The interaction of attention and ROI did not reach significance in each eye of amblyopes.
Attention index
To exclude the bias from overall reduced response amplitudes in the amblyopic eye, we calculated an attentional modulation index (referred to as attention index; Kim & Verghese, 2012; McAdams & Maunsell, 1999; Verghese et al., 2012), defined as the difference between the attended and ignored responses divided by their sum: attention index = (attended – ignored)/(attended + ignored). Figure 6 plots the individual attention indices along with the mean in different visual areas. Two-tailed heteroscedastic t tests indicated that the attention index of the amblyopic eye was significantly reduced across all ROI (V1: p < 0.01; hV4: p < 0.001; hMT+: p < 0.05; Bonferroni corrected) compared with the eyes of controls. The attention index of the fellow eye was not significantly different from the eyes of controls in V1 (p > 0.05) but was significantly weaker than the eyes of controls in hV4 (p < 0.01; Bonferroni corrected) and hMT+ (p < 0.01; Bonferroni corrected). The attention index in the amblyopic eye was significantly lower than that in the fellow eye in V1 (p < 0.05; Bonferroni corrected). However, the attention index was not significantly different between two eyes of amblyopes in the extrastriate cortex (hV4 and hMT+; p > 0.05).
Interocular suppression
In our behavioral experiment, we measured the percentage of perceived targets under two conditions: (a) a single target, either horizontal or vertical, presented to one eye chosen at random during the trial, and (b) two targets presented on each trial, with each eye receiving one vertical or horizontal target chosen at random. In the amblyopic eye we found that the proportion correct was higher under monocular presentation than under binocular presentation (p < 0.001, two-tailed paired t test), indicating that visual perception of the amblyopic eye was suppressed by the fellow eye. In the fellow eye, the proportion correct was not significantly different under monocular and binocular conditions (p > 0.05, two-tailed paired t test). To estimate the degree of suppression under binocular viewing conditions we calculated a suppression index (as defined in Method). Consistent with the majority of behavioral studies in adults and children with amblyopia (Jampolsky, 1955; Kwon et al., 2014; Li et al., 2011, 2013; Narasimhan, Harrison, & Giaschi, 2012; Sireteanu, 1982a; Sireteanu & Fronius, 1981; Travers, 1938), our data from 11 amblyopes who participated in the behavioral experiment also showed correlation between interocular suppression and the depth of amblyopia. Figure 7 shows that individuals with greater suppression (smaller suppression index) had a larger interocular difference in logMAR acuity (p < 0.01).
Correlation between neural modulation of attention and behavior
Our behavioral data indicate a tight correlation between the magnitude of suppression and the depth of amblyopia in this cohort of amblyopes (Figure 7). We were interested in whether there was a correlation between these behavioral results and attentional modulation in V1 because a strong correlation has been reported between interocular suppression and the depth of amblyopia in both V1 and V2 in strabismic monkeys (Bi et al., 2011). Because the current EEG source-imaging method cannot reliably dissociate sources in V1 and V2, we focused on V1 (the V1 complex) as well as hV4 and hMT+. To relate attentional modulation to suppression and the depth of amblyopia, we first estimated the relative attention modulation of the two eyes as the ratio of attention indices of the fellow eye and amblyopic eye. We then used a nonparametric measure of association, Spearman's rho, to relate this ratio to the suppression index and to the interocular difference of logMAR acuity. We found that the attention index ratio in V1 was significantly correlated with the suppression index (Spearman's rho = 0.71, p < 0.05; see Figure 8a) and with the interocular difference of logMAR acuity (Spearman's rho = −0.52, p < 0.05; see Figure 8b), indicating that stronger suppression or deeper amblyopia was associated with weaker neural modulation of selective attention in V1 of strabismic amblyopes. However, we found that the suppression index and attention index ratio were not significantly correlated in both hV4 (Spearman's rho = 0.25, p > 0.05) and hMT+ (Spearman's rho = −0.21, p > 0.05). The interocular difference in logMAR acuity and attention index ratio were also not significantly correlated in both hV4 (Spearman's rho = −0.33, p > 0.05) and hMT+ (Spearman's rho = 0.12, p > 0.05).
Discussion
Using functional MRI–informed EEG source-imaging methods, we were able to simultaneously measure neural population responses due to selective attention at different stages of the visual cortical hierarchy, including V1 and the extrastriate cortex (hV4, hMT+), in human strabismic amblyopes. Our results indicate that attention enhanced the neural responses to input from both the amblyopic and the fellow eye as well as from the eyes of normal observers. These findings are consistent with reports of enhanced neural responses to attended stimuli in the visual cortex of populations with normal vision (Corbetta & Shulman, 2002; Desimone & Duncan, 1995; Kim & Verghese, 2012; Lauritzen et al., 2010; Reynolds & Chelazzi, 2004; Verghese et al., 2012; Yantis & Serences, 2003). Moreover, our data from normal observers replicate the attentional modulation pattern in visual areas V1, hV4, and hMT+ found in normal observers by Lauritzen et al. (2010). Importantly, however, we found that the strength of attentional modulation was weak in both eyes of strabismic amblyopes compared with the eyes of observers with normal vision and that the pattern of attentional modulation deficits for the amblyopic eye and the fellow eye was different. The fellow eye showed normal attentional modulation in V1 but smaller modulation in extrastriate areas hV4 and hMT+, whereas the amblyopic eye consistently showed reduced attentional modulation in lower level (V1) and higher level (hV4 and hMT+) visual cortices. These findings provide electrophysiological evidence that the neural modulation of selective visual attention is weak in the visual cortex of human strabismic amblyopes, consistent with our speculation that a long-term attentional neglect of the visual input to the amblyopic eye produces weak modulatory effects of selective attention in the visual cortex. Our results are in agreement with previous behavioral studies (Farzin & Norcia, 2011; Ho et al., 2006; Popple & Levi, 2008; Sharma et al., 2000; Thiel & Sireteanu, 2009; Tripathy & Levi, 2008), suggesting that a deficit of attentional modulation in the visual cortex is an important component of the functional impairment in amblyopia. In addition, our results provide direct electrophysiological evidence that the amblyopic neural losses are not limited in visual areas V1 and V2 but rather involve extrastriate visual cortices hV4 and hMT+ and perhaps the higher level cortical networks outside of the visual cortex (e.g., posterior parietal; Battelli et al., 2001; Culham et al., 1998) that mediate selective attention. Our results are in agreement with the conjecture that additional losses must arise beyond V1 and V2 (Kiorpes, 2006; Shooner et al., 2015).
Furthermore, we also demonstrated that the weak attentional modulation in V1 was correlated with the magnitude of interocular suppression (Figure 8a) and the depth of amblyopia (Figure 8b) in this cohort of strabismic amblyopes. Typically, we think of strabismic suppression in terms of the strong eye inhibiting the weak eye (Hess et al., 2014). Our finding that reduced attentional modulation of the input from the amblyopic eye (relative to the fellow eye) in V1 is linked with the magnitude of suppression is consistent with this notion. This finding challenges our present understanding of the neural mechanisms underlying amblyopia in strabismus. It also opens the possibility that the visual suppression often seen in strabismic amblyopia might be due to a form of attentional neglect of the visual input to the amblyopic eye and that feedback from higher level cortical areas might be partially responsible for the early visual area deficits in strabismic amblyopia.
Anatomical (Adams, Economides, Sincich, & Horton, 2013) and physiological (Bi et al., 2011; Sengpiel & Blakemore, 1994; Sengpiel et al., 2006; Zhang et al., 2005) evidence of suppression has been found in V1 as well as in V2 (Bi et al., 2011) of strabismic animals. The work of Sengpiel et al. (2006) showed that the sudden appearance of a stimulus in one eye of strabismic cats suppressed the activity of V1 neurons responding to a stimulus in the other eye (Sengpiel & Blakemore, 1994; Sengpiel, Blakemore, Kind, & Harrad, 1994). They suggested that this interocular suppression might be mediated by intracortical inhibition of intrinsic horizontal connections between neighboring ocular dominance (OD) columns (Lowel & Singer, 1992; Schmidt & Lowel, 2008; Tychsen, Wong, Foeller, & Bradley, 2004). V1 deficits in amblyopia are thought to occur when neurons in the OD columns of the deviating eye are constantly inhibited by suppression from the OD columns of the fixating eye through intrinsic horizontal connections (Sengpiel & Blakemore, 1996) and when the resulting inactivity interferes with the process of synaptic learning (Hebb, 1949). However, Adams et al. (2013) argued that intracortical inhibition via horizontal connections is not sufficient to allow neurons serving the fovea in one eye's OD columns to inhibit neurons serving the peripheral temporal retina in the other eye's OD columns because intrinsic horizontal connections extend for only a few millimeters in V1 (Bosking, Zhang, Schofield, & Fitzpatrick, 1997; Fitzpatrick, Lund, & Blasdel, 1985; Rockland & Lund, 1983). In addition, strabismus leads to a selective loss of projections between neurons in the opposite eye's OD columns (Schmidt & Lowel, 2008; Tychsen, Wong, & Burkhalter, 2004), which reduces the substrate of such inhibitory interactions. For these reasons, Adams et al. (2013) suggested that feedback from neurons in higher visual cortical areas, which have much larger receptive fields, is more likely to control interocular suppression. Our results support such a conjecture and suggest that feedback from higher order mechanisms, in the form of selective visual attention, plays an important role in controlling suppression in the early visual cortex (V1 and V2).
Our data do not show a significant correlation between interocular suppression and the attention index ratio in extrastriate cortical areas hV4 and hMT+. One reason for the lack of correlation is perhaps the degraded attentional modulation of both the amblyopic and fellow eyes' inputs in hV4 and hMT+, resulting in attention index ratios close to 1. On the other hand, our data show a significant correlation between the depth of amblyopia and neural modulation of selective attention in V1 but not in extrastriate cortical areas hV4 and hMT+. The lack of correlation between visual acuity and attention modulation in the extrastriate cortex is consistent with a previous study that showed that extrastriate cortex deficits in strabismic amblyopia were not related to visual acuity losses but were related to abnormal binocularity (Hou et al., 2014). In the current study, all patients had very poor binocularity, which might contribute to the deficits in extrastriate cortical areas hV4 and hMT+.
An important finding in the current study is that the fellow eye of amblyopes with normal visual acuity showed degraded attentional modulation in extrastriate areas hV4 and hMT+ but not in V1. This finding is consistent with fellow eye deficits in human strabismic amblyopes reported in previous studies for tasks that activate the extrastriate cortex (Giaschi et al., 1992; Ho et al., 2005; Hou et al., 2008, 2014; Husk & Hess, 2013; Secen et al., 2011; Simmers & Bex, 2004; Simmers et al., 2003). Furthermore, Hou et al. (2014) reported that responses to stimuli that activate the lateral occipital cortex were abnormal not only in the fellow eye of strabismic amblyopes but also in both eyes of strabismic individuals without amblyopia who had normal acuity in each eye, suggesting that the deficits in the extrastriate cortex are associated with abnormal binocularity and could be independent of visual acuity (Hou et al., 2014). All amblyopic individuals in the current study were stereoblind (no measureable stereoacuity). Lack of normal binocular visual experience likely affects neurons selective for disparity and motion in depth located in the extrastriate cortex because these regions have a larger proportion of neurons with binocular input (Cottereau, Ales, & Norcia, 2014a; Czuba, Huk, Cormack, & Kohn, 2014; DeAngelis & Newsome, 1999).
Conclusions
Our study of attentional modulation in human strabismic amblyopes identifies neural populations in the visual cortex with deficits of selective visual attention. Our results demonstrate that attentional modulation of neural populations in both V1 and the extrastriate cortex, including ventral (hV4) and dorsal (hMT+) pathways, is substantially degraded in the amblyopic eye. The deficits of attentional modulation in V1 are significantly correlated with the magnitude of interocular suppression and the depth of amblyopia. These findings support the view that the visual suppression often seen in strabismic amblyopia might be a form of attentional neglect of the amblyopic eye and that feedback modulation from higher level cortical areas may also contribute to the early visual area deficits in strabismic amblyopia.
Supplementary Material
Acknowledgments
This work was supported by NIH Grant R01-EY025018 and The West China Hospital Fund to C. H., grants from The Smith-Kettlewell Eye Research Institute and Pacific Vision Foundation to C. H. and P. V., and NSF Grant BCS-0963914 to P. V. We thank Suzanne P. McKee for extensive discussion and for comments on the manuscript, Spero Nicholas for conducting MRI scans and for assistance in statistical analysis, and Margaret Q. McGovern for assistance in recruiting the participants. The authors declare no competing financial interests.
Commercial relationships: none.
Corresponding author: Chuan Hou.
Email: chuanhou@ski.org.
Address: The Smith-Kettlewell Eye Research Institute, San Francisco, CA, USA.
References
- Aaen-Stockdale C.,, Ledgeway T.,, Hess R. F. (2007). Second-order optic flow deficits in amblyopia. Investigative Ophthalmology & Visual Science, 48, 5532–5538. [PubMed] [Article] [DOI] [PubMed] [Google Scholar]
- Adams D. L.,, Economides J. R.,, Sincich L. C.,, Horton J. C. (2013). Cortical metabolic activity matches the pattern of visual suppression in strabismus. Journal of Neuroscience, 33, 3752–3759. [DOI] [PMC free article] [PubMed] [Google Scholar]
- Ales J. M.,, Appelbaum L. G.,, Cottereau B. R.,, Norcia A. M. (2013). The time course of shape discrimination in the human brain. NeuroImage, 67, 77–88. [DOI] [PubMed] [Google Scholar]
- Battelli L.,, Cavanagh P.,, Intriligator J.,, Tramo M. J.,, Henaff M. A.,, Michel F.,, Barton J. J. (2001). Unilateral right parietal damage leads to bilateral deficit for high-level motion. Neuron, 32, 985–995. [DOI] [PubMed] [Google Scholar]
- Bi H.,, Zhang B.,, Tao X.,, Harwerth R. S.,, Smith E. L.,, III,, Chino Y. M. (2011). Neuronal responses in visual area V2 (V2) of macaque monkeys with strabismic amblyopia. Cerebral Cortex, 21, 2033–2045. [DOI] [PMC free article] [PubMed] [Google Scholar]
- Bosking W. H.,, Zhang Y.,, Schofield B.,, Fitzpatrick D. (1997). Orientation selectivity and the arrangement of horizontal connections in tree shrew striate cortex. Journal of Neuroscience, 17, 2112–2127. [DOI] [PMC free article] [PubMed] [Google Scholar]
- Brewer A. A.,, Liu J.,, Wade A. R.,, Wandell B. A. (2005). Visual field maps and stimulus selectivity in human ventral occipital cortex. Nature Neuroscience, 8, 1102–1109. [DOI] [PubMed] [Google Scholar]
- Chandna A.,, Pennefather P. M.,, Kovacs I.,, Norcia A. M. (2001). Contour integration deficits in anisometropic amblyopia. Investigative Ophthalmology & Visual Science, 42, 875–878. [PubMed] [Article] [PubMed] [Google Scholar]
- Chino Y. M.,, Bi H.,, Zhang B. (2004). The postnatal development of the neuronal response properties in primate visual cortex. Kaas J., Collins C. (Eds.) Primate vision (pp 81–108). Boca Raton, FL: CRC Press. [Google Scholar]
- Corbetta, M.,, Shulman G. L. (2002). Control of goal-directed and stimulus-driven attention in the brain. Nature Reviews Neuroscience, 3, 201–215. [DOI] [PubMed] [Google Scholar]
- Cottereau B. R.,, Ales J. M.,, Norcia A. M. (2012). Increasing the accuracy of electromagnetic inverses using functional area source correlation constraints. Human Brain Mapping, 33, 2694–2713. [DOI] [PMC free article] [PubMed] [Google Scholar]
- Cottereau B. R.,, Ales J. M.,, Norcia A. M. (2014a). The evolution of a disparity decision in human visual cortex. NeuroImage, 92, 193–206. [DOI] [PMC free article] [PubMed] [Google Scholar]
- Cottereau B. R.,, Ales J. M.,, Norcia A. M. (2014b). How to use fMRI functional localizers to improve EEG/MEG source estimation. Journal of Neuroscience Methods, 250, 64–73. [DOI] [PMC free article] [PubMed] [Google Scholar]
- Cottereau B. R.,, McKee S. P.,, Ales J. M.,, Norcia A. M. (2011). Disparity-tuned population responses from human visual cortex. Journal of Neuroscience, 31, 954–965. [DOI] [PMC free article] [PubMed] [Google Scholar]
- Cottereau B. R.,, McKee S. P.,, Ales J. M.,, Norcia A. M. (2012). Disparity-specific spatial interactions: Evidence from EEG source imaging. Journal of Neuroscience, 32, 826–840. [DOI] [PMC free article] [PubMed] [Google Scholar]
- Culham J. C.,, Brandt S. A.,, Cavanagh P.,, Kanwisher N. G.,, Dale A. M.,, Tootell R. B. (1998). Cortical fMRI activation produced by attentive tracking of moving targets. Journal of Neurophysiology, 80, 2657–2670. [DOI] [PubMed] [Google Scholar]
- Czuba T. B.,, Huk A. C.,, Cormack L. K.,, Kohn A. (2014). Area MT encodes three-dimensional motion. Journal of Neuroscience, 34, 15522–15533. [DOI] [PMC free article] [PubMed] [Google Scholar]
- Davis A. R.,, Sloper J. J.,, Neveu M. M.,, Hogg C. R.,, Morgan M. J.,, Holder G. E. (2008). Differential changes in color and motion-onset visual evoked potentials from both eyes in early- and late-onset strabismic amblyopia. Investigative Ophthalmology & Visual Science, 49, 4418–4426. [PubMed] [Article] [DOI] [PubMed] [Google Scholar]
- DeAngelis G. C.,, Newsome W. T. (1999). Organization of disparity-selective neurons in macaque area MT. Journal of Neuroscience, 19, 1398–1415. [DOI] [PMC free article] [PubMed] [Google Scholar]
- Desimone R.,, Duncan J. (1995). Neural mechanisms of selective visual attention. Annual Review of Neuroscience, 18, 193–222. [DOI] [PubMed] [Google Scholar]
- Engel S. A.,, Glover G. H.,, Wandell B. A. (1997). Retinotopic organization in human visual cortex and the spatial precision of functional MRI. Cerebral Cortex, 7, 181–192. [DOI] [PubMed] [Google Scholar]
- Farzin F.,, Norcia A. M. (2011). Impaired visual decision-making in individuals with amblyopia. Journal of Vision, 11 (14): 16 1–10, doi:10.1167/11.14.6 [PubMed] [Article] [DOI] [PMC free article] [PubMed] [Google Scholar]
- Fitzpatrick D.,, Lund J. S.,, Blasdel G. G. (1985). Intrinsic connections of macaque striate cortex: Afferent and efferent connections of lamina 4C. Journal of Neuroscience, 5, 3329–3349. [DOI] [PMC free article] [PubMed] [Google Scholar]
- Giaschi D. E.,, Regan D.,, Kraft S. P.,, Hong X. H. (1992). Defective processing of motion-defined form in the fellow eye of patients with unilateral amblyopia. Investigative Ophthalmology & Visual Science, 33, 2483–2489. [PubMed] [Article] [PubMed] [Google Scholar]
- Gold J. I.,, Shadlen M. N. (2007). The neural basis of decision making. Annual Review of Neuroscience, 30, 535–574. [DOI] [PubMed] [Google Scholar]
- Green D. M.,, Swets J. A. (1966). Signal detection theory and psychophysics. New York, NY: Wiley. [Google Scholar]
- Hämäläinen M.,, Hari R.,, Ilmoniemi R.,, Knuutila J.,, Lounasmaa O. V. (1993). Magnetoencephalography: Theory, instrumentation and applications to the noninvasive study of human brain function. Reviews of Modern Physics, 65, 413–497. [Google Scholar]
- Hebb D. O. (1949). The organization of behavior. New York, NY: Wiley. [Google Scholar]
- Heekeren H. R.,, Marrett S.,, Ungerleider L. G. (2008). The neural systems that mediate human perceptual decision making. Nature Reviews Neuroscience, 9, 467–479. [DOI] [PubMed] [Google Scholar]
- Hess R. F.,, McIlhagga W.,, Field D. (1997). Contour integration in strabismic amblyopia: The sufficiency of explanation based on positional uncertainty. Vision Research, 37, 3145–3161. [DOI] [PubMed] [Google Scholar]
- Hess R. F.,, Thompson B.,, Baker D. H. (2014). Binocular vision in amblyopia: Structure, suppression and plasticity. Ophthalmic and Physiological Optics, 34, 146–162. [DOI] [PubMed] [Google Scholar]
- Ho C. S.,, Giaschi D. E. (2006). Deficient maximum motion displacement in amblyopia. Vision Research, 46, 4595–4603. [DOI] [PubMed] [Google Scholar]
- Ho C. S.,, Giaschi D. E. (2007). Stereopsis-dependent deficits in maximum motion displacement in strabismic and anisometropic amblyopia. Vision Research, 47, 2778–2785. [DOI] [PubMed] [Google Scholar]
- Ho C. S.,, Giaschi D. E. (2009). Low- and high-level motion perception deficits in anisometropic and strabismic amblyopia: Evidence from fMRI. Vision Research, 49, 2891–2901. [DOI] [PubMed] [Google Scholar]
- Ho C. S.,, Giaschi D. E.,, Boden C.,, Dougherty R.,, Cline R.,, Lyons C. (2005). Deficient motion perception in the fellow eye of amblyopic children. Vision Research, 45, 1615–1627. [DOI] [PubMed] [Google Scholar]
- Ho C. S.,, Paul P. S.,, Asirvatham A.,, Cavanagh P.,, Cline R.,, Giaschi D. E. (2006). Abnormal spatial selection and tracking in children with amblyopia. Vision Research, 46, 3274–3283. [DOI] [PubMed] [Google Scholar]
- Hou C.,, Pettet M. W.,, Norcia A. M. (2008). Abnormalities of coherent motion processing in strabismic amblyopia: Visual-evoked potential measurements. Journal of Vision, 8 (4): 16 1–12, doi:10.1167/8.4.2 [PubMed] [Article] [DOI] [PMC free article] [PubMed] [Google Scholar]
- Hou C.,, Pettet M. W.,, Norcia A. M. (2014). Acuity-independent effects of visual deprivation on human visual cortex. Proceedings of the National Academy of Sciences, USA, 111, E3120–E3128. [DOI] [PMC free article] [PubMed] [Google Scholar]
- Huk A. C.,, Heeger D. J. (2002). Pattern-motion responses in human visual cortex. Nature Neuroscience, 5, 72–75. [DOI] [PubMed] [Google Scholar]
- Husk J. S.,, Hess R. F. (2013). Global processing of orientation in amblyopia. Vision Research, 82, 22–30. [DOI] [PubMed] [Google Scholar]
- Jack A. I.,, Shulman G. L.,, Snyder A. Z.,, McAvoy M.,, Corbetta M. (2006). Separate modulations of human V1 associated with spatial attention and task structure. Neuron, 51, 135–147. [DOI] [PubMed] [Google Scholar]
- Jampolsky A. (1955). Characteristics of suppression in strabismus. Archives of Ophthalmology, 54, 683–696. [DOI] [PubMed] [Google Scholar]
- Jenkinson M.,, Pechaud M.,, Smith S. (2005). BET2: MR-based estimation of brain, skull and scalp surfaces. Presented at Eleventh Annual Meeting of the Organization for Human Brain Mapping, February 6, 2006, Oxford, UK.
- Kim Y. J.,, Grabowecky M.,, Paller K. A.,, Muthu K.,, Suzuki S. (2007). Attention induces synchronization-based response gain in steady-state visual evoked potentials. Nature Neuroscience, 10, 117–125. [DOI] [PubMed] [Google Scholar]
- Kim Y. J.,, Verghese P. (2012). The selectivity of task-dependent attention varies with surrounding context. Journal of Neuroscience, 32, 12180–12191. [DOI] [PMC free article] [PubMed] [Google Scholar]
- Kiorpes L. (2006). Visual processing in amblyopia: Animal studies. Strabismus, 14, 3–10. [DOI] [PubMed] [Google Scholar]
- Kiorpes L.,, Kiper D. C.,, O'Keefe L. P.,, Cavanaugh J. R.,, Movshon J. A. (1998). Neuronal correlates of amblyopia in the visual cortex of macaque monkeys with experimental strabismus and anisometropia. Journal of Neuroscience, 18, 6411–6424. [DOI] [PMC free article] [PubMed] [Google Scholar]
- Kiorpes L.,, Movshon J. A. (2003). Neural limitations on visual development in primates. Chalupa L. M., Werner J. S. (Eds.) The visual neurosciences (pp 159–173). Cambridge, MA: MIT Press. [Google Scholar]
- Kovacs, I.,, Polat U.,, Pennefather P. M.,, Chandna A.,, Norcia A. M. (2000). A new test of contour integration deficits in patients with a history of disrupted binocular experience during visual development. Vision Research, 40, 1775–1783. [DOI] [PubMed] [Google Scholar]
- Kwon M.,, Lu Z. L.,, Miller A.,, Kazlas M.,, Hunter D. G.,, Bex P. J. (2014). Assessing binocular interaction in amblyopia and its clinical feasibility. PLoS One, 9 (6), e100156. [DOI] [PMC free article] [PubMed] [Google Scholar]
- Lauritzen T. Z.,, Ales J. M.,, Wade A. R. (2010). The effects of visuospatial attention measured across visual cortex using source-imaged, steady-state EEG. Journal of Vision, 10 (14): 16 1–17, doi:10.1167/10.14.39 [PubMed] [Article] [DOI] [PubMed] [Google Scholar]
- Lerner Y.,, Hendler T.,, Malach R.,, Harel M.,, Leiba H.,, Stolovitch C.,, Pianka P. (2006). Selective fovea-related deprived activation in retinotopic and high-order visual cortex of human amblyopes. NeuroImage, 33, 169–179. [DOI] [PubMed] [Google Scholar]
- Lerner Y.,, Pianka P.,, Azmon B.,, Leiba H.,, Stolovitch C.,, Loewenstein A., …, Malach R. (2003). Area-specific amblyopic effects in human occipitotemporal object representations. Neuron, 40, 1023–1029. [DOI] [PubMed] [Google Scholar]
- Li J.,, Hess R. F.,, Chan L. Y.,, Deng D.,, Yang X.,, Chen X., …, Thompson B. (2013). Quantitative measurement of interocular suppression in anisometropic amblyopia: A case-control study. Ophthalmology, 120, 1672–1680. [DOI] [PubMed] [Google Scholar]
- Li J.,, Thompson B.,, Lam C. S.,, Deng D.,, Chan L. Y.,, Maehara G., …, Hess R. F. (2011). The role of suppression in amblyopia. Investigative Ophthalmology & Visual Science, 52, 4169–4176. [PubMed] [Article] [DOI] [PubMed] [Google Scholar]
- Lowel S.,, Singer W. (1992). Selection of intrinsic horizontal connections in the visual cortex by correlated neuronal activity. Science, 255, 209–212. [DOI] [PubMed] [Google Scholar]
- Martinez-Trujillo J.,, Treue S. (2002). Attentional modulation strength in cortical area MT depends on stimulus contrast. Neuron, 35, 365–370. [DOI] [PubMed] [Google Scholar]
- McAdams C. J.,, Maunsell J. H. (1999). Effects of attention on orientation-tuning functions of single neurons in macaque cortical area V4. Journal of Neuroscience, 19, 431–441. [DOI] [PMC free article] [PubMed] [Google Scholar]
- Moran J.,, Desimone R. (1985). Selective attention gates visual processing in the extrastriate cortex. Science, 229, 782–784. [DOI] [PubMed] [Google Scholar]
- Motter B. C. (1993). Focal attention produces spatially selective processing in visual cortical areas V1, V2, and V4 in the presence of competing stimuli. Journal of Neurophysiology, 70, 909–919. [DOI] [PubMed] [Google Scholar]
- Movshon J. A.,, Eggers H. M.,, Gizzi M. S.,, Hendrickson A. E.,, Kiorpes L.,, Boothe R. G. (1987). Effects of early unilateral blur on the macaque's visual system. III. Physiological observations. Journal of Neuroscience, 7, 1340–1351. [DOI] [PMC free article] [PubMed] [Google Scholar]
- Muckli L.,, Kiess S.,, Tonhausen N.,, Singer W.,, Goebel R.,, Sireteanu R. (2006). Cerebral correlates of impaired grating perception in individual, psychophysically assessed human amblyopes. Vision Research, 46, 506–526. [DOI] [PubMed] [Google Scholar]
- Narasimhan S.,, Harrison E. R.,, Giaschi D. E. (2012). Quantitative measurement of interocular suppression in children with amblyopia. Vision Research, 66, 1–10. [DOI] [PubMed] [Google Scholar]
- Popple A. V.,, Levi D. M. (2000). Amblyopes see true alignment where normal observers see illusory tilt. Proceedings of the National Academy of Sciences, USA, 97, 11667–11672. [DOI] [PMC free article] [PubMed] [Google Scholar]
- Popple A. V.,, Levi D. M. (2008). The attentional blink in amblyopia. Journal of Vision, 8 (13): 16 1–19, doi:10.1167/8.13.12 [PubMed] [Article] [DOI] [PubMed] [Google Scholar]
- Press W. A.,, Brewer A. A.,, Dougherty R. F.,, Wade A. R.,, Wandell B. A. (2001). Visual areas and spatial summation in human visual cortex. Vision Research, 41, 1321–1332. [DOI] [PubMed] [Google Scholar]
- Reynolds J. H.,, Chelazzi L. (2004). Attentional modulation of visual processing. Annual Review of Neuroscience, 27, 611–647. [DOI] [PubMed] [Google Scholar]
- Reynolds J. H.,, Pasternak T.,, Desimone R. (2000). Attention increases sensitivity of V4 neurons. Neuron, 26, 703–714. [DOI] [PubMed] [Google Scholar]
- Rockland K. S.,, Lund J. S. (1983). Intrinsic laminar lattice connections in primate visual cortex. Journal of Comparative Neurology, 216, 303–318. [DOI] [PubMed] [Google Scholar]
- Schmidt K. F.,, Lowel S. (2008). Strabismus modifies intrinsic and inter-areal connections in cat area 18. Neuroscience, 152, 128–137. [DOI] [PubMed] [Google Scholar]
- Secen J.,, Culham J.,, Ho C.,, Giaschi D. (2011). Neural correlates of the multiple-object tracking deficit in amblyopia. Vision Research, 51, 2517–2527. [DOI] [PubMed] [Google Scholar]
- Sengpiel F.,, Blakemore C. (1994). Interocular control of neuronal responsiveness in cat visual cortex. Nature, 368, 847–850. [DOI] [PubMed] [Google Scholar]
- Sengpiel F.,, Blakemore C. (1996). The neural basis of suppression and amblyopia in strabismus. Eye (London), 10 (Pt. 2), 250–258. [DOI] [PubMed] [Google Scholar]
- Sengpiel F.,, Blakemore C.,, Kind P. C.,, Harrad R. (1994). Interocular suppression in the visual cortex of strabismic cats. Journal of Neuroscience, 14(11, Pt. 2), 6855–6871. [DOI] [PMC free article] [PubMed]
- Sengpiel F.,, Jirmann K. U.,, Vorobyov V.,, Eysel U. T. (2006). Strabismic suppression is mediated by inhibitory interactions in the primary visual cortex. Cerebral Cortex, 16, 1750–1758. [DOI] [PubMed] [Google Scholar]
- Sereno M. I.,, Dale A. M.,, Reppas J. B.,, Kwong K. K.,, Belliveau J. W.,, Brady T. J., …, Tootell R. B. (1995). Borders of multiple visual areas in humans revealed by functional magnetic resonance imaging. Science, 268, 889–893. [DOI] [PubMed] [Google Scholar]
- Sharma V.,, Levi D. M.,, Klein S. A. (2000). Undercounting features and missing features: Evidence for a high-level deficit in strabismic amblyopia. Nature Neuroscience, 3, 496–501. [DOI] [PubMed] [Google Scholar]
- Shooner C.,, Hallum L. E.,, Kumbhani R. D.,, Ziemba C. M.,, Garcia-Marin V.,, Kelly J. G., …, Kiorpes L. (2015). Population representation of visual information in areas V1 and V2 of amblyopic macaques. Vision Research, 114, 56–67. [DOI] [PMC free article] [PubMed] [Google Scholar]
- Simmers A. J.,, Bex P. J. (2004). The representation of global spatial structure in amblyopia. Vision Research, 44, 523–533. [DOI] [PubMed] [Google Scholar]
- Simmers A. J.,, Ledgeway T.,, Hess R. F. (2005). The influences of visibility and anomalous integration processes on the perception of global spatial form versus motion in human amblyopia. Vision Research, 45, 449–460. [DOI] [PubMed] [Google Scholar]
- Simmers A. J.,, Ledgeway T.,, Hess R. F.,, McGraw P. V. (2003). Deficits to global motion processing in human amblyopia. Vision Research, 43, 729–738. [DOI] [PubMed] [Google Scholar]
- Simmers A. J.,, Ledgeway T.,, Mansouri B.,, Hutchinson C. V.,, Hess R. F. (2006). The extent of the dorsal extra-striate deficit in amblyopia. Vision Research, 46, 2571–2580. [DOI] [PubMed] [Google Scholar]
- Sireteanu R. (1982a). Binocular vision in strabismic humans with alternating fixation. Vision Research, 22, 889–896. [DOI] [PubMed] [Google Scholar]
- Sireteanu R. (1982b). Human amblyopia: Consequence of chronic interocular suppression. Human Neurobiology, 1, 31–33. [PubMed] [Google Scholar]
- Sireteanu R.,, Fronius M. (1981). Naso-temporal asymmetries in human amblyopia: Consequence of long-term interocular suppression. Vision Research, 21, 1055–1063. [DOI] [PubMed] [Google Scholar]
- Slotnick S. D.,, Schwarzbach J.,, Yantis S. (2003). Attentional inhibition of visual processing in human striate and extrastriate cortex. NeuroImage, 19, 1602–1611. [DOI] [PubMed] [Google Scholar]
- Smith S. M. (2002). Fast robust automated brain extraction. Human Brain Mapping, 17, 143–155. [DOI] [PMC free article] [PubMed] [Google Scholar]
- Sprague T. C.,, Serences J. T. (2013). Attention modulates spatial priority maps in the human occipital, parietal and frontal cortices. Nature Neuroscience, 16, 1879–1887. [DOI] [PMC free article] [PubMed] [Google Scholar]
- Thiel A.,, Sireteanu R. (2009). Strabismic amblyopes show a bilateral rightward bias in a line bisection task: Evidence for a visual attention deficit. Vision Research, 49, 287–294. [DOI] [PubMed] [Google Scholar]
- Thompson B.,, Villeneuve M. Y.,, Casanova C.,, Hess R. F. (2012). Abnormal cortical processing of pattern motion in amblyopia: Evidence from fMRI. NeuroImage, 60, 1307–1315. [DOI] [PubMed] [Google Scholar]
- Tootell R. B.,, Hadjikhani N.,, Hall E. K.,, Marrett S.,, Vanduffel W.,, Vaughan J. T.,, Dale A. M. (1998). The retinotopy of visual spatial attention. Neuron, 21, 1409–1422. [DOI] [PubMed] [Google Scholar]
- Tootell R. B.,, Mendola J. D.,, Hadjikhani N. K.,, Ledden P. J.,, Liu A. K.,, Reppas J. B., …, Dale A. M. (1997). Functional analysis of V3A and related areas in human visual cortex. Journal of Neuroscience, 17, 7060–7078. [DOI] [PMC free article] [PubMed] [Google Scholar]
- Travers T. A. (1938). Suppression of vision in squint and its association with retinal correspondence and amblyopia. British Journal of Ophthalmology, 22, 577–604. [DOI] [PMC free article] [PubMed] [Google Scholar]
- Tripathy S. P.,, Levi D. M. (2008). On the effective number of tracked trajectories in amblyopic human vision. Journal of Vision, 8 (4): 16 1–22, doi:10.1167/8.4.8 [PubMed] [Article] [DOI] [PubMed] [Google Scholar]
- Tychsen L.,, Wong A. M.,, Burkhalter A. (2004). Paucity of horizontal connections for binocular vision in V1 of naturally strabismic macaques: Cytochrome oxidase compartment specificity. Journal of Comparative Neurology, 474, 261–275. [DOI] [PubMed] [Google Scholar]
- Tychsen L.,, Wong A. M.,, Foeller P.,, Bradley D. (2004). Early versus delayed repair of infantile strabismus in macaque monkeys: II. Effects on motion visually evoked responses. Investigative Ophthalmology & Visual Science, 45, 821–827. [PubMed] [Article] [DOI] [PubMed] [Google Scholar]
- Verghese P.,, Kim Y. J.,, Wade A. R. (2012). Attention selects informative neural populations in human V1. Journal of Neuroscience, 32, 16379–16390. [DOI] [PMC free article] [PubMed] [Google Scholar]
- Vialatte F. B.,, Maurice M.,, Dauwels J.,, Cichocki A. (2010). Steady-state visually evoked potentials: Focus on essential paradigms and future perspectives. Progress in Neurobiology, 90, 418–438. [DOI] [PubMed] [Google Scholar]
- Wade A. R.,, Brewer A. A.,, Rieger J. W.,, Wandell B. A. (2002). Functional measurements of human ventral occipital cortex: Retinotopy and colour. Philosophical Transactions of the Royal Society of London B: Biological Sciences, 357, 963–973. [DOI] [PMC free article] [PubMed] [Google Scholar]
- Wang X.,, Cui D.,, Zheng L.,, Yang X.,, Yang H.,, Zeng J. (2012). Combination of blood oxygen level-dependent functional magnetic resonance imaging and visual evoked potential recordings for abnormal visual cortex in two types of amblyopia. Molecular Vision, 18, 909–919. [PMC free article] [PubMed] [Google Scholar]
- Wolfe J. M. (1983). Influence of spatial frequency, luminance, and duration on binocular rivalry and abnormal fusion of briefly presented dichoptic stimuli. Perception, 12, 447–456. [DOI] [PubMed] [Google Scholar]
- Yantis S.,, Serences J. T. (2003). Cortical mechanisms of space-based and object-based attentional control. Current Opinion in Neurobiology, 13, 187–193. [DOI] [PubMed] [Google Scholar]
- Zhang B.,, Bi H.,, Sakai E.,, Maruko I.,, Zheng J.,, Smith E. L.,, III,, Chino Y. M. (2005). Rapid plasticity of binocular connections in developing monkey visual cortex (V1). Proceedings of the National Academy of Sciences, USA, 102, 9026–9031. [DOI] [PMC free article] [PubMed] [Google Scholar]
Associated Data
This section collects any data citations, data availability statements, or supplementary materials included in this article.