

Abstract
Oculomotor signals circulate within putative recurrent feedback loops that include the frontal eye field (FEF) and the oculomotor thalamus (OcTh). To examine how OcTh contributes to visuomotor control, and perceptually informed saccadic choices in particular, neural correlates of perceptual judgment and motor selection in OcTh were evaluated and compared with those previously reported for FEF in the same subjects. Monkeys performed three tasks: a choice task in which perceptual decisions are urgent, a choice task in which identical decisions are made without time pressure, and a single-target, delayed saccade task. The OcTh yielded far fewer task-responsive neurons than the FEF, but across responsive pools, similar neuron types were found, ranging from purely visual to purely saccade related. Across such types, the impact of the perceptual information relevant to saccadic choices was qualitatively the same in FEF and OcTh. However, distinct from that in FEF, activity in OcTh was strongly task dependent, typically being most vigorous in the urgent task, less so in the easier choice task, and least in the single-target task. This was true for responsive and nonresponsive cells alike. Neurons with exclusively motor-related activity showed strong task dependence, fired less, and differed most patently from their FEF counterparts, whereas those that combined visual and motor activity fired most similarly to their FEF counterparts. The results suggest that OcTh activity is more distantly related to saccade production per se, because its degree of commitment to a motor choice varies markedly as a function of ongoing cognitive or behavioral demands.
Keywords: decision making, discrimination, gaze, frontal eye field, mediodorsal nucleus, saccade
most studies of saccadic “target selection” have focused on the frontal eye field (FEF) (Schall and Thompson 1999; Schall 2002; Gold and Shadlen 2000; Awh et al. 2006; Squire et al. 2012; Costello et al. 2013) or the superior colliculus (SC) (Horwitz and Newsome 1999; McPeek and Keller 2002, 2004; Carello and Krauzlis 2004; Horwitz et al. 2004; Krauzlis et al. 2013), which is a major downstream recipient of FEF's output (Komatsu and Suzuki 1985; Huerta et al. 1986; Segraves and Goldberg 1987; Stanton et al. 1988; Schlag-Rey et al. 1992; Hanes and Wurtz 2001). However, FEF activity develops within a broader recurrent circuit in which signals from FEF are sent to the basal ganglia or cerebellum and return to FEF via the thalamus (Alexander et al. 1986; Middleton and Strick 2000; Lynch and Tian 2006; Stanford 2006). Thus selection-related activity in FEF is likely shaped by thalamic input that comprises the final synapse of such feedback loops. In their pioneering companion studies, Schlag and Schlag-Rey focused separately on two elementary aspects of the activity generated in the primate central thalamus, its relationship to visual events (Schlag and Schlag-Rey 1984) and its relationship to spontaneous saccadic eye movements (Schlag-Rey and Schlag 1984). Based on those physiological criteria, they identified nuclei of the rostral intralaminar group (paracentral, centrolateral, and central superior lateral), the medially adjacent paralaminar regions of the mediodorsal (MD), and laterally adjacent portions of the ventral anterior, ventral lateral, and lateral dorsal nuclei, as constituents of a functionally defined oculomotor thalamus (OcTh), which presumably conveys visuo-oculomotor information to cortex.
In comparison to regions like the FEF, SC, and lateral intraparietal cortex, little is known about the specific contibutions of OcTh to visuo-oculomotor control (reviewed by Tanaka and Kunimatsu 2011a). However, more recent studies have begun to reveal the ways in which OcTh neurons might link sensory signals and motor commands (Sommer 2003; Tanibuchi and Goldman-Rakic 2003, 2005; Tanaka 2005; Tanaka and Kunimatsu 2011b). Currently, there is evidence that OcTh plays a role in relaying corollary discharge signals through the SC-MD-FEF pathway (Sommer and Wurtz 2002, 2004a,b, 2006, 2008); that it is preferentially activated when eye movements are not reactive, as during memory-guided saccades (Watanabe and Funahashi 2004a,b; Wyder et al. 2003, 2004) or antisaccades (Kunimatsu and Tanaka 2010); and that it helps regulate the timing of internally generated saccades (Tanaka 2007). Inactivation of OcTh specifically delays self-timed saccades that are produced in the absence of a trigger stimulus (Tanaka 2006), supporting a general role in the generation of voluntary eye movements (Tanaka and Kunimatsu 2011b).
Although these recent studies have shed light on various aspects of OcTh function, little is known about how it participates in target selection, understood as the encoding of a particular object/location that should be foveated next, given its (bottom-up) saliency and/or its (top-down) task relevance. This is a logical and important question because target selection is a prominent function of the FEF, a principal cortical target of OcTh projections (Lynch et al. 1994; Tian and Lynch 1997; McFarland and Haber 2002; Lynch and Tian 2006). Previous work from our laboratory revealed that neuronal responses in OcTh are similar to those in FEF in two important respects. First, neurons in OcTh exhibit visual, visuomotor, and motor activity during delayed saccades (Wyder et al. 2003), a distinction that is the basis of the traditional functional classification of FEF cells (Bruce and Goldberg 1985). Second, OcTh neurons are able to discriminate relevant targets from irrelevant distracters when monkeys perform a simple two-alternative choice task (Wyder et al. 2004). In general, such differentiation suggests that an area may serve as an interface where perceptual and motor planning signals interact so that the former can inform the latter (Thompson et al. 1996, 1997, 2005; Shadlen and Newsome 1996, 2001; Gold and Shadlen 2000; Sato et al. 2001; McPeek and Keller 2002; Sato and Schall 2003; Steinmetz and Moore 2012). However, our earlier studies of OcTh did not determine whether its choice-related activity reflected perceptual decisions, saccadic selection, or both.
Here we investigate this issue by quantitatively comparing thalamic vs. FEF activity recorded in the same monkeys and with the same set of behavioral tasks and analysis methods. Our original goal was to search for evidence of a hierarchical relationship between cortical and subcortical selection-related activity by sampling the presumed initial (FEF) and final (OcTh) processing stages of a putative cortico-subcortical loop. To determine if the impact of perception on motor choice is systematically different at these two points, we relied on a novel choice task, the compelled saccade (CS) task. This task requires rapid perceptual judgments and, by design, decouples the initial saccade preparation process from the time course of the perceptual decision (Stanford et al. 2010; Shankar et al. 2011; Costello et al. 2013). This urgent decision-making task yields a wide range of outcomes, from random choices (guesses) to fully informed choices, all of which start with essentially the same motor plans (“same” in a statistical sense; i.e., as a distribution).
We found little evidence to suggest that the influence of perception on motor planning is markedly different in FEF vs. OcTh (e.g., exclusive to FEF, or appearing significantly earlier in FEF than OcTh). Rather, similar types of neuronal responses were found in both structures, and although the perceptual modulation corresponding to each type was stronger in FEF, in general it was qualitatively the same. However, neurons in OcTh demonstrated strong task dependence, typically firing significantly more vigorously and more selectively in the CS task than in either a similar, but easier, nonurgent choice task or in a single-target, delayed saccade task. This was particularly true for neurons that displayed spatially selective presaccadic responses. Furthermore, among those neurons, those that lacked a short-latency response to visual stimuli, and were thus classified as purely motor, were less influenced by perceptual information and fired much less intensely than their counterparts in FEF. Thus, in contrast to FEF, OcTh demonstrated a preference for saccadic choices specifically in the context of a task that is difficult, or cognitively demanding, and at the same time, contained a weaker representation of responses predominantly linked to saccade execution. The results suggest that the distinction between cortical and thalamic activity during perceptually driven choices may not reside so much in the particular combinations of perceptual and motor-planning signals that occur locally but rather in the broader behavioral or cognitive context in which the choice process takes place.
MATERIALS AND METHODS
Subjects and setup.
Two adult male rhesus monkeys (Macaca mulatta) were the experimental subjects. All experimental procedures were conducted in accordance with the National Institutes of Health Guide for the Care and Use of Laboratory Animals and U. S. Department of Agriculture regulations and with the approval of the Institutional Animal Care and Use Committee of Wake Forest School of Medicine.
Recordings in FEF and OcTh were obtained from the same two monkeys. The neuronal database from FEF and corresponding experimental methods were described previously (Costello et al. 2013), and similar procedures were followed in the case of OcTh. Briefly, an MRI-compatible post served to stabilize the head during behavioral training and recording sessions. Analog eye position signals were collected via scleral search coil (Riverbend Electronics) for monkey S and infrared tracking (EyeLink 1000; SR Research) for monkey G. Stimulus presentation, reward delivery, and data acquisition were controlled by a purpose-designed software/hardware package (Ryklin Software). Yellow, red, and green stimuli were illuminated on a 48 × 42 array of tricolor light-emitting diodes. The array was placed so that the distance between adjacent diodes was 1° of visual angle. Eye velocities were calculated numerically at each time point based on the recorded eye position signals. A saccade was identified as an event in which eye velocity exceeded 50°/s, and the corresponding time point was considered its onset.
Neural activity was recorded using single tungsten microelectrodes (2–4 MΩ; FHC) driven by a hydraulic microdrive (FHC). Individual neurons were isolated based on the amplitude and/or waveform characteristics of the recorded and filtered signals (Plexon; FHC). Putative FEF neurons were selected from areas in which saccade-like movements could be evoked by low current microstimulation (70-ms stimulus trains at 350 Hz, with amplitude equal to 50 μA) (Bruce and Goldberg 1985; Bruce et al. 1985; Stanford et al. 2010). OcTh regions were identified with the aid of reliable physiological landmarks (e.g., quiescence while the electrode traversed the lateral ventricle and resumption of activity upon entering the dorsal aspect of thalamus) and by characteristic firing modulations that coincided with task events. The majority of neurons were recorded unilaterally in both monkeys.
Behavioral tasks.
In the CS task (Fig. 1A), each trial begins with the presentation of a central fixation point, and its color, either red or green, identifies the eventual saccade target. While the monkey fixates the central spot, two yellow stimuli marking the two response choice locations appear at symmetric points in the periphery. The go signal (offset of the fixation spot) instructs the subject to initiate a saccade to one of the peripheral stimuli, although at the time of the go signal both are still yellow. The reaction time (RT) is measured from the onset of the go signal until the onset of the saccade, as in the other tasks. The identities of the target and distracter are revealed during the RT interval, after a variable delay referred to as the gap (50–250 ms), when one yellow spot turns red and the other one green. This event, the change from yellow to red/green, is called the cue, and its onset marks the time at which the sensory information relevant to the discrimination becomes available. Subjects receive a drop of water or juice as a reward for executing a saccade to the stimulus that matches the color of the fixation point (the target) within 600 ms. Note that 600 ms is the maximum RT allowed, but the saccade is normally initiated well before that, in under 350 ms. The control parameter is the gap; it specifies how long the sensory information (the cue) is withheld. The raw processing time, or rPT, is the maximum cue viewing time; it is the interval between cue onset and saccade onset, or
| (1) |
Fig. 1.
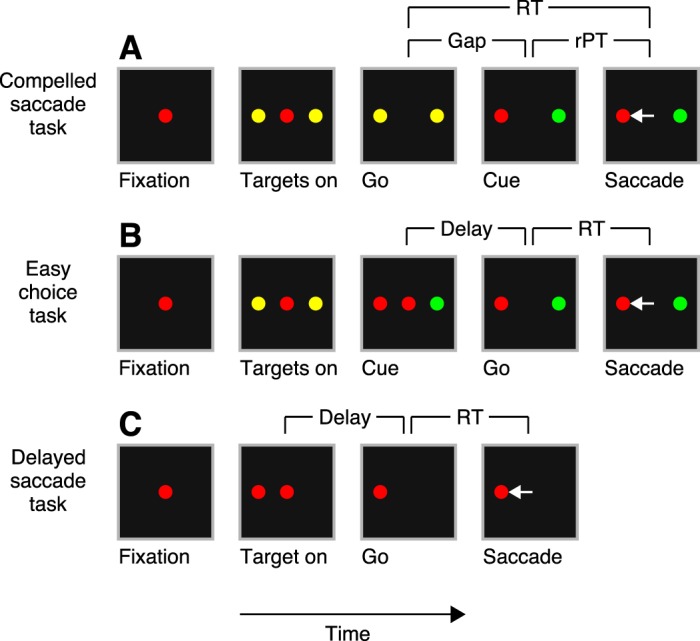
Three saccadic tasks used. In all tasks, the disappearance of the fixation point (Go) means “respond now!” and the reaction time (RT) is measured from the go signal to saccade onset. A: compelled saccade (CS) task. The go signal is given first, before the relevant sensory information (Cue) that indicates which choice is the correct one. If the chosen target matches the color of the fixation point (red in this example), the response is correct and a reward is obtained. The gap (50–250 ms) is the time interval between the go and the cue. The raw processing time (rPT) is the maximum amount of time during which the color information can potentially inform the saccadic choice. B: easy choice task. The events and perceptual discrimination are as in the CS task, except that the cue is revealed before the go signal. C: delayed saccade task. A single target appears (Target on) and the subject is required to make a saccade to it after a delay. White arrows indicate eye movements; they are not displayed.
where all values are trial specific. Gap values vary randomly from trial to trial.
In the easy choice task (Fig. 1B), the events, perceptual discrimination (red vs. green), and response rule (correct choice matches color of fixation point) are identical to those for the CS task, except that the cue is revealed before the go signal. Thus the urgency requirement is removed by providing the subject ample time to discriminate target from distracter before initiating a saccadic response. The control parameter in this task is the delay between cue onset and go signal (50–250 ms). The maximum amount of time that is available to view the cue is again the interval between cue onset and saccade onset, which in this case is rPT = RT + delay.
In the delayed saccade task (Fig. 1C), the start of each trial is the same as in the two choice tasks: the subject fixates on a central spot. Then, during fixation, a single target appears at a peripheral location, and after a variable delay (500-1,000 ms) following target onset, the go signal is given and the subject is rewarded for making a saccade to the lone peripheral stimulus. All stimuli have the same color in this task.
During experiments, the delayed saccade task was typically run first, to locate the response field (RF) of a neuron, before recording activity in the CS and easy choice tasks. RFs were mapped online by presenting single peripheral targets at 16 directions and 4 eccentricities (6, 10, 15, and 20°). Once the initial spatial characterization was completed, the three trial types were randomly interleaved. For both choice tasks, the two choice stimuli (target/distracter) were displayed simultaneously and were arranged so that one of them always appeared inside the RF and the other at the diametrically opposed location, outside the RF. Target/distracter locations and colors were randomly assigned across trials.
Neuron classification.
Neurons were classified by evaluating activity during the CS task (Fig. 2A) within time windows synchronized on stimulus onset (Targets on, in Fig. 1A) or saccade onset. For this procedure, the firing rate in each trial was calculated by counting spikes in the chosen time window and dividing by the window duration, and the mean rate was obtained by averaging over trials. A neuron was considered to be activated presaccadically, or to have motor-related activity, if its mean firing rate in a presaccadic window significantly exceeded that in a preplanning window (−50 to 50 ms with zero at the go). Because the presaccadic ramp-up ranged from gradual to abrupt, each neuron was evaluated with two presaccadic windows (either −110 to −10 ms or −60 to −10 ms with zero at saccade onset) and was considered to have motor-related activity if the test was significant in either of them at the P < 0.01 level (thus the effective significance level, adjusting for multiple comparisons, was 0.02 in this case). Significance was assessed via permutation test for paired data (Siegel and Castellan 1988; 100,000 permutations of the response epoch labels). A neuron was considered to be visually responsive, or to have a visual transient, if its mean firing rate in a poststimulus window (20 to 150 ms with zero at stimulus onset, or targets on) significantly exceeded (P < 0.01) its mean firing rate in a prestimulus window (−300 to 0 ms with zero at stimulus onset). Neurons were then classified as visual (V), motor (M), or visuomotor (VM), depending on whether activity exceeded baseline significantly in the visual, motor, or both visual and motor epochs, and neurons that did not satisfy either criterion were classified as flat (F) (Fig. 2B).
Fig. 2.
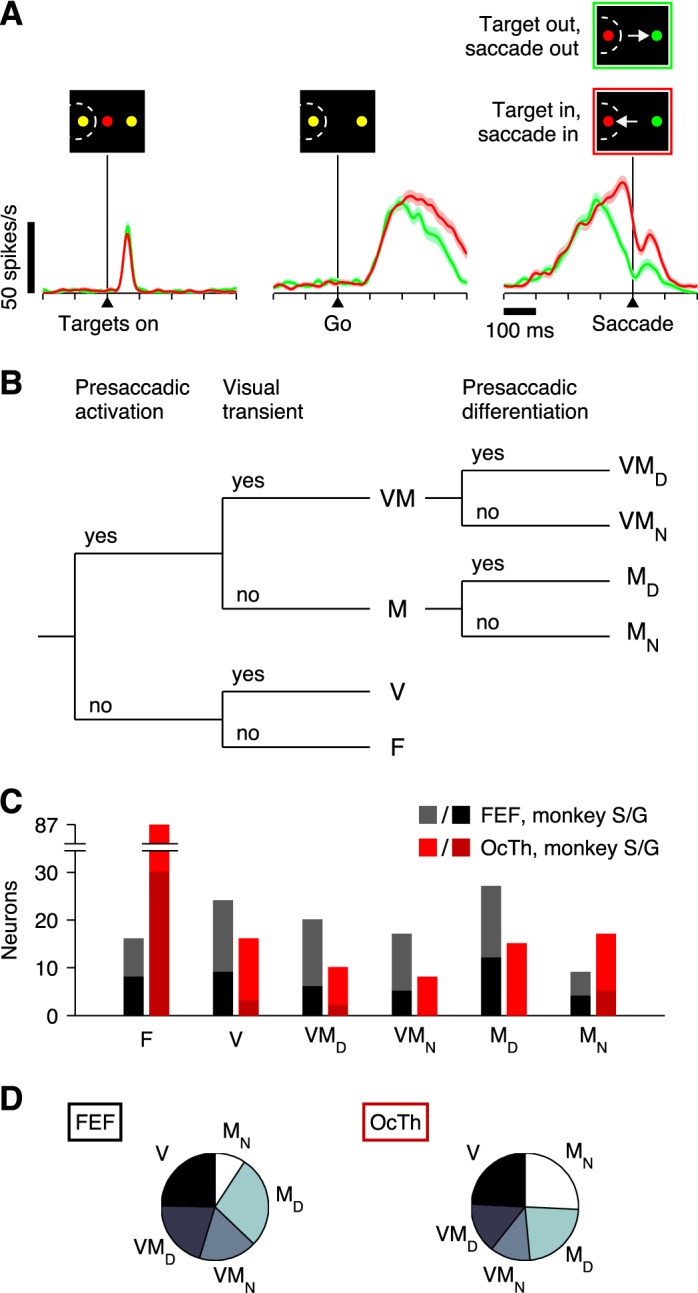
Neuronal classification. Six neuronal categories were defined based on the activity evoked during the CS task. A: example of a single OcTh oculomotor thalamus (OcTh) neuron recorded in the CS task. Traces show mean firing rate as a function of time for correct responses into (red) or away from (green) the response field (RF), with spike trains aligned on the onset of the choice targets (left), on the go signal (middle), and on saccade onset (right). Shaded areas indicate ± 1 SE across trials. All processing times were included. Note visual response following targets on, increase in firing before the saccade (i.e., activation), and differentiation between choices into and away from the RF. This unit was classified as visuomotor differential. B: decision tree indicating the 3 classification criteria used (top) and resulting neuronal categories: F, flat; V, visual; VMD, visuomotor differential; VMN, visuomotor nondifferential; MD, motor differential; and MN, motor nondifferential. In addition, the VM and M labels refer to visuomotor and motor groups, respectively, regardless of their differentiation. C: numbers of neurons of each type recorded in frontal eye field (FEF; black/gray bars) and OcTh (red bars). Light and dark shades indicate data from monkeys S and G, respectively. D: proportions of responsive neurons in FEF (left) and OcTh (right). Plots are based on the data in C with the F category excluded.
Neurons with significant presaccadic activation were further subdivided by comparing the mean firing rate for movements into the RF with that for movements to the diametrically opposed location (Fig. 2A, red vs. green). The same two presaccadic windows described above were tested, and both correct and incorrect CS trials for all rPTs were included for this comparison. The idea was to identify neurons whose presaccadic activity was spatially selective and thus putatively related to response selection. Neurons with significant (P < 0.01) spatial selectivity were classified as motor differential (MD) or visuomotor differential (VMD), whereas those that fired similarly in the two conditions were classified as motor nondifferential (MN) or visuomotor nondifferential (VMN). A decision tree summarizes the full classification process (Fig. 2B).
Besides the main classification criteria just described, a neuron was excluded from analysis if its maximum firing rate (or normalization factor; see below) was <10 spikes/s. This threshold simply identified cells that produced so few spikes that, given the available numbers of trials per cell, they could not be characterized reliably. In FEF, 6 of 119 neurons were so excluded, whereas in OcTh 28 of 181 neurons were. Except for one cell in FEF, all of these low-firing units would have been classified as F had they been included in the analyses. Thus the effect of the minimum firing requirement was to make the reported abundance of F neurons in OcTh somewhat more conservative.
Other response features were also seen in our neuronal samples. For instance, some of the M cells (8 in FEF; 3 in OcTh) showed a visually driven, transient drop in activity after the choice targets were presented, and eight neurons in each area (4 V and 4 F in both cases) showed a significant decrease in activity before saccade onset. However, because these effects were relatively weak and infrequent, roughly comparable in the two areas, and more difficult to interpret than the visual and motor response criteria described above, we concluded that they did not justify further refinement of the classification scheme. In regard to the neurons designated as F, some demonstrated a marked increase in activity after saccade onset, whereas others did not. The former were typical of FEF (14 of 16 F neurons had significant postsaccadic activity), and the latter, which lacked any appreciable task-related modulation, were the most common subtype in OcTh (61 of 87 F neurons had no significant postsaccadic activity). Further characterization of the postsaccadic responses is presented in results. Finally, we also examined the spatial distributions of RFs to determine whether FEF and OcTh differed in their degree of lateralization. For this, only responses in the delayed saccade task were considered, to avoid potential ambiguities introduced by the two simultaneous choice stimuli used in the choice tasks; also, F neurons were excluded, because it is unclear whether they should be considered omnidirectional or simply incompletely characterized (i.e., they might show a spatial preference when probed with other tasks). With analysis thus restricted to the subpopulations that were responsive in the delayed saccade task, OcTh showed a slightly higher fraction of ipsilateral neurons (13 of 54 non-F neurons, or 0.24) than FEF (18 of 92, or 0.20), but the difference was not significant (P = 0.24, binomial test). The ipsilateral neurons did not differ in any appreciable way from their contralateral counterparts; for instance, they included all the responsive categories (V, VM, M) in both areas.
Normalization of neural activity.
Continuous firing rate traces, or spike density functions, were computed by convolving evoked spike trains with a Gaussian function (σ = 15 ms; area under the curve = 1) and averaging across trials. For each cell, peak firing rates during a visual epoch (0 to 250 ms with zero at stimulus onset) and a motor epoch (−300 to 300 ms with zero at saccade onset) were determined from the spike density function in the CS task, and the larger of the two values was designated as the normalization factor of the cell. For each neuron, this same factor was applied to all behavioral tasks and spike alignments that required normalization. Continuous population responses (see Figs. 6, 7, 11, and 12) were generated by dividing the spike density function of each neuron by its normalization factor and averaging across neurons. This normalization procedure produces a time-resolved representation of population activity that gives equal weight to each neuron, and the weight is the same across tasks. When specifically examining overall responsiveness across tasks, raw, nonnormalized firing rates were considered instead (see below).
Fig. 6.

Presaccadic activity in FEF across tasks. All traces correspond to instantaneous firing rate as a function of time for correct responses into (red) or away from (green) the RF. Each trace is an average across all neurons recorded in each condition (n, indicated in each plot), where each neuron's contribution was divided by its overall maximum response (normalization factor; see materials and methods). Thus the y-axes represent normalized activity going from 0 (no firing) to 1 (maximum firing). Shaded areas indicate ±1 SE across neurons. All data are aligned on saccade onset. Columns correspond to different tasks, as marked at the top. A–F: responses for 6 neuron types, F (A), V (B), VMD (C), VMN (D), MD (E), and MN (F), as indicated on the right.
Fig. 7.

Presaccadic activity in OcTh across tasks. Same format and conventions as in Fig. 6.
Fig. 11.

Visual transient activity across tasks, in FEF and OcTh. All traces correspond to normalized firing rate as a function of time for correct responses into (red) or away from (green) the RF, averaged across all neurons participating in each condition (n, indicated in each plot). Shaded areas indicate ±1 SE across neurons. Data are aligned on the onset of the choice targets (CS task) or on the onset of the single saccadic target (delayed saccade task). Columns correspond to different tasks and areas, as marked at top. A–E: responses for 5 neuron types, F (A), V (B), VMD (C), VMN (D), and M (E) as indicated at right.
Fig. 12.

Postsaccadic activity across tasks, in FEF and OcTh. A: all traces correspond to normalized firing rate as a function of time for correct responses into (red) or away from (green) the RF. Results are averages across all FEF neurons selected as postsaccadic (see main text) in each condition (n, indicated in each plot). Shaded areas indicate ±1 SE across neurons. All data are aligned on saccade onset. Columns correspond to the three tasks, as marked at top. B: firing rate magnitudes (in spikes/s) for the 3 tasks shown in A, CS, EC, and DS. Each bar represents the mean rate computed in the 200 ms following saccade onset and averaged over all postsaccadic neurons, with error bars indicating ±1 SE across neurons. Red and green are for choices into (red) and away from (green) the RF, respectively. C: as in A, but from OcTh recordings. D: as in B, but from OcTh recordings. ⋆P = 0.0003, significant difference.
Statistical analyses.
All data analyses were performed using MATLAB (The MathWorks, Natick, MA). Behavioral curves and other functions of rPT were as described in previous reports (Stanford et al. 2010; Shankar et al. 2011; Costello et al. 2013). To make comparisons across tasks or conditions (e.g., long- vs. short-rPT trials), scalar responses were computed for each neuron by averaging across trials and over time, within time windows referenced to specific events (see Figs. 9 and 12, B and D). Each scalar response corresponds to a mean firing rate, where the rate in each trial is obtained by counting spikes in an epoch and dividing by the epoch duration, and the average is across trials. In the CS task, five scalar responses (mean firing rates) were calculated per cell: a visual response (window was 40 to 180 ms with zero at stimulus onset), a presaccadic response for movements into the RF (window was −100 to 0 ms with zero at saccade onset), a presaccadic response for movements away from the RF (window was −200 to 0 ms with zero at saccade onset), a postsaccadic response for movements into the RF (window was 0 to 200 ms with zero at saccade onset), and a postsaccadic response for movements away from the RF (window was 0 to 200 ms with zero at saccade onset). Analogous responses were computed for the other tasks using identical time windows. Note that different presaccadic windows were used for responses in opposite directions because these had different time courses; in particular, responses during saccades away from the RF tended to peak earlier (∼100 ms before saccade onset) than responses during saccades into the RF (around saccade onset). For subsequent comparisons across any two tasks, conditions, or recording areas, unless indicated otherwise, the significance threshold was P < 0.01 and its actual value was evaluated via a permutation test for paired or unpaired samples (Siegel and Castellan 1988), as appropriate. For example, to compare the responses of N neurons in task A vs. task B, first calculate the observed mean difference in activity, ΔRAB, and then calculate an identical statistic, , after randomly permuting, or shuffling, the task labels (A, B) independently for each neuron. This last step is performed multiple times with different, independent permutations. Then, if ≥ ΔRAB on, say, 20% of those permutations, we conclude that the probability of having observed the original difference ΔRAB just by chance was 0.2, and take that as its significance. For any statistic of interest, comparisons between arbitrary conditions can be performed similarly by permuting their corresponding labels. Because 100,000 permutations were used in all permutation tests, the smallest significance value for them is reported as P < 0.00001.
Fig. 9.

Firing rate magnitudes (in spikes/s) compared across tasks and neuronal types. Each colored bar shows the mean firing rate computed in a given time window (see materials and methods) and averaged over all neurons of the same class (labeled on the x-axis), with error bars indicating ±1 SE across neurons. Gray shades show the mean baseline activity ±1 SE computed before targets on. A: visual responses of FEF neurons following targets on. Each bar triplet indicates results from the CS task (all rPTs), the easy choice task (EC), and the delayed saccade task (DS), as labeled at bottom. B: responses of FEF neurons before movement onset. Red and green bars are for saccades into and away from the RF, respectively. Each bar triplet of the same color indicates results from the CS, EC, and DS task, as labeled at bottom. C: as in A, but from OcTh recordings. D: as in B, but from OcTh recordings.
The time windows just mentioned were effective in capturing various effects across tasks or conditions but were not necessarily optimal for any given neuron. To account for this, and verify that the results were not overly sensitive to the particular windows chosen, all analyses were repeated with alternative responses for each neuron. Again, five scalar responses were generated per cell, but in this case they were based on the maximum activity readout from the continuous spike density function around the appropriate event. For example, the visual response was taken as the maximum of the instantaneous firing rate trace (as in Fig. 2A, left) between 0 and 200 ms after stimulus onset. Pre- and postsaccadic responses were calculated similarly, based on the peak instantaneous firing rate found before or after the saccade (see Fig. 2A, right). Results based on this alternative derivation of the scalar responses were virtually identical to those based on fixed time windows. In particular, an alternative version of Fig. 9 based on peak responses was essentially indistinguishable from the original.
For all comparisons across processing times, short-rPT trials were defined as those for which rPT <150 ms, whereas long-rPT trials were defined as those for which rPT ≥ 150 ms. The same convention applies regardless of the quantities being compared (e.g., convexity, mean firing rate, etc.). The 150-ms reference point splits performance in the CS task approximately halfway between chance and maximum percent correct levels. Thus short rPTs correspond mostly to guesses, whereas long ones correspond predominantly to informed decisions. Although the rPT = 150 ms criterion may seem rather loose, we found that, across all statistical tests, it produced either as much or more statistical power than various other possibilities that were explored, which included 1) other fixed-threshold criteria, 2) a specific threshold criterion for each monkey, each data set, or each recording session, and 3) short and long intervals that excluded intermediate rPT values, with various exclusion ranges.
The majority of neurons were recorded in all three tasks, but others only in one or two. Whenever applicable, analyses across tasks were performed in two ways, 1) using all the recorded neurons, and 2) using only the units recorded in all three tasks. The results were always consistent. Comparisons based on the scalar mean rates described above are reported using all the available neurons to include as much of the data as possible. Analyses based on the preferred task order of each neuron (see below) were, by design, restricted to neurons recorded in all three tasks.
Impact of perceptual information quantified by convexity.
As detailed in our previous studies (Stanford et al. 2010; Costello et al. 2013), the cue information in the CS task is expected to accelerate the motor plan congruent with the target and decelerate the plan congruent with the distracter. In turn, acceleration and deceleration will manifest as changes in the curvature of the firing responses as functions of time. Thus, to quantify the impact of the cue information on the ongoing motor plans, we measured the convexity of the activity traces, which directly relates to their curvature. We used the exact same methods to compute convexity as in our previous study of FEF (Costello et al. 2013) but present the data in a slightly different way to facilitate the comparison with OcTh. First, instead of focusing on the temporal dependence of convexity on rPT, we maximize the contrast between informed and uninformed choices by considering just two rPT intervals, short (in which little acceleration/deceleration due to the cue information is expected) and long (in which cue-driven increases in acceleration/deceleration are expected). Second, to get a better sense of the consistency of the effects within our recorded samples, and across neuronal types, instead of reporting convexity values for population averages, we present them for single neurons.
Details of the calculations are as described by Costello et al. (2013). Briefly, the convexity of a curve f(t) is defined between two time points t1 and t2 and is equal to the average difference between the actual curve and the straight line that goes from f(t1) to f(t2). Thus, when between t1 and t2 the curve f is a straight line, its convexity is zero; when f always stays above the line, it bends downward and has negative convexity (i.e., it decelerates); and when f always stays below the line, it bends upward and has a positive convexity (i.e., it accelerates). Convexity has the same units as f, which represents instantaneous firing rate in our case, so spikes/s. For each neuron, convexity was calculated in each trial based on the continuous firing rate (or spike density function) of that trial aligned on saccade onset. For this, the time axis was rescaled according to the RT of each trial, as explained earlier (Costello et al. 2013), to reduce the variance unrelated to the cue. Those single-trial values were then sorted by choice (into the RF or away from the RF) and processing time (short or long) into four groups and were averaged accordingly to produce four mean convexity values for each neuron. Those four values are the ones plotted (see Fig. 8, B, D, F, and H) and discussed in the results. For choices away from the RF, convexity was calculated between −200 and 0 ms, with zero at saccade onset, and for choices into the RF, it was calculated between −120 and −20 ms, with zero at saccade onset.
Fig. 8.
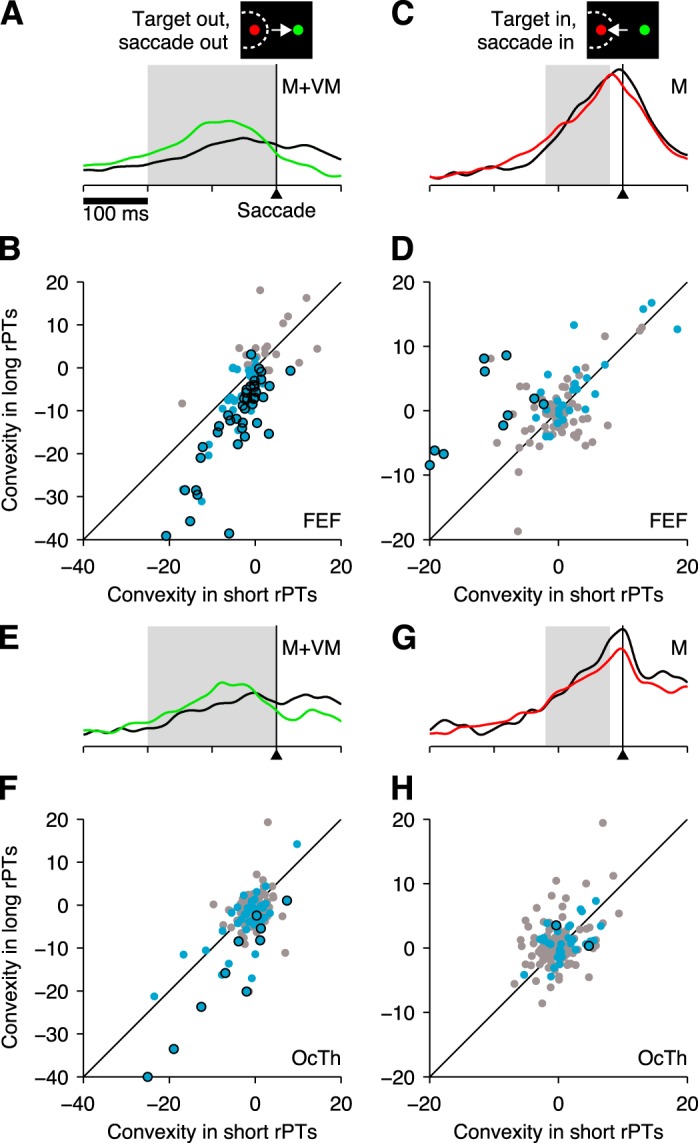
Impact of perceptual information quantified by convexity. A: normalized firing rate as a function of time for all M and VM neurons in FEF combined, for correct choices away from the RF. The 2 traces are for short- (black) and long-rPT (green) trials. Gray shade indicates 200 ms window used for measuring convexity in this condition. B: convexity values in long (y-axis)- vs. short-rPT trials (x-axis) for choices away from the RF. Each point corresponds to one FEF neuron, either with a motor response (M and VM types; blue dots) or without (F and V types; gray dots). Individually significant neurons (P < 0.05) in the former group are indicated by black outlines. The diagonal line marks equality across conditions. Convexity units are spikes/s. C: normalized firing rate as a function of time for all M neurons in FEF, for correct choices into the RF. The 2 traces are for short- (black) and long-rPT (red) trials. Gray shade indicates a 100-ms window used for measuring convexity in this condition. D: convexity values in long (y-axis)- vs. short-rPT trials (x-axis) for choices into the RF. Points correspond to FEF neurons of type M (blue dots) or of a different type (VM, F, or V; gray dots). Individually significant neurons (P < 0.05) in the former group are indicated by black outlines. For clarity, one outlier neuron with a highly negative value along the x-axis was placed exactly on the y-axis. E–H, As in A–D but for OcTh neurons. In F, for clarity, 1 outlier neuron with a highly negative value along the y-axis was placed exactly on the x-axis.
Analysis of task preference order.
For each neuron recorded in the three tasks, we determined its preferred task order according to the magnitude of the evoked presaccadic activity. We considered the scalar presaccadic response for correct choices into the RF, as described above, in each of the three tasks. The three mean firing rates associated with each neuron were then divided by the largest of the three to generate three normalized responses, rCS, rEA, and rDS, for the CS, easy choice, and delayed saccade task, respectively. Thus, for each cell, one of these responses was equal to 1 and the other two varied between 0 and 1. The three responses were ordered from largest to smallest, and the resulting sequence of task indexes was taken as the preferred task order of the neuron. A cell for which rCS > rEA > rDS, for example, prefers the CS task first, the easy choice task second, and the delayed saccade task third. We denote this particular order as (CS, EA, DS). With three tasks, there are 3! = 6 possible preferred task orders.
Having determined the preferred task order for each neuron, for each area (or for each cell type within an area) we compared the resulting distribution of preferences with that expected just by chance in the absence of any bias. That is, the null hypothesis was that any given neuron is equally likely to prefer any one of the six possible task orders. Based on this assumption, significance values were computed using binomial statistics (via the Matlab function binopdf). For example, suppose that in a population of 60 neurons, 20 of them prefer the task order (CS, EA, DS). Under the null assumption, the expected number is only 60 × (1/6) = 10, and the probability of observing at least 20 just by chance is P = 0.0012, which would be the reported significance.
Significance values calculated in this way were verified via a custom-designed permutation test in which, for each cell, the task labels for the three responses were shuffled. Indeed, results using the two methods were in full agreement. However, the permutation tests also allowed us to check the impact of a small number of cells for which the preferred task order was ambiguous because two of their response values happened to be identical. Permutation results using either strict inequalities (<), inclusive inequalities (≤), or excluding all ambiguous neurons from the analysis altogether, were virtually identical.
To visualize the resulting distributions of preferred task orders in the two areas, two quantities were calculated for each neuron,
| (2) |
Given that each task-specific response varies between 0 and 1, The above differences are equivalent to modulation indices for pairs of tasks. Take Iy as an example. When Iy = 0, there is no modulation between the CS and delayed saccade tasks, because the cell responds identically in both; when Iy = 1, the response in the CS task is nonzero, that in the delayed saccade task is zero, and the modulation is maximal; and when Iy = −1, the modulation is again maximal but in the opposite direction, i.e., in favor of the delayed saccade task. When these two differences are used as the axes in a scatterplot, the result is a graph (see Fig. 10) with six regions, or sectors, defined by three lines: Ix = 0, Iy = 0, and Iy = Ix. Each one of the six sectors corresponds to a task preference order. For instance, Ix < 0, Iy < 0, and Iy > Ix defines sector 3 (see Fig. 10A, numerical labels) and implies that rDS > rCS > rEA, which is order (DS, CS, EA). This geometrical construct provides an intuitive representation of the distribution of task preferences in each area but has no effect on the statistics.
Fig. 10.
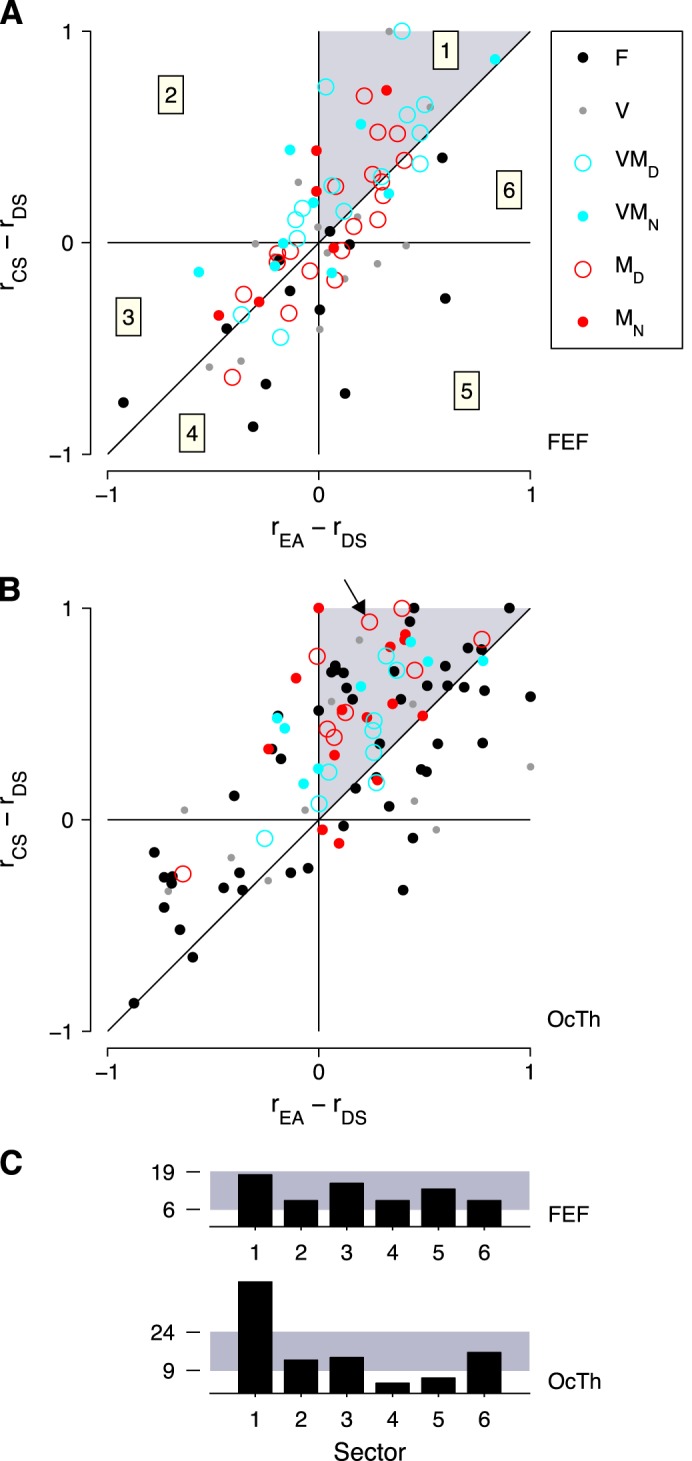
Preferred task order in FEF and OcTh. For each neuron recorded in the three tasks, differences in presaccadic responses across tasks were generated. The x-axes show the modulation between the easy choice (EA) and DS tasks, and the y-axes show the modulation between the CS and delayed saccade tasks. Responses are for correct movements into the RF only, and normalized for a maximum modulaton of ±1 (see materials and methods). A: task modulation in FEF. Each point corresponds to one neuron (n = 73). Numbers inside squares indicate the 6 sectors of the plot. Each sector corresponds to one of six possible task preference patterns. For sector 1 (gray shade), the preferred order is rCS > rEA > rDS. B: as in A, but for OcTh neurons (n = 97). Arrow points to the neuron in Fig. 5C. C: total number of neurons in each sector, for the data in A (FEF, top) and B (OcTh, bottom). Gray shade indicates the 95% confidence interval around the expected number of points per sector assuming no bias. Upper and lower limits are indicated in each case.
Testing for spatial homogeneity.
During each experiment in OcTh, a cell's recording site was specified by three coordinates. The first two were the position of the electrode on the cortical surface measured along the anterior/posterior and medial/lateral axes, with the origin on the center of the recording well. The third coordinate was electrode depth. Two statistical tests (see Siegel and Castellan 1988) were performed separately for each monkey to assess whether neurons of a given type G (e.g., V, VM, etc.) tended to be clustered or predominantly concentrated within particular penetrations. For these tests, none of the total recorded neurons were excluded.
First, we calculated the mean distance between all pairs of neurons in group G using all three coordinates and compared it to the mean distance computed identically but for a random group with the same number of recorded OcTh neurons from the monkey under consideration. By repeating the procedure for many (20,000) different random groups, we determined whether the units in group G were significantly closer together (or significantly further apart from each other) than expected by chance, under the null assumption that the physical separation between recorded cells does not depend on their specific type.
The second test indicated whether each electrode entry point on the cortical surface, or gridpoint, produced significantly more or significantly fewer neurons of type G than expected by chance, the null assumption being that those neurons are equally likely to be found at any such point, regardless of depth. First, the overall probability of recording a neuron of type G was calculated by dividing the total number of type G neurons by the total number of recorded OcTh neurons of the monkey under consideration. Then, with the use of binomial statistics, the likelihood of the number of type G neurons actually observed at that particular gridpoint was computed. A high likelihood was consistent with homogeneity, whereas a low value suggested a deviation from homogeneity, i.e., clustering.
Histology.
In one monkey (monkey S), lesions were made to verify that recordings were localized to the oculomotor thalamus (Fig. 3). Electrolytic lesions were made after two experimental sessions by applying 12 μA of current for 20 s at several locations. The lesion sites were chosen to mark boundaries and locations where OcTh neurons were recorded. Both monkeys were deeply anesthetized (sodium pentobarbital, 100 mg/kg iv) and perfused first with heparinized saline followed by 4% paraformaldehyde in 0.1 M, pH 7.2 phosphate buffer. This method conforms to recommendations of the Panel on Euthanasia of the American Veterinary Medical Association. After perfusion, the brain was blocked in the frontal plane and stored in cryoprotectanct (0.1 M, pH 7.2 phosphate buffer with 30% sucrose) at 4°C before being frozen and cut into 50-μm sections on a sliding microtome (American Optical). Every third section was mounted on a glass slide and stained with cresyl violet. Every sixth section was stained for cytochrome oxidase using a variation of the technique of Wong-Riley (1979) before being mounted. All sections were then dehydrated, cleared, and coverslipped. Areas of interest were photographed using the Nikon Elements control program to run a Nikon DXM 1200F digital camera on a Nikon E600 microscope. Contrast and luminance levels were adjusted in Photoshop.
Fig. 3.

Localization of thalamic recording sites. A: representative, low-magnification section from monkey S, stained for cytochrome oxidase activity. B: high-magnification view of the region inside the square in A. *Electrolytic microlesion made after a recording session. White arrows indicate electrode tracks. C: Nissl-stained section from monkey G. White arrows indicate gliosis around an electrode track. Same scale as in B. CL, central lateral nucleus; CM, centromedian nucleus; III, oculomotor nucleus; MD, mediodorsal nucleus; plMD, paralamellar mediodorsal nucleus; Pul, pulvinar; R, red nucleus; SM, stria medullaris; SN, substantia nigra; VP, ventral posterior nucleus.
Figure 3, A and B, shows a representative section demonstrating one of the lesions (asterisk) in monkey S, located in paralamellar MD. In the low magnification view (Fig. 3A), the effects of multiple tracks through the area of interest can be seen. There is a loss of cytochrome oxidase activity on the right side along the edge of MD. At higher magnification (Fig. 3B), individual electrode tracks can be visualized as light lines (white arrows) in the central lateral nucleus, one of the several nuclei within the internal medullary lamina, where the recording electrode decreased the cytochrome oxidase activity along its path. In the other animal (Fig. 3C), the path of a recent recording track is revealed by gliosis (white arrows). In this Nissl-stained section through the caudal MD, the track lies on the border between the paralamellar MD and the central lateral nucleus. All evidence points to recordings having been made primarily in the paralamellar MD nucleus and the central lateral nucleus.
RESULTS
We recorded single-unit activity from 181 neurons in OcTh and 119 in FEF of two macaque monkeys (Table 1). Of these, 153 in OcTh and 113 in FEF exceeded a minimum firing rate criterion and were considered for further analysis (see materials and methods). The FEF database was described at length in a previous publication (Costello et al. 2013); here we use it mainly as a point of reference for the results in OcTh.
Table 1.
Numbers of neurons and trials included in each database
| Neurons |
Trials per Task |
||||||
|---|---|---|---|---|---|---|---|
| Monkey | Area | Non-F | F | Total | CS | EC | DS |
| S | FEF | 61 | 8 | 74 | 18,293 | 4,787 | 3,335 |
| G | FEF | 36 | 8 | 45 | 7,953 | 2,715 | 1,406 |
| S | OcTh | 56 | 57 | 134 | 17,458 | 6,944 | 2,110 |
| G | OcTh | 10 | 30 | 47 | 4,709 | 1,320 | 566 |
Total numbers of neurons include non-flat (non-F), F, and units excluded from the analysis due to low activity (see materials and methods). Tasks are compelled saccade (CS), easy choice (EC), and delayed saccade (DS). FEF, frontal eye field; OcTh, oculomotor thalamus.
Three behavioral tasks (Fig. 1) were used to 1) investigate the participation of OcTh in saccadic choice behavior, and 2) compare its activity to that observed in FEF, a visuomotor area that has been studied much more extensively. The first task, the CS task (Fig. 1A), requires the subject to make an urgent perceptual decision; that is, the subject is compelled to respond before knowing the correct answer. The outcome of the perceptual evaluation is meant to inform motor plans that are already ongoing. The second task, the easy choice task (Fig. 1B), is based on identical sensory information and eye movements, but because the decisions occur in the absence of time pressure, it is much easier, i.e., the success rate is much higher. The key difference between these two choice tasks is the timing of the interaction between perceptual and motor planning processes. Finally, the third task, the delayed saccade task (Fig. 1C), does not involve a choice; a single target is presented and the subject is required to make a saccade to it after a delay.
Decision-making performance with and without time pressure.
The distinction between the two choice tasks is important for interpreting the neural data presented below, and to appreciate that distinction, consider how the urgency requirement of the CS task uniquely shapes the resulting behavioral curves of the subjects. Two features are most prominent. First, whereas the percentage of correct responses varies between 100% and chance (50%) as a function of the gap parameter (Fig. 4A), the mean RT changes only modestly within the same range (Fig. 4B). This is because the distribution of incipient motor plans that are initiated after the go signal is always the same, and since the perceptual information that is revealed later may either speed up or slow down those plans, its effect on the mean RT is, on average, relatively small (Stanford et al. 2010; Shankar et al. 2011; Salinas et al. 2014). That is the case on average, but on any given trial, the interplay between the competing motor plans (one favoring the target, the other favoring the distracter) and the perceptual information can take various forms, depending on when that information becomes available and on the initial bias of the motor competition. This results in a wide range of RTs (Salinas et al. 2010, 2014); hence the large variability in RT, particularly at long gaps (Fig. 4B, note SD bars). The second notable feature of the CS task is that performance varies much more tightly with processing time (rPT) than with gap time (Fig. 4, compare A vs. C). For instance, a difference of 50 ms in gap duration produces, at most, a change of 13–15 percentage points in performance, depending on the data set considered (Fig. 4A), whereas a difference of 50 ms in rPT produces a maximum change, around the steepest part of the curve, of 31–39 percentage points (Fig. 4C). Thus, by this measure, performance is two to three times more sensitive to rPT than to gap. This is because success in any particular trial depends critically on the amount of time that the subject has to view the color information, which is precisely the rPT. Based on the plots of percentage of correct choices as a function of rPT (tachometric curves; Fig. 4C), the monkeys needed roughly 150 ms of cue viewing time to discriminate red vs. green reliably above chance (Fig. 4C, gray lines). Notably, their behavior was highly consistent between the FEF and OcTh recording sessions (Fig. 4, compare red vs. black data).
Fig. 4.

Psychophysical performance in color discrimination with and without an urgency requirement. A: psychometric curve in the CS task: percentage of correct responses as a function of gap. B: chronometric curve in the CS task: mean RT (±1 SD) as a function of gap. Both correct and incorrect responses are included. C: tachometric curve in the CS task: percentage of correct responses as a function of rPT (equal to RT − gap). Gray vertical lines mark rPT = 150 ms, used to separate guesses from informed choices. D: psychometric curve in the easy choice task: percentage of correct responses as a function of delay. E: chronometric curve in the easy choice task: mean RT (±1 SD) as a function of delay. For comparison, blue shades indicate the mean RT (±1 SD) from all trials of the delayed saccade task (FEF and OcTh sessions combined) for each monkey. F: tachometric curve in the easy choice task: percentage of correct responses as a function of rPT (equal to RT + delay). In A–F, red and black lines and data points correspond to behavior during the FEF and OcTh recording sessions, respectively. See Table 1 for numbers of trials in each condition.
The impact of time pressure on performance is starkly revealed by comparing the results in the compelled and easy versions of the color discrimination task. When the perceptual evaluation is made first, without the urgency to respond, success is essentially guaranteed regardless of the length of the delay interval (Fig. 4D) or of processing time (Fig. 4F). The reason is simple: in most such trials the amount of cue viewing time far exceeds the minimum necessary for accurate color discrimination (≈200 ms), as can be read out from the tachometric curves of the CS task (Fig. 4C). Also of note, RTs in the easy choice task are generally shorter and much less variable than in the CS task (Fig. 4, compare B vs. E; note different scales on y-axis). This is because, in this case, the RT reflects the planning of a motor response that, for the most part, has already been spatially disambiguated. Indeed, RTs in the easy choice task were highly overlapping with those measured in the delayed saccade task (Fig. 4E, blue shades), in which there is no uncertainty about the saccadic target. For monkey G, the responses in the easy choice task were even faster than in the delayed saccade task, likely because during easy choices this monkey often tried to anticipate the go signal.
Neuronal types in OcTh and FEF.
To examine the diversity of the neural data, neurons were classified according to the visual and saccade-related activity evoked in the CS task (Fig. 2A, example neuron). Identical criteria were used for the FEF and OcTh recordings. A neuron's classification depended on 1) whether it displayed a significant response to the appearance of the choice targets (Fig. 2A, left), with one always placed in the RF and the other outside; 2) whether its activity increased significantly before the saccade (Fig. 2A, right); and 3) whether it fired differently for eye movements into the RF (Fig. 2A, red traces) vs. away from the RF (Fig. 2A, green traces). By combining these three criteria, visual responsiveness, presaccadic activation, and spatial selectivity, the two sampled populations were subdivided into six categories with various degrees of visual and motor-related involvement (Fig. 2B). Each of these types could, at least in principle, contribute differently to perceptually driven choices.
All six neuronal classes were well represented in both structures (Fig. 2C), but notably, the number of F or flat neurons, which showed neither a visual transient nor saccade-linked activation, was much larger in OcTh (87 of 153, or 57%) than in FEF 488 (16 of 113, or 5.3%). In FEF, most of the F neurons showed purely postsaccadic activation, whereas in OcTh, this was true for slightly fewer than one-third of those so classified. Further comparison of the postsaccadic responses is presented below, but the main point concerning the F category is that a substantial number of OcTh neurons failed to demonstrate activity with a clear temporal linkage to a specific task event; yet, as discussed later on, the activity of such neurons did demonstrate sensitivity to task type.
Impact of perception on saccadic choice.
To evaluate the impact of perceptual information on motor planning, we examined the activity evoked before the saccade in each type of neuron and in each task. This analysis is first illustrated for a single OcTh neuron (Fig. 5); the contrast between FEF and OcTh is discussed afterward, based on averaged population activity.
Fig. 5.
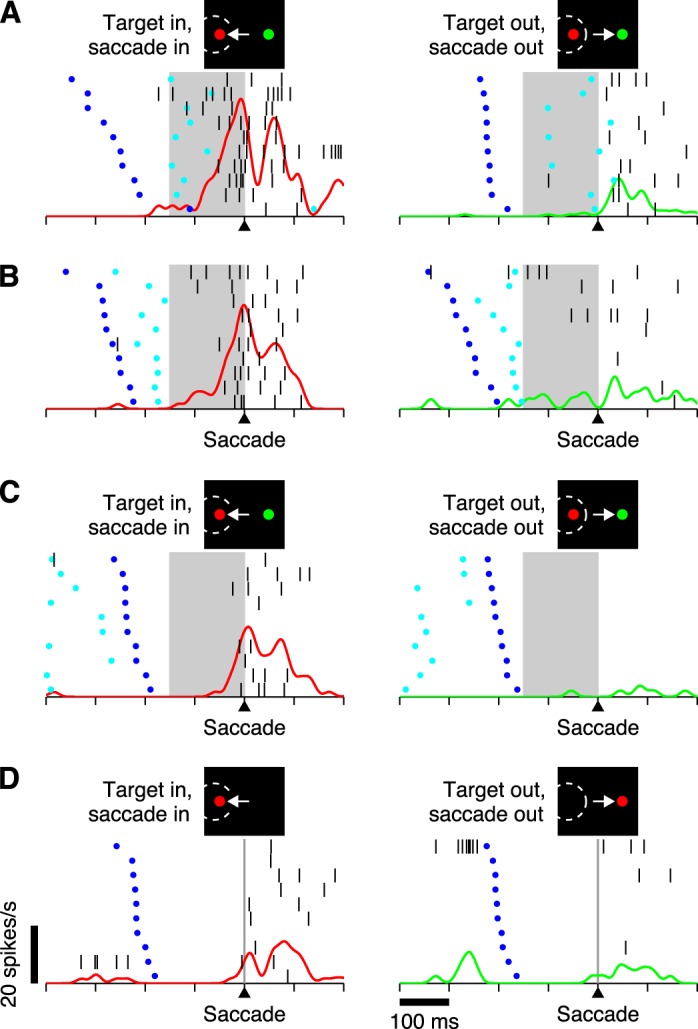
Responses of a single neuron recorded from OcTh in the 3 tasks. All trials correspond to correct saccadic choices, either into (left column) or away from (right column) the RF of the cell. Different panels are for different experimental conditions. Each panel shows instantaneous firing rate as a function of time (red/green continuous traces) superimposed on a corresponding spike raster. Each raster plot consists of 10 randomly selected trials (rows) sorted by RT, from long (top) to short (bottom). Each trial in a raster indicates when the go signal (dark blue dots), the cue (light blue dots; for choice tasks only), and individual action potentials (vertical black lines) occurred. All data are aligned with respect to saccade onset (triangles on time axis). A: responses in short-rPT trials (rPT < 150 ms) of the CS task, which correspond to guesses. B: responses in long-rPT trials (rPT ≥ 150 ms) of the CS task, which correspond to informed choices. C: responses in the easy choice task. D: responses in the delayed saccade task. Shaded areas mark the critical 150-ms interval that precedes the saccade in the choice tasks. Scale bars in D for time axis and firing rate traces apply to all plots. This neuron was classified as MD.
For each neuron, the CS trials were divided into two groups based on cue viewing time (see materials and methods). In the first, trials had short processing times (rPT < 150 ms; Fig. 5A), which, according to the tachometric curve (Fig. 4C), are indicative of guesses. In those cases, the cue was revealed shortly before the saccade (Fig. 5A, note cyan dots inside shaded areas), so typically there was insufficient time for the color information to influence the choice. In the second group, trials had long processing times (rPT ≥ 150 ms; Fig. 5B), which correspond predominantly to perceptually informed decisions. In those trials, the cue was revealed earlier (Fig. 5B, note cyan dots outside shaded areas), so typically there was enough time for the color information to guide the choice. This division is important because differences in neuronal activity between the two groups of trials are directly related to the impact of perceptual information (Stanford et al. 2010; Salinas et al. 2010; Costello et al. 2013). Notably, this distinction is quite different from that between correct and incorrect choices: for short-rPT trials, correct responses are about as frequent as incorrect ones, because guesses can go either way, whereas for long-rPT trials, choices are mostly correct, precisely because they are informed by the cue (Fig. 4C, note gray lines). In comparing short vs. long-rPT trials for correct responses only, the goal is to isolate the effect of perception on otherwise identical saccadic choices.
Processing times are even longer in the easy choice task. In that case, the cue is revealed before the go signal is given (Fig. 5C, note cyan dots before dark blue dots), so the rPT often goes far beyond 200 ms (Fig. 4F). At that point, performance is very near 100% correct (Fig. 4F), and little ambiguity in the motor choice is to be expected, given that the perceptual decision can be resolved much earlier. As a reference, and to assess elementary visual and motor properties, activity in the choice tasks was also compared with that in the single-target, delayed saccade task (Fig. 5D). The responses of the example neuron in Fig. 5 not only illustrate the relationships between neuronal activity and task events but also recapitulate several of the features found in the population analyses, which are elaborated below. Most prominently, the cell's discharges leading to saccades into the RF are more intense when the task is highly demanding (Fig. 5A, red trace) than when the task is less so (progressively easier from Fig. 5B to C to D). Thus, considering the three behavioral tasks and based on its presaccadic activity (mean firing rate in a 100-ms window preceding movements into the RF), the preference order of this neuron is CS first (17.6 ± 1.9 spikes/s, mean ± SE), easy choice second (5.4 ± 1.7 spikes/s), and delayed saccade third (1.2 ± 0.8 spikes/s). Also note that the same progression as a function of task difficulty is also seen in the postsaccadic discharges.
Single-cell responses were normalized and averaged by neuronal type to create separate population responses (see materials and methods) for FEF and OcTh (Figs. 6 and 7, respectively). These were parsed by saccade direction, processing time, and task, as described above for the example neuron, and the results were compared across neuronal categories and brain areas. With spike trains aligned on saccade onset, and based on our previous studies (Stanford et al. 2010; Salinas et al. 2010; Costello et al. 2013), the impact of perceptual information during the CS task was expected to manifest in two ways. First, as a subtle effect for movements into the RF; specifically, a more upwardly curved response profile in long- vs. short- rPT trials (Fig. 5, compare red traces in A vs. B; Figs. 6 and 7, compare red traces in 1st vs. 2nd columns). Second, as a relatively strong effect for movements away from the RF; specifically, increased activity followed by a steeper, more profound suppression before saccade onset in long- vs. short-rPT trials (Fig. 5, compare green traces in A vs. B; Figs. 6 and 7, compare green traces in 1st vs. 2nd columns). In other words, the correct motor plan (toward the target; red) should increase its steepness slightly more as it approaches the onset of the saccade during informed than uninformed choices, whereas the incorrect motor plan (toward the distracter; green) should make a markedly larger excursion before being strongly suppressed during informed compared with uninformed choices.
Both of these effects were most evident in the spatially selective motor cells in FEF (MD; Fig. 6E, 1st and 2nd columns), and the latter was also clear in the spatially selective visuomotor neurons (VMD; Fig. 6C), as reported earlier (Stanford et al. 2010; Costello et al. 2013). However, the activity away from the RF was significantly stronger in long- vs. short-rPT trials even when all the presaccadically activated neurons in FEF were considered, regardless of their differentiation (Fig. 6, C–F; P < 0.00001; n = 72). In OcTh the relevant neuronal sample was smaller and the population averages more noisy, but the differences between short- and long-rPT trials were comparable to those found in FEF (Fig. 7, 1st and 2nd columns). In particular, the activity for saccades away from the RF was also significantly stronger in the latter condition when all the activated neurons were considered (Fig. 7, C–F; P = 0.0006; n = 47). This means that the impact of perceptual information on the neuronal activity evoked during urgent decisions is qualitatively the same in the two areas, at least in terms of its strongest manifestation, i.e., the amount of activity associated with the direction opposite to the choice.
We consider the rPT-dependent modulations in neuronal activity observed in the CS task to result from a motor planning process that is influenced by the perceptual evaluation of the cue. One might wonder, however, whether such modulations might also relate to low-level oculomotor quantities, such as saccade velocity. Saccade kinematics indeed demonstrate some effects in our task, but they are small and do not bear a simple relationship to neuronal firing. Peak saccade velocity in the CS task varies with processing time (rPT) such that informed and uninformed choices differ slightly: maximal variations in peak saccade velocity are on the order of 5%, much smaller than the modulations in firing rate seen across tasks, or across rPTs for choices away from the RF. Furthermore, this difference in velocity is most visible when correct and incorrect choices are separated, which implies that neuronal activity and saccade velocity are only loosely associated. Therefore, to a first approximation, the recorded activity is independent of peak saccade velocity.
To evaluate the impact of perception on motor choice more closely, we computed a quantity that directly correlates with the curvature of the evoked firing activity as a function of time, convexity (see materials and methods). The convexity of a function f(t) is calculated over a time window and is proportional to the mean acceleration or deceleration of the function in that window. When f follows a straight line over the chosen interval, its convexity is zero; when f curves downward, its convexity is negative, indicating net deceleration, and when f curves upward, its convexity is positive, indicating net acceleration. For each neuron, we measured four mean convexity values according to choice (into or away from the RF) and processing time (short or long). The calculation of convexity was the same as in our previous report (Costello et al. 2013), but here we present the results for individual neurons, which allows a more thorough comparison across areas (see materials and methods).
In FEF, the results were in full agreement with those reported previously (Stanford et al. 2010; Costello et al. 2013). That is, for choices away from the RF, the neurons with presaccadic activity (M and VM) had more negative convexities in long- than in short-rPT trials (Fig. 8B, blue dots), demonstrating stronger deceleration of the nonchosen motor plan when the cue information becomes available early. This was evident not only by comparing the mean convexities (averaged across cells) in the two conditions [−3.6 ± 0.6 (SE) for short- vs. −9.8 ± 1.2 for long-rPT trials; n = 72; P < 0.00001] but also by noting the high number of single neurons with individually significant differences (Fig. 8B, blue dots with black outline; 40 of 70 M or VM cells had significantly more negative convexity in long- than in short- rPT trials at the P < 0.05 level, and the probability of observing at least that many by chance is P = 10−32, binomial test). These numbers confirm what is plainly visible from the continuous population traces corresponding to the two conditions (Fig. 8A): the trajectory of the distracter-related motor plan in FEF reaches a higher level and curves downward much more abruptly during informed choices (green trace) than during guesses (black trace). Also of note, the FEF neurons lacking motor activity (V and F) showed no such effect (Fig. 8B, gray dots).
A similar analysis for choices into the RF confirmed the second, more subtle effect described earlier (Costello et al. 2013) in FEF motor neurons. That is, the M cells had more positive convexities in long- than in short-rPT trials (Fig. 8D, blue dots), demonstrating slightly stronger acceleration of the chosen motor plan, within ∼120 ms of saccade onset, when the cue information becomes available early. The difference between informed and uninformed choices was much smaller in this case than for choices away from the RF but was still appreciable in the continuous population traces in FEF (Fig. 8C): in the informed condition (red trace), the trajectory of the chosen motor plan curves slightly upward as it approaches saccade onset, whereas during guesses (black trace), the trajectory curves slightly downward. Although the geometrical variation is more subtle in this case, it was again quantitatively manifest not only as a highly significant difference in the mean convexity values averaged across cells (−1.9 ± 1.4 vs. 2.3 ± 1.0, n = 35, P = 0.0003), but also in the number of neurons that were individually significant (Fig. 8D, blue dots with black outline), which was much higher than expected by chance (10 of 35 M cells had significantly more positive convexities in long- than in short-rPT trials at the P < 0.05 level, and the probability of observing at least that many by chance is P = 6 × 10⁻⁶, binomial test). Thus, for saccades into the RF, some of the FEF motor neurons (8 MD and 2 MN) displayed particularly strong acceleration during informed vs. uninformed choices. Also of note, besides the M, no other type in FEF showed comparable trends (Fig. 8D, gray dots).
These results recast our previous findings showing that, during the CS task, perceptual information modulates the choice-related firing of FEF neurons, with the modulation taking a particular functional form: acceleration of the target-related motor plan and deceleration of the competing, distracter-related plan. In the present instantiation, the results demonstrate that these effects are apparent at the single-neuron level. Identical analyses based on convexity were performed on the OcTh database, and the results showed general agreement with those in FEF, albeit with a tendency for perceptual information to have a weaker impact on the thalamic activity.
For choices away from the RF, the convexity of neurons with presaccadic activity (M and VM) was indeed substantially more negative in long- than in short-rPT trials (Fig. 8F, blue dots), both on average (−2.6 ± 1.1 vs. −5.7 ± 1.7; n = 47; P = 0.0005) and in terms of the number individually significant neurons (Fig. 8D, blue dots with black outline; 10 of 47 M or VM cells had significantly more negative convexity in long- than in short-rPT trials at the P < 0.05 level, and the probability of observing at least that many by chance is P = 9 × 10⁻⁵, binomial test). These numbers again match the different trajectories of the corresponding continuous population traces in the two conditions (Fig. 8E). Thus, by all of the quantitative criteria examined, in OcTh the deceleration of the competing, nonchosen motor plan was patently stronger for informed choices than guesses. The results were perhaps slightly weaker than the equivalent ones in FEF but quite robust nonetheless.
In contrast, for saccades into the RF, the results were not the same in the two areas. In this case, the convexity of the M neurons in OcTh was virtually identical for informed and uniformed choices (Fig. 8H). First, the mean convexity values averaged across cells were indistinguishable (1.0 ± 0.5 vs. 1.0 ± 0.5; n = 32; P = 0.6). Second, there were only two neurons with individually significant differences (vs. 1.5 expected by chance), and for one of these the effect had the opposite sign (Fig. 8H, blue dots with black outline). Third, these numbers are clearly in agreement with the shapes of the continuous population traces for the two conditions (Fig. 8G), which show essentially no difference in curvature: the trajectory of the chosen motor plan during uninformed choices (black trace) is slightly steeper than during informed (red trace), but what matters is that both are approximately straight, consistent with convexity values close to zero. Similar analyses were applied to all other neuronal categories in OcTh to make sure that we did not miss any neurons that might have been sensitive to acceleration. However, no single category or combination of categories in OcTh showed a significant difference in convexity for saccades into the RF.
Based on these results, one might be tempted to conclude that, during informed choices, a cue-driven acceleration of the motor plan in the direction of the target is present in the responses of M neurons in FEF but not in their counterparts in OcTh. Although this is certainly a possibility, there are two reasons to be cautious with such interpretation: first, because the magnitude of the acceleration effect was relatively subtle even in FEF, and the number of sampled M neurons was smaller in OcTh (n = 32) than in FEF (n = 47), and second, because the M neurons in OcTh tended to fire substantially less than those so classified in FEF (see below). These two limitations conspire so that, given similar numbers of trials per neuron, an identical acceleration as that acting in FEF would be less likely to be detected in OcTh to begin with. For this reason, and considering the clear deceleration observed on the distracter-related motor plans in OcTh, perhaps a more conservative conclusion is that the cue information has a qualitatively similar impact on saccade-related activity in FEF and OcTh but that impact is stronger on the former than the latter.
Another way to think about the distinction between guesses and informed choices in the CS task is that the latter typically occur when, initially, there is a tighter, less biased competition between the two possible motor plans, and this ambiguity is eventually resolved by the influence of perceptual information. Therefore, whereas during short-rPT trials one of the motor choices is randomly favored early on, during long-rPT trials the initial motor conflict is strong and disambiguated late in the trial. This intuition, that the initial bias of the motor conflict varies strongly across trials, helps to explain what happens in the easy choice task: in that case, the cue is presented much earlier, and so the motor competition should be resolved sooner than in the CS task (Costello et al. 2013). Indeed, in the easy choice task the incipient motor conflict is quickly resolved in favor of the correct choice (Figs. 6, and 7, 3rd column). The neuronal responses away from the RF of all activated neurons (Figs. 6 and 7, C–F, green traces) were significantly weaker than in either of the two CS conditions, both in FEF (P = 0.0002, n = 47) and OcTh (P < 0.00001, n = 47). Thus the early presentation of the cue information had the expected consequences in both areas.
To summarize the results in this section, overall, the observed trends in OcTh were consistent with those obtained in FEF. No evidence was found to suggest that that perceptual information in the CS and easy choice tasks impacts presaccadic thalamic responses any differently than presaccadic responses in FEF, although the rapid rPT-dependent modulation seen in the CS task is possibly of a lesser magnitude in OcTh, particularly for neurons of the M type.
Task-dependent presaccadic activity.
The activity in OcTh was consistent with that in FEF in a key aspect, namely the impact of perception on saccadic choices. However, differences between FEF and OcTh were evident when comparing activity across the three tasks. In OcTh, the responses preceding movements into the RF were somewhat less vigorous in the easy choice task than in the CS task, and more attenuated still in the delayed saccade task (Fig. 7, C–F, red traces; also Fig. 5, left column). This task dependence was a very general effect that was consistent across multiple statistical comparisons. For instance, the presaccadic activity preceding movements into the RF was significantly higher in the CS task than in the delayed saccade task for all six neuronal categories individually (P < 0.008), except for the V neurons (Fig. 7B; P = 0.45; n = 11) and the VMD neurons, which showed just a marginally significant decrease (Fig. 7C; P = 0.02; n = 9). Interestingly, the attenuation was highly significant for the F neurons (Fig. 7A; P = 0.003; n = 51), even though their activity remained flat in all three tasks. This suggests that the observed differences in responsivity were both widespread across neurons and truly task dependent, rather than linked to specific events. Also, the attenuation was particularly strong for the M, or purely motor neurons (Fig. 7, E and F; P < 0.00001; n = 23 MD and MN together). This was somewhat surprising because, a priori, such neurons would be the ones most likely to have a relatively well-defined function, contributing to saccade production. Indeed, the responses of M neurons in FEF were consistently brisk for all saccades into the RF, regardless of task (Fig. 6, E and F, red traces; P = 0.46). Therefore, in view of the results, if the M neurons in OcTh do participate in generating saccades, then their contribution must be strongly task dependent.
These differences in responsivity across tasks are better visualized by plotting mean firing rates, calculated over fixed time windows and in actual spikes/s (i.e., without normalization; see materials and methods), for movements into and away from the RF for each of the three tasks and each of the six neuron types (Fig. 9, red and green bars). Presented in this more compressed format, it is apparent that the responses of M neurons in OcTh are not only task dependent but also comparatively weak next to those of VM neurons in OcTh and M neurons in FEF. It is also clear that, compared with their counterparts in FEF, neurons in OcTh demonstrate a much weaker spatial selectivity in the delayed saccade task (Fig. 9, B and D, note difference between rightmost red and green bars for each neuron type). In summary, thalamic neurons show a strong task dependence that is not seen in FEF, the sole exception being the VMD neurons, which respond quite similarly in the two structures.
The observed task dependence in OcTh is interesting because it occurs specifically for choices into the RFs of the neurons. The activity for away choices is expected to be highly variable, because it should reflect not only how far the sensory input and saccade vector are from the configuration that maximally activates the neuron, but also, in the case of motor-related activity, the motor conflict inherent to the choice process (Cisek and Kalaska 2010; Klaes et al. 2011; Costello et al. 2013). Indeed, the responses of M and VM neurons to movements away from the RF in both areas varied strongly across tasks (Fig. 9, B and D, green bars), in agreement with the corresponding degree of conflict: high for the CS task, intermediate for the easy, and minimal for the single-target, delayed saccade task. In contrast, such variation for eye movements in the preferred direction of the cells is unusual; if anything, less conflict should lead to more activity in that case.
Instead, note that, for all the neuron types in OcTh, with the exception of the V cells, presaccadic response magnitudes for movements into the RF follow the same order: CS task > easy choice task > delayed saccade task (Fig. 9D, red-bar triplets). This suggests that response magnitude decreases as the task becomes less difficult or less cognitively demanding. We hypothesized that this preference pattern is also typical of the individual neurons in the population, i.e., that it is the dominant form of task dependence found in single OcTh cells.
To statistically test this conjecture, we ranked the responses of each neuron in the three tasks and then analyzed the frequencies of all the possible preference order patterns. That is, we asked how many neurons preferred the three tasks in the order rCS > rEA > rDS, or rDS > rEA > rCS, or any other of the six possible permutations, where rCS, rEA, and rDS are presaccadic responses for choices into the RF in the CS, easy choice, and delayed saccade tasks, respectively (see materials and methods). This analysis has important advantages over the pairwise comparisons discussed at the beginning of this section. First, we use it to test one specific hypothesis, i.e., the prevalence of one particular task order. Second, significance can be assessed by comparing the resulting frequencies with those expected in the absence of any bias in preference, and because all possible response triplets are considered simultaneously, the results are not prone to statistical bias due to multiple comparisons between tasks. Third, this test is also more rigorous in that it only includes neurons that were recorded in the three tasks.
The results of this preference order analysis, and the comparison across areas, can be better appreciated by projecting each response triplet onto a two-dimensional graph. That is, for each neuron, two combined variables were created out of the responses in the three tasks. These were rEA − rDS and rCS − rDS. When used as the x and y coordinates of a scatterplot, the result is a graph with six sectors (Fig. 10A, sectors indicated by numbers), in which each point is one neuron and each sector is one of the six possible task preference patterns (see materials and methods). To see the correspondence, consider the relationship between the six sectors and the three lines that divide them, the horizontal and vertical axes, and the diagonal line. Separated by the x-axis, the top half of the graph contains neurons that prefer the CS over the delayed saccade task (rCS > rDS), whereas the bottom half contains those with the opposite preference (rCS < rDS). Similarly, divided by the y-axis, the right half of the graph contains neurons that prefer the easy choice over the delayed saccade task (rEA > rDS), whereas the left half contains units with the opposite preference (rEA < rDS). Finally, neurons that prefer the CS over the easy choice task (rCS > rEA) are above the diagonal, whereas those with the opposite preference (rCS < rEA) are below it. Any bias in the distribution of points relative to these three lines is an indicator of bias in task preference across neurons, and furthermore, each sector identifies one of the six possible relationships between the three tasks.
With this in mind, note that, in FEF (Fig. 10A), points are evenly distributed top vs. bottom, left vs. right, and above vs. below the diagonal (P > 0.12 in all cases). This means that there are no gross biases in response modulation across tasks. In contrast, in OcTh (Fig. 10B), there is a significant bias in each of the three directions (P < 0.0003 in all cases). Crucially, the points are most concentrated in one particular sector, sector 1 (Fig. 10B, gray shade; Fig. 10C). Many more points fall on that one sector than expected just by chance, assuming an even distribution across sectors (44 of 97 OcTh neurons; P = 4 × 10⁻¹¹, binomial test). Now, because that sector is precisely the one for which rCS > rEA > rDS, another, equivalent way to state this geometrical result is this: the preferred task order observed on the average OcTh data is, by far, i.e., with very high significance, the most common one found in individual neurons. This was true when considering all the cells that were probed with all three tasks (44 of 97 neurons; P = 4 × 10⁻¹¹, binomial test; all points on Fig. 10B considered) and was also the case for four of five neuron classes that were tested individually (MD, MN, VMD, and F were significant; P < 0.002; VMN were not; P = 0.1, binomial tests). That is, when tested individually, symbols of a specific type in Fig. 10B were also much more likely to fall on the gray sector, sector 1, than expected by chance. The trend was strongest when considering only the spatially selective neurons, MD and VMD (14 of 18 neurons; P = 2 × 10⁻⁸, binomial test; Fig. 10B, red and blue open circles), but it was clear even when the test was restricted to the F neurons alone (17 of 47 neurons; P = 0.001, binomial test; Fig. 10B, black dots). In other words, most cell types in OcTh show the same task preference order.
It is also interesting that the opposite preference order, rDS > rEA > rCS, in which the response is strongest for the simplest task and weakest for the most difficult, was almost never observed in the OcTh sample (Fig. 10, B and C, sector 4). The scarcity of neurons with such preference was unlikely due to chance, because it was significant even with respect to the distribution of points in sectors 2–6 only, i.e., the number of neurons with the opposite preference was lower than expected even when taking all the neurons in sector 1 out of the statistical calculation (only 4 of 53 neurons in sector 4; P = 0.012, binomial test).
In contrast, in FEF these same analyses revealed only a weak tendency for neurons to fall on the gray sector (Fig. 10A, sector 1; Fig. 10C), i.e., a small bias favoring the order rCS > rEA > rDS. The bias was marginally significant when considering all the FEF neurons probed with the three tasks (18 of 73 FEF neurons; P = 0.052, binomial test; all points on Fig. 10A considered), but more importantly, it was driven by a single class, the VMD neurons (8 of 14 neurons; P = 0.0007, binomial test; Fig. 10A, open blue circles). No other individual class in FEF showed a significant bias (MD, MN, VMN, F; P > 0.2, binomial tests), and when the VMD cells were excluded from the FEF sample, the preference vanished (10 of 59 neurons; P = 0.53, binomial test; all points on Fig. 10A except open blue circles considered). It is noteworthy, then, that those VMD cells were generally the most similar to their counterparts in OcTh (Fig. 9, compare VMD data in B vs. D).
In this analysis, including or excluding the V neurons from the OcTh and FEF populations made virtually no difference in the statistics. Furthermore, with one exception, all of these results were essentially identical when, for each neuron, the baseline firing rate (measured before the go signal) was subtracted from the mean presaccadic response. The exception, of course, were the F neurons, for which, by definition, activity remained statistically constant between fixation and saccade onset, and so subtracting the baseline eliminated any task modulation. Aside from this trivial case, it did not matter how exactly each neuronal response was defined, whether equal to the evoked presaccadic activity directly or relative to the baseline.
In conclusion, in regard to their presaccadic activity, individual OcTh neurons typically fired most intensely in the CS task, less so in the easy choice task, and even more weakly in the delayed saccade task. This task-dependent preference was much more rare in FEF and was limited to a single neuronal type, the VMD.
Visual transient responses.
The transient activity evoked by stimulus onset is not necessarily the same in the choice tasks and in the delayed-saccade task, because there are two choice targets in the former but only one in the latter (Fig. 1, A and B, Targets on; Fig. 1C, Target on). Given the results described above, we realized that the differences in transient visual activity across tasks could also vary between FEF and OcTh, and indeed, that was the case.
In FEF, the visually evoked activity was significantly stronger for a single stimulus in the RF (delayed saccade task) than for a stimulus in the RF accompanied by a second stimulus outside the RF (CS task) This was true for all FEF neurons with visual responses (Fig. 11, B-D, columns 1 and 2; Fig. 9A; P < 0.00001; n = 58) and for the F neurons as well (Fig. 11A, columns 1 and 2; Fig. 9A; P = 0.002; n = 14). In contrast, the short-latency, sensory-related response in OcTh was no different when the stimulus in the RF was alone or accompanied by one outside the RF. This was the case both for the visually responsive neurons (Fig. 11, B–D, columns 3 and 4; Fig. 9C; P = 0.71; n = 28) and for the F neurons (Fig. 11A, columns 3 and 4; Fig. 9C; P = 0.55; n = 51). The thalamic neurons also demonstrated much less spatial selectivity during the visual transient in the delayed saccade task (Fig. 11, columns 3 and 4; red vs. green traces).
The comparison of visual responses in the CS and easy choice tasks reflected the fact that the two tasks proceed in exactly the same way up to the presentation of the choice targets (Fig. 1, A and B). Indeed, the visual responses for these tasks were statistically indistinguishable for all neuron types in both FEF and OcTh (Fig. 9, A and B, blue bars), as expected. In summary, the short-latency responses evoked by the appearance of a stimulus in the RF were, in certain respects, quite different in OcTh relative to those observed in FEF: they were generally smaller in magnitude (Fig. 9, compare blue bars in A and B), less selective, and less sensitive to the presence of surrounding stimuli (Fig. 11).
Postsaccadic activity.
Given the task dependence observed in the presaccadic responses of OcTh, it occurred to us that the activity evoked after saccade onset (Fig. 12) might vary according to the behavioral task too. In particular, we asked whether the postsaccadic responses in OcTh would show the same task preferences as the presaccadic.
To isolate motor-related postsaccadic responses as definitively and consistently as possible, a neuron was considered to be postsaccadic if it satisfied three conditions: 1) it fired at a significantly higher rate after movements into the RF vs. movements away from the RF, i.e., it differentiated postsaccadically; 2) it did not differentiate significantly before the saccade; and 3) it was not a V neuron. In both FEF and OcTh, the resulting postsaccadic populations were thus composed of mixtures of F, VMN, and MN neurons (in FEF: n = 11, 6, and 3; in OcTh: n = 19, 4, and 8, respectively) that displayed spatial selectivity, but only after the onset of the eye movement, and not just because a stimulus may have traversed the RF during the movement.
During the CS task, the resulting population activity peaked after the saccade and was qualitatively similar in OcTh and FEF, although the differentiation seemed somewhat more prolonged in the former (Fig. 12, A and C, 1st column). More importantly, however, whereas the postsaccadic responses in FEF were statistically the same across tasks (Fig. 12, A and B), the thalamic responses showed the same pattern observed earlier in presaccadic activity: the responses after movements into the RF were strongest in the CS task, less intense in the easy choice task, and even more attenuated in the delayed saccade task (Fig. 12, C and D). Similar results were obtained when the task order preference test (i.e., which task order is preferred by each neuron) was applied to the subsets of postsaccadic neurons that were recorded in all three tasks. In the OcTh population, the anticipated pattern, rCS > rEA > rDS, was observed much more often than expected by chance (10 of 21 neurons, P = 0.001, binomial test), whereas in the FEF sample, it was not (3 of 12 neurons; P = 0.32, binomial test). Therefore, the motor-related activity in OcTh was strongly task-dependent both for neurons that were predominantly activated before the saccade and for neurons that were predominantly activated after.
Spatial distribution of neuronal types.
During recording sessions, we saw no evidence of clustering of neuronal types within penetrations, but this was difficult to assess, particularly in OcTh, given the large proportion of F neurons found in that sample (87/181, or 48% without exclusions). Thus we examined how neuronal types were distributed across recording sites and searched for quantitative evidence of clustering. We were particularly concerned by the possibility that the F neurons might have been recorded from areas devoid of other types of responsive neurons and that might have been outside the thalamic nuclei that are considered part of OcTh. Based on the coordinates of each recorded neuron, two statistical tests were performed to determine quantitatively whether the neurons of any given type were homogeneously distributed (see materials and methods). The data from each monkey were analyzed separately.
First, we calculated the mean distance between pairs of F neurons and found that it was not significantly different from that expected for a pair of neurons selected randomly, i.e., regardless of their type. This was the case in two variants of the comparison, one in which all possible pairs of units were considered in the average (P = 0.78, 0.19 for monkeys G and S, respectively), and another in which only pairs of nearest neighbors were included (P = 0.074, 0.64 for monkeys G and S). Similar results were obtained when this test was applied to other neuronal types. For example, the mean distance between pairs of presaccadically activated neurons (VM and M together; see Fig. 2B) was again consistent with that expected by chance (P = 0.087, 0.49 for monkeys G and S). Thus, on average, the physical separation between pairs of neurons was statistically the same for all neuronal types.
The second test was designed to examine how the neurons of a given type were distributed across electrode entry points, or gridpoints, on the cortical surface. The underlying question was whether the neurons of a given type were significantly more likely to be found at some gridpoints than others, or alternatively, whether they were distributed homogeneously. In monkey G there were 12 unique gridpoints with an average of 3.9 cells recorded in each (range, 1–13), whereas in monkey S there were 21 unique gridpoints with an average of 6.4 cells recorded in each (range, 1–39). The F neurons showed no sign of having been collected preferentially within particular gridpoints. At each one, they were found in proportions that were entirely consistent with a homogeneous distribution (P > 0.01), even without adjusting for multiple comparisons. For example, at the most populated gridpoint in monkey S, in which 39 neurons were recorded, 16.8 of those were expected to be of type F and 19 were actually found (P = 0.29). All the other neuronal types were homogeneously distributed too, with only two exceptions, both in monkey S: at one gridpoint, 11 of 14 recorded neurons were presaccadically activated, representing an excess of 2 neurons over the significance threshold (which was P = 0.01); and at another gridpoint, 4 of 7 recorded neurons were of type V, representing an excess of 1 neuron above the threshold. Again, these numbers were not adjusted for multiple comparisons, so they represent extremely weak trends.
In summary, no convincing evidence of spatial segregation was found. The results indicate that F neurons were randomly intermingled with neurons of other types. In the absence of evidence to suggest a regional distribution of neurons based on any of our physiological classification criteria, we concluded that a detailed reconstruction of the electrode penetrations was unwarranted.
DISCUSSION
This study examined the potential contributions of OcTh to the selection of motor actions on the basis of a perceptual judgment. In addition, because OcTh neurons were recorded in the same monkeys and with identical tasks as in our prior study of the FEF, it was possible to compare the neural correlates of these functions in two structures thought to be successive nodes in a corticosubcortical loop through the basal ganglia. This study yielded five main findings: 1) whereas in FEF most neurons fired in relation to some specific aspect of the saccadic tasks used, in OcTh only a minority of the cells responded in a manner that was temporally linked to any overt task event; 2) within the sample of OcTh cells that did respond to task events, neuronal types based on visual and motor-related properties were similar to those found in FEF; 3) the influence of perceptual information on saccadic choices was somewhat weaker in OcTh but qualitatively the same as in FEF; 4) in OcTh, responses linked to movements into the RF were highly task dependent, being most vigorous in the urgent choice task, weaker in the easy choice task, and weakest in the single-target, delayed saccade task; and 5) such task dependence was consistent and evident across multiple neuronal types in OcTh, including that for which neither visual nor saccade-related responses were evoked (F). Furthermore, as an elaboration of point 2, it is worth noting that some neuronal categories may be more congruent across the two areas than others. In particular, considering their overall firing intensity, modulation by perceptual information, and task dependence, the spatially selective visuomotor neurons (VMD) responded quite similarly in FEF and OcTh, whereas the spatially selective motor neurons (MD) differed rather strikingly. Although these results do not pinpoint a specific functional difference between the two structures in terms of the way perceptual information modulates competing, choice-related motor plans, they do suggest that the contribution of OcTh to target selection and motor choice is contingent on the broader behavioral or cognitive context in which eye movements are executed.
One of the hallmarks of motor-related neurons in the FEF is that their activity rises to a threshold before saccade onset, and it is thought that reaching this threshold acts as a trigger for issuing a saccadic command that can no longer be cancelled (Hanes and Schall 1996; Lo and Wang 2006; Brown et al. 2008; Ding and Gold 2012; Heitz and Schall 2012; Costello et al. 2013). Indeed, FEF motor-related neurons project to both the SC and premotor nuclei of the brainstem (Leichnetz et al. 1984; Huerta et al. 1986; Segraves and Goldberg 1987; Leichnetz and Goldberg 1988). Our results in FEF are consistent with this interpretation, in that the levels of presaccadic activity were very similar across the three tasks despite their very different demands. In contrast, the activity of OcTh neurons demonstrated strong task dependence: overall, presaccadic as well as postsaccadic activity was more intense in the CS task than in either the easy choice or the single-target, delayed saccade task. Differences across tasks, as well as an absence of a saccadic threshold, were also observed in oculomotor activity in the caudate nucleus (Ding and Gold 2010), suggesting a common type of processing in subcortical structures. However, the functional interpretation of such task dependence is not straightforward.
Previous studies have reported large variations in the activity of neurons in OcTh across other types of saccadic task. For instance, thalamic activity is typically more intense during volitional than reactive saccades (Tanaka and Kunimatsu 2011b) and more intense during memory-guided than visually guided saccades as well (Tanaka 2007; Tanibuchi and Goldman-Rakic 2005). More generally, the evidence suggests that neurons in OcTh fire more vigorously during tasks with higher cognitive demands, such as the antisaccade task (Kunimatsu and Tanaka), or when the subject needs to keep track of time internally to generate an eye movement at the right time without an explicit external trigger (Tanaka 2006, 2007). One could reasonably argue that the CS task is more cognitively demanding than either the easy choice or single-target tasks (Fig. 4). In comparison to the easy version, the CS task is more difficult not only because of urgency (as the color discrimination needs to be made very quickly) but also because it requires the color of the target to be remembered (as the fixation spot and the cue are temporally displaced). In addition, the delayed saccade is simpler than either choice task: it is not urgent, and it involves no motor conflict, and no comparison between stimuli. It is also important to note that, unlike FEF, OcTh does not provide direct output to downstream motor structures and, as such, is likely to play a more remote role in saccade triggering, perhaps obviating any such strict firing rate requirement (i.e., threshold) as that thought to apply in FEF. Our finding that the neurons classified as purely motor (M) typically fired much more weakly than their counterparts in FEF is consistent with this idea. Thus the present results, as well as previous ones, demonstrate that activity in OcTh is weakly linked to saccade production in a strict sense, compared with FEF or SC, and is generally stronger when the ongoing behavioral demands are higher.
How can the dependence on task be evident in OcTh but not in FEF? Under the simple assumption that when cells fire more intensely they have a stronger effect on their targets, the conclusion would be that OcTh contributes more substantially to FEF activation, relative to other inputs, when cognitive demands are high, and vice versa, when the conditions are less demanding and OcTh responds weakly, other sources of input to the FEF must play a larger role. However, another, more subtle possibility, is that, in spite of their qualitative similarities, the OcTh activity might be exerting only a modulatory effect on the FEF responses, perhaps to modify the gain of other inputs that are the primary drivers of FEF or to “gate” them (for possible scenarios, see Salinas and Abbott 1996; Kepecs and Ragavachari 2007; Olsen et al. 2012). An external modulatory signal could also alter the dynamics of the local FEF circuitry for other specific purposes, say, to make it capable of generating self-sustained activity (Salinas 2003).
Examination of the role of the thalamus in nonoculomotor behaviors is largely consistent with such a modulatory function. For instance, in a task in which a simple manual response must be made after a variable waiting period, performance correlates strongly with the activity of central thalamus: monkeys are much more likely to end a trial prematurely when the neuronal responses are relatively weak (Schiff et al. 2013). Those findings are in line with human studies suggesting that central thalamic nuclei play a causal role in sustaining vigilance (Mair et al. 2011), as is required for detecting an infrequent auditory event (Paus et al. 1997). Converging studies in rodents have implicated the rostral intralaminar nuclei (Mair and Hembrook 2008) and the MD nucleus (Parnaudeau et al. 2013) in working memory performance, as well as in the ability to learn certain associative tasks (Parnaudeau et al. 2015). Thus it is clear that central thalamus contributes to a wide range of cognitive behaviors. The high prevalence of F neurons in our OcTh sample is interesting in this respect. Perhaps those cells are related to vigilance, arousal, or some other nonselective form of attention that varies with task difficulty. It is known that MD projections to the prefrontal cortex are key for attentional orienting and for enhancing the impact of cholinergic inputs on prefrontal cells (Hasselmo and Sarter 2011). It is possible that, in what constitutes OcTh, neurons with primarily modulatory roles are intermingled with other cells that have more specific oculomotor functions. In general, OcTh may serve to coordinate heterogeneous signals originating from multiple regions of the cortex and basal ganglia (Mitchell et al. 2014).
In the oculomotor realm, in addition to playing a role in perceptual discrimination and target/response selection, as suggested by the present data, potential roles of central thalamus include the following: 1) carrying corollary discharge signals for updating the visual representations when the eyes move, a function thought to be accomplished via the SC-MD-FEF pathway (Sommer and Wurtz 2004a,b); 2) carrying corollary discharge to effect predictive remapping of visual RFs before saccades (Sommer and Wurtz 2002, 2006, 2008); 3) actively participating in the generation of saccadic eye movements (Schlag-Rey and Schlag 1984; Wyder et al. 2003, 2004; Tanaka 2005, 2007; Tanaka and Kunimatsu 2011); and 4) regulating the timing of internally triggered saccades (Wyder et al. 2003; Tanaka 2006, 2007). In terms of physiological properties and response types, in the present study nothing stood out that was incongruent or inconsistent with previous reports, particularly those from our laboratory (Wyder et al. 2003, 2004). Such apparent agreement, however, should be taken with caution, because results may vary in subtle ways depending on the specific recording sites sampled and on the behavioral tasks used. For instance, we did not test our cells in the memory guided saccade task, which has been widely used to characterize OcTh activity. Our most notable result was the widespread task dependence of the OcTh sample, and its weaker relationship to the motor output (saccade onset), compared with an otherwise similar mix of neuronal classes in FEF. This finding is generally consistent with those of prior studies in OcTh (Tanaka and Kunimatsu 2011a), suggesting a multitude of functional roles for this highly diverse structure.
GRANTS
This research was supported by the National Eye Institute Grants R01-EY-12389, R01-EY-12389-S1, F31-EY-020107, and R01-EY-021228; National Institute of Drug Abuse Grant R01-DA-030750 as part of the National Science Foundation/National Institutes of Health Collaborative Research in Computational Neuroscience Program; and National Institute of Neurological Disorders and Stroke Training Grant T32-NS-073553.
DISCLOSURES
No conflicts of interest, financial or otherwise, are declared by the author(s).
AUTHOR CONTRIBUTIONS
Author contributions: M.G.C. and D.Z. performed experiments; M.G.C., P.J.M., and E.S. analyzed data; M.G.C., E.S., and T.R.S. interpreted results of experiments; M.G.C., P.J.M., and E.S. prepared figures; M.G.C., E.S., and T.R.S. drafted manuscript; M.G.C., D.Z., E.S., and T.R.S. approved final version of manuscript; P.J.M., E.S., and T.R.S. edited and revised manuscript; T.R.S. conception and design of research.
ACKNOWLEDGMENTS
We thank John McHaffie for assistance with histological procedures.
Present address of M. G. Costello: Department of Physical Medicine and Rehabilitation, Johns Hopkins University School of Medicine, Kennedy Krieger Institute, 707 N. Broadway, Baltimore, MD 21205.
REFERENCES
- Alexander GE, DeLong MR, Strick PL. Parallel organization of functionally segregated circuits linking basal ganglia and cortex. Annu Rev Neurosci 9: 357–381, 1986. [DOI] [PubMed] [Google Scholar]
- Awh E, Armstrong KM, Moore T. Visual and oculomotor selection: links, causes and implications for spatial attention. Trends Cogn Sci 10: 124–130, 2006. [DOI] [PubMed] [Google Scholar]
- Brown JW, Hanes DP, Schall JD, Stuphorn V. Relation of frontal eye field activity to saccade initiation during a countermanding task. Exp Brain Res 190: 135–151, 2008. [DOI] [PMC free article] [PubMed] [Google Scholar]
- Bruce CJ, Goldberg ME. Primate frontal eye fields. I. Single neurons discharging before saccades. J Neurophysiol 53: 603–635, 1985. [DOI] [PubMed] [Google Scholar]
- Bruce CJ, Goldberg ME, Bushnell MC, Stanton GB. Primate frontal eye fields. II. Physiological and anatomical correlates of electrically evoked eye movements. J Neurophysiol 54: 714–734, 1985. [DOI] [PubMed] [Google Scholar]
- Carello CD, Krauzlis RJ. Manipulating intent: evidence for a causal role of the superior colliculus in target selection. Neuron 43: 575–583, 2004. [DOI] [PubMed] [Google Scholar]
- Cisek P, Kalaska JF. Neural mechanisms for interacting with a world full of action choices. Annu Rev Neurosci 33: 269–298, 2010. [DOI] [PubMed] [Google Scholar]
- Costello MG, Zhu D, Salinas E, Stanford TR. Perceptual modulation of motor–but not visual–responses in the frontal eye field during an urgent-decision task. J Neurosci 33: 16394–16408, 2013. [DOI] [PMC free article] [PubMed] [Google Scholar]
- Ding L, Gold JI. Caudate encodes multiple computations for perceptual decisions. J Neurosci 30: 15747–15759, 2010. [DOI] [PMC free article] [PubMed] [Google Scholar]
- Ding L, Gold JI. Neural correlates of perceptual decision making before, during, and after decision commitment in monkey frontal eye field. Cereb Cortex 22: 1052–1067, 2012. [DOI] [PMC free article] [PubMed] [Google Scholar]
- Gold JI, Shadlen MN. Representation of a perceptual decision in developing oculomotor commands. Nature 404: 390–394, 2000. [DOI] [PubMed] [Google Scholar]
- Hanes DP, Schall JD. Neural control of voluntary movement inititation. Science 274: 427–430, 1996. [DOI] [PubMed] [Google Scholar]
- Hanes DP, Wurtz RH. Interaction of the frontal eye field and superior colliculus for saccade generation. J Neurophysiol 85: 804–815, 2001. [DOI] [PubMed] [Google Scholar]
- Hasselmo ME, Sarter M. Modes and models of forebrain cholinergic neuromodulation of cognition. Neuropsychopharmacology 36: 52–73, 2011. [DOI] [PMC free article] [PubMed] [Google Scholar]
- Heitz RP, Schall JD. Neural mechanisms of speed-accuracy tradeoff. Neuron 76: 616–628, 2012. [DOI] [PMC free article] [PubMed] [Google Scholar]
- Horwitz GD, Batista AP, Newsome WT. Representation of an abstract perceptual decision in macaque superior colliculus. J Neurophysiol 91: 2281–2296, 2004. [DOI] [PubMed] [Google Scholar]
- Horwitz GD, Newsome WT. Separate signals for target selection and movement specification in the superior colliculus. Science 284: 1158–1161, 1999. [DOI] [PubMed] [Google Scholar]
- Huerta MF, Krubitzer LA, Kaas JH. Frontal eye field as defined by intracortical microstimulation in squirrel monkeys, owl monkeys, and macaque monkeys: I. Subcortical connections. J Comp Neurol 253: 415–439, 1996. [DOI] [PubMed] [Google Scholar]
- Kepecs A, Raghavachari S. Gating information by two-state membrane potential fluctuations. J Neurophysiol 97: 3015–3023, 2007. [DOI] [PubMed] [Google Scholar]
- Klaes C, Westendorff S, Chakrabarti S, Gail A. Choosing goals, not rules: deciding among rule based action plans. Neuron 70: 536–548, 2011. [DOI] [PubMed] [Google Scholar]
- Komatsu H, Suzuki H. Projections from the functional subdivisions of the frontal eye field to the superior colliculus in the monkey. Brain Res 327: 324–327, 1985. [DOI] [PubMed] [Google Scholar]
- Krauzlis RJ, Lovejoy LP, Zénon A. Superior colliculus and visual spatial attention. Annu Rev Neurosci 36: 165–182, 2013. [DOI] [PMC free article] [PubMed] [Google Scholar]
- Kunimatsu J, Tanaka M. Roles of the primate motor thalamus in the generation of antisaccades. J Neurosci 30: 5108–5117, 2010. [DOI] [PMC free article] [PubMed] [Google Scholar]
- Leichnetz GR, Goldberg ME. Higher centers concerned with eye movement and visual attention: cerebral cortex and thalamus. Rev Oculomot Res 2: 365–429, 1998. [PubMed] [Google Scholar]
- Leichnetz GR, Spencer RF, Smith DJ. Cortical projections to nuclei adjacent to the oculomotor complex in the medial dien-mesencephalic tegmentum in the monkey. J Comp Neurol 228: 359–387, 1984. [DOI] [PubMed] [Google Scholar]
- Lo CC, Wang XJ. Cortico-basal ganglia circuit mechanism for a decision threshold in reaction time tasks. Nat Neurosci 9: 956–963, 2006. [DOI] [PubMed] [Google Scholar]
- Lynch JC, Hoover JE, Strick PL. Input to the primate frontal eye field from the substantia nigra, superior colliculus, and dentate nucleus demonstrated by transneuronal transport. Exp Brain Res 100: 181–186, 1994. [DOI] [PubMed] [Google Scholar]
- Lynch JC, Tian JR. Cortico-cortical networks and cortico-subcortical loops for the higher control of eye movements. Prog Brain Res 151: 461–501, 2006. [DOI] [PubMed] [Google Scholar]
- Mair RG, Hembrook JR. Memory enhancement with event-related stimulation of the rostral intralaminar thalamic nuclei. J Neurosci 28: 14293–14300, 2008. [DOI] [PMC free article] [PubMed] [Google Scholar]
- Mair RG, Onos KD, Hembrook JR. Cognitive activation by central thalamic stimulation: the Yerkes-Dodson law revisited. Dose Response 9: 313–331, 2011. [DOI] [PMC free article] [PubMed] [Google Scholar]
- McFarland NR, Haber SN. Thalamic relay nuclei of the basal ganglia form both reciprocal and nonreciprocal cortical connections, linking multiple frontal cortical areas. J Neurosci 22: 8117–8132, 2002. [DOI] [PMC free article] [PubMed] [Google Scholar]
- McPeek RM, Keller EL. Saccade target selection in the superior colliculus during a visual search task. J Neurophysiol 88: 2019–2034, 2002. [DOI] [PubMed] [Google Scholar]
- McPeek RM, Keller EL. Deficits in saccade target selection after inactivation of superior colliculus. Nat Neurosci 7: 757–763, 2004. [DOI] [PubMed] [Google Scholar]
- Middleton FA, Strick PL. Basal ganglia and cerebellar loops: motor and cognitive circuits. Brain Res Brain Res Rev 31: 236–250, 2000. [DOI] [PubMed] [Google Scholar]
- Mitchell AS, Sherman SM, Sommer MA, Mair RG, Vertes RP, Chudasama Y. Advances in understanding mechanisms of thalamic relays in cognition and behavior. J Neurosci 34: 15340–15346, 2014. [DOI] [PMC free article] [PubMed] [Google Scholar]
- Olsen SR, Bortone DS, Adesnik H, Scanziani M. Gain control by layer six in cortical circuits of vision. Nature 483: 47–52, 2012. [DOI] [PMC free article] [PubMed] [Google Scholar]
- Parnaudeau S, O'Neill PK, Bolkan SS, Ward RD, Abbas AI, Roth BL, Balsam PD, Gordon JA, Kellendonk C. Inhibition of mediodorsal thalamus disrupts thalamofrontal connectivity and cognition. Neuron 77: 1151–1162, 2013. [DOI] [PMC free article] [PubMed] [Google Scholar]
- Parnaudeau S, Taylor K, Bolkan SS, Ward RD, Balsam PD, Kellendonk C. Mediodorsal thalamus hypofunction impairs flexible goal-directed behavior. Biol Psychiatry 77: 445–453, 2015. [DOI] [PMC free article] [PubMed] [Google Scholar]
- Paus T, Zatorre RJ, Hofle N, Caramanos Z, Gotman J, Petrides M, Evans AC. Time-related changes in neural systems underlying attention and arousal during the performance of an auditory vigilance task. J Cogn Neurosci 9: 392–408, 1997. [DOI] [PubMed] [Google Scholar]
- Salinas E. Background synaptic activity as a switch between dynamical states in a network. Neural Comput 15: 1439–1475, 2003. [DOI] [PubMed] [Google Scholar]
- Salinas E, Abbott LF. A model of multiplicative neural responses in parietal cortex. Proc Natl Acad Sci USA 93: 11956–11961, 1996. [DOI] [PMC free article] [PubMed] [Google Scholar]
- Salinas E, Scerra VE, Hauser CK, Costello MG, Stanford TR. Decoupling speed and accuracy in an urgent decision-making task reveals multiple contributions to their trade-off. Front Neurosci 8: 85, 2014. [DOI] [PMC free article] [PubMed] [Google Scholar]
- Salinas E, Shankar S, Costello MG, Zhu D, Stanford TR. Waiting is the hardest part: comparison of two computational strategies for performing a compelled-response task. Front Comput Neurosci 4: 153, 1–17, 2010. [DOI] [PMC free article] [PubMed] [Google Scholar]
- Sato T, Murthy A, Thompson KG, Schall JD. Search efficiency but not response interference affects visual selection in frontal eye field. Neuron 30: 583–591, 2001. [DOI] [PubMed] [Google Scholar]
- Sato TR, Schall JD. Effects of stimulus-response compatibility on neural selection in frontal eye field. Neuron 38: 637–648, 2003. [DOI] [PubMed] [Google Scholar]
- Schall JD. The neural selection and control of saccades by the frontal eye field. Philos Trans R Soc Lond B Biol Sci 357: 1073–1082, 2002. [DOI] [PMC free article] [PubMed] [Google Scholar]
- Schall JD, Thompson KG. Neural selection and control of visually guided eye movements. Annu Rev Neurosci 22: 241–259, 1999. [DOI] [PubMed] [Google Scholar]
- Schiff ND, Shah SA, Hudson AE, Nauvel T, Kalik SF, Purpura KP. Gating of attentional effort through the central thalamus. J Neurophysiol 109: 1152–1163, 2013. [DOI] [PMC free article] [PubMed] [Google Scholar]
- Schlag J, Schlag-Rey M. Visuomotor functions of central thalamus in monkey. II. Unit activity related to visual events, targeting, and fixation. J Neurophysiol 51: 1175–1195, 1984. [DOI] [PubMed] [Google Scholar]
- Schlag-Rey M, Schlag J. Visuomotor functions of central thalamus in monkey. I. Unit activity related to spontaneous eye movements. J Neurophysiol 51: 1149–1174, 1984. [DOI] [PubMed] [Google Scholar]
- Schlag-Rey M, Schlag J, Dassonville P. How the frontal eye field can impose a saccade goal on superior colliculus neurons. J Neurophysiol 67: 1003–1005, 1992. [DOI] [PubMed] [Google Scholar]
- Segraves MA, Goldberg ME. Functional properties of corticotectal neurons in the monkey's frontal eye field. J Neurophysiol 58: 1387–1419, 1997. [DOI] [PubMed] [Google Scholar]
- Shadlen MN, Newsome WT. Motion perception: seeing and deciding. Proc Natl Acad Sci USA 93: 628–633, 1996. [DOI] [PMC free article] [PubMed] [Google Scholar]
- Shadlen MN, Newsome WT. Neural basis of a perceptual decision in the parietal cortex (area LIP) of the rhesus monkey. J Neurophysiol 86: 1916–1936, 2001. [DOI] [PubMed] [Google Scholar]
- Shankar S, Massoglia DP, Zhu D, Costello MG, Stanford TR, Salinas E. Tracking the temporal evolution of a perceptual judgment using a compelled-response task. J Neurosci 31: 8406–8421, 2011. [DOI] [PMC free article] [PubMed] [Google Scholar]
- Siegel S, Castellan NJ. Nonparametric Statistics for the Behavioral Sciences. Boston, MA: McGraw-Hill, 1988. [Google Scholar]
- Sommer MA. The role of the thalamus in motor control. Curr Opin Neurobiol 13: 663–670, 2003. [DOI] [PubMed] [Google Scholar]
- Sommer MA, Wurtz RH. A pathway in primate brain for internal monitoring of movements. Science 296: 1480–1482, 2002. [DOI] [PubMed] [Google Scholar]
- Sommer MA, Wurtz RH. What the brain stem tells the frontal cortex. II. Role of the SC-MD-FEF pathway in corollary discharge. J Neurophysiol 91: 1403–1423, 2004a. [DOI] [PubMed] [Google Scholar]
- Sommer MA, Wurtz RH. What the brain stem tells the frontal cortex. I. Oculomotor signals sent from superior colliculus to frontal eye field via mediodorsal thalamus. J Neurophysiol 91: 1381–1402, 2004b. [DOI] [PubMed] [Google Scholar]
- Sommer MA, Wurtz RH. Influence of the thalamus on spatial visual processing in frontal cortex. Nature 444: 374–377, 2006. [DOI] [PubMed] [Google Scholar]
- Sommer MA, Wurtz RH. Brain circuits for the internal monitoring of movements. Annu Rev Neurosci 31: 317–338, 2008. [DOI] [PMC free article] [PubMed] [Google Scholar]
- Squire RF, Steinmetz NA, Moore T. Frontal eye field. Scholarpedia 7: 5341, 2012. [Google Scholar]
- Stanford TR. Perspectives on subcortical contributions to higher-order aspects of visuo-oculomotor control. In: Recent Breakthroughs in Basal Ganglia Research, edited by Bezard EE. New York: Nova Science, 2006, p. 201–211. [Google Scholar]
- Stanford TR, Shankar S, Massoglia DP, Costello MG, Salinas E. Perceptual decision making in less than 30 milliseconds. Nat Neurosci 13: 379–385, 2010. [DOI] [PMC free article] [PubMed] [Google Scholar]
- Stanton GB, Goldberg ME, Bruce CJ. Frontal eye field efferents in the macaque monkey: II. Topography of terminal fields in midbrain and pons. J Comp Neurol 271: 493–506, 1988. [DOI] [PubMed] [Google Scholar]
- Steinmetz NA, Moore T. Lumping and splitting the neural circuitry of visual attention. Neuron 73: 410–412, 2012. [DOI] [PubMed] [Google Scholar]
- Tanaka M. Involvement of the central thalamus in the control of smooth pursuit eye movements. J Neurosci 25: 5866–5876, 2005. [DOI] [PMC free article] [PubMed] [Google Scholar]
- Tanaka M. Inactivation of the central thalamus delays self-timed saccades. Nat Neurosci 9: 20–22, 2006. [DOI] [PubMed] [Google Scholar]
- Tanaka M. Cognitive signals in the primate motor thalamus predict saccade timing. J Neurosci 27: 12109–12118, 2007. [DOI] [PMC free article] [PubMed] [Google Scholar]
- Tanaka M, Kunimatsu J. Thalamic roles in eye movements. In: The Oxford Handbook of Eye Movements, edited by Liversedge SP, Gilchrist ID, Everling S. Oxford, UK: Oxford Univ. Press, 2011a. [Google Scholar]
- Tanaka M, Kunimatsu J. Contribution of the central thalamus to the generation of volitional saccades. Eur J Neurosci 33: 2046–2057, 2011b. [DOI] [PubMed] [Google Scholar]
- Tanibuchi I, Goldman-Rakic PS. Dissociation of spatial-, object-, and sound-coding neurons in the mediodorsal nucleus of the primate thalamus. J Neurophysiol 89: 1067–1077, 2003. [DOI] [PubMed] [Google Scholar]
- Tanibuchi I, Goldman-Rakic PS. Comparison of oculomotor neuronal activity in paralaminar and mediodorsal thalamus in the rhesus monkey. J Neurophysiol 93: 614–619, 2005. [DOI] [PubMed] [Google Scholar]
- Thompson KG, Bichot NP, Schall JD. Dissociation of visual discrimination from saccade programming in macaque frontal eye field. J Neurophysiol 77: 1046–1050, 1997. [DOI] [PubMed] [Google Scholar]
- Thompson KG, Biscoe KL, Sato TR. Neuronal basis of covert spatial attention in the frontal eye field. J Neurosci 25: 9479–9487, 2005. [DOI] [PMC free article] [PubMed] [Google Scholar]
- Thompson KG, Hanes DP, Bichot NP, Schall JD. Perceptual and motor processing stages identified in the activity of macaque frontal eye field neurons during visual search. J Neurophysiol 76: 4040–4055, 1996. [DOI] [PubMed] [Google Scholar]
- Tian JR, Lynch JC. Subcortical input to the smooth and saccadic eye movement subregions of the frontal eye field in Cebus monkey. J Neurosci 17: 9233–9247, 1997. [DOI] [PMC free article] [PubMed] [Google Scholar]
- Watanabe Y, Funahashi S. Neuronal activity throughout the primate mediodorsal nucleus of the thalamus during oculomotor delayed-responses. I. Cue-, delay-, and response-period activity. J Neurophysiol 92: 1738–1755, 2004a. [DOI] [PubMed] [Google Scholar]
- Watanabe Y, Funahashi S. Neuronal activity throughout the primate mediodorsal nucleus of the thalamus during oculomotor delayed-responses. II. Activity encoding visual vs. motor signal. J Neurophysiol 92: 1756–1769, 2004b. [DOI] [PubMed] [Google Scholar]
- Wong-Riley M. Changes in the visual system of monocularly sutured or enucleated cats demonstrable with cytochrome oxidase histochemistry. Brain Res 171: 11–28, 1979. [DOI] [PubMed] [Google Scholar]
- Wyder MT, Massoglia DP, Stanford TR. Quantitative assessment of the timing and tuning of visual-related, saccade-related, and delay period activity in primate central thalamus. J Neurophysiol 90: 2029–2052, 2003. [DOI] [PubMed] [Google Scholar]
- Wyder MT, Massoglia DP, Stanford TR. Contextual modulation of central thalamic delay-period activity: representation of visual and saccadic goals. J Neurophysiol 91: 2628–2648, 2004. [DOI] [PubMed] [Google Scholar]