Abstract
Purpose:
Biplane angiography systems provide time resolved 2D fluoroscopic images from two different angles, which can be used for the positioning of interventional devices such as guidewires and catheters. The purpose of this work is to provide a novel algorithm framework, which allows the 3D reconstruction of these curvilinear devices from the 2D projection images for each time frame. This would allow creating virtual projection images from arbitrary view angles without changing the position of the gantries, as well as virtual endoscopic 3D renderings.
Methods:
The first frame of each time sequence is registered to and subtracted from the following frame using an elastic grid registration technique. The images are then preprocessed by a noise reduction algorithm using directional adaptive filter kernels and a ridgeness filter that emphasizes curvilinear structures. A threshold based segmentation of the device is then performed, followed by a flux driven topology preserving thinning algorithm to extract the segments of the device centerline. The exact device path is determined using Dijkstra’s algorithm to minimize the curvature and distance between adjacent segments as well as the difference to the device path of the previous frame. The 3D device centerline is then reconstructed using epipolar geometry.
Results:
The accuracy of the reconstruction was measured in a vascular head phantom as well as in a cadaver head and a canine study. The device reconstructions are compared to rotational 3D acquisitions. In the phantom experiments, an average device tip accuracy of 0.35 ± 0.09 mm, a Hausdorff distance of 0.65 ± 0.32 mm, and a mean device distance of 0.54 ± 0.33 mm were achieved. In the cadaver head and canine experiments, the device tip was reconstructed with an average accuracy of 0.26 ± 0.20 mm, a Hausdorff distance of 0.62 ± 0.08 mm, and a mean device distance of 0.41 ± 0.08 mm. Additionally, retrospective reconstruction results of real patient data are presented.
Conclusions:
The presented algorithm is a novel approach for the time resolved 3D reconstruction of interventional devices from biplane fluoroscopic images, thus allowing the creation of virtual projection images from arbitrary view angles as well as virtual endoscopic 3D renderings. Availability of this technique would enhance the ability to accurately position devices in minimally invasive endovascular procedures.
Keywords: 3D reconstruction, 4D fluoroscopy, segmentation, device tracking
1. INTRODUCTION
Fluoroscopy is established as a valuable tool in today’s clinical practice for the guidance of minimally invasive procedures. Therefore, an angiography system acquires a series of x-ray images from a fixed position that shows the movement of the device over time. Biplane systems offer a second gantry, which allows acquiring two simultaneous fluoroscopic image sequences from different viewing angles. This imaging technique is used for the treatment of a wide range of vascular conditions including arteriovenous malformations, aneurysms and strokes.1 An exact location of the object of interest, however, can be difficult especially in areas with a complex vascular structure, because of vascular overlap and the lack of depth information. The range of viewing angles that can be reached with both planes is limited by the system geometry, the table, and the patient so that the ideal viewing position cannot always be found. In some cases, even if the desired position can be reached, the detector would block the access to the patient, which requires a compromise between viewing position and patient accessibility.
Recently, efforts have been made to use biplane fluoroscopy acquisitions to reconstruct the 3D shape of the device.2–7 This would allow creating virtual images from arbitrary viewing angles without moving the gantry or 3D renderings of the object within the vascular system, like virtual endoscopic views. The steps necessary to perform this reconstruction vary with the used algorithm but usually include the estimation of the projection matrices, motion compensation, segmentation of the device, search for corresponding points, and 3D reconstruction. Several algorithms have been published in order to solve parts of the described problem. The accuracy of the 3D point localization from two views with known point correspondence was investigated by Brost et al.8 They achieved localization errors of less than 1 mm for sphere-shaped objects with a diameter of 2 mm using a floor mounted C-arm CT system. Baert et al.9 proposed a method for tracking a guidewire in a 2D image sequence using third order B-spline fitting. This is done in two steps. First, a rough registration is applied to the result of the previous frame using a rigid transform and then an energy term is minimized considering the length and the curvature of the estimated spline as well as features extracted from the image using a Hessian filter and different preprocessing methods. Based on this algorithm, an extended segmentation and reconstruction method is provided in Ref. 3 where a statistical end point detection is performed additionally to the B-spline detection. The corresponding points for the 3D reconstruction are found using the epipolar constraint. If multiple potential corresponding points are found, the one closest to the previous point along the segmented device is used. A semiautomatic reconstruction method was published by Hoffmann et al.,4,5 which requires the manual selection of a seed point along the device. The image is then binarized and the object pixels are combined to a graph where edges represent point sequences and nodes are the respective start or end points. The graph is used to create a 2D spline representation of the device. The point correspondences for the epipolar reconstruction are determined by finding a monotonic function that maps the points along the spline representation in the first image to the second image.
Attempts have also been made to reconstruct the 3D device shape using monoplane angiography systems. Since no depth information is available using only a single projection image, additional information has to be included to determine the 3D shape of the device. In Refs. 10–12, a previously acquired 3D volume of the vascular structure is used to decrease the number of possible solutions. Brückner et al.10 use a probabilistic approach to find a B-spline representing the most likely device path within the vessel volume. In Ref. 11, a feature image is created from the 3D vessel volume, which is then used for a snake optimization to find the 3D path. Petković et al.12 use the skeleton of the vessel tree to determine the topology of possible segments and then use a greedy algorithm to extract feasible 3D reconstructions. The downside of most monoplane reconstruction methods is that the exact position of the device within the vessel cannot be determined and shifting or transformation of vessels during the procedure might make the reconstruction impossible. A different approach for the 3D location tracking of the tip of an ablation catheter, which does not rely on a previously acquired 3D image, is proposed in Ref. 13. It calculates the depth of the device tip using the change of its size in the 2D image due to perspective projection. Model based reconstruction of ablation catheters from 2D projections has also been investigated.14,15 The arrangement of the radio opaque electrodes in the tip of the catheter is used to create a dynamic 3D model, which can then be optimized to represent the 3D device reconstruction. For the reconstruction of more generic devices, such as guidewires, however, this method would not be suitable since it requires distinguishable parts like radio opaque electrodes, whose positions define the shape of the device. Finally, reconstruction methods based on iterative optimization of 3D B-snakes have been published.6,7 In this case, no explicit device segmentation in the 2D planes is required. Instead, an energy functional is minimized representing the curvature of the device and the conformity with detected image features.
The main contributions of the proposed work are that it provides a complete algorithmic framework for the time resolved 3D reconstruction of interventional devices from biplane fluoroscopy sequences, that it is able to extract the device path in the 2D projection images without relying on iterative optimization of 2D splines or 3D snakes3,6,7,9 and that it is performed fully automatically and does not require manual seed point selection.4,5 Instead, topology preserving thinning is used to extract the centerline of curvilinear segments, which are then connected based on spatial distance and directional difference between endpoints. This method has the advantage that arbitrary device shapes can be described as a list of connected pixels and it is not limited by the number of parameters used to describe splines or snakes. Although these methods have been used successfully for the reconstruction of curvilinear devices, the iterative optimization procedure might increase the computation time, which could make a potential real time implementation of the algorithm difficult. Furthermore, good initialization is required for the optimization in each frame, which might not be given for fast device movement between adjacent frames. Finally, certain device shapes might cause the fitting procedure to fail.3 The proposed algorithm uses the first time frame of each sequence as mask, which is registered to and subtracted from the following frames. The images are then preprocessed by a noise reduction algorithm using directional adaptive filter kernels and a ridgeness filter that emphasizes curvilinear structures. A threshold based segmentation of the device is then performed, followed by a flux driven topology preserving thinning algorithm to extract the segments of the device centerline. The exact device path is determined using Dijkstra’s algorithm16 to minimize the curvature and distance between adjacent segments as well as the difference to the device path of the previous frame. The 3D device shape is then reconstructed using epipolar geometry and a monotonic function mapping the corresponding points of each 2D device centerline.
2. RECONSTRUCTION PIPELINE
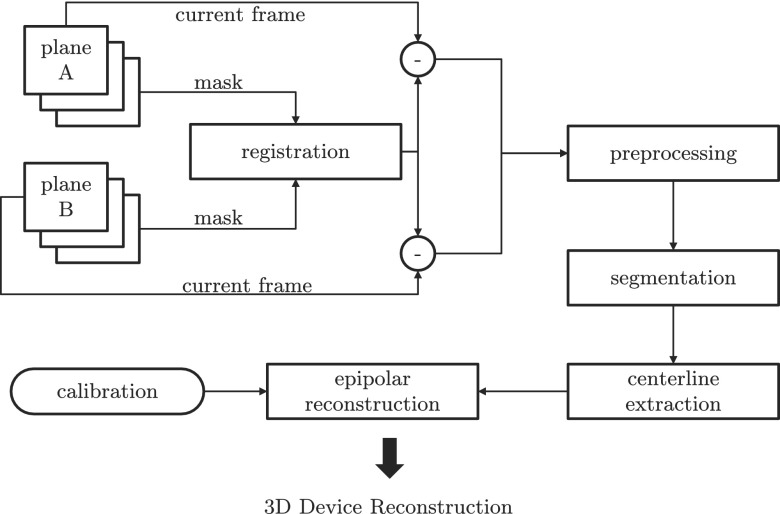
Figure 1 shows an overview of the reconstruction pipeline. First, an offline calibration step is performed to estimate the projection matrices for the desired C-arm positions. The first frame of the fluoroscopic image sequence is used as mask and is subtracted from the subsequent frames to isolate the device. In case of patient motion, the subtraction might cause artifacts. Therefore, a registration step is introduced to adjust the mask to the current frame. The subtracted frames are then preprocessed to reduce the noise and emphasize curvilinear structures in the image followed by an automatic threshold segmentation. A topology preserving thinning algorithm is then applied to extract the segments of the 2D device centerline. The exact device path connecting the segments is found using Dijkstra’s algorithm,16 minimizing the curvature and distance between adjacent segments as well as the difference to the device path of the previous frame. Finally, the best point correspondences for each line segment of the centerline are found and an epipolar reconstruction is performed. Sections 2.A–2.F give detailed descriptions of each step.
FIG. 1.
Flow diagram of the reconstruction pipeline. The first frame of both planes is used as a mask image and registered to the current frame. A noise reduction and ridgeness filter is then applied to the subtraction of current frame and mask. Subsequently, the image is binarized to separate the device from the background and the centerline is extracted using topology preserving thinning and Dijkstra’s path search algorithm. Finally, an epipolar reconstruction is performed using the projection matrices from an offline calibration step to obtain the 3D shape of the device.
2.A. Calibration
As a first step, a calibration of the desired C-arm positions of the angiography system has to be performed to estimate the projection matrices Pa|b for both image planes A and B, respectively, which describe the transformation of a 3D point into the 2D image space of each plane. The existing system calibration used to reconstruct rotational 3D acquisitions cannot be used, since it is performed for dynamic C-arm trajectories and would not be accurate enough for static C-arm positions. Furthermore, only plane A is calibrated to perform 3D acquisitions. The calibration for the biplane fluoroscopy reconstruction can be done in advance and does not have to be repeated for every case, as long as the system geometry does not change. Small variations of the C-arm positions, however, are expected depending on the system accuracy. A cylindrical calibration phantom with metal beads in two different sizes, arranged in a helical pattern, is used. A rotational 3D acquisition of the phantom is performed as well as 2D fluoroscopic acquisitions from the desired view angles (anteroposterior and lateral). The coordinates of the center of the metal beads are segmented both in the 3D and 2D images and an iterative optimization is performed that minimizes the mean squared distance between the forward projected 3D coordinates and the 2D coordinates to estimate the projection matrix. A more detailed description on camera calibration and projection matrices can be found in Refs. 8, 17, and 18.
2.B. Registration
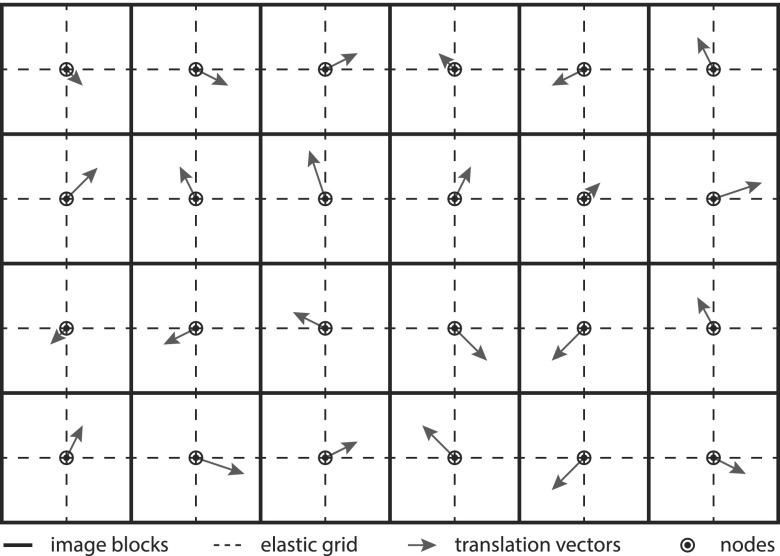
For most neuroradiological interventions in the head, little motion can be expected, which allows subtracting previously acquired mask frames to remove the background and facilitates the segmentation. However, in some cases, breathing motion near the neck or small variations of the head position can be observed, which causes curvilinear structures along the border of high contrast objects such as the skull. To avoid interference of this artifacts with the device segmentation, an elastic grid registration technique is used, based on the method presented in Ref. 19. The image is partitioned into distinct blocks, where the center of each block serves as node of the elastic grid as demonstrated in Fig. 2. The registration method estimates a translation vector for each of these nodes. The image transformation is then determined by interpolating the translation vector for each pixel using a spline interpolation. The optimization of the node translation vectors is done using a gradient descent method, where the gradient can be estimated by calculating the image metric within the surrounding block of the node only. In this case, the mean squared error (MSE) is used as image metric,
| (1) |
where is the set of all in the image and is the translation of the pixel calculated by
| (2) |
The block size in this equation is given by m0 and m1, respectively, and aij(b0, b1) represents the cubic spline coefficients for the image block (b0, b1).
FIG. 2.
Illustration of the elastic grid registration. The solid line represents the image blocks. Their centers are the node for the elastic grid, shown as dashed line. A translation vector is estimated for each node, which is used to calculate the final image transformation by spline interpolation.
2.C. Preprocessing
The subtracted image frames are preprocessed to reduce the noise and emphasize the curvilinear structures of the device. The noise reduction algorithm uses binary masks to determine a directional filter kernel for pixels close to line structures and an isotropic kernel for background pixels.20 Which type of kernel is used for each pixel is determined by a line conformity measure (LCM) calculated using the mean squared error in the local neighborhood along different directions. A detailed description of the algorithm can be found in Ref. 20. Additionally, a ridgeness filter is applied based on a method described in Ref. 21 for a fixed scale to emphasize curvilinear structures (ridges) in the image. The ridgeness values R for image I are calculated by
| (3) |
2.D. Segmentation
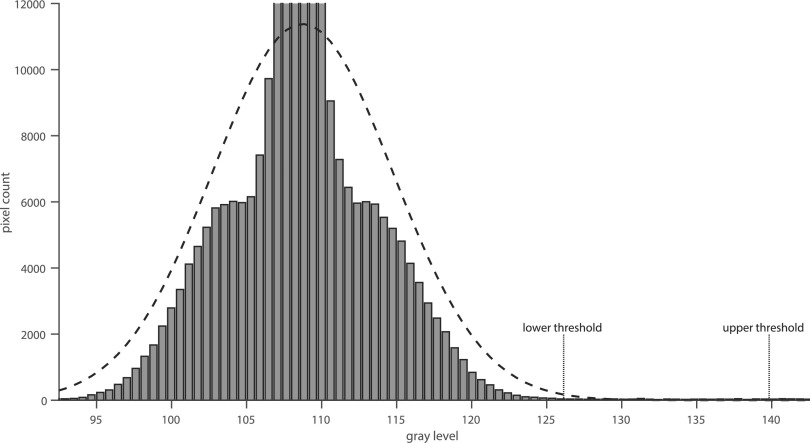
The segmentation step is based on two thresholds τh and τl with τh > τl, where each pixel with a gray value above the threshold τh is considered to be part of the object, herein, referred to as initial device pixel. Candidate pixels with a value within the interval are only considered part of the device, if they are connected to an initial device pixel. Here, the term connected refers to each candidate pixel which has at least one neighboring initial device pixel or candidate pixel within the four-connected neighborhood, which is itself connected to an initial device pixel. The threshold values are determined automatically using the image histogram as illustrated in Fig. 3. Since the device only covers a small number of pixels compared to the background area, a Gaussian function can be fitted to the histogram in order to estimate the probability distribution GB of the background pixels. A maximum likelihood estimation22 is used to determine the parameters of the Gaussian function. The upper and lower thresholds are then determined by calculating the values where the probability for the pixel to be part of the background area is lower than 0.1% and 10−5%, respectively.
FIG. 3.
Automatic threshold detection by fitting a Gaussian function to the image histogram. The lower and upper thresholds are then determined by the points where the estimated probability distribution reaches 0.1% and 10−5%, respectively.
2.E. Centerline extraction
Giving the binarized images, a topology preserving thinning algorithm is applied to extract the device centerline. The algorithm is based on the average outward flux (AOF) as proposed in Ref. 23. The distance map D is calculated which contains for each device pixel the Euclidean distance to the closest background pixel. The AOF is then calculated by
| (4) |
where Nx is the eight-connected neighborhood of . The segmented device is then converted to a one pixel thin centerline by subsequent removal of simple boundary pixels of the segmented area in descending order of the AOF value. A boundary pixel is called simple according to the definition in Ref. 24, if its removal does not change the topology of the object or the background. For 2D images, this is true if the Hilditch crossing number25 equals one. Following the leftover device pixels after applying the thinning algorithm, the centerline can be extracted, represented by one or more curvilinear segments. Each segment is described by a list of connected pixels. Multiple segments might be necessary to describe a single device in cases where the centerline is interrupted due to bad image contrast or noise or if the centerline overlaps itself. In the latter case, the path from each intersection point or end point to the next is described by a separate line segment.
The device segments S1–Sn are connected to a single centerline using Dijkstra’s algorithm16 to find a path that minimizes the distance and direction change between adjacent ridges as well as the difference to the device path of the previous time frame. The costs ccon for the connection of two segments is calculated by
| (5) |
with
| (6) |
where each segment Si is a list of connected points to and the direction vector at each point is given by . The parameters η > 1 and ϕ > 0 determine the weighting of the direction change between segments. For the purpose of this work, η = 1.5 and ϕ = 0.5 were chosen empirically in previous 2D tracking experiments. The difference between the extracted device path and the device path of the previous time frame is calculated using
| (7) |
The overall cost function for a series of segments is defined by
| (8) |
where is the monotonic function, which maps to its corresponding point in the sequence S and the parameter ϵ determines the cost of unused line segments. For the purpose of this work, ϵ = 0.5 was used.
2.F. Reconstruction
Given a pair of corresponding points from both image planes that represent the same point in 3D, its coordinates can be easily calculated by finding the intersection between the two projection rays of the 2D points, which connect and with the respective view points of the image planes. The viewpoints and the direction vectors of the projection rays can be calculated using the respective projection matrices. The direction vectors are calculated by taking the inverse of the upper left 3 × 3 matrix of the projection matrix,
| (9) |
The viewpoints can be calculated using
| (10) |
Due to aliasing, segmentation inaccuracies, or imperfect calibration, the two lines might not intersect; therefore, the closest point to both lines is calculated instead by solving the linear equation,
| (11) |
where and are normal vectors perpendicular to and , respectively, with and
| (12) |
This can be solved using the Moore–Penrose inverse,
| (13) |
The corresponding point qb in plane B for a point qa in plane A can be found by calculating the epipolar line Eqa of qa in plane B.17 Every intersection of Eqa with the device centerline in plane B is a candidate for the corresponding point. However, only for very simple device shapes, this would result in a unique solution. In general, more than one candidate might exist for every point qa. In this case, additional information is required to find the correct corresponding point. As suggested in Ref. 5, a monotonic constraint can be used for the function that maps points on the centerline of the device in plane A to their respective corresponding points. This means that the points in plane A have to appear in the same order on the centerline of the device then their counterparts in plane B. To determine the point correspondences, Dijkstra’s algorithm16 is used to find the monotonic function that minimizes the distance between the projection rays of each pair of corresponding points.
3. IMAGE DATA
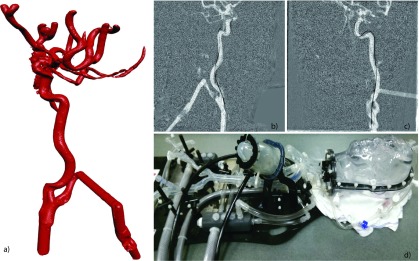
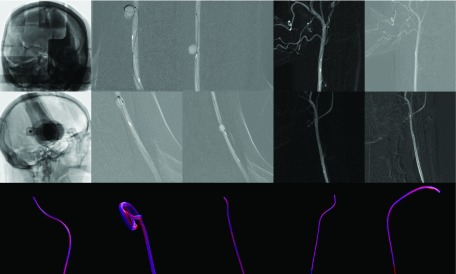
All images are acquired using a biplane angiography system (Artis Zee, Siemens Healthcare AG, Forchheim, Germany). As a first step, a 3D image of the vasculature is acquired using 3D digital subtraction angiography. Therefore, two rotational acquisitions are performed with and without contrast agent injection, respectively. The subtraction of both images shows only the contrast medium within the vascular system. The C-arms are then moved to one of the precalibrated positions, where 2D fluoroscopic projection images of the moving device are acquired from two different angles, with a constant frame rate of 15 fps. For the quantitative evaluation of the 3D reconstruction accuracy, a guidewire was imaged within a vascular head phantom (Replicator, Vascular Simulations, Stony Brook, NY, USA). Additionally, a cadaver head study and canine study were performed to verify the results. The vascular head phantom is shown in Fig. 4; the cadaver head and canine images are shown in Fig. 6. The guidewire was moved under fluoroscopic guidance to five different positions in the head phantom, one position in the cadaver heads and four positions in the canine. For each position, a rotational 3D acquisition of static device was performed as a reference of the actual device shape. Reconstruction results of real patients will also be presented but are not included in the quantitative evaluation since no reference positions for the device are available.
FIG. 4.
Vascular head phantom: (a) surface rendering of the vascular structure within the head phantom, created by 3D digital subtraction angiography; (b) fluoroscopic image of the catheter acquired with plane A; (c) fluoroscopic image of the catheter acquired with plane B; and (d) photo of the vascular head phantom with pump to simulate blood flow.
FIG. 6.
Original fluoroscopic images and reconstruction results of the cadaver head and animal study. Rows 1 and 2 show the A and B planes of the original fluoroscopic images, respectively. Row 3 shows a semitransparent overlay of the 3D reference device (blue) with the reconstructed device (red). The cadaver head study is displayed in column 1. Columns 2–5 are the results of the animal study (see color online version).
An anterior–posterior (AP) position for plane A and a lateral projection angle for plane B are used for all acquisitions. Since in practice other gantry positions might also be of interest, an additional repeatability study is performed to investigate the influence of other projection angles on the reconstruction accuracy. Therefore, a series of ten fluoroscopy sequences of a calibration phantom was acquired for five different positions of each gantry. Between two adjacent acquisitions, each gantry was moved to arbitrary locations and then moved back to one of the five positions. The accuracy, each position could be reached with, was measured in terms of the standard deviation of the calibration phantom beads positions. Table I lists the investigated gantry positions for both planes.
TABLE I.
Gantry positions for plane A and plane B (primary and secondary angles) for each of the five positions evaluated in the repeatability study. The primary angle is rotated around the longitudinal axis of the patient and the secondary angle around the normal vector of the plane described by the C-arm.
| Position No. | 1 | 2 | 3 | 4 | 5 |
|---|---|---|---|---|---|
| Primary A (deg) | 0 | 30 | 45 | 0 | 10 |
| Secondary A (deg) | 0 | 0 | 0 | −20 | −10 |
| Primary B (deg) | −90 | −60 | −45 | −90 | −80 |
| Secondary B (deg) | 0 | 0 | 0 | 20 | 10 |
4. STATISTICS FOR EVALUATION
The quantitative evaluation of the 3D reconstruction accuracy is performed in terms of three different measures. First, the tip accuracy et measured in terms of the Euclidean distance between the reconstructed device tip and the reference position gathered from the rotational 3D acquisition of the device,
| (14) |
The worst conformity between the reconstructed and the reference device shape can be measured in terms of the Hausdorff distance eh,26 which can be defined as the maximum of the longest Euclidean distance from any point on the reconstructed device centerline to the closest point on the reference centerline and the longest distance from any point on the reference centerline to the closest point on the reconstructed device centerline,
| (15) |
Finally, the overall reconstruction accuracy of the reconstructed device is measured in terms of the mean distance em, where each point on the reconstructed centerline is compared to the point on the reference centerline with the same distance to the device tip,
| (16) |
with
| (17) |
5. RESULTS
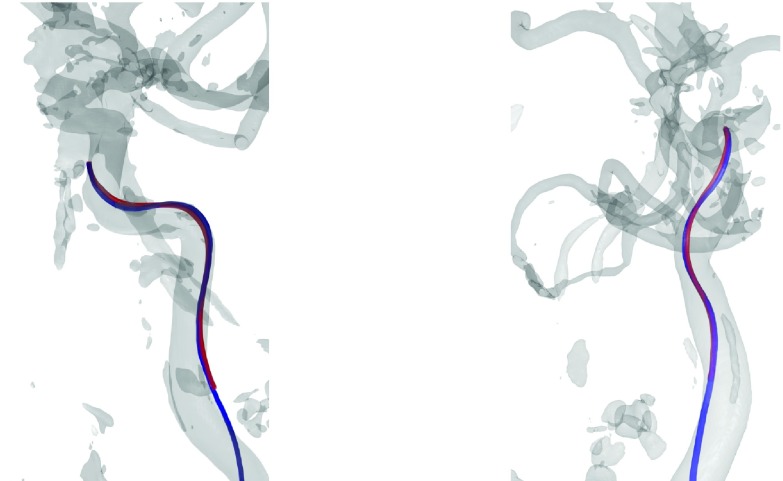
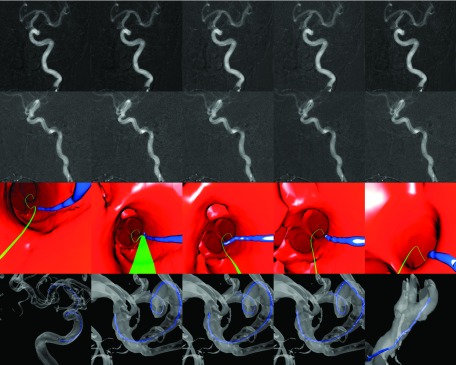
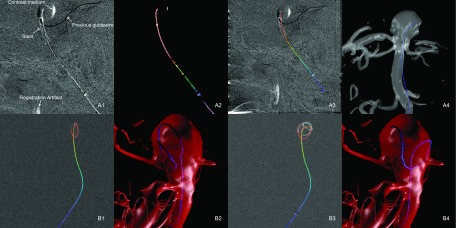
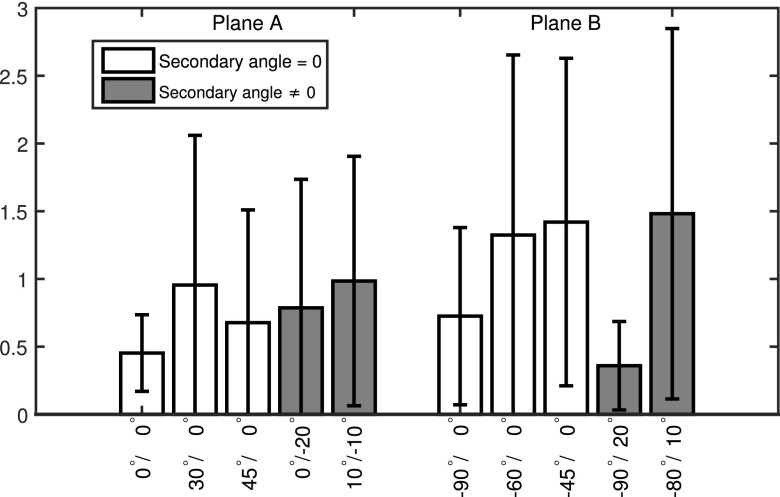
Table II lists the accuracy results of the device reconstruction from the vascular phantom experiments, measured in terms of the tip accuracy as well as the Hausdorff distance of the device centerlines and the mean distance. For the tip of the device, an average reconstruction accuracy of 0.35 ± 0.09 mm could be achieved, while the overall Hausdorff distance, and therefore, the largest distance between the reconstructed device centerline and the reference centerline was 0.65 ± 0.32 mm on average. The mean point by point device distance of the centerlines averaged to 0.54 ± 0.33 mm. Figure 5 shows a comparison of the reconstructed device and the reference device within the vascular system of the head phantom. A similar evaluation has been performed for the cadaver head study. The quantitative results for the cadaver head and canine study are listed in Table III. The device tip was reconstructed with an average accuracy of 0.36 ± 0.20 mm, whereas the largest distance between the reconstructed device centerline and the reference centerline was 0.62 ± 0.08 mm on average. The mean device distance averaged to 0.41 ± 0.08 mm. A visual comparison between the reconstructed and the reference devices is shown in Fig. 6. A clinical data set of a pipeline embolization procedure in a patient suffering a cerebral aneurysm was processed retrospectively. Figure 7 shows selected time frames of the 3D reconstruction, rendered as virtual endoscopic, and glass pipe views showing the guidewire near the middle cerebral artery (MCA) trifurcation. Additional clinical examples are shown in Fig. 10. The first example is a reconstruction of a guidewire, where additional to the reconstructed device other objects like a stent, leftover contrast medium, and a previous guidewire are visible in the subtracted fluoroscopy frames. The intermediate reconstruction steps are shown in Fig. 10 (A1–A4) including the subtracted fluoroscopic frame, the binarized image overlaid with the extracted curvilinear segments, the final 2D path, and finally the 3D reconstruction. The second example shows the coiling of an aneurysm, where the first 1.5 loops of the coil inside of the aneurysm can be successfully reconstructed; however, after multiple loops, the extraction of the correct 2D path is not possible anymore. The results of the repeatability study are shown in Fig. 8. For plane A, the highest accuracy was achieved for the 0°/0° position with an average accuracy of 0.45 ± 0.28 pixel (0.14 ± 0.09 mm) and the worst repeatability for position 10°/ − 10° with an accuracy of 0.98 ± 0.92 pixels (0.30 ± 0.28 mm). For plane B, the best results were achieved for position −90°/20° with an accuracy of 0.36 ± 0.33 pixels (0.11 ± 0.10 mm) and the worst for position −80°/10° with 1.48 ± 1.37 pixels (0.46 ± 0.42 mm). To give an impression on the influence of the registration part, Fig. 9 shows a comparison of the subtracted fluoroscopy frames before and after applying the registration algorithm for two clinical acquisitions, where the head moved between the mask frame and the current frame.
TABLE II.
Reconstruction accuracy results for the phantom experiments listing tip accuracy et, Hausdorff distance eh, and mean distance em for each case. The last row shows the average results for all cases. All measurements are given in millimeters.
| Case No. | et | eh | em |
|---|---|---|---|
| Case 1 | 0.30 | 0.33 | 0.31 ± 0.14 |
| Case 2 | 0.31 | 0.49 | 0.32 ± 0.13 |
| Case 3 | 0.43 | 0.80 | 0.70 ± 0.21 |
| Case 4 | 0.47 | 0.47 | 0.31 ± 0.09 |
| Case 5 | 0.26 | 1.13 | 0.91 ± 0.32 |
| Average | 0.35 ± 0.09 | 0.65 ± 0.32 | 0.54 ± 0.33 |
FIG. 5.
3D rendering of the reference device (blue) compared to the reconstructed device (red) within the vascular system of the head phantom shown from two different viewing angles (see color online version).
TABLE III.
Reconstruction accuracy results for the cadaver head and canine experiments listing tip accuracy et, Hausdorff distance eh, and mean distance em for each case. All measurements are given in millimeters.
| Case No. | et | eh | em |
|---|---|---|---|
| Cadaver 1 | 0.21 | 0.59 | 0.23 ± 0.11 |
| Canine 1 | 0.33 | 0.57 | 0.39 ± 0.12 |
| Canine 2 | 0.58 | 0.58 | 0.34 ± 0.03 |
| Canine 3 | 0.53 | 0.77 | 0.68 ± 0.08 |
| Canine 4 | 0.14 | 0.59 | 0.39 ± 0.08 |
| Average | 0.36 ± 0.20 | 0.62 ± 0.08 | 0.41 ± 0.08 |
FIG. 7.
Clinical data set of a patient suffering a cerebral aneurysm. First two rows show the original fluoroscopic images of planes A and B, respectively. The third row shows the virtual endoscopic renderings of a guidewire near the MCA trifurcation. The green line represents the path to the predetermined target location, calculated from the vessel centerlines. The last row displays an overview of the guidewire position in a 3D rendering with a semitransparent vessel surface (see color online version).
FIG. 10.
Example of clinical cases. (A) Guidewire in aneurysm with additional objects in the image (stent, previous guidewire, leftover contrast medium, and registration artifacts). (1) Original fluoroscopy frame. (2) Binarized image overlaid with extracted line segments. (3) Extracted 2D path overlaid with original fluoroscopy image. (4) 3D reconstruction of the guidewire within the aneurysm. (B) Coiling of aneurysm. (1) Extracted 2D path after 1.5 loops. (2) 3D reconstruction after 1.5 loops. (3) After multiple loops, 2D path cannot be extracted correctly. (4) Failed 3D reconstruction after multiple loops.
FIG. 8.
Results of the repeatability study measured in terms of the mean error in pixels at five different positions for both planes. First five bars show the accuracy of plane A; the remaining bars give the accuracy of plane B. Oblique angles, where the secondary angle is not zero are shaded gray; other positions are shaded white.
FIG. 9.
Comparison of subtracted fluoroscopy frames for two clinical acquisitions (A) and (B) before and after application of the registration algorithm. Motion artifacts can be seen near the orbital and nasal cavities and along the contour of the skull in the unregistered subtractions of (A) and (B).
6. DISCUSSION
The presented algorithm offers a novel perspective for intervascular procedures allowing to render virtual endoscopic views of the device within the vascular system as well as the option to generate virtual projection images from arbitrary views without moving the gantry. In order for this technique to provide useful information to physicians, an accurate reconstruction of the 3D device shape is crucial. In particular, the position of the device tip is important for many procedures, for example, if the device tip is placed within an aneurysm or stenosis in order to deploy coils or stents. The accuracy of the reconstruction depends on various factors, including the segmentation of the device centerline, finding the correct point correspondences as well as the calibration of the C-arm positions and the angle between the two views. Most manufactures provide calibration phantoms for their angiography systems to allow an accurate estimation of the projection matrices. However, current angiography systems can reach the calibrated C-arm positions only up to a certain accuracy depending on the viewing angle, which might decrease the alignment between the estimated projection matrices and the actual C-arm positions. The presented results have demonstrated that a reconstruction with high accuracy is possible using anterior–posterior and lateral C-arm projection angles. In some cases, however, different C-arm positions might be required to allow better access to the patient. The C-arm positions primarily affect the reconstruction accuracy in two ways. First, the angle between the two projections of plane A and plane B determines how well conditioned the reconstruction of a 3D point from its 2D projections is. The best result is achieved for orthogonal projection angles. A thorough investigation on this topic was performed in Ref. 8. Since the calibration of the system is performed ahead of the procedure, the accuracy of the reconstruction also depends on the accuracy with which the system can go back to a previously calibrated position. The results of the repeatability study (Fig. 8) show a considerable decrease in the repeatability for angles other than AP and lateral for planes A and B. Oblique angles, where the primary as well as the secondary angle is modified, show the lowest accuracy. In general, less accurate results can be expected for other gantry positions than AP and lateral. However, depending on the system, other positions with similar repeatability might be possible as can be seen for plane B and the −90°/20° position. Another limitation regarding the accuracy of the projection matrices is that the patient table position may not be altered between the acquisition of the 3D vasculature and the fluoroscopic images, e.g., to adjust the field of view, since the measurement accuracy of the table position may not be accurate enough to adjust the projection matrices. To solve this issue, a 2D/3D registration step could be included whenever the table position or the position of the C-arms is changed. This would also allow the use of uncalibrated C-arm positions and might resolve variations in the C-arm positions due to system inaccuracies for calibrated positions. It should also be mentioned that all accuracy measurements are calculated compared to a reference device centerline calculated from a voxelized 3D volume. Therefore, the accuracy of the reference is limited by the voxel size of 0.47 mm. The imaging system allows reconstructions with smaller voxel sizes only for reduced volume sizes. This, however, would truncate the device in the reconstructions. The calculated accuracy measures are close to the voxel size limit, which shows that a device reconstruction with high accuracy is possible. The reconstructions of the clinical data set shown in Fig. 7 provide an impression of the possibilities and advantages of using this technology compared to conventional fluoroscopic imaging. The virtual endoscopic view allows an easier localization of the guidewire near the trifurcation, where the complex vessel structure makes it hard to identify the current device position in the original fluoroscopy images. The additional clinical examples presented in Fig. 10 also show the abilities as well as the limits of the presented algorithm. In general, additional objects like stents present in the mask as well as the reconstructed frames do not affect the reconstruction, since they are subtracted out during the segmentation. However, if the position of these objects changes during the procedure, they could be visible even in the subtracted frames as shown in Fig. 10 (A1). But, due to the lower radio opacity of the stent compared to the guidewire, the correct path can still be identified. Previously inserted objects that are present in the mask frame, but have been removed afterward, show up as dark structures in the subtracted frame, which makes it easy to distinguish them from the current device. However, if a previous device overlays with the curvilinear structure of the reconstructed device, it might cancel out parts of it in the subtracted image frame. However, in the presented cases, the algorithm is still able to connect the extracted line segments correctly. The aneurysm coiling case in Fig. 10 (B1–B4) demonstrates that the algorithm is able to identify the device path of a coil despite overlaps after about 1.5 loops. However, when the device shape gets more complex, no feasible solution can be found. Although a real time implementation of the proposed algorithm is not available to this time, it is planned for future work. In order to further reduce the computational effort, the number of iterations for the registration step could be limited, since only little motion is expected for most neuroradiological applications in the head. Furthermore, the presence of patient motion could be detected based on simple image metrics, and the registration algorithm could be applied only to frames, where motion was detected. Further work is also necessary to investigate other applications of the reconstruction algorithm besides neuroradiological interventions in the head region. These include thoracic procedures in the lung or liver as well as cardiac applications. In contrast to the cases presented here, these applications usually exhibit increased motion artifacts caused by breathing and cardiac motion, which might not be compensated by a 2D registration as it is proposed here. This might affect the segmentation of the device based on subtracted image frames. Additionally, in order to create a meaningful overlay of the reconstructed device with a previously acquired 3D vascular volume, the latter has to be adapted to reflect the patient motion.
7. CONCLUSION
The proposed algorithm provides a novel framework to reconstruct the 3D shape of an interventional device from two fluoroscopic images recorded from different angles, thus allowing the rendering of virtual fluoroscopic images from arbitrary angles or virtual endoscopic views. This algorithm consists of 2D/2D image registration, device segmentation, and epipolar reconstruction. Future work has to be done to implement the algorithm into a real time reconstruction system, which allows viewing of virtual endoscopic views and virtual fluoroscopic images online, while manipulating the interventional device. Furthermore, the implementation of a 2D/3D registration could help to further increase the reconstruction accuracy and could provide a more flexible use of the C-arm CT system. The presented results show that an accurate reconstruction of the device is possible. This technique could considerably improve the workflow of endovascular minimally invasive procedures.
ACKNOWLEDGMENTS
Research reported in this publication was supported by the National Heart, Lung, And Blood Institute of the National Institutes of Health under Award No. R01HL116567. The content is solely the responsibility of the authors and does not necessarily represent the official views of the National Institutes of Health.
REFERENCES
- 1.Peters T. M., “Image-guidance for surgical procedures,” Phys. Med. Biol. 51, R505–R540 (2006). 10.1088/0031-9155/51/14/R01 [DOI] [PubMed] [Google Scholar]
- 2.Mistretta C. A., “Sub-Nyquist acquisition and constrained reconstruction in time resolved angiography,” Med. Phys. 38(6), 2975–2985 (2011). 10.1118/1.3589132 [DOI] [PMC free article] [PubMed] [Google Scholar]
- 3.Baert S., van de Kraats E., van Walsum T., Viergever M., and Niessen W., “Three-dimensional guide-wire reconstruction from biplane image sequences for integrated display in 3-D vasculature,” IEEE Trans. Med. Imaging 22, 1252–1258 (2003). 10.1109/TMI.2003.817791 [DOI] [PubMed] [Google Scholar]
- 4.Hoffmann M., Brost A., Jakob C., Bourier F., Koch M., Kurzidim K., Hornegger J., and Strobel N., “Semi-automatic catheter reconstruction from two views,” in Medical Image Computing and Computer-Assisted Intervention–MICCAI (Springer, Berlin, Germany, 2012), pp. 584–591. [DOI] [PubMed] [Google Scholar]
- 5.Hoffmann M., Brost A., Jakob C., Koch M., Bourier F., Kurzidim K., Hornegger J., and Strobel N., “Reconstruction method for curvilinear structures from two views,” Proc. SPIE 8671, 86712F-1–86712F-8 (2013). 10.1117/12.2006346 [DOI] [Google Scholar]
- 6.Schenderlein M., Stierlin S., Manzke R., Rasche V., and Dietmayer K., “Catheter tracking in asynchronous biplane fluoroscopy images by 3D B-snakes,” Proc. SPIE 7625, 76251U-1–76251U-9 (2010). 10.1117/12.844158 [DOI] [Google Scholar]
- 7.Cañero Morales C., Radeva P., Toledo R., Villanueva J. J., and Mauri J., “3D curve reconstruction by biplane snakes,” in Proceedings of the 15th International Conference on Pattern Recognition (IEEE, Washington, DC, 2000), pp. 4563–4566. [Google Scholar]
- 8.Brost A., Strobel N., Yatziv L., Gilson W., Meyer B., Hornegger J., Lewin J., and Wacker F., “Accuracy of x-ray image-based 3D localization from two C-arm views: A comparison between an ideal system and a real device,” Proc. SPIE 7261, 72611Z-1–72611Z-10 (2009). 10.1117/12.811147 [DOI] [Google Scholar]
- 9.Baert S., Viergever M., and Niessen W., “Guide-wire tracking during endovascular interventions,” IEEE Trans. Med. Imaging 22, 965–972 (2003). 10.1109/TMI.2003.815904 [DOI] [PubMed] [Google Scholar]
- 10.Brückner M., Deinzer F., and Denzler J., “Temporal estimation of the 3D guide-wire position using 2D x-ray images,” in Medical Image Computing and Computer-Assisted Intervention–MICCAI (Springer, Berlin, Germany, 2009), pp. 386–393. [PubMed] [Google Scholar]
- 11.van Walsum T., Baert S., and Niessen W., “Guide wire reconstruction and visualization in 3DRA using monoplane fluoroscopic imaging,” IEEE Trans. Med. Imaging 24, 612–623 (2005). 10.1109/TMI.2005.844073 [DOI] [PubMed] [Google Scholar]
- 12.Petković T., Homan R., and Lončarić S., “Real-time 3D position reconstruction of guidewire for monoplane x-ray,” Comput. Med. Imaging Graphics 38, 211–223 (2014). 10.1016/j.compmedimag.2013.12.006 [DOI] [PubMed] [Google Scholar]
- 13.Fallavollita P., “Is single-view fluoroscopy sufficient in guiding cardiac ablation procedures?,” Int. J. Biomed. Imaging 2010, 1–13. 10.1155/2010/631264 [DOI] [PMC free article] [PubMed] [Google Scholar]
- 14.Haase C., Schr D., Dl O., and Grass M., “Model based 3D CS-catheter tracking from 2D x-ray projections: Binary versus attenuation models,” Comput. Med. Imaging Graphics 38, 224–231 (2014). 10.1016/j.compmedimag.2013.12.004 [DOI] [PubMed] [Google Scholar]
- 15.Haase C., Schr D., Dl O., and Grass M., “3D ablation catheter localisation using individual C-arm x-ray projections,” Phys. Med. Biol. 59, 6959–6977 (2014). 10.1088/0031-9155/59/22/6959 [DOI] [PubMed] [Google Scholar]
- 16.Dijkstra E. W., “A note on two problems in connexion with graphs,” Numer. Math. 1, 269–271 (1959). 10.1007/BF01386390 [DOI] [Google Scholar]
- 17.Hartley R. and Zisserman A., Multiple View Geometry in Computer Vision, 2nd ed. (Cambridge University Press, Cambridge, UK, 2004). [Google Scholar]
- 18.Galigekere R., Wiesent K., and Holdsworth D., “Cone-beam reprojection using projection-matrices,” IEEE Trans. Med. Imaging 22, 1202–1214 (2003). 10.1109/TMI.2003.817787 [DOI] [PubMed] [Google Scholar]
- 19.Deuerling-Zheng Y., Lell M., Galant A., and Hornegger J., “Motion compensation in digital subtraction angiography using graphics hardware,” Comput. Med. Imaging Graphics 30, 279–289 (2006). 10.1016/j.compmedimag.2006.05.008 [DOI] [PubMed] [Google Scholar]
- 20.Wagner M., Yang P., Schafer S., Strother C., and Mistretta C., “Noise reduction for curve-linear structures in real time fluoroscopy applications using directional binary masks,” Med. Phys. 42, 4645–4653 (2015). 10.1118/1.4924266 [DOI] [PMC free article] [PubMed] [Google Scholar]
- 21.Lindeberg T., “Edge detection and ridge detection with automatic scale selection,” Int. J. Comput. Vision 30, 117–154 (1998). 10.1023/A:1008097225773 [DOI] [Google Scholar]
- 22.Aldrich J., “R. A. Fisher and the making of maximum likelihood 1912-1922,” Stat. Sci. 12, 162–176 (1997). 10.1214/ss/1030037906 [DOI] [Google Scholar]
- 23.Bouix S., Siddiqi K., and Tannenbaum A., “Flux driven automatic centerline extraction,” Med. Image Anal. 9, 209–221 (2005). 10.1016/j.media.2004.06.026 [DOI] [PubMed] [Google Scholar]
- 24.Kong T. Y. and Rosenfeld A., “Digital topology: Introduction and survey,” Comput. Vision Graphics Image Process. 48, 357–393 (1989). 10.1016/0734-189X(89)90147-3 [DOI] [Google Scholar]
- 25.Hilditch C. J., “Linear skeletons from square cupboards,” in Machine Intelligence, edited byMeltzer B. and Michie D. (Edinburgh University Press, Edinburgh, 1969), Vol. 4, pp. 403–420. [Google Scholar]
- 26.Hausdorff F., Grundzüge der Mengenlehre (von Veit & Company, Leipzig, 1914). [Google Scholar]


