

Abstract
To examine the association between urinary excretion of isoflavonoids and risk of type 2 diabetes (T2D), we conducted a nested case-control study among 1,111 T2D pairs identified during 1995 – 2008 in the Nurses’ Health Study (NHS) and NHSII who were free of diabetes, cardiovascular disease, and cancer at urine sample collection. Urinary excretion of daidzein and genistein, as well as their metabolites O-desmethylangolensin (O-DMA), dihydrogenistein (DHGE), dihydrodaidzein (DHDE) was assayed by liquid chromatography mass spectrometry. Incident self-reported T2D cases were confirmed using a validated questionnaire. Higher urinary excretion of daidzein and genistein was associated with a lower risk of T2D in the combined cohorts. Comparing extreme tertiles of the urinary markers, the odds ratios (ORs) of T2D were 0.71 (95% CI: 0.55, 0.93) for daidzein and 0.74 (95% CI: 0.56, 0.97) for genistein, although the test for linear trend was not significant for genistein (P for trend = 0.03 and 0.15, respectively). DMA, DHDE, and DHGE were non-significantly associated with a lower T2D risk. The inverse association of daidzein with T2D risk was stronger among postmenopausal women who did not use hormone replacement therapy (P for interaction = 0.001): the OR (95% CI) was 0.58 (0.34, 0.97) comparing extreme tertiles among these women. In conclusion, urinary excretion of isoflavones was associated with a lower T2D risk in U.S. women, especially among postmenopausal women who did not use hormone. Further research is warranted to replicate these observations among western populations with similarly low overall isoflavone intake.
Keywords: isoflavones, diabetes, menopausal, nested case control
INTRODUCTION
Type 2 diabetes (T2D) is a chronic disease with increasing prevalence worldwide. The total number of diabetes patients is estimated to reach 592 million globally by the year 2035(1). Excessive body weight, unhealthy diet, lack of exercise, and smoking are major risk factors of type 2 diabetes (2). Seeking effective dietary and lifestyle measures for T2D prevention has been a priority to counteract the increasing diabetes prevalence and incidence (3–5). Women may be at a particularly high risk at middle-life when menopause and aging jointly increase the risk of T2D (6–8). Large clinical trials and prospective cohort studies have consistently shown that hormone replacement therapy may reduce risk of T2D in postmenopausal women (9,10,11,12). However, it is unclear whether natural phytoestrogens, such as isoflavones, may be associated with T2D risk.
Clinical trials showed that isoflavone supplements did not improve glucose control (13,14), although these clinical trials were limited by small sample size and short duration of follow-up. Several cohort studies have evaluated the associations of isoflavone intakes assessed using food frequency questionnaire (FFQ) with risk of T2D, and mixed results were observed (15–17). One potential reason for the inconsistent findings in the observational studies may lie in the difficulties of using FFQs to assess isoflavone intakes. Soy foods are the main source of isoflavone intakes while other foods contain various amount of isoflavones as well (18). Isoflavone intake estimated from FFQs is thus subject to measurement errors (19), especially in Western populations who infrequently consume soy foods. In addition, isoflavone intake estimated from FFQs does not take into account inter-individual variations in bioavailability (20). In addition, FFQs cannot be used to estimate the gut microbiota metabolites of isoflavones, including O-desmethylangolensin (O-DMA) (21), dihydrogenistein (DHGE), and dihydrodaidzein (DHDE), and equol (22), which may exert biological effects in additional to their parent compounds (i.e., daidzein and genistein) (23). In this regard, use of isoflavone metabolites in blood or urine as objective markers of isoflavone intake is an appealing approach (24,25).
In the current investigation we utilized data from a combined cohort based on two well-characterized cohorts of U.S. women, the Nurses’ Health Study (NHS) and NHSII, to prospectively evaluate the association of urinary excretion of isoflavone metabolites with risk of T2D. We also examined the hypothesis that isoflavone excretion may especially be associated with lower T2D risk among postmenopausal women who do not receive replacement therapy and thus have a low exposure to exogenous estrogens.
METHODS
Study population
The NHS began in 1976, when 121,700 female registered nurses aged 30–55 y residing in 11 states were enrolled and completed a baseline questionnaire about their lifestyle and medical history. The NHSII was established in 1989 and consisted of 116,430 younger female registered nurses aged 25–42 y at baseline. These nurses also responded to a baseline questionnaire similar to the NHS. In both cohorts, questionnaires were collected at baseline and biennially thereafter, to update information on age, weight, smoking status, physical activity, medication use, menopausal status, postmenopausal hormone use, and disease status, including hypertension, hypercholesterolemia, cardiovascular disease (CVD), and cancer.
Urine sample collection
A total of 18,743 NHS participants aged 53 to 80 years provided morning spot urine samples from 2000 to 2002, and 29,611 NHSII participants aged 32 to 52 years provided morning spot urine samples from 1996 to 1999. For both cohorts the samples were returned to a central biorepository via overnight courier and were immediately processed upon arrival and aliquoted into cryotubes, which were stored in the vapor phase of liquid nitrogen freezers at ≤ −130 °C. Loss to follow-up was < 10% among participants who provided blood and urine samples.
Prospective case-control study design
We conducted a prospective, nested case-control study among participants who provided urine samples and were free of self-reported diabetes, CVD, and cancer at urine collection in NHS and NHSII. T2D cases diagnosed within the first year since urine sample collection were excluded from selection in order to reduce the potential for reverse causation bias. During follow-up from urine collection through 2008 (NHS)/2007 (NHSII), we prospectively identified and confirmed 1,111 T2D cases (NHS: 456; NHSII: 655) and randomly selected one control from diabetes-free participants using risk set sampling.26 The cases and controls were matched for age at sample collection, month of sample collection, fasting status (≥ 8 h or not), first morning urine (yes or no), and race (white or other races) in both cohorts. In NHSII, we additionally matched for menopausal status (yes, no), luteal day of the menstrual cycle (date of next period minus date of sample collection) for premenopausal women, and hormone replacement therapy (yes or no) for postmenopausal women. The study protocol was approved by the institutional review board of the Brigham and Women’s Hospital and the Human Subjects Committee Review Board of Harvard School of Public Health.
Ascertainment of T2D
We sent a validated supplemental questionnaire to those who reported a physician diagnosis of T2D to confirm the incidence (27). We used at least one of the following American Diabetes Association 1998 criteria to confirm self-reported T2D diagnosis: (1) an elevated glucose concentration (fasting plasma glucose ≥7.0mmol/l, random plasma glucose ≥11.1mmol/l, or plasma glucose ≥11.1mmol/l after an oral glucose load), and at least one symptom related to diabetes; no symptoms, but elevated glucose concentrations on two separate occasions; or treatment with insulin or oral hypoglycemic medication. Only confirmed T2D cases were included in the current study.
Assessment of diet
Validated FFQs have been administered since 1984 in NHS or 1991 in NHSII 28. Similar FFQs were subsequently sent to participants every two to four years to update diet. In these FFQs, we inquired about the consumption frequency of 118–166 food items in the past year and how often (from “never or less than once per month” to “6 or more times per day”) on average they consumed each food item of a standard portion size. Major soy foods, i.e., tofu and soy milk, have been simultaneously included on the FFQs since 1998 in the NHS and 1999 in the NHSII. An overall measure of diet quality was calculated by using the Alternate Healthy Eating Index (AHEI) score excluding the soy food items, i.e., tofu and soy milk (29). AHEI is based on foods and nutrients predictive of the risk of developing major chronic diseases. To calculate AHEI score, we assigned individual score to each of the food group, and summed up the scores, with a higher score indicative of better diet quality (30).
Laboratory measurements
In the current study, we used electrospray ionization liquid chromatography mass spectrometry to measure isoflavonoids in urine samples, which has been validated except for the use of an orbitrap mass spectrometer (21,31). Urinary creatinine levels were measured using a Roche-Cobas MiraPlus clinical chemistry autoanalyzer (Roche Diagnostics). The average intra-assay coefficient of variation was 4.1% for daidzein, 7.6% for genistein, 8.2% for DHDE, 10.1% for DHGE, 8.1% for O-DMA, and 5.6% for creatinine. We calculated creatinine-adjusted concentrations (nmol/g creatinine) of isoflavonoids by dividing the isoflavonoid levels (nmol/L) by creatinine levels (g/L). In a pilot study that evaluated within-person stability of the isoflavonoids, intra-class correlation coefficients (ICCs), of two urine samples from 58 NHSII participants collected 1–2 years apart were 0.05 for daidzein, 0.14 for genistein, 0.16 for DHDE, 0.14 for DHGE, and 0.20 for O-DMA.
Statistical methods
We calculated Spearman correlation coefficients between urine excretion of isoflavone metabolites with soy foods, i.e., tofu and soy milk, estimated from FFQ. We adjusted for total energy intake (kcal/day), BMI (kg/m2), physical activity (MET-hr/week), age (years), smoking (never, past, current), and first morning urine (yes or no). This analysis was conducted among controls to facilitate comparison between cohorts.
We categorized the isoflavone biomarkers into tertiles. We used conditional logistic regression stratified by matching factors to model the association between isoflavone metabolites and risk of T2D in the main analysis (26). We additionally adjusted for hypertension at baseline (yes or no), hypercholesterolemia at baseline (yes or no), body mass index (kg/m2), smoking (nonsmoker, past smoker, current smoker), AHEI score, physical activity (METs-hr/week), total energy intake (kcal/day), menopausal status (premenopausal or postmenopausal) (NHS only), and hormone replacement therapy (yes or no) (NHS only). P values for linear trend were calculated by examining an ordinal score based on the median value in each tertile of isoflavones biomarker levels in the multivariate models.
Given that menopausal status and postmenopausal hormone therapy were not matching factors in NHS, we conducted stratified analyses by menopausal status and postmenopausal hormone therapy (yes vs. no) using unconditional logistic regression to maximize statistical power. P values for interactions were evaluated using likelihood ratio test, comparing the multivariate model with and without interaction terms of dichotomized isoflavones and potential effect modifiers in conditional logistic regression. Joint associations of the urinary biomarkers and potential effect modifiers were estimated using conditional logistic regression. All P values were two-sided. Data were analyzed with the Statistical Analysis Systems software package, version 9.3 (SAS Institute, Inc., Cary, North Carolina).
RESULTS
Baseline characteristics of study participants are shown in Table 1. Compared with controls, T2D cases consumed a less healthful diet, engaged in less physical activity, had a higher BMI, and were more likely to have a history of hypertension and hypercholesterolemia. The mean value of the urine isoflavones was 3863 nmol/g creatinine among cases and 5435 nmol/g creatinine among controls. The baseline characteristics according to urine isoflavone excretion are shown in Supplemental Table 1. Higher urinary isoflavone excretion was correlated with a healthier dietary pattern, and higher levels of physical activity. We further compared the baseline characteristics of controls to the population, and the controls were comparable to the total participants in NHS and NHSII (Supplemental Table 2).
Table 1.
The age-adjusted baseline characteristics according to diabetes cases and controls in the combined cohort.
| Characteristics* | Case | Control |
|---|---|---|
|
| ||
| (N=1111) | (N=1111) | |
| Age at urine collection (year) | 53.4 | 53.4 |
| Body mass index (kg/m2) | 32.0 | 25.9 |
| Physical Activity (MET-hr/week) | 16.4 | 19.5 |
| Current smoker (%) | 11 | 7 |
| Hypertension (%) | 38 | 19 |
| Hypercholesterolemia (%) | 55 | 35 |
| Family history of diabetes (%) | 37 | 21 |
| First morning urine (%)‡ | 88 | 88 |
| Postmenopausal (%)‡ | 83 | 83 |
| Postmenopausal hormone use (% of postmenopausal women)‡ | 43 | 43 |
| White (%)‡ | 96 | 97 |
| Urinary metabolites (quartile range) (nmol/g creatinine)# | ||
| Daidzein | 311 (112, 956) | 343 (123, 1013) |
| Genistein | 122 (48, 424) | 128 (48, 419) |
| Desmethylangolensin | 29 (9, 116) | 36 (12, 135) |
| Dihydrodaidzein | 34 (6, 217) | 42 (9, 288) |
| Dihydrogenistein | 25 (10, 72) | 27 (12, 78) |
| Diet | ||
| Total energy (kcal/day) | 1865 | 1775 |
| Alcohol (g/d) | 0.3 | 0.4 |
| Coffee (cup/day) | 1.0 | 1.2 |
| Soft drinks (serving/day) | 1.2 | 0.9 |
| Tofu consumers (%) | 10 | 12 |
| Soy milk consumers (%) | 4 | 7 |
| Fruits (serving/day) | 2.0 | 2.0 |
| Vegetables (serving/day) | 3.5 | 3.3 |
| Red meat (serving/day) | 1.5 | 1.3 |
| Fish (serving/day) | 0.2 | 0.2 |
| Hot dog (serving/day) | 0.1 | 0.1 |
| Alternate Healthy Eating Index score | 49 | 52 |
All of the variables were age-adjusted, except the urinary metabolites of isoflavones. Values of continuous variables were median. Percentages were based on non-missing data.
Matching factors; menopausal status and hormone replacement therapy were matching factors for NHSII only.
Values were median (interquartile range).
Moderate to strong correlations among urinary isoflavone metabolites were observed (correlation coefficient: 0.26 – 0.79), with the strongest correlation observed between daidzein and genistein (Supplemental table 3). Weak yet significant correlations were found between soy foods estimated from FFQ and urinary isoflavone excretion among controls.
Urinary excretion of total isoflavones was not associated with risk of T2D (P for trend = 0.20). Higher levels of daidzein and genistein, which are the dominant metabolites of isoflavones, were associated with a lower risk of T2D (Table 2). For daidzein, compared with the lowest group, the odds ratios (ORs) of T2D were 0.78 (0.60, 1.02) in the second tertile and 0.71 (0.55, 0.93) in the highest tertile (P for trend = 0.03); for genistein, compared with the lowest group, the ORs of T2D were 0.70 (0.53, 0.93) in the second tertile and 0.74 (0.56, 0.97) in the highest tertile (P for trend = 0.15). O-DMA, DHDE, and DHGE, which are the metabolites of daidzein and genistein, were non-significantly associated with lower risk of T2D. Comparing the extreme tertiles, the odds ratios of T2D was 0.92 (95% CI: 0.70, 1.21) for O-DMA, 0.80 (95% CI: 0.60, 1.06) for DHDE, and 0.82 (95%: 0.62, 1.08) for DHGE, respectively. Further adjustment of individual dietary components, such as red meats, fruits and vegetables, and coffee, in replacement of AHEI did not change the results materially. In a sensitivity analysis, we further excluded 945 participants whose hemoglobin A1c levels ≥ 5.7% and repeated the analysis. The inverse association between daidzein and risk of T2D persisted: compared with the lowest tertile, the ORs (95% CIs) of T2D were 0.91 (0.47, 1.77) in the second tertile and 0.49 (0.26, 0.94) in the highest tertile (P for trend = 0.01).
Table 2.
Odds ratio (95% CI) of type 2 diabetes by tertiles of urinary isoflavones (nmol/g creatinine) in the combined cohort
| Tertiles of urinary markers | P for trend | |||
|---|---|---|---|---|
| 1 (lowest) | 2 | 3 (highest) | ||
| Daidzein | ||||
| Median (Range) | 77 (0, 171) | 326 (171, 665) | 1,529 (665, 196,860) | |
| Case/control | 386/354 | 369/372 | 356/385 | |
| Model 1 | 1.00 | 0.88 (0.72, 1.07) | 0.85 (0.70, 1.04) | 0.18 |
| Model 2 | 1.00 | 0.78 (0.60, 1.02) | 0.71 (0.55, 0.93) | 0.03 |
| Genistein | ||||
| Median (Range) | 33 (0, 65) | 125 (65, 269) | 729 (270, 375,579) | |
| Case/control | 376/364 | 370/371 | 365/376 | |
| Model 1 | 1.00 | 0.94 (0.76, 1.15) | 0.92 (0.74, 1.13) | 0.50 |
| Model 2 | 1.00 | 0.70 (0.53, 0.93) | 0.74 (0.56, 0.97) | 0.15 |
| Desmethylangolensin (DMA) | ||||
| Median (Range) | 6 (0, 16) | 33 (16, 78) | 225 (78, 160,620) | |
| Case/control | 393/347 | 365/376 | 353/388 | |
| Model 1 | 1.00 | 0.82 (0.68, 1.01) | 0.77 (0.63, 0.94) | 0.039 |
| Model 2 | 1.00 | 1.00 (0.77, 1.31) | 0.92 (0.70, 1.21) | 0.74 |
| Dihydrodaidzein (DHDE) | ||||
| Median (Range) | 2 (0, 14) | 38 (14, 126) | 568 (126, 61,237) | |
| Case/control | 392/348 | 366/375 | 353/388 | |
| Model 1 | 1.00 | 0.90 (0.73, 1.10) | 0.78 (0.63, 0.97) | 0.043 |
| Model 2 | 1.00 | 0.94 (0.72, 1.23) | 0.80 (0.60, 1.06) | 0.16 |
| Dihydrogenistein (DHGE) | ||||
| Median (Range) | 7 (0, 15) | 26 (15, 49) | 150 (49, 64,372) | |
| Case/control | 389/351 | 357/384 | 365/376 | |
| Model 1 | 1.00 | 0.84 (0.68, 1.02) | 0.89 (0.72, 1.09) | 0.55 |
| Model 2 | 1.00 | 0.73 (0.56, 0.96) | 0.82 (0.62, 1.08) | 0.45 |
| Total isoflavones | ||||
| Median (Range) | 198 (3, 383) | 760 (384, 1,601) | 3893 (1,603, 428,500) | |
| Case/control | 379/361 | 370/371 | 362/379 | |
| Model 1 | 1.00 | 0.95 (0.77, 1.16) | 0.92 (0.75, 1.13) | 0.50 |
| Model 2 | 1.00 | 0.83 (0.63, 1.08) | 0.80 (0.61, 1.05) | 0.20 |
Model 1: Conditional logistic model stratified by matching factors including age at urine sample collection, month of sample collection, first morning urine (yes or no), and race (white or other races) in both cohorts. Menopausal status (premenopausal or postmenopausal), and hormone replacement therapy (yes or no) were additionally matched for in NHS II.
Model 2: Conditional logistic model additionally adjusted for family history of diabetes (yes or no), hypertension at baseline (yes or no), hypercholesterolemia at baseline (yes or no), body mass index (kg/m2), smoking (nonsmoker, past smoker, current smoker), alternative healthy eating index, physical activity (MET-hr/week), total energy intake (kcal/day), menopausal status (premenopausal or postmenopausal), and hormone replacement therapy (yes or no).
Stratified analyses by menopausal status and hormone use were conducted. Significant interaction by postmenopausal hormone use was found for daidzein (P for interaction = 0.001) (Table 3). Comparing extreme tertiles of the urinary daidzein, the ORs of T2D was 0.81 (95% CI: 0.54, 1.21; P for trend = 0.41) for premenopausal women, 0.76 (95% CI: 0.52, 1.11; P for trend = 0.19) for postmenopausal women with hormone use, and 0.58 (95% CI: 0.34, 0.97; P for trend = 0.06) for postmenopausal women without hormone use. Consistently, in joint association analysis the inverse association between urinary daidzein and risk of T2D appeared to be stronger in the postmenopausal women without hormone use (Figure 1). No significant interactions between other metabolites and risk of T2D by menopausal status and hormone use were found. Further stratified analyses were conducted by age, BMI, and aHEI, and the inverse association appeared to be more apparent among women with BMI less than 30 (P for interaction = 0.03) (Supplemental table 4).
Table 3.
Stratified analysis of the association between urine isoflavones biomarkers and risk of type 2 diabetes by menopausal status and postmenopausal hormone use in the combined cohort.
| Number of participants | T1 | T2 | T3 | P for interaction* | |
|---|---|---|---|---|---|
| Daidzein | |||||
| Premenopausal | 975 | 1.00 | 0.85 (0.58, 1.24) | 0.81 (0.54, 1.21) | |
| Postmenopausal with HRT | 821 | 1.00 | 0.86 (0.59, 1.25) | 0.76 (0.52, 1.11) | |
| Postmenopausal without HRT | 426 | 1.00 | 0.70 (0.41, 1.19) | 0.58 (0.34, 0.97) | 0.001 |
| Genistein | |||||
| Premenopausal | 975 | 1.00 | 0.96 (0.66, 1.41) | 1.03 (0.70, 1.52) | |
| Postmenopausal with HRT | 821 | 1.00 | 0.73 (0.50, 1.07) | 0.75 (0.52, 1.10) | |
| Postmenopausal without HRT | 426 | 1.00 | 0.58 (0.34, 1.00) | 0.51 (0.30, 0.86) | 0.36 |
| DMA | |||||
| Premenopausal | 975 | 1.00 | 1.19 (0.80, 1.77) | 1.27 (0.86, 1.87) | |
| Postmenopausal with HRT | 821 | 1.00 | 1.06 (0.73, 1.53) | 0.74 (0.51, 1.09) | |
| Postmenopausal without HRT | 426 | 1.00 | 0.79 (0.47, 1.34) | 0.77 (0.45, 1.33) | 0.21 |
| DHDE | |||||
| Premenopausal | 975 | 1.00 | 1.22 (0.82, 1.80) | 1.22 (0.82, 1.82) | |
| Postmenopausal with HRT | 821 | 1.00 | 0.99 (0.68, 1.43) | 0.65 (0.44, 0.96) | |
| Postmenopausal without HRT | 426 | 1.00 | 0.75 (0.44, 1.28) | 0.63 (0.37, 1.05) | 0.82 |
| DHGE | |||||
| Premenopausal | 975 | 1.00 | 0.70 (0.48, 1.03) | 1.03 (0.70, 1.51) | |
| Postmenopausal with HRT | 821 | 1.00 | 0.84 (0.57, 1.23) | 0.66 (0.45, 0.96) | |
| Postmenopausal without HRT | 426 | 1.00 | 0.80 (0.47, 1.36) | 0.71 (0.42, 1.22) | 0.90 |
HRT: hormone replacement therapy
Given that menopausal status and HRT were not matching factors in NHS, unconditional logistic models were used for the stratified analysis, and multivariate models adjusted for age at urine sample collection, month of sample collection, fasting status (≥ 8 h or not), first morning urine (yes or no), race (white or other races), family history of diabetes (yes or no), hypertension at baseline (yes or no), hypercholesterolemia at baseline (yes or no), body mass index (continuous), smoking (nonsmoker, past smoker, current smoker), alternative healthy eating index (continuous), physical activity (continuous), total energy intake (continuous).
Likelihood ratio test comparing the conditional logistic models with and without interaction term was used; the urine isoflavones were dichotomized, and the premenopausal and postmenopausal with HRT were combined into one group.
Figure 1.
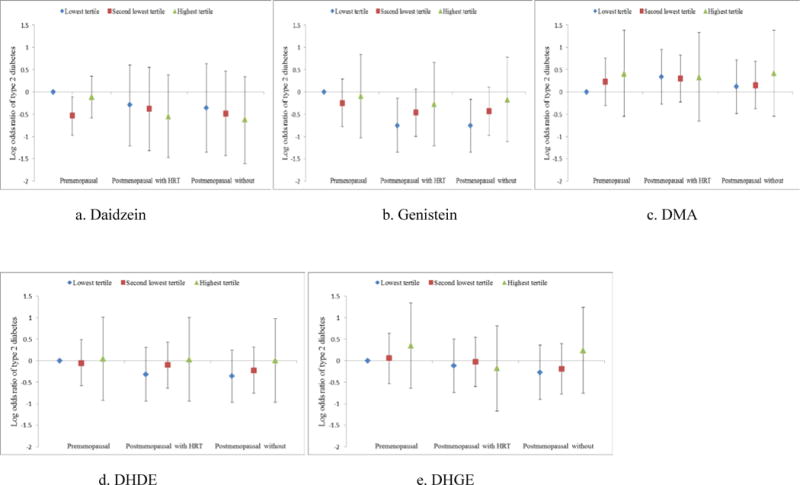
The joint association of urinary isoflavones biomarkers and postmenopausal status and hormone use with log odds of type 2 diabetes.
Conditional logistic models adjusted for hypertension at baseline (yes or no), hypercholesterolemia at baseline (yes or no), body mass index (kg/m2), smoking (nonsmoker, past smoker, current smoker), alternative healthy eating index, physical activity (MET-hr/week), and total energy intake (kcal/day).
DISCUSSION
In these two cohorts of U.S. women, urinary excretion of the main isoflavone metabolites, daidzein and genistein, were associated with a lower risk of T2D. Further analyses suggested that inverse association between daidzein and risk of T2D appeared to be stronger among postmenopausal women who did not take hormone therapy at sample collection. These associations were independent of established diabetes risk factors, such as BMI, physical activity, and overall diet quality.
Isoflavones are able to bind to the estrogen receptors (ER), especially ER-β, with 103–104 less potency than estradiol (23). These compounds can exert either estrogenic or anti-estrogenic action depending on the level of estradiol in the circulation. When endogenous estrogen levels are low, isoflavones primarily exert estrogen-like effects (32). Our observation that a stronger inverse association between isoflavones, especially daidzein, and risk of T2D was noted among postmenopausal women without current hormone use is in line with the notion that isoflavones exert estrogen-like effects on blood glucose when circulating estrogen levels are low. In addition, this inverse association was also consistent with results from short-term clinical trials. Supplementation of isoflavones did not significantly lower fasting glucose or insulin levels in a comprehensive meta-analysis of randomized clinical trials (13). The non-significant results of those trials might be due to short duration and might not reflect the potential anti-diabetic effect of long-term isoflavone intake. Meanwhile, in another meta-analysis that focused on perimenopausal and postmenopausal non-Asian women who did not take hormone replacement therapy, isoflavone supplementation significantly lowered fasting insulin and HOMA-IR levels (33). Meanwhile, a stronger inverse association between urinary daidzein and risk of T2D was observed among non-obese participants. This association may be related to concentration of blood circulating estrogen (34), as adipose tissue is the main source of circulating estrogens for postmenopausal women without hormone use (35).
Besides binding to ER, isoflavones may also bind to and activate nuclear receptors which regulate lipid and glucose metabolism, including liver X binding receptor (LXR), sterol regulated element binding protein (SREBP), peroxisome-proliferator activated receptors α (PPARα), and PPARγ (36–38). Isoflavones may also increase the phosphorylation of AMP-activated protein kinase (AMPK) and acetyl-CoA carboxylase to improve glucose uptake and fatty acid oxidation (39). Animal studies have also shown that isoflavones may improve hyperglycemia, glucose tolerance, and circulating insulin concentrations (40).
Several cohort studies have been conducted to examine the association between intakes of soy foods and isoflavones estimated using FFQs and risk of T2D (15,16,17,41,42). For example, in a Japanese population, higher intakes of isoflavones were not associated with diabetes risk in the total study population, but an inverse association was found among overweight women (16). In the Singapore Chinese Health Study, intakes of total isoflavones were not associated with T2D risk, probably because many soy foods were sweetened in Singapore (15). In the EPIC-InterAct Study, total isoflavone intake was not associated with T2D risk among men and women in eight European countries (17). In addition, two other studies assessed soy food consumption with risk of T2D. An inverse association was found in a Chinese cohort (41), while a positive association found in the Multiethnic Cohort in Hawaii (42). Differences in processing and cooking methods of soy food might be an explanation of these inconsistent associations. Moreover, measurement errors of FFQ assessments may be of a particular concern, especially among Western populations who consume much less soy foods than Asians. To our knowledge, no previous prospective studies have examined isoflavone biomarkers in relation to T2D risk. In cross-sectional studies on the association between urinary isoflavones and blood glucose concentration, no associations were found (43). The lack of association might be due to the reverse causation bias that the diabetes participants might tend to increase consumption of plant-based diet containing soy foods.
Our study had several strengths, including large sample size, long follow-up duration, and use of urinary biomarkers to represent the internal dose of isoflavones and account for the inter-individual variations in bioavailability. Our study also has several limitations. First, as reflected by the low ICCs of isoflavone markers in spot urine samples, the urinary biomarkers might not well represent long-term excretion of isoflavones. The low ICCs might results from the short half-lives of isoflavone metabolites in human body, low frequency of consumption, and use of spot urine samples with poor time-integration that were collected at various time points after the last meal. In general, non-differential misclassification of the exposure biases the results towards null. Moreover, because of the low reproducibility as well as the measurement errors associated with FFQ assessments of soy foods, only moderate correlation was found between soy foods assessed by FFQ and urinary isoflavones, indicating that urinary isoflavones might not well represent long-term relatively low soy food consumption. Meanwhile, given the between-person variability in isoflavones’ bioavailability partially due to microbiota processing and other physiological processes during absorption and metabolism (44), FFQ assessments of isoflavones and soy foods may not measure exposures to these isoflavone metabolites well. Second, although we adjusted for an array of established and potential risk factors of T2D, we could not exclude the possibility that unmeasured confounding or residual confounding, such as a healthy lifestyle, might still partially explain the association between isoflavones and risk of T2D. Third, we cannot exclude the possibility that chance may play a role in our findings, especially when the inverse association was primarily observed for daidzein. Fourth, we did not observe significant association between total urinary isoflavones and risk of T2D. Given that these individual metabolites have different levels of measurement errors, different time-integration (as reflected by ICCs), and different levels of microbiota processing, the associations for total isoflavones may be prone to attenuation toward the null because of this heterogeneity. Lastly, the observed associations may have limited generalizability within white health professionals. In addition, the urinary excretion of isoflavones was somehow lower than that observed in NHANES (mean urinary isoflavones: 4.9 μg/g creatine vs. 149.1 μg/g creatine in our study), further limiting the generalizability to populations with high isoflavone intake levels.
In conclusion, we observed inverse associations between urinary excretion of daidzein and genistein and risk of T2D in U.S. women. In addition, the inverse association for daidzein was stronger among postmenopausal women who did not use hormone replacement therapy. Although these findings are in line with evidence from animal experiments and clinical trials demonstrating benefits of isoflavone intake on insulin resistance, further studies are warranted to replicate the current findings among other western populations with low isoflavone intake levels. In addition, multiple-day 24-hr urine samples shall be used to achieve more stable estimates of isoflavone marker excretion.
Supplementary Material
Acknowledgments
We acknowledge Dr. Mary Kay Townsend and Dr. Kimberly A. Bertrand’s work on conducting pilot studies for the current investigation.
Funding
This study was funded by research grants CA186107, CA49449, CA176726, CA67262, DK58845, DK58785, DK082486, CA50385, CA87969, and P30 CA71789 from the National Institutes of Health. Dr. Sun was supported by a career development award R00HL098459 from the National Heart, Lung, and Blood Institute. The funding sources had no role in study design; in the collection, analysis, and interpretation of data; in the writing of the report; or in the decision to submit the article for publication. The authors are not affiliated with the funding institutions.
Footnotes
Contributors
RMvD and FBH obtained funding from the National Institutes of Health. QS, AAF, FBH, and RMvD were involved in data collection of dietary flavonoids or urinary metabolites. AAF measured urinary metabolites using liquid chromatography mass spectrometry. QS and RMvD conducted pilot studies for the current investigation. QS, FBH, BAR, and RMvD provided statistical expertise. MD analyzed the data and wrote the first draft of the manuscript. QS, FBH, AAF, SST, BAR, and RMvD contributed to the interpretation of the results and critical revision of the manuscript for important intellectual content and approved the final version of the manuscript. QS is the guarantor of this investigation.
Competing Interests
None of the authors had any financial or personal conflict of interest to disclose.
References
- 1.International Diabetes Federation. IDF Diabetes Atlas. 6th. Brussels, Belgium: International Diabetes Federation; 2013. [Google Scholar]
- 2.Hu FB, Manson JE, Stampfer MJ, et al. Diet, lifestyle, and the risk of type 2 diabetes mellitus in women. The New England journal of medicine. 2001;345:790–797. doi: 10.1056/NEJMoa010492. [DOI] [PubMed] [Google Scholar]
- 3.Fung TT, Schulze M, Manson JE, Willett WC, Hu FB. Dietary patterns, meat intake, and the risk of type 2 diabetes in women. Arch Intern Med. 2004;164:2235–2240. doi: 10.1001/archinte.164.20.2235. [DOI] [PubMed] [Google Scholar]
- 4.van Dam RM, Rimm EB, Willett WC, Stampfer MJ, Hu FB. Dietary patterns and risk for type 2 diabetes mellitus in U.S. men. Ann Intern Med. 2002;136:201–209. doi: 10.7326/0003-4819-136-3-200202050-00008. [DOI] [PubMed] [Google Scholar]
- 5.Mozaffarian D, Hao T, Rimm EB, Willett WC, Hu FB. Changes in diet and lifestyle and long-term weight gain in women and men. N Engl J Med. 2011;364:2392–2404. doi: 10.1056/NEJMoa1014296. [DOI] [PMC free article] [PubMed] [Google Scholar]
- 6.Heianza Y, Arase Y, Kodama S, et al. Effect of postmenopausal status and age at menopause on type 2 diabetes and prediabetes in Japanese individuals: Toranomon Hospital Health Management Center Study 17 (TOPICS 17) Diabetes Care. 2013;36:4007–4014. doi: 10.2337/dc13-1048. [DOI] [PMC free article] [PubMed] [Google Scholar]
- 7.Szmuilowicz ED, Stuenkel CA, Seely EW. Influence of menopause on diabetes and diabetes risk. Nat Rev Endocrinol. 2009;5:553–558. doi: 10.1038/nrendo.2009.166. [DOI] [PubMed] [Google Scholar]
- 8.Cho GJ, Lee JH, Park HT, et al. Postmenopausal status according to years since menopause as an independent risk factor for the metabolic syndrome. Menopause. 2008;15:524–529. doi: 10.1097/gme.0b013e3181559860. [DOI] [PubMed] [Google Scholar]
- 9.Kanaya AM, Herrington D, Vittinghoff E, et al. Glycemic effects of postmenopausal hormone therapy: the Heart and Estrogen/progestin Replacement Study. A randomized, double-blind, placebo-controlled trial. Annals of internal medicine. 2003;138:1–9. doi: 10.7326/0003-4819-138-1-200301070-00005. [DOI] [PubMed] [Google Scholar]
- 10.Manson JE, Chlebowski RT, Stefanick ML, et al. Menopausal hormone therapy and health outcomes during the intervention and extended poststopping phases of the Women’s Health Initiative randomized trials. JAMA: the journal of the American Medical Association. 2013;310:1353–1368. doi: 10.1001/jama.2013.278040. [DOI] [PMC free article] [PubMed] [Google Scholar]
- 11.Manson JE, Rimm EB, Colditz GA, et al. A prospective study of postmenopausal estrogen therapy and subsequent incidence of non-insulin-dependent diabetes mellitus. Annals of epidemiology. 1992;2:665–673. doi: 10.1016/1047-2797(92)90011-e. [DOI] [PubMed] [Google Scholar]
- 12.Rossi R, Origliani G, Modena MG. Transdermal 17-beta-estradiol and risk of developing type 2 diabetes in a population of healthy, nonobese postmenopausal women. Diabetes care. 2004;27:645–649. doi: 10.2337/diacare.27.3.645. [DOI] [PubMed] [Google Scholar]
- 13.Liu ZM, Chen YM, Ho SC. Effects of soy intake on glycemic control: a meta-analysis of randomized controlled trials. Am J Clin Nutr. 2011;93:1092–1101. doi: 10.3945/ajcn.110.007187. [DOI] [PubMed] [Google Scholar]
- 14.Yang B, Chen Y, Xu T, et al. Systematic review and meta-analysis of soy products consumption in patients with type 2 diabetes mellitus. Asia Pac J Clin Nutr. 2011;20:593–602. [PubMed] [Google Scholar]
- 15.Mueller NT, Odegaard AO, Gross MD, et al. Soy intake and risk of type 2 diabetes in Chinese Singaporeans [corrected] Eur J Nutr. 2012;51:1033–1040. doi: 10.1007/s00394-011-0276-2. [DOI] [PMC free article] [PubMed] [Google Scholar]
- 16.Nanri A, Mizoue T, Takahashi Y, et al. Soy product and isoflavone intakes are associated with a lower risk of type 2 diabetes in overweight Japanese women. J Nutr. 2010;140:580–586. doi: 10.3945/jn.109.116020. [DOI] [PubMed] [Google Scholar]
- 17.Zamora-Ros R, Forouhi NG, Sharp SJ, et al. The association between dietary flavonoid and lignan intakes and incident type 2 diabetes in European populations: the EPIC-InterAct study. Diabetes care. 2013;36:3961–3970. doi: 10.2337/dc13-0877. [DOI] [PMC free article] [PubMed] [Google Scholar]
- 18.Bhagwat S HD, Holden JM, et al. USDA Database for the Isoflavone Content of Selected Foods Release 2.0 2008 [Google Scholar]
- 19.Spencer JP, Abd El Mohsen MM, Minihane AM, Mathers JC. Biomarkers of the intake of dietary polyphenols: strengths, limitations and application in nutrition research. Br J Nutr. 2008;99:12–22. doi: 10.1017/S0007114507798938. [DOI] [PubMed] [Google Scholar]
- 20.Zamora-Ros R, Touillaud M, Rothwell JA, Romieu I, Scalbert A. Measuring exposure to the polyphenol metabolome in observational epidemiologic studies: current tools and applications and their limits. Am J Clin Nutr. 2014;100:11–26. doi: 10.3945/ajcn.113.077743. [DOI] [PMC free article] [PubMed] [Google Scholar]
- 21.Franke AA, Custer LJ, Wilkens LR, et al. Liquid chromatographic-photodiode array mass spectrometric analysis of dietary phytoestrogens from human urine and blood. J Chromatogr B Analyt Technol Biomed Life Sci. 2002;777:45–59. doi: 10.1016/s1570-0232(02)00216-7. [DOI] [PubMed] [Google Scholar]
- 22.Perez-Jimenez J, Hubert J, Hooper L, et al. Urinary metabolites as biomarkers of polyphenol intake in humans: a systematic review. Am J Clin Nutr. 2010;92:801–809. doi: 10.3945/ajcn.2010.29924. [DOI] [PubMed] [Google Scholar]
- 23.Muthyala RS, Ju YH, Sheng S, et al. Equol, a natural estrogenic metabolite from soy isoflavones: convenient preparation and resolution of R- and S-equols and their differing binding and biological activity through estrogen receptors alpha and beta. Bioorganic & medicinal chemistry. 2004;12:1559–1567. doi: 10.1016/j.bmc.2003.11.035. [DOI] [PubMed] [Google Scholar]
- 24.Seow A, Shi CY, Franke AA, Hankin JH, Lee HP, Yu MC. Isoflavonoid levels in spot urine are associated with frequency of dietary soy intake in a population-based sample of middle-aged and older Chinese in Singapore. Cancer Epidemiol Biomarkers Prev. 1998;7:135–140. [PubMed] [Google Scholar]
- 25.Maskarinec G, Singh S, Meng L, Franke AA. Dietary soy intake and urinary isoflavone excretion among women from a multiethnic population. Cancer Epidemiol Biomarkers Prev. 1998;7:613–619. [PubMed] [Google Scholar]
- 26.Prentice RL, Breslow NE. Retrospective studies and failure time models. Biometrika. 1978;65:153–158. [Google Scholar]
- 27.Manson JE, Rimm EB, Stampfer MJ, et al. Physical activity and incidence of non-insulin-dependent diabetes mellitus in women. Lancet. 1991;338:774–778. doi: 10.1016/0140-6736(91)90664-b. [DOI] [PubMed] [Google Scholar]
- 28.Willett WC. Nutritional epidemiology. 2. New York: Oxford University Press; 1998. [Google Scholar]
- 29.McCullough ML, Willett WC. Evaluating adherence to recommended diets in adults: the Alternate Healthy Eating Index. Public health nutrition. 2006;9:152–157. doi: 10.1079/phn2005938. [DOI] [PubMed] [Google Scholar]
- 30.Chiuve SE, Fung TT, Rimm EB, et al. Alternative dietary indices both strongly predict risk of chronic disease. The Journal of nutrition. 2012;142:1009–1018. doi: 10.3945/jn.111.157222. [DOI] [PMC free article] [PubMed] [Google Scholar]
- 31.Franke AA, Halm BM, Kakazu K, Li X, Custer LJ. Phytoestrogenic isoflavonoids in epidemiologic and clinical research. Drug testing and analysis. 2009;1:14–21. doi: 10.1002/dta.12. [DOI] [PMC free article] [PubMed] [Google Scholar]
- 32.Messina MJ, Wood CE. Soy isoflavones, estrogen therapy, and breast cancer risk: analysis and commentary. Nutrition journal. 2008;7:17. doi: 10.1186/1475-2891-7-17. [DOI] [PMC free article] [PubMed] [Google Scholar]
- 33.Ricci E, Cipriani S, Chiaffarino F, Malvezzi M, Parazzini F. Effects of soy isoflavones and genistein on glucose metabolism in perimenopausal and postmenopausal non-Asian women: A meta-analysis of randomized controlled trials. Menopause. 2010;17:1080–1086. doi: 10.1097/gme.0b013e3181dd05a9. [DOI] [PubMed] [Google Scholar]
- 34.Golditz GA. Relationship between estrogen levels, use of hormone replacement therapy, and breast cancer. Journal of the National Cancer Institute. 1998;90:814–823. doi: 10.1093/jnci/90.11.814. [DOI] [PubMed] [Google Scholar]
- 35.Maccio A, Madeddu C. Obesity, inflammation, and postmenopausal breast cancer: therapeutic implications. TheScientificWorldJournal. 2011;11:2020–2036. doi: 10.1100/2011/806787. [DOI] [PMC free article] [PubMed] [Google Scholar]
- 36.Mezei O, Banz WJ, Steger RW, Peluso MR, Winters TA, Shay N. Soy isoflavones exert antidiabetic and hypolipidemic effects through the PPAR pathways in obese Zucker rats and murine RAW 264.7 cells. J Nutr. 2003;133:1238–1243. doi: 10.1093/jn/133.5.1238. [DOI] [PubMed] [Google Scholar]
- 37.Kim S, Sohn I, Ahn JI, Lee KH, Lee YS, Lee YS. Hepatic gene expression profiles in a long-term high-fat diet-induced obesity mouse model. Gene. 2004;340:99–109. doi: 10.1016/j.gene.2004.06.015. [DOI] [PubMed] [Google Scholar]
- 38.Mezei O, Li Y, Mullen E, Ross-Viola JS, Shay NF. Dietary isoflavone supplementation modulates lipid metabolism via PPARalpha-dependent and -independent mechanisms. Physiological genomics. 2006;26:8–14. doi: 10.1152/physiolgenomics.00155.2005. [DOI] [PubMed] [Google Scholar]
- 39.Cederroth CR, Vinciguerra M, Gjinovci A, et al. Dietary phytoestrogens activate AMP-activated protein kinase with improvement in lipid and glucose metabolism. Diabetes. 2008;57:1176–1185. doi: 10.2337/db07-0630. [DOI] [PubMed] [Google Scholar]
- 40.Babu PV, Liu D, Gilbert ER. Recent advances in understanding the anti-diabetic actions of dietary flavonoids. J Nutr Biochem. 2013;24:1777–1789. doi: 10.1016/j.jnutbio.2013.06.003. [DOI] [PMC free article] [PubMed] [Google Scholar]
- 41.Villegas R, Gao YT, Yang G, et al. Legume and soy food intake and the incidence of type 2 diabetes in the Shanghai Women’s Health Study. Am J Clin Nutr. 2008;87:162–167. doi: 10.1093/ajcn/87.1.162. [DOI] [PMC free article] [PubMed] [Google Scholar]
- 42.Morimoto Y, Steinbrecher A, Kolonel LN, Maskarinec G. Soy consumption is not protective against diabetes in Hawaii: the Multiethnic Cohort. Eur J Clin Nutr. 2011;65:279–282. doi: 10.1038/ejcn.2010.228. [DOI] [PMC free article] [PubMed] [Google Scholar]
- 43.Struja T, Richard A, Linseisen J, Eichholzer M, Rohrmann S. The association between urinary phytoestrogen excretion and components of the metabolic syndrome in NHANES. European journal of nutrition. 2014;53:1371–1381. doi: 10.1007/s00394-013-0639-y. [DOI] [PubMed] [Google Scholar]
- 44.Rowland IR, Wiseman H, Sanders TA, Adlercreutz H, Bowey EA. Interindividual variation in metabolism of soy isoflavones and lignans: influence of habitual diet on equol production by the gut microflora. Nutrition and cancer. 2000;36:27–32. doi: 10.1207/S15327914NC3601_5. [DOI] [PubMed] [Google Scholar]
Associated Data
This section collects any data citations, data availability statements, or supplementary materials included in this article.