Significance
Conventional coacervates can form on mixing oppositely charged polyelectrolytes in aqueous solutions, due to electrostatic attraction between the oppositely charged polymers. This report describes the first instance (to the best of our knowledge) of complexation and coacervation of two positively charged polyelectrolytes by overcoming longer-range electrostatic repulsion. The molecular force measurements and theoretical simulations demonstrate that the complexation of the like-charged coacervate is most likely driven by strong cation–π interactions inspired by marine mussel adhesives. This like-charged coacervation mechanism provides new insights into biological self-assembly processes and a new paradigm for engineering strong, reversible interactions between polymers underwater, which has various potential applications like encapsulation and dispersion of particles and cells.
Keywords: polyelectrolyte complexes, complex coacervates, cation–π interaction, like-charged coacervate, surface forces apparatus
Abstract
It is well known that polyelectrolyte complexes and coacervates can form on mixing oppositely charged polyelectrolytes in aqueous solutions, due to mainly electrostatic attraction between the oppositely charged polymers. Here, we report the first (to the best of our knowledge) complexation and coacervation of two positively charged polyelectrolytes, which provides a new paradigm for engineering strong, self-healing interactions between polyelectrolytes underwater and a new marine mussel-inspired underwater adhesion mechanism. Unlike the conventional complex coacervate, the like-charged coacervate is aggregated by strong short-range cation–π interactions by overcoming repulsive electrostatic interactions. The resultant phase of the like-charged coacervate comprises a thin and fragile polyelectrolyte framework and round and regular pores, implying a strong electrostatic correlation among the polyelectrolyte frameworks. The like-charged coacervate possesses a very low interfacial tension, which enables this highly positively charged coacervate to be applied to capture, carry, or encapsulate anionic biomolecules and particles with a broad range of applications.
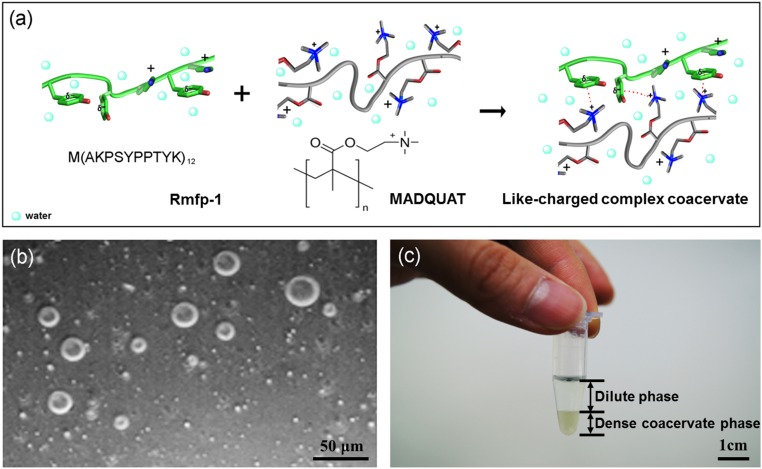
It is well known that polyelectrolyte complexes can be formed when oppositely charged polyelectrolytes are mixed in aqueous solutions (1–4). This often leads to fluid–fluid phase separation, the so-called complex coacervation, namely, the appearance of a dense polyelectrolyte-rich liquid phase (coacervate phase) and a more dilute solution phase (aqueous phase, Fig. 1) (3, 4). The formation of polyelectrolyte complexes or coacervate can be impacted by many factors, including structural features of the component polymers (e.g., molecular weight, charge density, functional groups, hydrophilicity and hydrophobicity balance, etc.), mixing ratio and concentration of the oppositely charged polyelectrolytes, and solution and environmental conditions (e.g., pH, ionic strength, temperature, etc.) (3–5).
Fig. 1.
(A) Schematic of like-charged complex coacervate formation [Rmfp-1 (green) and MADQUAT (gray)]. (B) Light microscopy image of microdroplets of Rmfp-1 and MADQUAT like-charged coacervate. (Scale bar, 50 μm.) (C) Bulk phase separation of the like-charged coacervate. (Scale bar, 1 cm.)
Complex coacervate, which was suggested as “the origin of life” (6), finds application in many engineering and biological systems, such as microencapsulation in food, and in pharmaceutical and cosmetic industries due to the low interfacial energy of the coacervate phase (3, 5, 7–9). Complex coacervate also plays a critical role in the underwater adhesion of many sessile marine organisms such as tubeworms and mussels, which secrete and disperse adhesive proteins to form complex coacervates that facilitate their positioning and spreading over a desired substrate under seawater (10–12).
It is believed that polyelectrolyte complexation is driven by mainly electrostatic attraction in long distances between oppositely charged polymer chains in water and by additional molecular recognition driving forces such as chirality, hydrogen bonding, and hydration in short distances, implying that the polyelectrolyte complex is composed of at least one polycation and one polyanion, so-called oppositely charged complexation (when fluid–fluid phase separation occurs, it is referred to as oppositely charged coacervation) (13–15). Like-charged polyelectrolytes have been long believed to be unable to form polyelectrolyte complexes due to electrostatic repulsion, although multivalent counterions can generate attraction between the like-charged polymers (16, 17). More than three decades of biochemical studies on mussels show that most of the characterized mussel adhesive proteins are positively charged polyelectrolytes and no negatively charged mussel adhesive protein has been reported (18–21). Interestingly, almost equal amounts of aromatic residues coexist with the cationic residues in these mussel adhesive proteins (20–23). Recent molecular and surface force measurements have revealed the presence of strong adhesion between the cationic and the aromatic polymers in aqueous solutions, which is believed to be due to cation–π interactions (24–27), which, over short distances, could be stronger than the electrostatic attraction between oppositely charged polymers in aqueous solutions due to its low desolvation penalty (24, 25, 27). Cation–π interactions in living organisms play a key role in various cellular activities, including neurotransmissions and ion channels, because they show stronger interaction than hydrogen bonding and electrostatic interaction in wet conditions (24, 27). Therefore, it is speculated that the cation–π interaction could serve as a driving force for the formation of complex coacervates of the positively charged mussel adhesive proteins underwater.
In this study, we show a new scheme of complex coacervate formation from two like-charged polyelectrolytes (a cationic recombinant mussel adhesive protein and a cationic polymer of trimethyl-ammonium). The physical principle of like-charged coacervation, its nanostructure, and the consequent mechanical properties are presented. Our results show that cation–π interactions can lead to complex coacervation of cationic polyelectrolytes underwater with low interfacial energy, and the findings of this study provide an energetic new paradigm for preparing biomimetic materials, especially with potential applications in cell encapsulant, charged protein carriers, and adhesives.
Results
Like-Charged Complex Coacervate Formation from Rmfp-1/MADQUAT Mixtures.
The formation of like-charged complex coacervates was investigated using two cationic polyelectrolytes, the recombinant mussel foot protein-1 [Rmfp-1, 12-repetition of the decapeptide of fp-1, M(AKPSYPPTYK)12] (20) and poly(2-(trimethylamino)ethyl methacrylate) (MADQUAT) (Fig. 1). Rmfp-1 (20 mol% tyrosine and 20 mol% lysine) is a π-rich polymer and one of the well-characterized mussel adhesive proteins with high water solubility (>500 mg/mL). Rmfp-1 has an exactly equal amount of cationic and phenolic groups (20 mol%) without any negatively charged residue, which reflects the intrinsic nature of the mussel adhesive. MADQUAT was chosen as the counterpart for the cation-rich polyelectrolyte for complex coacervation as the trimethylammonium group is expected to establish stronger cation–π interactions than the lysine of Rmfp-1 (27). Buffer pH was fixed at ∼3.0 (0.1 M sodium acetate, pKa = 4.8), at which the carboxyl terminus of Rmfp-1 is neutral (it is noted that the mussel adhesive secretes to a marine environment at pH below 3.0) (28). By changing the mixing ratio of Rmfp-1 and MADQUAT, the formation of the complex coacervate was monitored by optical microscopy and turbidity. Interestingly, the two like-charged polyelectrolytes undergo liquid–liquid phase separation, similar to the conventional complex coacervate of oppositely charged polyelectrolytes (Fig. 1 B and C). As shown in Fig. 1C, the dense phase of the polymer complex settles at the bottom of the e tube, waiting for 1 d after mixing the two polyelectrolytes, while the dilute supernatant phase of the polymer solution stays above.
Generally, solution turbidity is sensitive to the amount of complex coacervate in solution during coacervate formation from two oppositely charged polyelectrolytes (3, 5, 10). Interestingly, the yield of complex coacervate from two positively charged polyelectrolytes is much less sensitive to solution turbidity, which suggests the density of the like-charged coacervate is lower than that of the conventional coacervates. Indeed, the density of the like-charged coacervate is about 1.16 g/cm3, lower than that of the oppositely charged coacervates reported previously (1.4–1.8 g/cm3) (10, 15, 29).
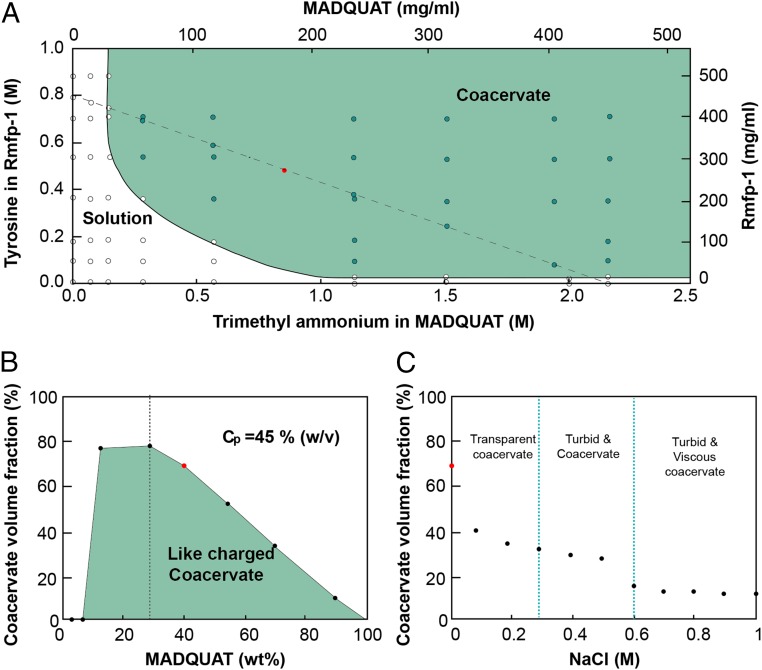
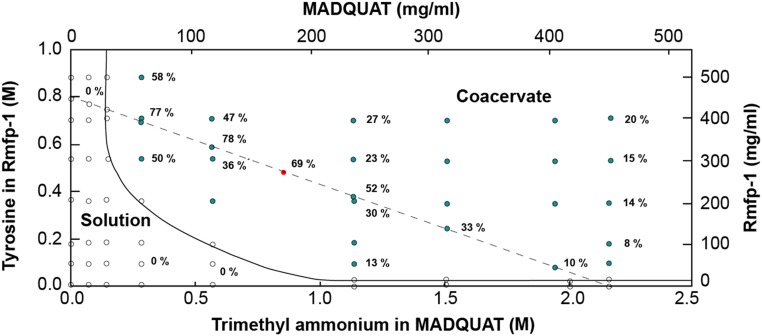
Varying polymer concentration (Fig. 2A), ratio between MADQUAT and Rmfp-1 (Fig. 2B), and salt concentration (Fig. 2C), the formation of complex coacervate was monitored. The yield of the coacervate was calculated by measuring dense coacervate volume in the solution after bulk phase separation (Fig. 2B). At a MADQUAT:Rmfp-1 ratio of ∼3:7 (1:1 stoichiometry of tyrosine/trimethylammonium units), maximum coacervate yield was observed by comparing volume fractions. The volume fraction of the like-charged coacervate at the maximum of fixed total polymer concentration [Cp = 45% (wt/vol)] was generally higher (∼75% vol/vol) than that of the oppositely charged coacervate (∼37% vol/vol), probably due to the electrostatic repulsion between MADQUAT and Rmfp-1. As the total polymer concentration (Cp) in the system is increased and the stoichiometry of tyrosine and trimethylammonium approaches 1:1, the yield of coacervates generally increased (Fig. 2B and Fig. S1). These results suggest the formation of the like-charged complex coacervate was driven by cation–π interaction.
Fig. 2.
(A) Phase diagram of MADQUAT/Rmfp-1 mixtures as a function of the concentration of Rmfp-1 and MADQUAT in 0.1 M sodium acetate buffer (pH ∼3.0). Dashed line indicates the mixture of Rmfp-1 and MADQUAT with total polymer concentration (Cp) of 45% (wt/vol) for B. (B) Coacervate volume fraction indicating complex coacervate formation of polyelectrolyte mixture as a function of MADQUAT content (in wt%). Total polymer concentration (Cp) was fixed to 45% (wt/vol) in 0.1 M sodium acetate buffer (pH ∼3.0). Dashed line indicates the mixing ratio of 1:1 stoichiometry of tyrosine in rmfp-1 and trimethylammonium in MADQUAT. (C) Phase transition of the coacervate [red solid circle; Cp = 45% (wt/vol)] as a function of NaCl concentration. The vertical line at 0.3 M NaCl concentration is for transparent coacervate–turbid coacervate phase transition, and the vertical line at 0.6 M NaCl concentration is for turbid coacervate–viscous phase transition. The red solid circle in A–C is the same point when Cp = 45% (wt/vol) in 0.1 M sodium acetate buffer (pH ∼3.0).
Fig. S1.
Phase diagram of MADQUAT/Rmfp-1 mixtures with the coacervate dense phase volume fraction value as a function of the concentration of Rmfp-1 and MADQUAT.
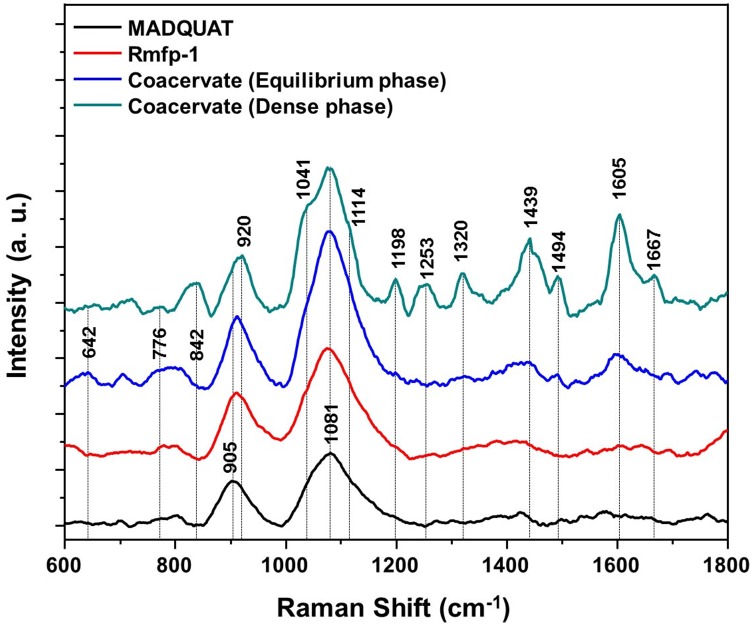
To probe contribution of cation–π interaction in the complex coacervation, UV-resonance Raman spectroscopy of the coacervate was performed. Fig. 3 shows 325-nm–excited Raman spectra of Rmfp-1, MADQUAT, equilibrium phase of Rmfp-1 and MADQUAT, and the dense coacervate phase of Rmfp-1 and MADQUAT in 0.1 M sodium acetate buffer (pH ∼3.0). Characteristic Raman bands of Tyr residue of Rmfp-1 are hardly observed in the Raman spectrum of Rmfp-1 or MADQUAT (30–36). However, Raman spectra of the coacervate phases of Rmfp-1 and MADQUAT are remarkably different from that of Rmfp-1 or MADQUAT alone. Bands around 643 cm−1, 842 cm−1, 1,041 cm−1, 1,114 cm−1, 1,198 cm−1, 1,253 cm−1, 1,320 cm−1, 1,439 cm−1, 1,494 cm−1, 1,605 cm−1, and 1,667 cm−1 are clearly observed in coacervate phases of Rmfp-1/MADQUAT, which are not detected in Raman spectrum of MADQUAT or Rmfp-1 in the buffer. Specifically, enhancement of the ring stretching vibrations of the tyrosine (Y8, ∼1,605 cm−1), Fermi resonance of tyrosine (Y1, 830–850 cm−1), and the ring-O stretching vibration (Y7, ∼1,198 cm−1 and 1,253 cm−1) support that cation–π interaction between tyrosine in Rmfp-1 and MADQUAT is one of the main contributors to the like-charged coacervate formation (36). Strong enhancement of the amide I vibration (∼1,667 cm−1) suggests the conformation changes in Rmfp-1 are due to the complexation (36).
Fig. 3.
The 325-nm excited resonance Raman spectra of MADQUAT (black), Rmfp-1 (red), mixture of Rmfp-1 and MADQUAT (blue), and dense coacervate phase of Rmfp-1 and MADQUAT (green) in 0.1 M sodium acetate buffer (pH ∼3.0).
Characterization of the Nanostructure of the Like-Charged Coacervate Phase.
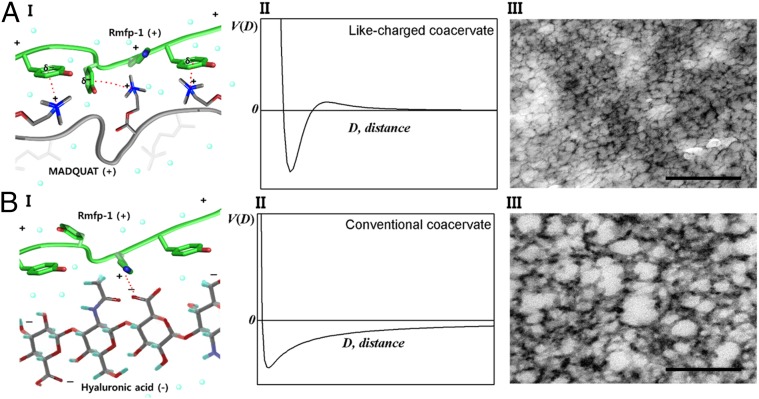
To better understand the origin of the lower turbidity and lower density of the like-charged coacervate than that of the conventional coacervates, cryogenic transmission electron microscopy (cryo-TEM) analysis was conducted on a like-charged coacervate and a conventional coacervate, composed of positively charged Rmfp-1 and negatively charged hyaluronic acid (HA), for comparison (Fig. 4).
Fig. 4.
Comparison of complex coacervates of (A) like-charged polyelectrolytes, Rmfp-1 and MADQUAT, and (B) oppositely charged polyelectrolytes, Rmfp-1 and hyaluronic acid. In A and B, (I) schematic interaction of the coacervates, (II) interaction potential vs. distance curve [V(D) is the interaction potential and D is the distance between functional groups], and (III) cryo-TEM images of the coacervates are shown. (Scale bar, 200 nm.)
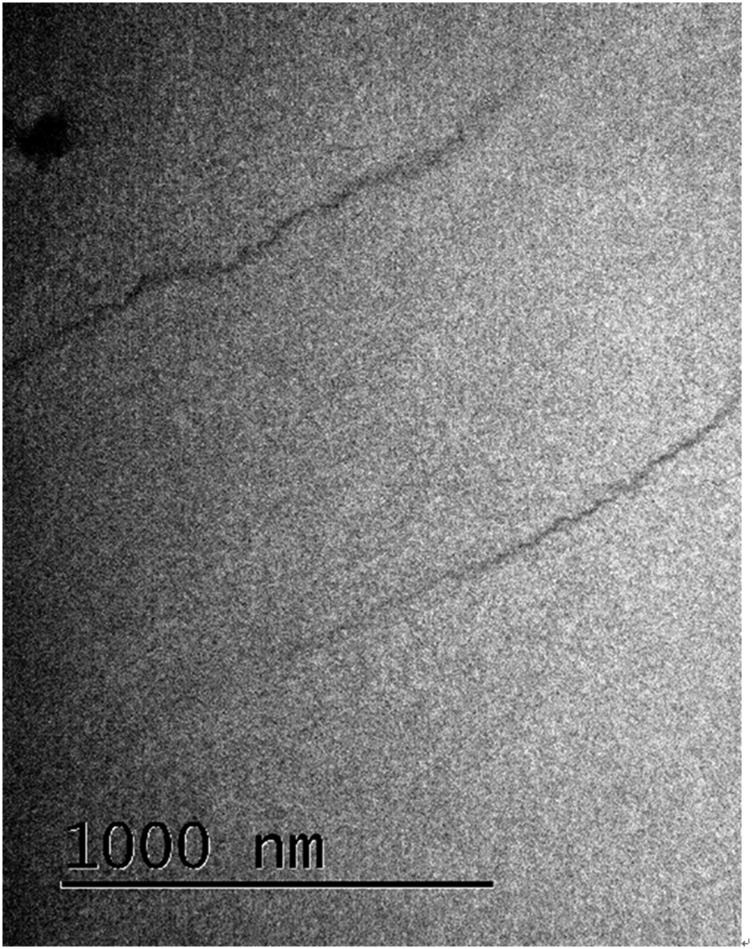
Whereas the electrostatic attraction between Rmfp-1 and HA sustains over longer distances (Fig. 4B), the short-range attraction (i.e., van der Waals and cation–π interactions) between Rmfp-1 and MADQUAT is effective only over short distances, and the overall interaction becomes repulsive at long distances underwater (Fig. 4 A, II). As this short-range attraction is strong enough to exceed the entropic gain and the longer-range repulsion caused by polyelectrolyte dispersion, Rmfp-1 and MADQUAT form a complex coacervate (note that the Rmfp-1 complex makes only finite-sized bundles, because the short-range attraction between Rmfp-1s is not strong enough, as seen in Fig. S2).
Fig. S2.
TEM image of cationic Rmfp-1 aggregates that form finite-size bundles in 0.1 M acetic acid (pH ∼3.0).
Nanostructures of the dense phase of the oppositely charged and like-charged complex coacervates were imaged using cryo-TEM; the nanostructures endow the two complex coacervates with distinct properties, as shown in Fig. 4 A, III and B, III. Both coacervates show multiply connected continuous network structures. The conventional complex coacervate generally shows a thicker polyelectrolyte framework with nonuniform distribution of pore size (Fig. 4 B, III), whereas the like-charged coacervate shows a much thinner polyelectrolyte framework and regular-sized pores, which indicates stronger correlation between the like-charged polyelectrolyte frameworks (Fig. 4 A, III) Based on this concept we estimate the size of the pore. If we assume that the pore size may grow until adhesive cation–π interaction is balanced with Debye–Huckel electrostatic repulsion (37, 38), the estimated pore size is roughly consistent with experimental value (detailed in Supporting Information).
Physical Properties of the Like-Charged Coacervate Phase Measured by Using the Surface Forces Apparatus.
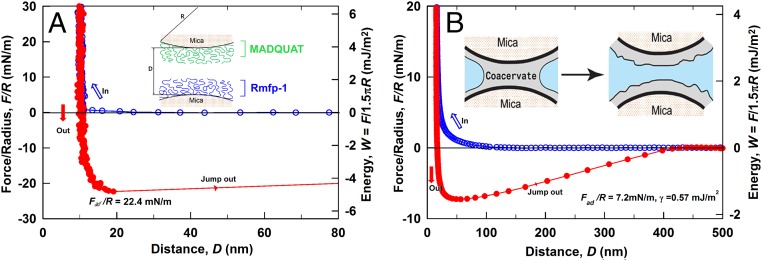
A surface forces apparatus (SFA) was used to quantify the interactions between MADQUAT and Rmfp-1, which helps in understanding the driving forces behind the formation of like-charged coacervates (10, 11, 29). Fig. 5A shows the force–distance profile of a MADQUAT-coated mica surface interacting with an Rmfp-1–coated mica surface in 100 mM sodium acetate solution (pH ∼3.0). It is noted that the force curves during moving in and moving out of the two surfaces do not overlap, which was mainly due to the interaction differences between the interacting surfaces during approaching and separation (or so-called adhesion hysteresis as generally observed for adhesive systems) (20, 27, 39). The approaching force curve shows repulsion, which was mainly due to electrical double-layer repulsion between positively charged surfaces and steric interactions of the opposing polymer chains extended to aqueous solution, in competition with attractive interactions such as van der Waals and cation–π interactions. The confined film thickness of MADQUAT and Rmfp-1 between the two mica surfaces was ∼11 nm. A strong adhesive of Fad/R ∼ −22.4 mN/m (Wad ∼ 4.8 mJ/m2) was detected during the separation of the Rmfp-1 and MADQUAT surfaces, which is ∼20% higher than the cohesion between two Rmfp-1 layers (Wad ∼ 3.9 mJ/m2) (23). It suggests that stronger cation–π interaction between trimethyl ammonium in MADQUAT and phenol than that between lysine in Rmfp-1 and phenol is a main driving force for the like-charged complex coacervation.
Fig. 5.
Force–distance profiles relative to separation distance between two surfaces. (A) Interaction between Rmfp-1 film and MADQUAT film on mica surfaces relative to their separation distance (D). (B) Interaction profile demonstrating the adhesive pull-off force measured from the capillary adhesion of the like-charged complex coacervate phase of Rmfp-1 and MADQUAT between two mica surfaces. Open blue circles, approach; solid red circles, separation. The y axis on the left gives the measured force, F/R (force normalized by the radius of the surface), whereas the y axis on the right gives the corresponding adhesion energy per unit area (W) between two flat surfaces, defined by W = F/1.5πR. The interfacial energy (γ) of the water/coacervate phase interface is defined by γ = Fad/4πRcosθ.
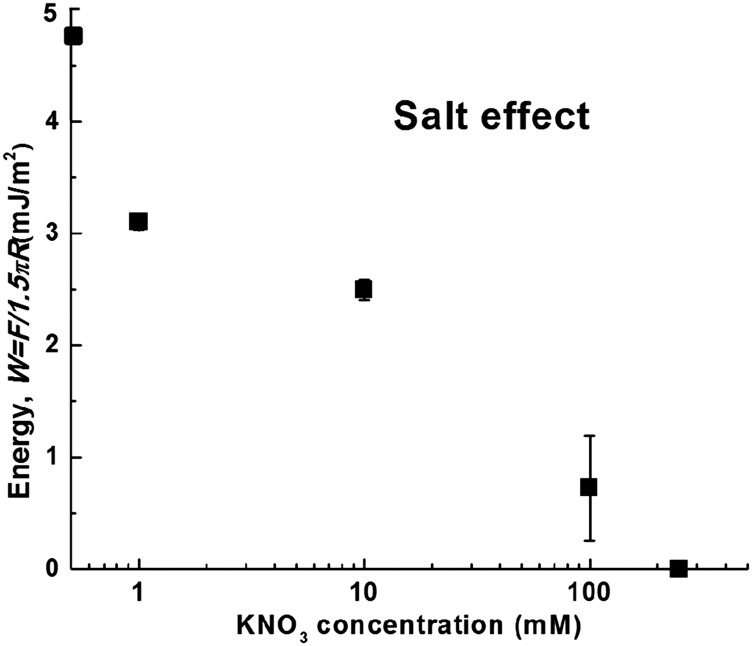
To further elucidate the interactions between the MADQUAT and Rmfp-1 surfaces, a salt effect was investigated by introducing KNO3 of different concentrations (0 mM, 1 mM, 10 mM, 100 mM, and 250 mM) in the 100-mM acetic acid solution (pH ∼ 3.0). As shown in Fig. S3, when the KNO3 concentration increases from 0 mM to 250 mM, the adhesion between MADQUAT and Rmfp-1 gradually decreases and eventually changes to repulsion. This could be mainly attributed to two factors: (i) K+ ions can compete with and replace the trimethylammonium cations in the cation–π interaction between the two surfaces even at low concentrations and (ii) the increasing of entropic and steric pressure between the MADQUAT and Rmfp-1 surfaces. It is evident from the SFA results that the strong cation–π interactions between the positively charged trimethylammonium group and the aromatic phenolic group of Rmfp-1 contribute to the adhesion, which lead to complex coacervation between the two positively charged polyelectrolytes.
Fig. S3.
Dependence of adhesion energy between MADQUAT and Rmfp-1 surfaces on KNO3 concentration in 0.1 M acetic acid. The MADQUAT and Rmfp-1 surfaces were kept in contact for 2 min before force measurements.
Low interfacial energy in aqueous solutions is a key physical property of coacervates. SFA was applied to directly measure the interfacial energy of the MADQUT/Rmfp-1 coacervate by following a method reported previously (10, 29). For a typical measurement, the dense coacervate was deposited and was confined between two opposing mica surfaces by forming a coacervate meniscus bridge, and its capillary adhesion Fad was determined from the force–distance curve obtained by the SFA as shown in Fig. 5B, which is correlated to the interfacial energy γ of the water/coacervate phase interface by
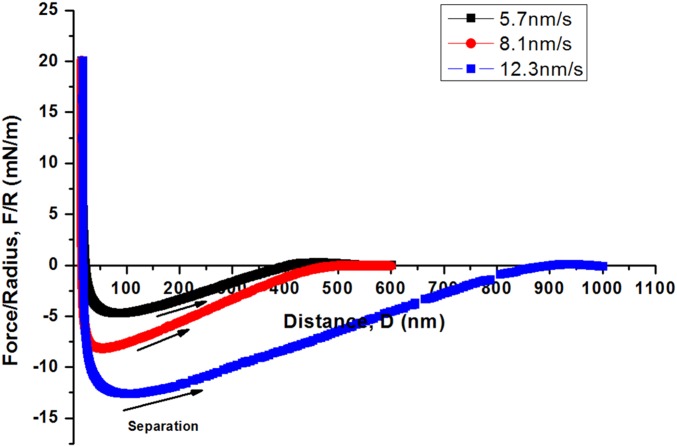
where R is the local radius of curvature of interacting surfaces, θ is the contact angle, and cos θ ∼ 1 due to the complete wetting of mica with the coacervate phase. Fig. 5B shows a typical force–distance profile of the like-charged coacervate phase confined between two mica surfaces. A ∼15-nm-thick layer of coacervate film is confined between the two mica surfaces during approach. The adhesion Fad/R = 7.2 mN/m, measured during separation (at 8.1 nm/s), is due to the capillary bridging of the coacervate. Herein, the coacervate/water interfacial energy was determined to be ∼0.57 mJ/m2, which is close to the previously reported values for the conventional complex coacervates based on poly(l-lysine hydrochloride) and poly(l-glutamic acid sodium salt) under similar experimental conditions (29). Moreover, the adhesion force (and interfacial energy) of the coacervate depends on the separation speed. As the separation velocity decreases from 12.3 nm/s to 5.7 nm/s, the calculated effective interfacial energy decreases from ∼0.93 mJ/m2 to ∼0.36 mJ/m2 (Fig. S4). As the separate velocity further decreases to <5 nm/s, the adhesion force and calculated effective interfacial energy would continue to drop (29), suggesting that the thermal equilibrium interfacial energy of the like-charged coacervate would be <0.3 mJ/m2. Such rate-dependent adhesion is consistent with previous reports on confined polymer melts (39) and conventional coacervates (10, 29).
Fig. S4.
Dependence of capillary bridging force on separation velocity of complex coacervate phase confined between two mica surfaces.
Effect of Added Salt and Nanoparticle Encapsulation.
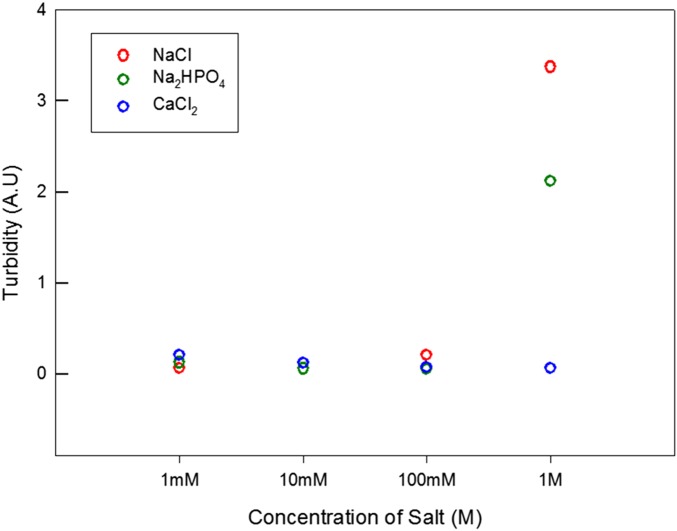
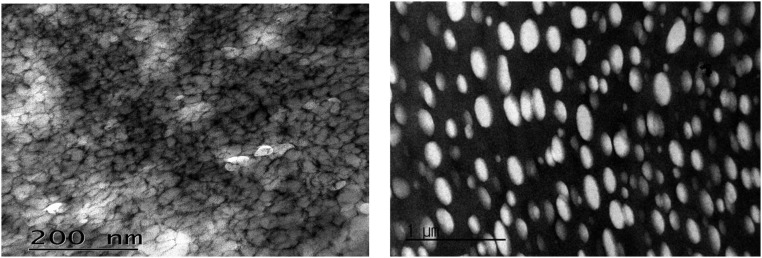
The highly cationic like-charged complex coacervate can capture negatively charged ions and agents. The yield of the like-charged coacervate decreases with increasing salt concentration (0–1 M of NaCl, Fig. 2C). The addition of a 2:1 salt (CaCl2) does not show any significant impact on the turbidity of the coacervate, whereas the turbidity increases significantly with the addition of a 1:2 salt, Na2(HPO4) (Fig. S5). Although divalent cation Ca2+ can get involved in cation–π interactions, divalent Ca2+ would encounter electrostatic repulsion with the cationic polyelectrolytes here and a significant potential barrier across the coacervate boundary (40). Therefore, the addition of Ca2+ did not significantly influence the coacervate structure. In contrast, the divalent anion can replace the monovalent anion penetrating into the pores of the coacervate. The addition of divalent anions at high concentrations (i.e., 1 M) can not only reduce the repulsion significantly but also generate attraction between the like-charged polyelectrolytes (16, 17). As a result, the pore size is reduced and the density of the coacervate increases. The density of the coacervate phase increases to 1.92 g/cm3 with the addition of 1 M NaCl and to 1.55 g/cm3 with the addition of 0.5 M Na2(HPO4). Moreover, the relative turbidity of the like-charged coacervate phase was drastically increased (Fig. 2C and Fig. S5) with increasing salt concentration. The TEM image shown in Fig. S6 reveals that the deswelling occurs locally; this may be the origin of the turbidity increase. Adding salt, the screening length of electrostatic repulsion is reduced. Hence, the average distance between MADQUAT and Rmfp-1 becomes shorter. This will lead to the shrinkage of the dense phase on increasing the salt concentration. At large enough salt concentration, the phase becomes turbid and viscous.
Fig. S5.
Relative turbidity of like-charged complex coacervates of Rmfp-1 and MADQUAT, depending on salt concentration.
Fig. S6.
Cryo-TEM images of Rmfp-1/MADQUAT coacervate (Left, no salt; Right, with 0.5 M NaCl).
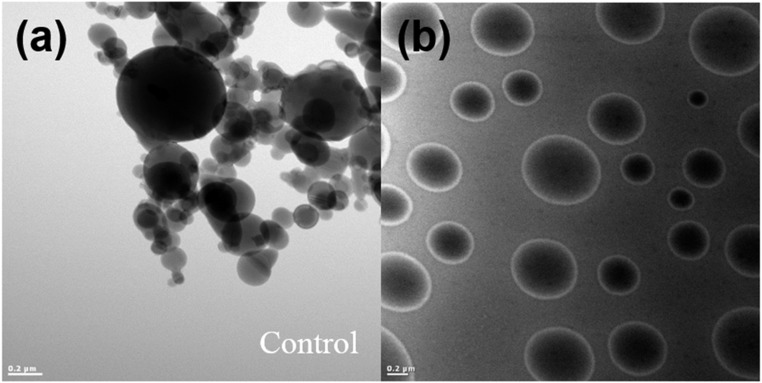
Like-charged complex coacervates have potential applications in encapsulation of a wide range of anionic materials due to the low interfacial tension for drug and cell delivery and for bioactive coating. As a proof of concept, negatively charged silica nanoparticles were encapsulated by the like-charged coacervate of Rmfp-1/MADQUAT. A thin layer of the coacervate coating with encapsulated silica nanoparticles was observed (Fig. S7), which clearly demonstrates that the coacervate coating functionally prevents nanoparticle aggregation.
Fig. S7.
TEM images of (A) pure silica nanoparticles and (B) silica nanoparticles suspended in the like-charged coacervate (Rmfp-1/MADQUAT).
Discussion
This study shows that the strong short-range cation–π interaction between the trimethylammonium and phenolic groups triggers the complexation of two positively charged polyelectrolytes by overcoming longer-range electrostatic repulsion (Fig. 1). SFA results support this idea (Fig. 5).
The yield of like-charged coacervate is much less sensitive to solution turbidity than the conventional complex coacervate is, because of the lower density of the like-charged coacervate, indicated by density measurements. The microscopic origin of the low turbidity may be found in the TEM image, which shows that the like-charged coacervate has a multiply connected continuous network structure. The like-charged coacervation has two perspectives of different network structure: one characterized by the width of the polymer complex framework and the other by the undulating length or pore size, in comparison with the conventional coacervate (Fig. 4). The polymer complex framework is thin and straight, and the variation in domain size is much smaller than that for conventional coacervates. This indicates that the like-charged coacervate forms more regular complex domains via interplay of strong short-range attractions and longer-range repulsions. The pore size of the like-charged coacervate is regular and it is round shaped, which demonstrates strong longer-range correlation between the polymer complex frameworks. Thus, the low turbidity of the like-charged coacervate is probably due to the thin coacervate domain width.
To elaborate our observations on the formation of like-charged complex coacervates, a two-step process model is proposed, similar to the model proposed by Veis (41) and Tainaka (42) for conventional complex coacervate. It involves (i) like-charged polyelectrolytes forming finite-sized aggregates driven by the cation–π bond, thus overcoming electrostatic repulsion, and (ii) the aggregates undergoing a phase separation to form a dense macroscopic phase, leaving a dilute phase where the polyelectrolytes are depleted. Due to the strong longer-range electrostatic repulsion, they form a sponge-like structure with a finite spatial correlation, i.e., a multiply connected continuous network phase. In summary, the two-step process can be written as
where the lowercase labels denote the status of polymer.
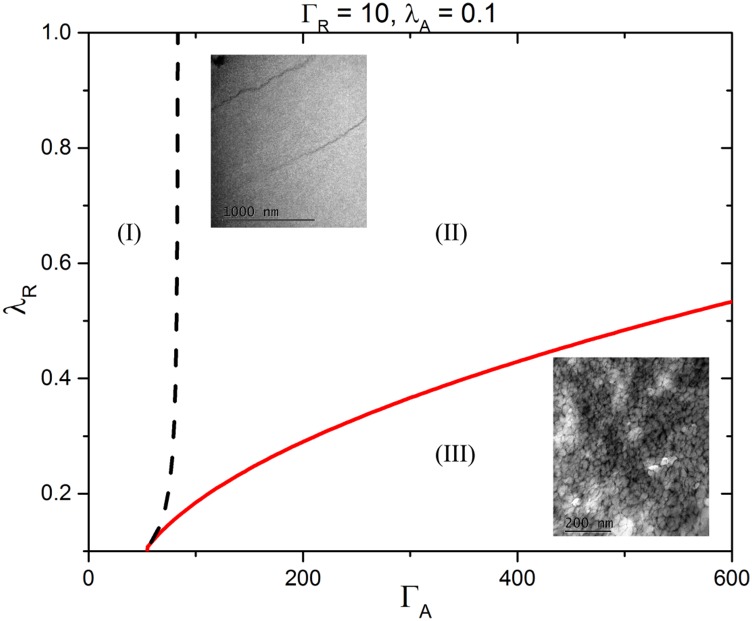
Fig. S2 shows the cryo-TEM image of Rmfp-1 chains in 0.1 M sodium acetate (pH ∼3.0), forming finite-sized bundles (about 4 nm thick), the aggregation induced by the cation–π interaction among the like-charged Rmfp-1 chains. The underlying mechanism is as follows: Due to the like-charge repulsion within the contour of Rmfp-1, it can be approximated as a directed polymer (the TEM image agrees well this approximation), and, as presented in the previous study, these like-charged semiflexible polyelectrolytes can undergo bundling in the presence of strong short-range cation–π attraction. The instability condition of the liquid phase is expressed as , where is a wavenumber, , is the line tension along the polymer, is the potential, is the contour length of the polymer, is the density, and . The phase diagram of bundle formation and phase separation has been provided as a function of the potential. We obtained the phase diagram shown in Fig. 6 by approximating the electrostatic repulsion as the Debye–Hückel potential and the cation–π interaction as the Gaussian function. In Fig. 6, represent the strengths of repulsion and attraction, respectively, and represent the screening lengths of repulsion and attraction, respectively. and are obtained from the line charge density and the salt concentration, whereas and are calculated from numerical simulation using Gaussian09 (43). The obtained maximum attraction between a single lysine residue and a single phenol group in Rmfp1 is about −6.0 kBT at distance of 4.5 Å, whereas it is about −9.0 kBT at distance of 4.2 Å between a trimethyl group in MADQUAT and a single phenol group in Rmfp-1. We can estimate , by considering the number of such bonds within a single-chain complex. In Rmfp-1, there are a maximum of 24 bonds, which is about −144 kBT estimated from the formation of 24 bonds per polypeptide. On the other hand, Rmfp-1 and MADQUAT can have about −216 kBT.
Fig. 6.
The phase diagram of the Rmfp-1 and MADQUAT mixture. The parameters are estimated from the Gaussian09 simulations. and represent the strengths of repulsion and attraction, respectively, and and represent the screening lengths of repulsion and attraction, respectively. and are scaled with respect to the thermal energy and and with respect to the radius of gyration of the polymers, . In region I, polymer complexes are liquid-like. On increasing the strength of the attractions, the liquid-like polymer complexes form finite-size bundles (region II). The size of the bundle increases on further increasing the strength of the attractions or decreasing repulsive screening length, and it eventually transits to infinite bundle in region III, i.e., macroscopic phase separation. However, the infinite bundle has a finite correlation length to avoid a large electrostatic energy penalty and forms a sponge-like structure.
Then, why do Rmfp-1 and MADQUAT form a network structure whereas Rmfp-1 by itself forms only bundles? Without any added salt, Rmfp-1 in aqueous solution does not aggregate to form a regular structure because of strong electrostatic repulsions (“liquid” region I in Fig. 6). On addition of salt, which decreases the repulsive screening length, (corresponding to the perpendicular downward shift in the phase diagram), finite-sized bundles are formed (“finite bundles” in Fig. 6, region II, Inset ). For the mixture of Rmfp-1 and MADQUAT, where the cation–π interaction is stronger (corresponding to the parallel shift to right in the phase diagram) and the ionic strength is larger, even without additional salt, due to the additional chloride ions produced during the dissolution of MADQUAT (corresponding to the perpendicular downward shift in the phase diagram), the bundle grows to an infinite interconnected phase (“infinite bundle” in Fig. 6, region III, Inset).
It is known that the low interfacial energy is the hallmark of the conventional coacervate. The interfacial tension of the like-charged complex coacervate is even lower than that of the conventional one (Fig. 5B). The origin of the low interfacial tension of like-charged complex coacervate is probably the fragile network structure of weak and sparse cross-links observed in the cryo-TEM images (Fig. 4 A, III and B, III). The low interfacial energy indicates that the positively charged coacervates could easily spread over a surface underwater or in air, showing strong potential for application in underwater adhesives, surface coatings, and encapsulation. Indeed, the like-charged complex coacervates engulf various types of particles, oils, and dyes in aqueous solutions. In addition, a thin layer of the coacervate coating on the SiO2 nanoparticles was observed by TEM, which functionally prevented the nanoparticle aggregation (Fig. S6).
Conclusion
This study demonstrates to our knowledge the first complexation and coacervation of two like-charged polyelectrolytes, which provides an energetic new paradigm for engineering strong and self-healing interactions between polymers underwater and a new underwater adhesion mechanism inspired by marine mussels. The molecular force measurements by the SFA and theoretical simulations indicate that the complexation of the like-charged coacervate is most likely driven by strong short-range cation–π interactions. In addition, the like-charged coacervate maintains low interfacial energy in aqueous solution (<1 mJ/m2), the hallmark of the conventional coacervate. The like-charged coacervates have significant potential applications in several fields, including encapsulation and dispersion of particles and cells.
Materials and Methods
Material.
Rmfp-1s composed of 12 and 22 repeated decapeptides (AKPSYPPTYK) of fp-1 were produced using the Escherichia coli system, as previously reported (10). The purity of Rmfp-1 (∼95%) was confirmed using SDS/PAGE and amino acid analysis. Molecular masses of rfp-1s were about 13.6 kDa and 24.9 kDa from the matrix-assisted laser desorption ionization time of flight mass spectroscopy (MALDI-TOF MS) analysis. The poly(2-dimethylamino)ethyl methacrylate)methyl chloride quaternary salt (MADQUAT; average molecular weight, Mr = 8,900) was obtained from Sigma-Aldrich. Salts were purchased from Sigma-Aldrich. The plain capillary tube for density measurement was purchased from Kimble-Chase.
Complex Coacervation of Rmfp-1 and MADQUAT.
By varying the ratio between MADQUAT and Rmfp-1 at pH 3.0 (adjusted with sodium acetate and acetic acid), polymers concentration, and salt concentration in 0.1 M sodium acetate buffer, coacervation of the two polyelectrolytes was monitored by an optical microscope. The bulk phase separation (Fig. 1C) was achieved by waiting for 1 d after mixing the two polyelectrolytes. The coacervate volume fraction (the coacervate phase/total volume of liquid) was calculated by measuring the volume of dense coacervate phase (Fig. 1C, bottom) and total volume after the bulk phase separation. Turbidity measurements were conducted using UV-Vis spectrophotometry at 600 nm. The relative turbidity is defined as –ln(T/T0), where T and T0 are light transmittance with and without sample, respectively (10).
UV-Resonance Raman Spectroscopy.
Raman spectra were measured using a Jobin Yvon/HORIBA LabRam ARAMIS Raman spectrometer with radiation from an air-cooled He-Cd laser (325 nm). Raman scattering was detected at a geometry of 180°, using a Peltier/thermoelectric-cooled (‒70 °C) charge-coupled device (CCD) camera (1,024 × 256 pixels2). The typical accumulation time used in this study was 120 s. The Raman spectra shown in Fig. 3 were subjected to the following pretreatment steps: baseline correction by means of a linear function, smoothing using the Savitzky–Golay algorithm with 11 filter width, and finally normalization to a constant total area in the analyzed region.
Cryo-TEM (Freeze Substitution for Ultrastructural Analysis).
All samples were cryo-fixed in a high-pressure freezer (Leica EM HPM100; Boeckeler Instruments) and stored under liquid nitrogen until freeze substitution. The cryo-fixed samples were incubated in anhydrous acetone containing 2 (wt/vol)% OsO4 for 5 d at −80 °C, and then the samples were warmed to 20 °C over 2 d (24 h from −80 °C to −20 °C, 20 h from −20 °C to 4 °C, and 4 h from 4 °C to 20 °C). The samples were thoroughly washed three times with anhydrous acetone before resin embedding. After rinsing off the anhydrous acetone at room temperature, the samples were embedded in Epon 812 resin (EMS). After the dehydration, infiltration, polymerization, sectioning, and staining, the sectioned samples were observed with TEM (JEM-1011; JEOL).
Force and Interfacial Energy Measurements by the SFA.
The interaction forces between MADQUAT and Rmfp-1 and the interfacial energy of the coacervate of MADQUAT and Rmfp-1 were measured using an SFA (SurForce LLC). The detailed experimental setup of the SFA has been reported elsewhere (44). Briefly, thin silver-backed mica sheets (∼5 μm thickness) were glued onto cylindrical silica disks (radius R = 2 cm). Mica surfaces were cleaned using UV-ozone treatment before coating the polyelectrolytes.
For force measurements between MADQUAT and Rmfp-1, the two mica surfaces were separately drop coated with MADQUAT and Rmfp-1, using a 10-μg/mL MADQUAT solution and a 10-μg/mL Rmfp-1 protein solution in 0.1 M acetic acid, for 20 min. The two surfaces were washed five times with 100 mM acetic acid solution and then mounted into the SFA chamber for measurement in cross-cylinder geometry. This interaction locally corresponds to that of a sphere of the same radius approaching a flat surface based on the Derjaguin approximation, when the separation distance is much smaller than the local radius of curvature. The interaction forces and the separation distance between the surfaces were determined in situ and in real time, using multiple-beam interferometry. The measured adhesion force, Fad, is correlated to the adhesion energy per unit area Wad by Fad = 1.5πRWad for soft, deformable materials (20, 45).
A previously reported procedure was applied to measure the interfacial energy of the Rmfp-1/MADQUAT coacervate (10, 29). Briefly, 100 μL of the centrifuged coacervate phase was injected between two mica surfaces and was equilibrated for at least 10 min. A top-view microscope was used to observe and ensure the formation of the coacervate meniscus bridge when the two mica surfaces were brought close. Then, the force–distance profiles were obtained and capillary bridging adhesion was measured.
Technical Details of the Simulation
Bond energy between cations and phenol in water is calculated by using computer simulation. Starting from various initial configurations of cations and phenol, depending on their angles and distance, we perform the configuration optimization. We consider about 1,440 different initial conditions, depending on the distance (2 Å ∼ 6 Å) and the solid angle between cation and π residue. After the optimization, the total energy of the system is calculated. We distract the interaction energy by subtracting each energy of the single-molecule system from the total energy of the system. The energies of single-molecule systems are obtained from the separated simulations after the optimization process. All of the calculations were done by the DFT (Density Functional Theory) method with the 6-31+G** basis set, the M06-2X hybrid functional, and the SMD (Solvation Model based on Density) implicit water model, using the Gaussian09 program (43).
Macroscopic Like-Charged Polyelectrolyte Complexation Due to the Cation– (or Short-Ranged) Bond
Our goal is to reveal the criterion that the short-ranged cation–π bond overcomes the longer-ranged electrostatic repulsion to lead the macroscopic phase separation. For this purpose, we construct the Ginzburg–Landau-like theory by using a relevant coarse-grained order parameter (46, 47). For systematic derivation, we start from the field theoretical representation. It is extremely difficult to consider the general polyelectrolyte in 3D. Instead we reduce the complexity of the work by assuming the polyelectrolytes are directed polymers and almost aligned along the z axis. Then, the contour of the polymer is , where is one end of the polymer and is the tangent vector along the polymer. The polymer segment density for N polymers of length L at a point x is defined by . There are two competing interaction terms: the short-ranged cation–π bond and the longer-ranged electrostatic repulsion. The short-ranged bond is often well approximated by the Gaussian potential , whereas we use Debye–Huckel interaction for longer-ranged interaction, which becomes a modified Bessel function of the second kind of order zero after integrating out along the contour, , where . Because we model the short-ranged cation–π interactions in our model, we assume . The total potential is then . The Hamiltonian of the system is then
| [S1] |
The first term on the right-hand side is the mechanical energy of the directed polymers and is the line tension along the polymers. Here we assume , similar to a Gaussian polymer. The Hamiltonian is rewritten in the Fourier,
| [S2] |
where is the average areal density of the polymers, and . The partition function of the system is given by
| [S3] |
where is the noninteracting Hamiltonian of a Gaussian polymer in Eq. S1. Using the Habbard–Stratonovich transformation
we obtain
| [S4] |
In the derivation above, we introduce a new field that turns out to be an order parameter in the mean field limit later on. is an Landau–Wilson-type free energy and given by
| [S5] |
is a single polymer partition function, which is defined by
| [S6] |
In the mean field the free energy minimization yields,
| [S7] |
From Eq. S7, we see that can be a parameter to distinguish the liquid stated and the densely ordered structure. In other words, can be an order parameter for macroscopic phase transition of dense packing. is an average with respect to a single Gaussian polymer Hamiltonian.
The Ginzbug–Landau type of equation is obtained for the Hamiltonian around the saddle point:
| [S8] |
Here
The system becomes unstable when U(k*) < 0 and the coefficient of the second-order term of [S8] is negative; i.e.,
| [S9] |
Here, are dimensionless quantities scaled by and , and the energies are scaled by .
If this criterion holds only for some finite , the system is unstable and the polyelectrolytes aggregate to form a finite-sized bundle of size . On increasing the bonding energy (or increasing bonding distance) or reducing the repulsion (reducing the screening length), becomes smaller (i.e., the size of the bundle becomes larger) and it eventually becomes zero, which implies the system undergoes macroscopic phase separation. In Fig. 6, we find that the phase separation due to the stronger cation–π bond between MADQUAT and tyrosine agrees with our theoretical analysis.
Pore Size Estimate from the Self-Energy of the Spherically Charged Shell
Here we show that the few 10-nm–sized pores can be formed from the interplay of the adhesive cation–π bond and repulsive electrostatic interaction. We find the optimal pore size that minimizes the free energy of the system within the low salt concentration approximation, similarly to refs. 48 and 49. For simplicity, we ignore the interaction between pores, which allows us to approximate each pore as a single charged sphere of radius , which carries its charge on its shell. Under the Debye–Huckel approximation, the potential satisfies the relation
| [S10] |
where, is Debye screening length.
The boundary condition is
| [S11] |
where R is the radius of the pore, is a number density of surface charge, e is a unit charge, and is a dielectric constant of water.
Then, the solution of the outer surface is given by
| [S12] |
when .
The self-energy of the spherically charge shell is expressed as
| [S13] |
By substituting [S12],
| [S14] |
On the other hand, the adhesive attraction due to the cation– bond is given by
| [S15] |
Here is a volume density of residues and is a bond energy of cation–. Then, the optimal radius is determined by
| [S16] |
Although the acetic acid concentration is only about , additional chloride ions exist that are produced during the dissolution of MADQUAT. It is difficult to determine the surface charge density, because we do not know the thickness of the shell and how strongly they are neutralized inside the shell due to the strong electrostatics. Because we want to consider a very thin shell, we consider the phase boundary of coacervation that gives the minimum concentration of MADQUAT and chloride ions, about 200 mM. Then, , . Further, . is the value estimated by quantum simulation, and in the coacervate phase is approximated as 0.65 M, which translates to . Then, , and hence pore size is about 9.6 nm. This is a little bit smaller than the experimental results because we assume the infinitely thin shell. If we consider the polyelectrolytes in the shell, can be larger, which results in larger pore size.
Acknowledgments
This work was supported by the Marine Biotechnology program (Marine BioMaterials Research Center) funded by the Ministry of Oceans and Fisheries, Korea (D11013214H480000110); the National Research Foundation of Korea Grants NRF-C1ABA001-2011-0029960, NRF-2015R1D1A1A09061345, and NRF-2014R1A2A2A01006724 (to D.S.H. and Y.J.); an NSERC Discovery grant and an NSERC RTI grant (for a surface forces apparatus) from the Natural Sciences and Engineering Research Council of Canada (to H.Z.); Supercomputing Center/Korea Institute of Science and Technology Information with supercomputing resources including technical support (Y.J.); and a Brain Korea 21 Program for Leading Universities & Students (BK21 PLUS) grant funded by the Ministry of Education, Korea (10Z20130012243 to D.S.H.).
Footnotes
The authors declare no conflict of interest.
This article is a PNAS Direct Submission. Y.L. is a guest editor invited by the Editorial Board.
This article contains supporting information online at www.pnas.org/lookup/suppl/doi:10.1073/pnas.1521521113/-/DCSupplemental.
References
- 1.Decher G. Fuzzy nanoassemblies: Toward layered polymeric multicomposites. Science. 1997;277(5330):1232–1237. [Google Scholar]
- 2.Fuoss RM, Sadek H. Mutual interaction of polyelectrolytes. Science. 1949;110(2865):552–554. doi: 10.1126/science.110.2865.552. [DOI] [PubMed] [Google Scholar]
- 3.Bungenberg-de-Jong H. Coacervation and its meaning for biology. Protoplasma. 1932;15:110–173. [Google Scholar]
- 4.van der Gucht J, Spruijt E, Lemmers M, Cohen Stuart MA. Polyelectrolyte complexes: Bulk phases and colloidal systems. J Colloid Interface Sci. 2011;361(2):407–422. doi: 10.1016/j.jcis.2011.05.080. [DOI] [PubMed] [Google Scholar]
- 5.Kizilay E, Kayitmazer AB, Dubin PL. Complexation and coacervation of polyelectrolytes with oppositely charged colloids. Adv Colloid Interface Sci. 2011;167(1–2):24–37. doi: 10.1016/j.cis.2011.06.006. [DOI] [PubMed] [Google Scholar]
- 6.Oparin AI. The Origin of Life on the Earth. 3rd Ed USSR Academy of Sciences; Moscow: 1957. [Google Scholar]
- 7.Spruijt E, Sprakel J, Stuart MAC, van der Gucht J. Interfacial tension between a complex coacervate phase and its coexisting aqueous phase. Soft Matter. 2010;6(1):172–178. [Google Scholar]
- 8.Matthew HW, Salley SO, Peterson WD, Klein MD. Complex coacervate microcapsules for mammalian cell culture and artificial organ development. Biotechnol Prog. 1993;9(5):510–519. doi: 10.1021/bp00023a010. [DOI] [PubMed] [Google Scholar]
- 9.Gouin S. Microencapsulation: Industrial appraisal of existing technologies and trends. Trends Food Sci Technol. 2004;15(7):330–347. [Google Scholar]
- 10.Hwang DS, et al. Viscosity and interfacial properties in a mussel-inspired adhesive coacervate. Soft Matter. 2010;6(14):3232–3236. doi: 10.1039/C002632H. [DOI] [PMC free article] [PubMed] [Google Scholar]
- 11.Wei W, et al. A mussel-derived one component adhesive coacervate. Acta Biomater. 2014;10(4):1663–1670. doi: 10.1016/j.actbio.2013.09.007. [DOI] [PMC free article] [PubMed] [Google Scholar]
- 12.Shao H, Bachus KN, Stewart RJ. A water-borne adhesive modeled after the sandcastle glue of P. californica. Macromol Biosci. 2009;9(5):464–471. doi: 10.1002/mabi.200800252. [DOI] [PMC free article] [PubMed] [Google Scholar]
- 13.Priftis D, Laugel N, Tirrell M. Thermodynamic characterization of polypeptide complex coacervation. Langmuir. 2012;28(45):15947–15957. doi: 10.1021/la302729r. [DOI] [PubMed] [Google Scholar]
- 14.Perry SL, et al. Chirality-selected phase behaviour in ionic polypeptide complexes. Nat Commun. 2015;6:6052. doi: 10.1038/ncomms7052. [DOI] [PMC free article] [PubMed] [Google Scholar]
- 15.Ortony JH, Hwang DS, Franck JM, Waite JH, Han S. Asymmetric collapse in biomimetic complex coacervates revealed by local polymer and water dynamics. Biomacromolecules. 2013;14(5):1395–1402. doi: 10.1021/bm4000579. [DOI] [PMC free article] [PubMed] [Google Scholar]
- 16.Ha B-Y, Liu AJ. Counterion-mediated attraction between two like-charged rods. Phys Rev Lett. 1997;79(7):1289. [Google Scholar]
- 17.Tiraferri A, Maroni P, Borkovec M. Adsorption of polyelectrolytes to like-charged substrates induced by multivalent counterions as exemplified by poly(styrene sulfonate) and silica. Phys Chem Chem Phys. 2015;17(16):10348–10352. doi: 10.1039/c5cp00910c. [DOI] [PubMed] [Google Scholar]
- 18.Lee BP, Messersmith PB, Israelachvili JN, Waite JH. Mussel-inspired adhesives and coatings. Annu Rev Mater Res. 2011;41:99–132. doi: 10.1146/annurev-matsci-062910-100429. [DOI] [PMC free article] [PubMed] [Google Scholar]
- 19.White JD, Wilker JJ. Underwater bonding with charged polymer mimics of marine mussel adhesive proteins. Macromolecules. 2011;44(13):5085–5088. [Google Scholar]
- 20.Zeng H, Hwang DS, Israelachvili JN, Waite JH. Strong reversible Fe3+-mediated bridging between dopa-containing protein films in water. Proc Natl Acad Sci USA. 2010;107(29):12850–12853. doi: 10.1073/pnas.1007416107. [DOI] [PMC free article] [PubMed] [Google Scholar]
- 21.Waite JH, Holten-Andersen N, Jewhurst S, Sun C. Mussel adhesion: Finding the tricks worth mimicking. J Adhes. 2005;81(3):297–317. [Google Scholar]
- 22.Lu Q, Hwang DS, Liu Y, Zeng H. Molecular interactions of mussel protective coating protein, mcfp-1, from Mytilus californianus. Biomaterials. 2012;33(6):1903–1911. doi: 10.1016/j.biomaterials.2011.11.021. [DOI] [PubMed] [Google Scholar]
- 23.Kim S, et al. Cation–π interaction in DOPA-deficient mussel adhesive protein mfp-1. J Mater Chem B Mater Biol Med. 2015;3(5):738–743. doi: 10.1039/c4tb01646g. [DOI] [PubMed] [Google Scholar]
- 24.Ma JC, Dougherty DA. The cation-π interaction. Chem Rev. 1997;97(5):1303–1324. doi: 10.1021/cr9603744. [DOI] [PubMed] [Google Scholar]
- 25.Dougherty DA. Cation-π interactions in chemistry and biology: A new view of benzene, Phe, Tyr, and Trp. Science. 1996;271(5246):163–168. doi: 10.1126/science.271.5246.163. [DOI] [PubMed] [Google Scholar]
- 26.Gallivan JP, Dougherty DA. Cation-π interactions in structural biology. Proc Natl Acad Sci USA. 1999;96(17):9459–9464. doi: 10.1073/pnas.96.17.9459. [DOI] [PMC free article] [PubMed] [Google Scholar]
- 27.Lu Q, et al. Nanomechanics of cation-π interactions in aqueous solution. Angew Chem Int Ed Engl. 2013;52(14):3944–3948. doi: 10.1002/anie.201210365. [DOI] [PubMed] [Google Scholar]
- 28.Martinez Rodriguez NR, Das S, Kaufman Y, Israelachvili JN, Waite JH. Interfacial pH during mussel adhesive plaque formation. Biofouling. 2015;31(2):221–227. doi: 10.1080/08927014.2015.1026337. [DOI] [PMC free article] [PubMed] [Google Scholar]
- 29.Priftis D, Farina R, Tirrell M. Interfacial energy of polypeptide complex coacervates measured via capillary adhesion. Langmuir. 2012;28(23):8721–8729. doi: 10.1021/la300769d. [DOI] [PubMed] [Google Scholar]
- 30.Grace LI, Cohen R, Dunn T, Lubman DM, de Vries MS. The R2PI spectroscopy of tyrosine: A vibronic analysis. J Mol Spectrosc. 2002;215(2):204–219. [Google Scholar]
- 31.Tuma R. Raman spectroscopy of proteins: From peptides to large assemblies. J Raman Spectrosc. 2005;36(4):307–319. [Google Scholar]
- 32.Uchida T, Mogi T, Nakamura H, Kitagawa T. Role of Tyr-288 at the dioxygen reduction site of cytochrome bo studied by stable isotope labeling and resonance Raman spectroscopy. J Biol Chem. 2004;279(51):53613–53620. doi: 10.1074/jbc.M409719200. [DOI] [PubMed] [Google Scholar]
- 33.Nagai M, et al. Heme structure of hemoglobin M Iwate [α 87(F8)His-->Tyr]: A UV and visible resonance Raman study. Biochemistry. 2000;39(43):13093–13105. doi: 10.1021/bi001029i. [DOI] [PubMed] [Google Scholar]
- 34.Chi Z, Asher SA. UV Raman determination of the environment and solvent exposure of Tyr and Trp residues. J Phys Chem B. 1998;102(47):9595–9602. [Google Scholar]
- 35.Xue Y, et al. Cu(I) recognition via cation-π and methionine interactions in CusF. Nat Chem Biol. 2008;4(2):107–109. doi: 10.1038/nchembio.2007.57. [DOI] [PMC free article] [PubMed] [Google Scholar]
- 36.Clark RJH, Hester RE. Spectroscopy of Biological Systems. Wiley; Hoboken, NJ: 1986. pp. 113–175. [Google Scholar]
- 37.Wang Z-G. Fluctuation in electrolyte solutions: The self energy. Phys Rev E Stat Nonlin Soft Matter Phys. 2010;81(2 Pt 1):021501. doi: 10.1103/PhysRevE.81.021501. [DOI] [PubMed] [Google Scholar]
- 38.Wang R, Wang Z-G. Effects of image charges on double layer structure and forces. J Chem Phys. 2013;139(12):124702. doi: 10.1063/1.4821636. [DOI] [PubMed] [Google Scholar]
- 39.Zeng H, Maeda N, Chen N, Tirrell M, Israelachvili J. Adhesion and friction of polystyrene surfaces around T g. Macromolecules. 2006;39(6):2350–2363. [Google Scholar]
- 40.Reddy AS, Sastry GN. Cation [M = H+, Li+, Na+, K+, Ca2+, Mg2+, NH4+, and NMe4+] interactions with the aromatic motifs of naturally occurring amino acids: A theoretical study. J Phys Chem A. 2005;109(39):8893–8903. doi: 10.1021/jp0525179. [DOI] [PubMed] [Google Scholar]
- 41.Veis A. A review of the early development of the thermodynamics of the complex coacervation phase separation. Adv Colloid Interface Sci. 2011;167(1–2):2–11. doi: 10.1016/j.cis.2011.01.007. [DOI] [PMC free article] [PubMed] [Google Scholar]
- 42.Tainaka K. Study of complex coacervation in low concentration by virial expansion method. I. Salt free systems. J Phys Soc Jpn. 1979;46(6):1899–1906. [Google Scholar]
- 43. Frisch MJ, et al. (2009) Gaussian09 R 02. Gaussian, Wallingford CT.
- 44.Israelachvili J, et al. Recent advances in the surface forces apparatus (SFA) technique. Rep Prog Phys. 2010;73(3):36601–36616. [Google Scholar]
- 45.Safran SA. Statistical Thermodynamics of Surfaces, Interfaces, and Membranes. Westview Press; Boulder, CO: 2003. [Google Scholar]
- 46.Hubbard J. Calculation of partition functions. Phys Rev Lett. 1959;3(2):77. [Google Scholar]
- 47.Dutta S, et al. 2015. Bundle formation in parallel aligned polymers with competing interactions. arXiv:1511.03795.
- 48. Kegel WK, van der Schoot Pv (2004) Competing hydrophobic and screened-coulomb interactions in hepatitis B virus capsid assembly. Biophys J 86(6):3905–3913. [DOI] [PMC free article] [PubMed]
- 49.Šiber A, Podgornik R. Role of electrostatic interactions in the assembly of empty spherical viral capsids. Phys Rev E Stat Nonlin Soft Matter Phys. 2007;76(6 Pt 1):061906. doi: 10.1103/PhysRevE.76.061906. [DOI] [PubMed] [Google Scholar]


