

Abstract
Motivation: Biological molecules perform their functions through interactions with other molecules. Structure alignment of interaction interfaces between biological complexes is an indispensable step in detecting their structural similarities, which are keys to understanding their evolutionary histories and functions. Although various structure alignment methods have been developed to successfully access the similarities of protein structures or certain types of interaction interfaces, existing alignment tools cannot directly align arbitrary types of interfaces formed by protein, DNA or RNA molecules. Specifically, they require a ‘blackbox preprocessing’ to standardize interface types and chain identifiers. Yet their performance is limited and sometimes unsatisfactory.
Results: Here we introduce a novel method, PROSTA-inter, that automatically determines and aligns interaction interfaces between two arbitrary types of complex structures. Our method uses sequentially remote fragments to search for the optimal superimposition. The optimal residue matching problem is then formulated as a maximum weighted bipartite matching problem to detect the optimal sequence order-independent alignment. Benchmark evaluation on all non-redundant protein–DNA complexes in PDB shows significant performance improvement of our method over TM-align and iAlign (with the ‘blackbox preprocessing’). Two case studies where our method discovers, for the first time, structural similarities between two pairs of functionally related protein–DNA complexes are presented. We further demonstrate the power of our method on detecting structural similarities between a protein–protein complex and a protein–RNA complex, which is biologically known as a protein–RNA mimicry case.
Availability and implementation: The PROSTA-inter web-server is publicly available at http://www.cbrc.kaust.edu.sa/prosta/.
Contact: xin.gao@kaust.edu.sa
1 Introduction
Structure alignment refers to the process of aligning two or more molecular structures based on their three-dimensional conformations. Due to the correlation between the structure and the function of molecules, structure alignment is an important step towards understanding the evolutionary histories and the functions of the molecules of interest, especially when only low sequence similarity exists between molecules (Teichmann et al., 1999). With recent experimental advances in solving complex structures composed of multiple molecules, different types of interaction interfaces have been extensively studied, including protein–protein interfaces (Alam et al., 2014; Chen et al., 2013; Mukherjee and Zhang, 2009; Pulim et al., 2008), protein–DNA interfaces (Siggers et al., 2005; Wang et al., 2014) and protein–RNA interfaces (Jones et al., 2001). Biological molecules perform their functions through interactions with other molecules. Therefore, pairwise alignment of individual molecules, without considering their interacting partners in biological complexes, may not capture the comprehensive structural similarities between two complexes.
Pairwise protein structure alignment, the most widely studied task of structure alignment (Hasegawa and Holm, 2009; Kolodny et al., 2005), has been addressed by a variety of methods (Holm and Sander, 1993; Krissinel and Henrick, 2004; Ortiz et al., 2002; Shindyalov and Bourne, 1998; Wang et al., 2013; Yang et al., 2012; Zemla, 2003; Zhang and Skolnick, 2005). One limitation shared among these methods is that the output alignment always obeys the sequence order of the input complex structures. However, the sequence order cannot be used safely in interface alignments because interfaces can contain amino acids/nucleotides that are sequentially remote (possibly from different chains) but structurally close to each other in the interaction interface. Although sequence order-independent pairwise protein structure alignment methods have also been developed and successfully applied in protein structure studies (Dundas et al., 2007; Xie and Bourne, 2008; Yuan and Bystroff, 2005), they are designed for optimizing the global alignment, instead of focusing on the interfaces of interests. Therefore, existing pairwise protein structure alignment methods are not suitable for studying structural similarities between interaction interfaces of complex structures.
Pairwise protein–protein interaction interface alignment methods were thus developed to tackle these problems. CMAPi (Pulim et al., 2008) determines the interaction interfaces in protein complex structures automatically, and then uses a two-dimensional dynamic programming algorithm to align the contact maps of the interfaces. However, because of using a dynamic programming algorithm, the alignment found by CMAPi obeys the sequence order within each chain. iAlign (Gao and Skolnick, 2010), a dedicated method that shares a similar idea with TM-align (Zhang and Skolnick, 2005) and fr-TM-align (Pandit and Skolnick, 2008), was developed to address this issue. It starts with three types of initial alignments, i.e. secondary structure alignments, gap-less threading alignments and fragment assembly alignments. An iterative dynamic programming algorithm is then applied as a refinement process. Unlike TM-align and fr-TM-align, iAlign uses a linear sum assignment solver to perform sequence order-independent alignments as an extra refinement process. The drawback of this approach is that the quality of the sequence order-independent alignment still depends on the quality of the sequential alignments from previous steps. Although iAlign accepts multiple chains as input, it treats interactions between different pairs of chains separately. Thus, it is not suitable for modeling (possibly multiple) interaction interfaces involving multiple chains.
Therefore, existing methods for pairwise interaction interface alignment share the following bottlenecks. First, none of them is generic enough to align interfaces formed by arbitrary types of complex structures. For instance, to study protein–RNA mimicry, one needs to align protein–protein interfaces with protein–RNA interfaces. The aforementioned methods require a ‘blackbox preprocessing’ to accept the input structure data. Moreover, the quality of the output alignment also depends on the chain order that is specified in the ‘blackbox preprocessing’ (see Sections 3 and 4 for details). Second, existing methods only model interactions involving two chains. Subsequently, this design decision lacks the capability of safely modeling protein–DNA interaction interfaces because the two DNA chains may take turns to interact with protein chains (Wu et al., 2010). Third, the sequence order-dependency is not completely removed in the interface alignment process. This introduces a potential risk to miss the optimal alignment when aligning interfaces that break the sequence order.
In this article, we introduce a novel method, called PROSTA-inter, that automatically determines and aligns the interaction interfaces between two arbitrary types of complex structures, e.g. protein–protein complexes, protein–DNA complexes and protein–RNA complexes. Our method employs sequentially remote fragments that potentially model remote interactions or structure topologies when searching for the optimal superimposition. Then, the optimal residue matching problem is formulated as the maximum weighted bipartite matching (MWBM) problem (Kuhn, 1955) to find the optimal sequence order-independent alignment. Unlike iAlign (Gao and Skolnick, 2010), the sequence order-dependency is removed from the beginning of the alignment process. Moreover, clustering is used to identify redundant alignments, and thus multiple non-redundant alignments are generated as output.
To demonstrate the performance of our interaction interface alignment method, we first compare our method with two state-of-the-art structure alignment methods, i.e. one sequence order-dependent method, TM-align (Zhang and Skolnick, 2005), and one sequence order-independent method, iAlign (Gao and Skolnick, 2010), on a benchmark set that consists of all the 312 non-redundant protein–DNA complexes in the Protein Data Bank (PDB). Our method outperforms both methods in different statistical evaluation criteria. Two case studies where our method, for the first time, identifies structural similarities between interfaces of two pairs of functionally related protein–DNA complexes are presented. We further show how our method detects the similarity between the interface of a protein–protein complex and that of a protein–RNA complex, which is biologically known as protein–RNA mimicry.
2 Methods
In this section, we introduce the PROSTA-inter method to determine and align the interaction interfaces between two arbitrary types of complex structures. Our method can be divided into two steps. In the first step, the interface residues are identified based on the distances between heavy atoms (Janin et al., 2008). In the second step, the interface residues are aligned so that scoring functions (Gao and Skolnick, 2010) specifically designed for interaction interface alignments can be optimized.
For each input complex structure that contains two components, we first identify the interface between the two components using a commonly used definition (Janin et al., 2008). Here, each component could be either a protein structure, a DNA structure or an RNA structure, and each structure could contain a single chain or multiple chains. If residues A and B are located in different components and at least one pair of the heavy atoms across the two residues is within , both residues A and B are determined as interface residues. Then, the atoms of the selected amino acids and the atoms of the selected nucleotides are used as representative atoms for the interface alignment step. A similar procedure is also used by iAlign (Gao and Skolnick, 2010).
The interface alignment method can be further divided into two iterative and interactive tasks: finding the optimal residue matching given the superimposition of interface residues, and finding the optimal superimposition between the matched residues. Here, the optimality is defined by a scoring function. In this study, we used either the iTM-score or the IS-score (Gao and Skolnick, 2010) to evaluate the quality of the superimposition and the residue matching:
where L0 is the number of interface residues, L is the number of matched residue pairs, di is the distance between the ith matched residue pair, d0 is a normalization distance that defines the distance threshold of similar residue pairs, fi is a contact overlap factor (see Gao and Skolnick, 2010) and .
It is worth mentioning that, by setting , both the iTM-score and the IS-score are independent from L0 and L (Gao and Skolnick, 2010). This is the desired feature inherited from the classic TM-score (Zhang and Skolnick, 2004). This is also the main advantage of the iTM-score and the IS-score over the classic root mean square deviation (RMSD). However, it can be seen that d0 is undefined for and d0 could be beyond the highest resolution of current structure determination methods. To address these problems, we suggest to use a minimal value of 1.0 for d0. Such d0 settings have no impact for (satisfied in most cases in our dataset). Defining a new scoring function is out of the scope of this study.
Given the iTM-score scoring function (Gao and Skolnick, 2010) and the superimposed interface residues, we need to find the optimal sequence order-independent residue matching that maximizes the scoring function. Here, we model the residue matching problem as the MWBM problem. In the bipartite graph, each vertex represents an interface residue, and each edge represents a matched residue pair. The weight of each edge is simply set to . In this case, it can be shown that the total weight of a bipartite graph matching equals to the iTM-score of the represented residue matching multiplied by L0, which can be considered as a constant during the residue matching process. This process can be easily modified to optimize the IS-score (Gao and Skolnick, 2010) and the details are omitted here. Given the weighted bipartite graph, we apply the Hungarian algorithm (Kuhn, 1955) to find the optimal sequence order-independent residue matching between the interfaces.
To find the optimal superimposition, the previously developed PROSTA method (Cui et al., 2013) is adopted and improved. In summary, the PROSTA method first samples the initial superimpositions by employing not only local fragments but also remote fragments; then clusters the superimpositions to select promising superimpositions; and finally refines each promising superimposition iteratively. One advantage of the PROSTA method is to employ similar remote fragments that potentially model remote interactions on the interface and the topology of the interface (as shown in Fig. 1). Another advantage of the PROSTA method is to use clustering to eliminate noise and select multiple non-redundant promising superimpositions for the refinement process. In this proposed method, the DBSCAN clustering algorithm (Ester et al., 1996) is instead used to replace the star-like clustering algorithm. By doing this, the new method is capable of finding arbitrarily shaped clusters.
Fig. 1.
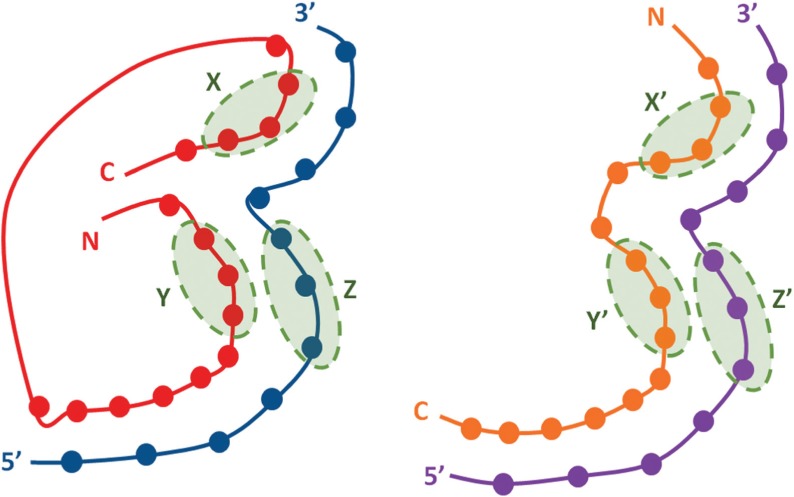
Demonstration of interaction interface alignment (red-blue versus orange-purple): (1) the optimal interface alignment does not obey the sequence order because Y is in front of X in the red chain but X’ is in front of Y’ in the orange chain; (2) remote fragments X and Y implicitly model the interface topology; by superimposing them to remote fragments X’ and Y’, the interface topology can be well aligned; (3) remote fragments Y and Z implicitly model the interactions on the interface; by superimposing them to remote fragments Y’ and Z’, most interactions on the interface can be well aligned
To sum up, our interaction interface alignment method works as following. Initially, the superimpositions are sampled and clustered to identify promising superimpositions. For each promising superimposition, the Hungarian algorithm (Kuhn, 1955) is used to find the optimal sequence order-independent residue pairs that maximize the iTM-score or the IS-score (Gao and Skolnick, 2010). Then, the highest scored alignment is selected from each cluster for an iterative refinement process. During each iteration, the superimposition is first refined while the residue matching remains fixed, and then the residue matching is recalculated. This process repeats iteratively until convergence. Finally, the top k interface alignments are kept as results and their scores are provided to the users. In this article, we set k = 1 for the purpose of fair comparison with other methods.
3 Benchmark on protein–DNA interaction interfaces
In this experiment, we evaluate the proposed method on finding similar interaction interfaces within a given dataset of protein–DNA complex structures. We compared our PROSTA-inter method with two widely used structure alignment methods, i.e. one sequence order-dependent method, TM-align (Zhang and Skolnick, 2005) and one sequence order-independent method, iAlign (Gao and Skolnick, 2010). All three methods were used to align the same interaction interface and to optimize the same alignment scoring function, i.e. iTM-score (Gao and Skolnick, 2010) or IS-score (Gao and Skolnick, 2010). By doing this, we focused on studying which method is more reliable in finding the optimal alignment instead of the performance of the interface definition and the scoring function. Recall that the iTM-scores and the IS-scores are independent from the number of interface residues/nucleotides, and thus a higher iTM-score/IS-score implies a higher quality alignment.
To our knowledge, there is no existing alignment tool that can align interaction interfaces containing both amino acids and nucleotides. Thus, a ‘blackbox preprocessing’ is required for TM-align (Zhang and Skolnick, 2005) and iAlign (Gao and Skolnick, 2010) as following. First, we precomputed the contact interfaces (as defined in Section 2), and removed the other residues/nucleotides from the complex structure. Then, we masked all nucleotide atom types as amino acid atom types and all nucleotide names as amino acid names. Since iAlign assumes that there are only two chains involved in the interface, all protein chains were masked as chain A and all DNA chains were masked as chain B. Moreover, the sequence numbers were masked in the order of atom appearance in the original PDB file.
To prepare the protein–DNA complex structure dataset, we downloaded all protein–DNA complex structures in PDB as of December 22, 2013. Then, the downloaded 2777 complex structures were filtered with a protein sequence identity cutoff of 25% and a resolution cutoff of . Moreover, to avoid the effects of inconsistent d0 (used for calculating the alignment scores), the complex structures involving <30 representative and atoms on the interaction interface were also removed. The final benchmark dataset thus contains 312 protein–DNA complex structures, and selected statistics and P-values (Zemla, 2003) of the benchmark dataset is provided in Figure 2 and Table 1. In summary, most protein–DNA interaction interfaces are small in terms of the number of residues and nucleotides, and the protein–DNA interaction interfaces are mainly formed by amino acid residues instead of nucleotides.
Fig. 2.

Statistics of the 312 protein–DNA interaction interfaces used in this experiment: (a) the average number of residues and nucleotides is 109; 25% of the interfaces contain 54 or less residues and nucleotides; 25% of the interfaces contain 131 or more residues and nucleotides; (b) the average log-ratio between residues and nucleotides is 1.42; only two interfaces have negative log-ratios; and 25% of the interfaces have log-ratios of 1.86 or higher
Table 1.
Probabilities to observe higher alignment scores (P-values) from the 312 protein–DNA interaction interfaces used in this experiment: the interaction interface pairs with iTM-scores >0.5 or IS-scores >0.4 are presumed to be similar because the P-values are <0.01 for such alignment scores; if the iTM-score or the IS-score of a similar interaction interface pair is improved by 0.1, the improvement should be considered significant because the P-values are reduced by a percentage between 36 and 83%
| 0.2 | 0.3 | 0.4 | 0.5 | 0.6 | 0.7 | 0.8 | 0.9 | |
|---|---|---|---|---|---|---|---|---|
| iTM-score | 0.967165 | 0.542522 | 0.117446 | 0.009955 | 0.001670 | 0.000742 | 0.000474 | 0.000165 |
| IS-score | 0.819853 | 0.132678 | 0.008121 | 0.001834 | 0.000886 | 0.000474 | 0.000206 | 0.000062 |
Before discussing the detailed results, we first demonstrate that it is challenging to improve the alignment scores calculated by the state-of-the-art methods, such as iAlign (Gao and Skolnick, 2010), and that our PROSTA-inter indeed achieves improvements. First, for each pair of similar protein structures in the dataset (please see Sections 3.1 and 3.2 for the definition of similarity), a simple superimposition sampling method (that optimizes the RMSD of six randomly sampled residue pairs) and the Needleman–Wunsch algorithm (Needleman and Wunsch, 1970) are called N times to randomly align the two protein structures. Here, , where L1 and L2 are the numbers of residues of the two protein structures to be aligned. Then, the probability of observing an alignment score that is at least ϵ-higher than that of iAlign is calculated as shown in Table 2. The results show that it is highly unlikely to improve the alignment scores by chance, while PROSTA-inter achieves significant improvements. Moreover, the paired t-test is performed on all pairs of protein structures in the dataset, and the results suggest that the alignment scores calculated by iAlign and PROSTA-inter are significantly different.
Table 2.
Probabilities of observing higher alignment scores and t-values of paired t-tests: ; SR is a random alignment score generated by a simple superimposition sampling method (see Section 3); is the optimal alignment score found by the simple superimposition sampling method (after at least 106 iterations); is the optimal alignment score found by PROSTA-inter; is the optimal alignment score found by iAlign; paired t-tests are performed on paired alignment scores ; and therefore, it is highly unlikely to improve the alignment scores by chance, while PROSTA-inter achieves significant improvements
| t-values | ||||
|---|---|---|---|---|
| iTM-score | 1.2% | 21.5% | −42.4 | |
| IS-score | 0.0% | 24.4% | −55.4 |
3.1 Overall performance on iTM-score
Using TM-align (Zhang and Skolnick, 2005), iAlign (Gao and Skolnick, 2010) and our method, we performed pairwise interaction interface alignments between each pair of the 312 protein–DNA complex structures of the dataset. In this experiment, all three methods are used to find the optimal interface alignment that maximizes the iTM-score (Gao and Skolnick, 2010). In order to optimize the iTM-score instead of the classic TM-score (Zhang and Skolnick, 2004), the C++ version of the TM-align is modified in this experiment. Since biologists tend to be more interested in the similar interfaces than the dissimilar ones, we focus on the 483 similar interaction interfaces in this study, which are defined as: for each pair of interfaces, the highest iTM-score among the three methods is presumed to be the optimal iTM-score, and the interface pairs with optimal iTM-scores >0.5 are presumed to be similar (see Table 1).
The iTM-scores (Gao and Skolnick, 2010) of the interaction interface alignments found by TM-align (Zhang and Skolnick, 2005) are compared with those found by our method in Figure 3a. On average, the iTM-scores are improved by 0.12 if our method is used instead of TM-align. For the highly similar cases found by TM-align (with iTM-scores >0.6), 9% of the iTM-scores found by our method are significantly higher (by at least 0.1, see Table 1). This indicates that even for highly similar interaction interfaces, sequential methods could miss the optimal alignment. Moreover, the missing rate increases significantly for the less similar cases found by TM-align (with iTM-scores <0.6). In such cases, 66% of the iTM-scores found by our method are significantly higher. As a result, TM-align misses 75% of the similar interface pairs, while our method misses 0.2% of the similar interface pairs. Therefore, classic structure alignment methods are not suitable for the interaction interface alignment problem even with the ‘blackbox preprocessing’ due to the strong sequence order-dependency.
Fig. 3.

Comparison of the iTM-scores found by TM-align, iAlign and PROSTA-inter (the dissimilar interaction interfaces and the similar interaction interfaces with iTM-score differences <0.01 are masked): from the 483 pairs of similar interfaces, the numbers of pairs with iTM-scores >0.5 found by TM-align, iAlign and PROSTA-inter are 123, 389 and 482, respectively; and therefore, when the iTM-score of 0.5 is used as the similarity threshold, PROSTA-inter is significantly more reliable to detect similar interfaces
Similarly, the iTM-scores (Gao and Skolnick, 2010) found by iAlign (Gao and Skolnick, 2010) are compared with those found by our method in Figure 3b. In general, the iTM-scores tended to increase or remained similar if our method is used instead of iAlign. Among the 483 pairs of similar interfaces, iAlign finds 389 pairs with iTM-scores >0.5, while our method finds 482 pairs with iTM-scores >0.5. This means that one can find 24% more similar interfaces if our method is used to optimize the iTM-score. For the similar interface pairs not found by iAlign, our method improves the iTM-scores by 0.03 on average and 0.13 in the best case. For the similar interface pairs found by iAlign (which should be considered to be hard to be improved), our method is capable of improving the iTM-scores by at least 0.01 for 9% of the cases. Interestingly, there is one case where the iTM-score found by iAlign is higher than 0.8, while our method still archives a considerable iTM-score improvement. These observations demonstrate that although the initial sequential alignments and the dynamic programming algorithm could be used to speed up the alignment process (as iAlign does in the first two phases), they also increase the probability of missing the optimal alignment.
To demonstrate the importance of using remote fragments and the MWBM algorithm (Kuhn, 1955) to avoid the sequence order-dependency in the initial alignment process, we repeated the interaction interface alignments with different initial alignment processes. We first compared our method using only remote fragments with that using only local fragments in Figure 4a. Consistent with previous observations (Cui et al., 2013), both remote fragments and local fragments have contributions on finding the optimal alignment. However, for interface alignments with iTM-scores (Gao and Skolnick, 2010) <0.7, remote fragments are more likely to yield the optimal alignment than local fragments are. In such cases, 8% of the iTM-scores are improved by at least 0.01 and the iTM-score is improved by 0.27 in the best case if remote fragments are used instead of local fragments.
Fig. 4.

Comparison of the iTM-scores found by our method with different initial alignment processes (the dissimilar interaction interfaces and the similar interaction interfaces with iTM-score differences <0.01 are masked): from the 483 pairs of similar interfaces, (a) there are 34 cases where the iTM-scores are considerably higher if remote fragments are used instead of local fragments; (b) there are 34 cases where the iTM-scores are considerably higher if the weighted bipartite matching algorithm is used instead of the NWDP algorithm; and therefore, incorporating remote fragments and the sequence order-independent alignments in the initial alignment process plays an important role in finding the optimal interaction interface alignments
We also compared the interaction interface alignments with different initial alignment processes incorporating the sequence order-independent MWBM algorithm (Kuhn, 1955) and the sequential Needleman–Wunsch dynamic programming (NWDP) algorithm (Needleman and Wunsch, 1970) (as iAlign does in the first two phases) in Figure 4b. Either way, both local and remote fragments are used in the initial alignment process, and the MWBM algorithm is used in the refinement process (as iAlign does in the third phase). It can be seen that, for interface alignments with iTM-scores (Gao and Skolnick, 2010) <0.6, the MWBM algorithm is more likely to improve the iTM-scores over the NWDP algorithm. Specifically, 8% of the iTM-scores are improved by at least 0.01 and the iTM-score is improved by 0.09 in the best case if the MWBM algorithm is used instead of the NWDP algorithm in the initial alignment process.
In summary, we demonstrated the importance of the alignment searching algorithm. By using our PROSTA-inter alignment searching algorithm to optimize the iTM-score (Gao and Skolnick, 2010), the interaction interface alignment quality could be improved significantly over the existing methods, TM-align (Zhang and Skolnick, 2005) and iAlign (Gao and Skolnick, 2010). Incorporating remote fragments and the sequence order-independent alignments in the initial alignment process is the key to the success of our method.
3.2 Overall performance on IS-score
In addition to the iTM-score (Gao and Skolnick, 2010), we also used the IS-score (Gao and Skolnick, 2010) to perform another performance analysis, and the observations are consistent with our analysis in Section 3.1. TM-align was not designed to optimize the IS-score of sequence order-independent alignment, and thus for fair comparison, we did not compare with TM-align in this experiment. Specifically, using iAlign (Gao and Skolnick, 2010) and PROSTA-inter, we performed pairwise interaction interface alignments between each pair of the 312 protein–DNA complex structures of the dataset. Again, only the 394 pairs of similar interfaces are included in this analysis as they are biologically relevant. Here, for each interface pair, the highest IS-score calculated by the two methods is presumed to be the optimal IS-score, and the interface pairs with optimal IS-scores >0.4 are presumed to be similar (see Table 1).
The IS-scores (Gao and Skolnick, 2010) of the interface alignments found by iAlign (Gao and Skolnick, 2010) are compared with those found by our method in Figure 5a. Among the 394 pairs of similar interfaces, our method finds 390 interface pairs with IS-scores >0.4, and iAlign finds 315 interface pairs with IS-scores >0.4. Again, 24% more similar interfaces are found if our method is used instead of iAlign. Specifically, there are 96 cases where the IS-scores are improved by at least 0.01 if our method is used, and there are three cases where the IS-scores are improved by at least 0.01 if iAlign is used. In the best case, the IS-score is 0.11 higher if our method is used. Therefore, our method outperforms iAlign for the task of finding the optimal interaction interface alignment with the highest IS-score.
Fig. 5.

Comparison of the IS-scores found by iAlign, our default method and our method with different initial alignment processes (the dissimilar interaction interfaces and the similar interaction interfaces with IS-score differences <0.01 are masked): from the 394 pairs of similar interfaces, (a) the numbers of pairs with IS-scores >0.4 found by iAlign and PROSTA-inter are 315 and 390, respectively; (b) there are 30 cases where the IS-scores are considerably higher if remote fragments are used and six cases where the IS-scores are considerably higher if local fragments are used; and (c) there are 33 cases where the IS-scores are considerably higher if the weighted bipartite matching algorithm is used and just one case where the IS-score is considerably higher if the NWDP algorithm is used
We also repeated the interaction interface alignments with different initial alignment processes as shown in Figure 5b and c. Specifically, there are 30 cases where the IS-scores (Gao and Skolnick, 2010) are at least 0.01 higher if remote fragments are used instead of local fragments, and there are 33 cases where the IS-scores are at least 0.01 higher if the weighted bipartite matching algorithm (Kuhn, 1955) is used instead of the NWDP algorithm (Needleman and Wunsch, 1970). Therefore, incorporating remote fragments and the sequence order-independent alignments in the initial alignment process plays an important role in finding the optimal interaction interface alignments.
3.3 Two case studies
We investigated the cases where our method can identify structural similarity between the protein–DNA interfaces significantly better than iAlign. Here, we present two such cases. Interestingly, the two cases also demonstrate that our method is capable of detecting functionally related interaction interfaces that are very challenging for the other methods.
The first case study is the protein–DNA interface alignment between PDB IDs 3IKT and 1JKO, where IS-score of the alignment generated by our method and iAlign is 0.42 and 0.30, respectively. 3IKT contains the redox-sensing transcriptional repressor rex protein (McLaughlin et al., 2010). The rex protein senses NADH levels and fine-tunes gene expression in response to fluctuations in the NADH:NAD+ratio in the cell via the DNA-binding influences of NADH or NAD+ interactions (McLaughlin et al., 2010). The rex family contains a ‘winged helix’ that usually binds to the ‘TGTGAA’ DNA sequence and a rossman fold that binds NAD(H) cofactors (McLaughlin et al., 2010). 1JKO contains the DNA-invertase hin protein (Chiu et al., 2002). Hin protein is a member of an extended family of serine recombinases, which catalyzes a site-specific DNA inversion of the 1 kb DNA segment between the hixL and hixR recombination sites within the chromosome of Salmonella typhimurium (Silverman et al., 1981). This switches the orientation of a promoter responsible for the alternate synthesis of two different flagellins. The DNA-binding domain of Hin is arranged in a compact ‘helix-turn-helix’ motif that binds the major grove of the DNA. Enhanced specificity and affinity are achieved by the binding of the N-terminal segment of the Hin peptide into the minor groove (Chiu et al., 2002). Both ‘winged helix’ and ‘helix-turn-helix’ play important roles in selective DNA recognition. A simple cocitation analysis of the two terms by CoCiter v2.0 (Qiao et al., 2013) results in 47 publications in PubMed.
No global similarity between the 3IKT and the 1JKO pair can be found. Our method, for the first time, directly identifies the structural similarity between the protein–DNA interfaces of the DNA-binding domains of rex and hin protein, resulting an alignment with IS-score of 0.42 (Fig. 6a). Our results suggest that even though the structures of DNA-binding domains of rex and hin vary significantly from one another, their DNA interaction interfaces formed by the ‘winged helix’ and the ‘helix-turn-helix’ motif are quite similar. Our method is able to align the ‘winged helix’ in rex protein and the ‘helix-turn-helix’ motif in the hin protein, suggesting that the DNA binding interactions are conserved in both these complexes therefore resulting in similar selective DNA recognition. Both iAlign and TM-align fail to align these motifs (Fig. 6b and c).
Fig. 6.

Structure alignment of protein–DNA interaction interfaces in 3IKT (the Rex–DNA complex, as shown in blue) and 1JKO (the Hin–DNA complex, as shown in red): (a) the interface alignment by PROSTA-inter results in an IS-score of 0.42 and 92 shared interface contacts; (b) the interface alignment by iAlign results in an IS-score of 0.30 and 31 shared interface contacts (the same interface definition is used for PROSTA-inter and iAlign); (c) the protein structure alignment by TM-align shows no global structural similarity. Even though the orientation of the helix in the alignment produced by PROSTA-inter is slightly different, majority (24) of the contacts between the helix and the DNA are still the same. Therefore, PROSTA-inter successfully aligns the ‘winged helix’ in rex protein and the ‘helix-turn-helix’ motif in the hin protein (as shown in the green circle), and this suggests that the DNA binding interactions are conserved in both proteins resulting in similar functions
The second case study is the protein–DNA interface alignment between PDB IDs 3OH9 and 2BZF. 3OH9 consists of DNA glycosylase AlkA protein, belonging to the class of BER enzymes that repairs a highly diverse array of nucleoside lesions (Bowman et al., 2010). AlkA can recognize N3- and N7-methylguanine, -adenine and O2-methylpyrimidines, cyclic nucleobases, electron-deficient nucleobases and undamaged nucleobases that are in mismatched base pairs (Bjelland et al., 1993, 1994; O’Brien and Ellenberger, 2004; Saparbaev and Laval, 1994; Saparbaev et al., 1995). AlkA interacts with the DNA in a non-specific manner via the interactions between the helix–hairpin–helix (HhH) motif and the phosphate backbone (Bowman et al., 2010). 2BZF consists of barrier-to-autointegration factor (BAF) protein. It is shown to be involved in DNA repair, chromosomal organization, nuclear assembly and gene expression (6) (Bradley et al., 2005). BAF forms an obligatory dimer, each monomer containing two copies of HhH motif that interacts with the DNA in a non-specific manner as well (Doherty et al., 1996).
No global structural similarity has been discovered between the AlkA and BAF proteins, although they contain similar structural motif (HhH). However, the interface alignment generated by our method has an IS-score of 0.4, which is significantly higher than the IS-score of 0.31 calculated on the alignment generated by iAlign. This suggests considerable overlap of the interaction interfaces (Fig. 7a). Both iAlign and TM-align are unable to align this functionally important motif in the interaction interface (Fig. 7b and c). This structural similarity is also supported by the fact that both proteins interact with the DNA in a non-specific manner and both have reported roles in DNA repair.
Fig. 7.

Structure alignment of protein–DNA interaction interfaces in 3OH9 (the AlkA–DNA complex, as shown in blue) and 2BZF (the BAF–DNA complex, as shown in red): (a) the interface alignment by PROSTA-inter results in an IS-score of 0.4 and 58 conserved interface contacts; (b) the interface alignment by iAlign results in an IS-score of 0.31 and 27 conserved interface contacts (the same interface definition is used for PROSTA-inter and iAlign); (c) the protein structure alignment by TM-align shows no global structural similarity. Specifically, PROSTA-inter successfully identifies the similar HhH motifs, while iAlign is biased toward the DNA strand alignment. Therefore, PROSTA-inter successfully aligns the HhH motif in DNA-binding interfaces of AlkA and BAF proteins (as shown in the green circle), and this suggests that the DNA binding interactions are conserved in both proteins resulting in similar functions
4 Structure alignment of protein–RNA mimicry
Molecular mimicry refers to the process that a molecule evolves to resemble another molecule in terms of the structure, and thus also mimics the function (Liang and Landweber, 2005; Pasteur, 1982). For example, translation initiation factor 2A (eIF2A) is mimicked by K3L from poxviruses (Katz et al., 2014). The latter inhibits the phosphorylation of the former on double-stranded RNA-dependent protein kinase, and thus increases viral production. Two small non-coding RNAs, CrcY and CrcZ, were found to mimic mRNAs in Pseudomonas putida to inhibit the activity of the master post-transcriptional regulatory protein Crc (Marzi and Romby, 2012; Moreno et al., 2012).
The structure-driven mimicry is not restricted to molecules of the same type. Elongation factor P (EF-P), a prokaryotic protein translation factor, is known to mimic tRNA to enable the synthesis of peptides (Tsonis and Dwivedi, 2008). EF-P binds to PoxA, a protein paralog of the catalytic domain of lysyl-tRNA synthetase, to perform post-translational modification. A recent study reveals the structural and evolutionary mimicry of EF-P on tRNA (Katz et al., 2014). They studied the structural similarity between the EF-P/PoxA complex (PDB ID 3A5Z, Fig. 8b) and the tRNA/AspRS complex (PDB ID 1ASY, Fig. 8a), where AspRS is the aspartyl-tRNA synthetase. 1ASY has two interaction interfaces between tRNA and the two domains of AspRS, as shown in Figure 8a.
Fig. 8.

Structure alignment of protein–RNA mimicry: (a) 1ASY (the tRNA/AspRS complex) contains two protein–RNA interfaces (one on the left side and one on the right side); the right-side interface of 1ASY has a key (the yellow RNA strand) inserted into a lock (the green pocket including a beta sheet); (b) 3A5Z (the EF-P/PoxA complex) also has a key (the purple loop region) inserted into a lock (the cyan pocket including a beta sheet); (c) the interface alignment by PROSTA-inter successfully aligns the key-lock like structural motifs between the right-side interface of 1ASY and the interface of 3A5Z; (d) the interface alignment by iAlign aligns the left-side interface of 1ASY and the interface of 3A5Z, and neither the keys nor the locks show sufficient similarities. The alignment generated by PROSTA-inter contains 26 shared interface contacts as compared to the 21 in the alignment generated by iAlign
When aligning the interaction interfaces formed by different types of molecules, existing interface alignment tools have several limitations. In addition to the problems demonstrated in the previous experiment, it is challenging to design scoring functions to align nucleotides with amino acids due to the significantly different geometries. Specifically, the distance between the atoms of two consecutive nucleotides is different from that between the C atoms of two consecutive amino acids. Thus, although the protein-binding pocket and the RNA-binding pocket might look similar in shape, the alignment score for the overlapped region may not be favored (i.e. <0.4).
Here, our method is able to align the protein–protein interface of the EF-P/PoxA complex with the correct protein–RNA interface of the tRNA/AspRS complex with an IS-score of 0.21 (Fig. 8c) as compared with iAlign that aligns it with the incorrect protein–RNA interface with an IS-score of 0.16 (Fig. 8d). The relatively low IS-score (<0.4) is due to the imperfection of the scoring function. Specifically, when aligning a protein chain to an RNA strand, there is no one-to-one relationship between the residues and the nucleotides, but current alignment scoring functions are defined based on such one-to-one relationships. In spite of the fact that the scoring function is not suited to handle this task, PROSTA-inter still manages to do a reasonable job. The protein–protein interaction interface in EF-P/PoxA complex and the protein–RNA interface in the tRNA/AspRS complex shares a key-lock like structural motif. Although the RNA structure of 1ASY cannot be well aligned to the loop region of 3A5Z, the key structures share a similar trace as there are 26 shared interface contacts in the alignment generated by PROSTA-inter. This demonstrates the power and applications of PROSTA-inter which cannot be achieved by the existing methods. This also shows the need for a more robust and generic scoring function to evaluate alignments between biological complexes composed of different types of molecules.
5 Conclusion
In this article, we propose a novel structure alignment method, PROSTA-inter, for aligning interaction interfaces formed by protein, DNA or RNA molecules. Our method naturally handles multiple types of interfaces, multiple chains and multiple interfaces in complexes. After employing remote fragments and the MWBM algorithm (Kuhn, 1955), statistical benchmark evaluation on protein–DNA complex dataset demonstrates significant improvements over state-of-the-art alignment methods. Moreover, unreported interface similarities in two pairs of protein–DNA complexes are discovered. We finally illustrate the generic nature of our method through a protein–RNA mimicry study. We are currently developing new scoring functions and applying our method to discover structural relevance of different types of interaction interfaces.
Funding
The research reported in this publication was supported by competitive research funding from King Abdullah University of Science and Technology (KAUST).
Conflict of Interest: none declared.
References
- Alam T., et al. (2014) How to find a leucine in a haystack? Structure, ligand recognition and regulation of leucine-aspartic acid (LD) motifs. Biochem. J. , 460, 317–329. [DOI] [PubMed] [Google Scholar]
- Bjelland S., et al. (1993) Excision of 3-methylguanine from alkylated DNA by 3-methyladenine DNA glycosylase i of Escherichia coli. Nucleic Acids Res. , 21, 2045–2049. [DOI] [PMC free article] [PubMed] [Google Scholar]
- Bjelland S., et al. (1994) DNA glycosylase activities for thymine residues oxidized in the methyl group are functions of the alka enzyme in Escherichia coli. J. Biol. Chem. , 269, 30489–30495. [PubMed] [Google Scholar]
- Bowman B., et al. (2010) Structure of Escherichia coli alka in complex with undamaged DNA. J. Biol. Chem. , 285, 35783–35791. [DOI] [PMC free article] [PubMed] [Google Scholar]
- Bradley C., et al. (2005) Structural basis for DNA bridging by barrier-to-autointegration factor. Nat. Struct. Mol. Biol. , 12, 935–936. [DOI] [PubMed] [Google Scholar]
- Chen P., et al. (2013) Accurate prediction of hot spot residues through physicochemical characteristics of amino acid sequences. Proteins , 81, 1351–1362. [DOI] [PubMed] [Google Scholar]
- Chiu T., et al. (2002) Testing water-mediated DNA recognition by the hin recombinase. EMBO J. , 21, 801–814. [DOI] [PMC free article] [PubMed] [Google Scholar]
- Cui X., et al. (2013) Towards reliable automatic protein structure alignment. In WABI , pp. 18–32. [Google Scholar]
- Doherty A., et al. (1996) The helix-hairpin-helix DNA-binding motif: a structural basis for non-sequence-specific recognition of DNA. Nucleic Acids Res. , 24, 2488–2497. [DOI] [PMC free article] [PubMed] [Google Scholar]
- Dundas J., et al. (2007) Topology independent protein structural alignment. BMC Bioinformatics , 8, 388. [DOI] [PMC free article] [PubMed] [Google Scholar]
- Ester M., et al. (1996) A density-based algorithm for discovering clusters in large spatial databases with noise. In: Simoudis E., et al. (eds) Proceedings of the Second International Conference on Knowledge Discovery and Data Mining (KDD-96). AAAI Press, pp. 226–231. [Google Scholar]
- Gao M., Skolnick J. (2010) iAlign: a method for the structural comparison of protein–protein interfaces. Bioinformatics , 26, 2259–2265. [DOI] [PMC free article] [PubMed] [Google Scholar]
- Hasegawa H., Holm L. (2009) Advances and pitfalls of protein structural alignment. Curr. Opin. Struct. Biol. , 19, 341–348. [DOI] [PubMed] [Google Scholar]
- Holm L., Sander C. (1993) Protein structure comparison by alignment of distance matrices. J. Mol. Biol. , 233, 123–138. [DOI] [PubMed] [Google Scholar]
- Janin J., et al. (2008) Protein–protein interaction and quaternary structure. Q. Rev. Biophys. , 41, 133–180. [DOI] [PubMed] [Google Scholar]
- Jones S., et al. (2001) Protein–RNA interactions: a structural analysis. Nucleic Acids Res. , 29, 943–954. [DOI] [PMC free article] [PubMed] [Google Scholar]
- Katz A., et al. (2014) Molecular evolution of protein–RNA mimicry as a mechanism for translational control. Nucleic Acids Res. , 42, 3261–3271. [DOI] [PMC free article] [PubMed] [Google Scholar]
- Kolodny R., et al. (2005) Comprehensive evaluation of protein structure alignment methods: scoring by geometric measures. J. Mol. Biol. , 346, 1173–1188. [DOI] [PMC free article] [PubMed] [Google Scholar]
- Krissinel E., Henrick K. (2004) Secondary-structure matching (ssm), a new tool for fast protein structure alignment in three dimensions. Acta Crystallogr. D Biol. Crystallogr. , 60, 2256–2268. [DOI] [PubMed] [Google Scholar]
- Kuhn H.W. (1955) The Hungarian method for the assignment problem. Naval Res. Logistics Q. , 2, 83–97. [Google Scholar]
- Liang H., Landweber L.F. (2005) Molecular mimicry: quantitative methods to study structural similarity between protein and RNA. RNA , 11, 1167–1172. [DOI] [PMC free article] [PubMed] [Google Scholar]
- Marzi S., Romby P. (2012) RNA mimicry, a decoy for regulatory proteins. Mol. Microbiol. , 83, 1–6. [DOI] [PubMed] [Google Scholar]
- McLaughlin K., et al. (2010) Structural basis for NADH/NAD+ redox sensing by a rex family repressor. Mol. Cell. , 38, 563–575. [DOI] [PubMed] [Google Scholar]
- Moreno R., et al. (2012) Two small RNAs, CrcY and CrcZ, act in concert to sequester the Crc global regulator in Pseudomonas putida, modulating catabolite repression. Mol. Microbiol. , 83, 24–40. [DOI] [PubMed] [Google Scholar]
- Mukherjee S., Zhang Y. (2009) MM-align: a quick algorithm for aligning multiple-chain protein complex structures using iterative dynamic programming. Nucleic Acids Res. , 37, e83. [DOI] [PMC free article] [PubMed] [Google Scholar]
- Needleman S.B., Wunsch C.D. (1970) A general method applicable to the search for similarities in the amino acid sequence of two proteins. J. Mol. Biol. , 48, 443–453. [DOI] [PubMed] [Google Scholar]
- O’Brien P., Ellenberger T. (2004) Dissecting the broad substrate specificity of human 3-methyladenine-DNA glycosylase. J. Biol. Chem. , 279, 9750–9757. [DOI] [PubMed] [Google Scholar]
- Ortiz A.R., et al. (2002) Mammoth (matching molecular models obtained from theory): an automated method for model comparison. Protein Sci. , 11, 2606–2621. [DOI] [PMC free article] [PubMed] [Google Scholar]
- Pandit S.B., Skolnick J. (2008) Fr-TM-align: a new protein structural alignment method based on fragment alignments and the TM-score. BMC Bioinformatics , 9, 531. [DOI] [PMC free article] [PubMed] [Google Scholar]
- Pasteur G. (1982) A classificatory review of mimicry systems. Annu. Rev. Ecol. Syst., 13, 169–199. [Google Scholar]
- Pulim V., et al. (2008) Optimal contact map alignment of protein–protein interfaces. Bioinformatics , 24, 2324–2328. [DOI] [PMC free article] [PubMed] [Google Scholar]
- Qiao N., et al. (2013) Cociter: an efficient tool to infer gene function by assessing the significance of literature co-citation. PLoS One , 8, e74074. [DOI] [PMC free article] [PubMed] [Google Scholar]
- Saparbaev M., Laval J. (1994) Excision of hypoxanthine from DNA containing dIMP residues by the Escherichia coli, yeast, rat, and human alkylpurine DNA glycosylases. Proc. Natl Acad. Sci. USA , 91, 5873–5877. [DOI] [PMC free article] [PubMed] [Google Scholar]
- Saparbaev M., et al. (1995) Escherichia coli, Saccharomyces cerevisiae, rat and human 3-methyladenine DNA glycosylases repair 1,n6-ethenoadenine when present in DNA. Nucleic Acids Res. , 23, 3750–3755. [DOI] [PMC free article] [PubMed] [Google Scholar]
- Shindyalov I.N., Bourne P.E. (1998) Protein structure alignment by incremental combinatorial extension (CE) of the optimal path. Protein Eng. , 11, 739–747. [DOI] [PubMed] [Google Scholar]
- Siggers T.W., et al. (2005) Structural alignment of protein–DNA interfaces: insights into the determinants of binding specificity. J. Mol. Biol. , 345, 1027–1045. [DOI] [PubMed] [Google Scholar]
- Silverman M., et al. (1981) Analysis of the functional components of the phase variation system. Cold Spring Harb. Symp. Quant. Biol. , 45(Pt 1), 17–26. [DOI] [PubMed] [Google Scholar]
- Teichmann S.A., et al. (1999) Advances in structural genomics. Curr. Opin. Struct. Biol. , 9, 390–399. [DOI] [PubMed] [Google Scholar]
- Tsonis P.A., Dwivedi B. (2008) Molecular mimicry: structural camouflage of proteins and nucleic acids. Biochim. Biophys. Acta , 1783, 177–187. [DOI] [PubMed] [Google Scholar]
- Wang S., et al. (2013) Protein structure alignment beyond spatial proximity. Sci. Rep. , 3, 1–7. [DOI] [PMC free article] [PubMed] [Google Scholar]
- Wang X., et al. (2014) Modeling DNA affinity landscape through two-round support vector regression with weighted degree kernels. BMC Syst. Biol. , 8(Suppl 5), S5. [DOI] [PMC free article] [PubMed] [Google Scholar]
- Wu B., et al. (2010) Structural insight into the sequence dependence of nucleosome positioning. Structure , 18, 528–536. [DOI] [PubMed] [Google Scholar]
- Xie L., Bourne P.E. (2008) Detecting evolutionary relationships across existing fold space, using sequence order-independent profile–profile alignments. Proc. Natl Acad. Sci. USA , 105, 5441–5446. [DOI] [PMC free article] [PubMed] [Google Scholar]
- Yang Y., et al. (2012) A new size-independent score for pairwise protein structure alignment and its application to structure classification and nucleic-acid binding prediction. Proteins , 80, 2080–2088. [DOI] [PMC free article] [PubMed] [Google Scholar]
- Yuan X., Bystroff C. (2005) Non-sequential structure-based alignments reveal topology-independent core packing arrangements in proteins. Bioinformatics , 21, 1010–1019. [DOI] [PubMed] [Google Scholar]
- Zemla A. (2003) LGA: a method for finding 3D similarities in protein structures. Nucleic Acids Res. , 31, 3370–3374. [DOI] [PMC free article] [PubMed] [Google Scholar]
- Zhang Y., Skolnick J. (2004) Scoring function for automated assessment of protein structure template quality. Proteins , 57, 702–710. [DOI] [PubMed] [Google Scholar]
- Zhang Y., Skolnick J. (2005) TM-align: a protein structure alignment algorithm based on the TM-score. Nucleic Acids Res. , 33, 2302–2309. [DOI] [PMC free article] [PubMed] [Google Scholar]