Abstract
BACKGROUND & AIMS
Obesity and alcohol consumption contribute to steatohepatitis, which increases risk for hepatitis C virus (HCV)-associated hepatocellular carcinomas (HCCs). Mice Hepatocytes that express HCV-NS5A in liver upregulate expression of Toll-like receptor-4 (TLR4), and develop liver tumors containing tumor-initiating stem-like cells (TICs) that express NANOG. We investigated whether the TLR4 signals to NANOG to promote development of TICs and tumorigenesis in mice placed on Western diet high in cholesterol and saturated fat (HCFD).
METHODS
We expressed HCV-NS5A from a transgene (NS5A Tg) in Tlr4−/− (C57Bl6/10ScN), and wild type control mice. Mice were fed a HCFD for 12 months. TICs were identified and isolated based on being CD133+, CD49f+, and CD45-. We obtained 142 paraffin-embedded sections of different stage HCCs and adjacent non-tumor areas from the same patients, and performed gene expression, immunofluorescence, and immunohistochemical analyses.
RESULTS
A higher proportion of NS5A Tg mice developed liver tumors (39%) than mice that did not express HCV NS5A following the HCFD (6%); only 9% of Tlr4−/− NS5A Tg mice fed HCFD developed liver tumors. Livers from NS5A Tg mice fed the HCFD had increased levels of TLR4, NANOG, pSTAT3, and TWIST1 proteins, and increases in Tlr4, Nanog, Stat3, and Twist1 mRNAs. In TICs from NS5A Tg mice. NANOG and pSTAT3 directly interacts to activate expression of Twist1. Levels of TLR4, NANOG, pSTAT3, and TWIST were increased in HCC compared with non-tumor tissues from patients.
CONCLUSIONS
HCFD and HCV-NS5A together stimulated TLR4-NANOG and the OB-R-pSTAT3 signaling pathways resulting in liver tumorigenesis through an exaggerated mesenchymal phenotype with prominent Twist1-expressing TICs.
Keywords: HCC, HCV, obesity, NASH
Introduction
Obesity and infection by HCV are pathophysiologically connected to hepatocarcinogenesis.1–5 The risk for HCC increases from 8.6-fold to 47.8-fold as a result of concomitant obesity in HCV infected patients.4 Obesity induced by a high cholesterol high-fat diet (HCFD) is associated with elevated levels of serum bacterial endotoxin derived from the hepatic portal and/or the systemic gut; these elevated levels stimulate expression of proinflammatory cytokines in the liver and adipose tissues subsequently leading to liver injury.5–7 Such HCFD mediated changes superimposed upon HCV infection lead to an increased incidence of overt diabetes,8 potentially establishing a self-reinforcing oncogenic cycle.
HCC, the fifth most common cancer in the world and the third leading cause of cancer mortality has a low five-year survival rate due to a lack of effective therapeutic options.9, 10 An understanding of the molecular mechanisms of hepatocarcinogenesis will be required for the development of improved therapeutic models for this disease. The HCV-NS5A protein, a major target of therapeutic efforts, suppresses activity of interferon-induced, double-stranded RNA-activated protein kinase PKR,11 accounting for the resistance of most HCV strains to interferon treatment. Furthermore, NS5A trans-activates many gene promoters.12 We recently demonstrated that HCV infection and associated expression of the NS5A protein lead to excessive TNFα production, fulminant hepatitis, and a six-fold increase in mortality in response to Gram negative bacterial derived lipopolysaccharide (LPS) ligand.13 These effects are mediated through increased expression of the innate immune receptor TLR4, a transmembrane receptor that activates NF-κB and induces a proinflammatory and tumorigenic gene expression program in HCV-infected livers. Likewise, increased TLR4 signaling in NS5A positive hepatocytes following chronic and excessive alcohol consumption promotes the expansion of highly malignant, CD133+/CD49f+/Nanog+ liver tumor-initiating stem-like cells (TICs) in alcohol-associated hepatocarcinogenesis.14 Nevertheless, the significance of TLR4 in hepatocarcinogenesis associated with obesity and HCV infection and the role of proteins involved in the metastatic properties of TICs has not been directly addressed.
Long-term consumption of a HCFD elevates levels of gut-derived bacterial endotoxin in the plasma.15 We previously demonstrated increased expression of TLR4 (a receptor for endotoxin) in hepatocytes of NS5A-Tg mice.14 Based on these findings, we postulated that synergism between HCV and obesity in liver disease progression involved TLR4-dependent signaling. We also reasoned that the TLR4-NANOG pathway might play a major role in mediating the synergism between obesity and HCV in the pathogenesis of HCC via generation of CD133+/Nanog+ TICs. Our RNA microarray analysis on TICs derived from HCFD fed mice showed a significant increase in Twist1. We previously demonstrated that Leptin and its receptor (OB-R) augmented pSTAT3 in TICs16, these results led us to hypothesize that adipose tissue-derived leptin-pSTAT3 and TLR4-NANOG signals are needed for activation of Twist1 in TICs. Here, we provide evidence that TLR4 drives oncogenesis in part through the transcriptional induction of Twist1, a master regulator of epithelial mesenchymal transition (EMT),17–19 to generate cells with stem-like properties and a predisposition to the EMT. This signaling module therefore represents a new candidate target in the treatment of obesity- and HCV-associated HCC.
Materials and Methods
Additional details are described in Supplementary Information (Suppl. Methods and Suppl. Tables 3–6).
Mouse studies
All experiments on mice were approved by the USC Institutional Animal Care and Use Committee. Transgenic mice expressing the HCV-NS5A gene under control of the ApoE promoter20, 21 were obtained from Prof. Ratna Ray (Saint Louis University, St. Louis, MO). TLR4-deficient mice (C57Bl6/10ScN), control mice (C57Bl6/10ScSn) and C57Bl/6 mice were purchased from Jackson Laboratories. To generate WT, NS5A, Tlr4−/−, and Tlr4−/− NS5A mice on a more congenic genetic background, NS5A Tg (FVB strain) and Tlr4−/− mice were crossbred on a C57BL/6 background (Jackson Laboratories) more than 8 generations at USC. Littermates on mixed C57BL/6-NS5A transgenic and Tlr4−/− mice (Jackson Labs) were intercrossed at least eight generations to produce WT, NS5A, Tlr4−/−, and Tlr4−/−NS5A mice on a more congenic genetic background. Both genders of mice were used for experiments. High-cholesterol high-fat diet was modified from TD.03350 (Harkan Teklad; Inc.) as previously described22, 23, where indicated mice were fed ad lib with an ethanol-containing Lieber-DeCarli diet containing 3.5% ethanol or isocaloric dextrin (Bioserv, Frenchtown, NJ) high in cholesterol and saturated fat (HCFD) beginning at eight weeks of age for a period of 12 months. Other mice were fed modified high fat AIN-93G purified ethanol liquid diet with anhydrous milkfat, lard, corn oil and 1% cholesterol (DYET#710362: DYETS, Inc.) or Lieber-DeCarli Regular Control Diet (DYET# 710027).
Human subjects
Paraffin embedded tissue sections were obtained in accordance with the approved Institutional Review Board (IRB). There were three institutions [University of Southern California, University of California at Los Angeles (UCLA) and University of Minnesota] that gave Institutional Review Board (IRB) approval for the supplied specimens. Specimens were obtained from the Liver Tissue Cell Distribution System (LTCDS) at the University of Minnesota according to the following criteria: surgically excised HCC tissues from 8 patients +/− HCV infection, +/− history of alcoholism, +/− obesity/diabetes/BMI>30. Eighteen specimens were also obtained from the Hepatobiliary and Liver Transplantation Service at the USC Keck School of Medicine. One hundred sixteen cases of HCC were identified from 2002–2011 by searching the UCLA Department of Pathology database using the following search terms: liver, hepatocellular carcinoma, resection, and transplant. All patient identifiers were removed to protect confidentiality. Samples were obtained from both genders between the ages of 42 and 80. Histologically, all samples displayed varying degrees of microvesicular and macrovesicular steatosis and inflammation in addition to different stages of HCC. These paired-116 specimens were the livers that had been dissected with the tumor and adjacent non-cancerous areas from the same patients. Clinicopathological information is described in Suppl. Fig. 10 and summarized in Suppl. Table 1.
Results
HCFD promotes liver oncogenesis in NS5A Tg mice in a TLR4-dependent manner
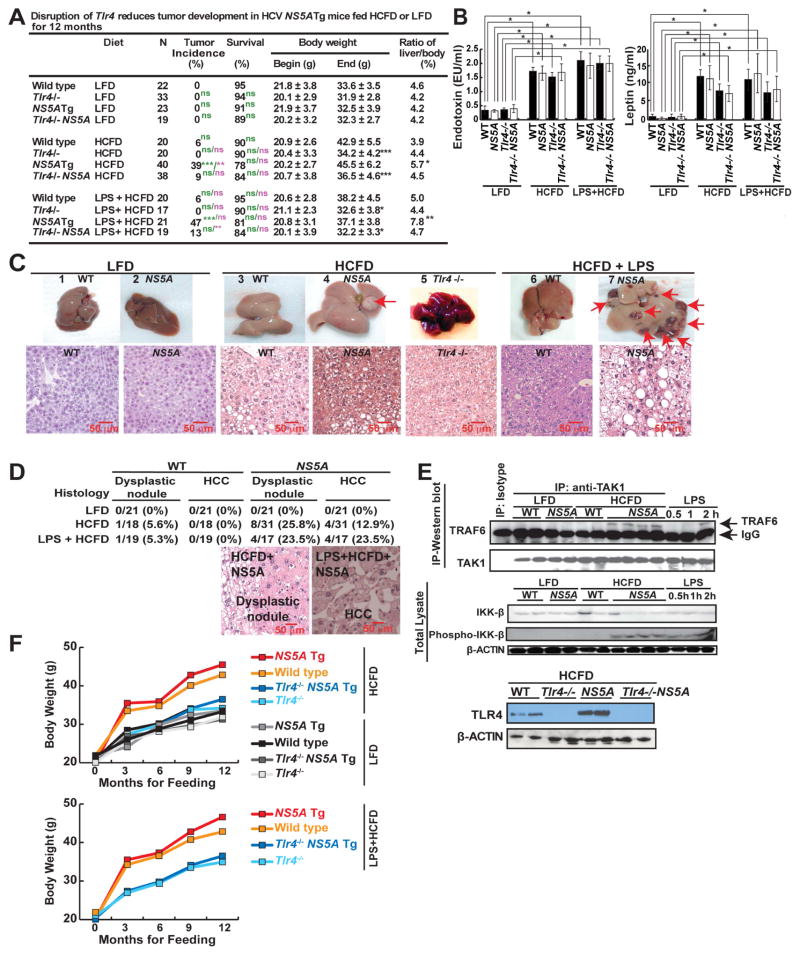
We employed an in vivo loss of function strategy to test the role of TLR4 in this interplay between NS5A and obesity. Hepatocyte-specific NS5A Tg,20, 21 and wild-type (WT) mice with or without TLR4 deficiency (Tlr4−/−)14 were maintained on low-fat diet (LFD) or an HCFD with or without supplemental LPS for 12 months (Fig. 1A). HCFD consumption resulted in an obese population (WT and NS5A Tg mice); however, this outcome was remarkably prevented by TLR4 deficiency in either genotype (Fig. 1A and 1F). In HCFD mice, we observed a liver tumor incidence of 39% in NS5A Tg mice compared to 6% in WT mice. By contrast we observed a significant decrease of tumor incidence to 9% in Tlr4−/− NS5A Tg mice (Fig. 1A and 1C). Conversely, LPS supplementation in the HCFD (100 mg/kg) further increased the incidence to 47% in NS5A Tg mice (Fig. 1A). This observation indicated a significant contribution of the LPS-TLR4 pathway in hepatocarcinogenesis. Additionally, the presence of NS5A in HCFD-fed mice significantly increased the liver to body ratio which coincided with severe liver hepatomegaly and inflammation (Fig. 1A, 1C and Suppl. Table 2).
Figure 1. NS5A Tg mice fed high-cholesterol high-fat diet (HCFD) with or without LPS frequently developed tumors.
(A) Summary of WT and Tlr4−/− HCV-NS5A Tg mice fed control diet or HCFD with or without LPS from 8 weeks of age for 12 months; N, number of experimental mice (WT-HCFD; *, P<0.05 **, P<0.01 ***, P<0.005, green scripts and symbols – statistical analysis in comparison to LFD, purple scripts and symbols - statistical analysis in comparison to HCFD). (B) Plasma endotoxin and leptin levels in mice fed low-fat diet (LFD) or HCFD. (C) Gross images of non-pathological liver from control diet (1, 2) and liver tumor with multiple nodules from HCFD (3–6) and HCFD+LPS (7). Lower panel shows histology of respective groups. The HCFD tumor shown (arrow) is a dysplastic nodule. (D) Frequencies of liver dysplastic nodules and HCCs in LFD- or HCFD-WT or NS5A Tg mice fed LFD or HCFD for 12 months. Representative H&E staining of tumor sections from WT or NS5A Tg mice fed HCFD or LPS+HCFD. The histopathology of the tumors (arrows) shown are dysplastic nodules (DNs) or hepatocellular carcinomas (HCCs) based on their hypercellularity. Nodular lesions differ from the surrounding liver parenchyma with cytological or structural atypia. (E) Normal liver/liver tumor lysates from WT and NS5A Tg mice fed control chow or HCFD were analyzed for LPS-induced TLR4 signaling. Upper panel, TRAF6 interaction with TAK1, was enhanced in NS5A Tg mice fed HCFD. The interaction between TAK1 and TRAF6 were examined by immunoblots post immunoprecipitation (IP) with TAK1 antibody. As a positive control (shown in last three lanes) mice were challenged with LPS; LPS injected (2 mg/kg) 30 mins, 1 or 2 hours, respectively, before liver tissues were collected for analysis. The relative densitometry units and details are available in supplementary Figure 1A. Bottom panel, LPS-induced phosphorylation of IKK-β in the liver was increased in NS5A Tg mice fed HCFD. Positive controls (last three lanes), as explained previously. (F) Data summary of body weight changes over 12 month feeding period and statistics are available in (A). The scale bar equals 50μm.
As predicted, HCFD, and HCFD+LPS feeding markedly raised plasma endotoxin and leptin levels in all tested cohorts (Fig. 1B). Several liver malignancies were observed in NS5A Tg mice, but not in the control animals. Additional observed pathologies included NASH-like bloating (Fig. 1C), dysplastic nodules (non-malignant) and HCCs (Fig. 1D). Activation of TLR4 signaling was assessed by co-IP of TGF-α-activated kinase 1 (TAK1) - tumor necrosis factor receptor-associated factor 6 (TRAF6) and immunoblotting for p-IKK-β.14 Concomitant TLR4 activation through TRAF6-TAK1-p-IKK-β was evident in HCFD-fed NS5A Tg (Fig. 1E, and Suppl. Fig. 1), but not in LFD-fed cohorts. As a positive control for TLR4 activation parameters, a single i. p. dose of LPS (2 mg/kg) was given to chow-fed WT mice prior to sample collection (last three lanes of Fig. 1E top). Collectively, these results demonstrated that HCV-NS5A and HCFD acted synergistically to induce liver tumors in a manner dependent on TLR4.
Twist1 identified as one of the most conspicuously upregulated genes in TLR4-dependent NS5A- and HCFD-driven hepatocarcinogenesis
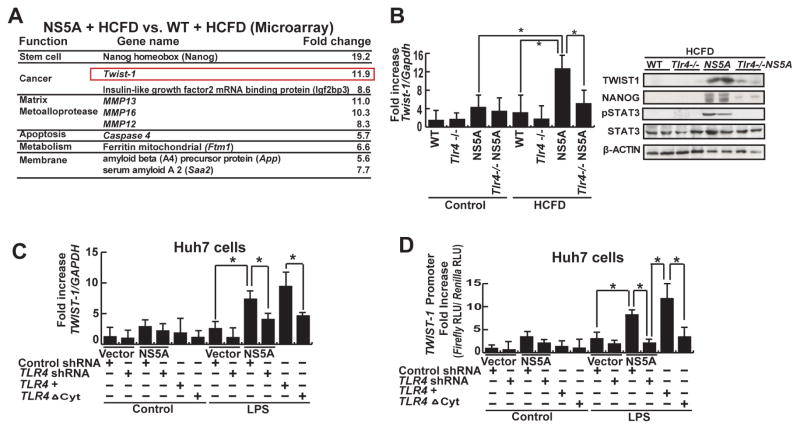
To understand the molecular basis of enhanced liver oncogenesis in HCFD-NS5A mice, we performed RNA microarray analysis. This identified 131 differentially upregulated and 43 down-regulated transcripts in HCFD-fed NS5A Tg mice (Fig. 2A and Suppl. Fig. 2). Some of the more highly upregulated transcripts of different functional categories are listed in Figure 2A. These include the stemness marker Nanog, oncogene Igf2bp3, and EMT and tumor metastasis regulator Twist1.19, 24, 25 Nanog and lgf2bp3 have been found to be critical in self-renewal and tumorigenic activity of TICs isolated from liver tumors of alcohol-fed NS5A mice14. To confirm that TLR4 activation in the liver is from TICs, we performed immunofluorescence staining on control, HCFD, and HCFD+LPS livers (Suppl. Fig. 3). This analysis confirmed that the source of TLR4 in the HCFD and HCFD+LFD livers is from TICs (TLR4 co-staining with NANOG) and not from the resident macrophages (Kupffer cells). For this study, we further examined the molecular mechanisms through which Twist1 promoted EMT and tumor metastasis in HCFD-fed NS5A derived TICs. To substantiate the microarray data we performed quantitative real time PCR (qRT-PCR) analysis to measure Twist1 gene expression. As expected, Twist1 mRNA was significantly induced in HCFD-fed NS5A Tg mice compared to HCFD-fed WT mice or LFD-fed NS5A Tg mice (Fig. 2B). These analyses also revealed that Twist1 transcription was reduced in the HCFD-fed Tlr4−/− NS5A Tg cohort (Fig. 2B), suggesting that the presence of TLR4 was permissive or required for Twist1 induction.
Figure 2. TLR4-mediated TWIST1 induction.
(A) Chief summary of RNA microarray analysis. Twist1, key regulator of EMT signaling was significantly higher in NS5A+HCFD compared to WT+HCFD. (B) Quantitative analysis of Twist1 from liver/liver tumor tissues of all cohorts, as listed in Figure 1A. Heightened Twist1 expression (NS5A Tg mice fed HCFD) was abrogated by TLR4 deficiency. Data normalized to GAPDH expression are listed as the fold change (*, P <0.05). (C) LPS induced TWIST1 in Huh7 cells transduced with an NS5A expression vector (*, P<0.05 compared to cells transduced with an empty vector). This was suppressed by lentiviral expression of shRNA for TLR4 and also in cells transduced with the dominant negative TLR4 vector (TLR4ΔCyt). (D) LPS induced TWIST1 promoter activity. Huh7 cells transfected with TWIST1 promoter-luciferase construct were stimulated with LPS (10 μg/ml) in culture. Other experimental procedures in this figure are the same as described earlier. TLR4 knockdown or mutation abrogated TWIST1 promoter activity, but adding TLR4 rescued it. Relative light units (RLU) values were normalized by the Renilla luciferase activity driven by SV40 promoter which were used a transfection control (*, P < 0.05).
TLR4 signaling transactivates Twist1
To further establish whether TLR4 regulates TWIST1, human HCC cell line Huh7 cells were transfected with an NS5A gene expression vector. We then transduced lentivirus expressing TLR4 or scrambled shRNA in these NS5A/vector expressing cells and further stimulated these cells with or without LPS. As shown in Figure 2C, LPS treatment upregulated TWIST1 mRNA levels in NS5A-transfected Huh7 cells transduced with scrambled-shRNA, but not in any other groups with shRNA knockdown of TLR4. TWIST1 induction was significantly abrogated by TLR4 blockade. When a dominant-negative variant of TLR4 lacking the cytoplasmic domain (mutant TLR4; TLR4ΔCyt) was transduced into these cells, a similar and more conspicuous reduction of TWIST1 expression was observed. We then tested whether TLR4 signaling can transcriptionally activate TWIST1. Huh7 cells were transfected with TWIST1 promoter (nt −700/−1) luciferase plasmid constructs26 and assayed for activity upon LPS treatment. A potent TWIST1 promoter activity was observed that was responsive to the LPS-TLR4 signaling axis (Fig. 2D), indicating that TLR4 does indeed transactivate TWIST1.
Twist1 blockade reduces TIC self-renewal, migration and tumorigenesis
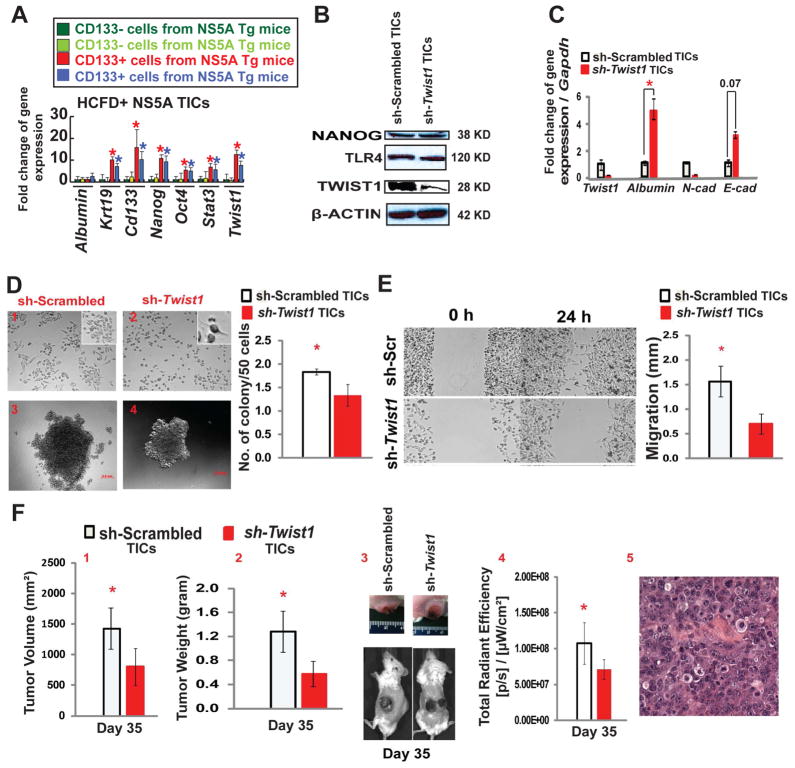
To demonstrate that TLR4 is responsible for Twist1 induction in TICs, we isolated CD133+/CD49f+/CD45− cells for examination of gene expression to show that these cells indeed express higher levels of stemness genes and Twist1 (Fig. 3A). The functionality of Twist1 in TICs was analyzed by silencing expression using lentivirus expressing Twist1 shRNA. Twist1 silencing did not affect TLR4 or NANOG (downstream of LPS-TLR4 axis14) protein expression (Fig. 3B), but upregulated epithelial cell markers Albumin and E-cadherin expression while down regulating expression of a mesenchymal cell marker, N-cadherin (Fig. 3C); thus indicating that Twist1 silencing changes the mesenchymal phenotype to the epithelial phenotype. These data indicated that Twist1 acts downstream of the TLR4 signaling cascade and contributes significantly to the maintenance of mesenchymal phenotype based on its effect on Albumin, E-cadherin and N-cadherin. To further investigate this phenomenon, we assessed the phenotypic changes in TICs after Twist1 blockade. TIC morphology was altered from a spindle (mesenchymal) shape to a tadpole-like (epithelial) shape (Fig. 3D, inset); there also was increased cell size (Suppl. Fig. 4A). Moreover, Twist1 blockade significantly reduced cell proliferation (Suppl. Fig. 4B), self-renewal ability as assayed by colony formation in soft agar (Fig. 3D), spheroid formation (Suppl. Fig. 4C) and cell migration by scratch assay (Fig. 3E). We then tested implanted cells for tumorigenic potential in NOG mice. Subcutaneously transplanted Twist1 or scrambled shRNA TICs were monitored for tumor size over a period of 35 days. Gross and optical-image analysis of live tumor-bearing mice showed reduced tumor size in Twist1 knockdown groups (Fig. 3F, panels 3 and 4). As expected, tumor volume and weight were significantly reduced (Fig. 3F, panels 1 and 2). Histological examination of xenografted TICs showed that the resulting tumor exhibited an HCC morphology (Fig. 3F panel 5). These results revealed that Twist1, regulated through the LPS-TLR4 axis, plays a significant role in maintaining the mesenchymal and tumorigenic properties of TICs.
Figure 3. Twist1 is required for mesenchymal morphology of TICs, down regulation of Twist1 reduces TIC cancer-initiating property.
(A) CD133+/CD49f+/CD45− cells were isolated from tumors of two different HCFD-fed NS5A Tg mice and examined for stemness gene expression by qRT-PCR. (B) To silence Twist1 expression, lentivirus shRNA Twist1 was transduced in TICs. Immunoblot analysis confirmed decreased TWIST1 expression in TICs and demonstrated unchanged expression of NANOG and TLR4 (n=3). (C) mRNA levels were validated by qRT-PCR. Expression profile of EMT-regulated genes, including mesenchymal markers (Twist1 and N-cad) and epithelial markers (Albumin and E-cad) were analyzed (n=3; *, P<0.05). (D) Light field microscopy demonstrated an altered morphology of TICs post Twist1 knockdown. Scrambled TICs (1) parenchymal cell phenotype drastically changed to a tadpole shape (2) post-Twist1 knockdown (40X; n=10; insets are enlarged images). In vitro oncogenicity was tested via soft agar colony formation assay. Silencing Twist1 in TICs (4) significantly reduced colony forming ability in contrast to control cells (3). The number of colonies formed were normalized and summarized (n=3; *, P<0.05). (E) shRNA knock down of Twist1 diminished the ability of TICs to effectively migrate in contrast to the scrambled shRNA control, as demonstrated by in vitro cell migration assay. The images were captured at 0 hours and 24 hours after scratching the cell layer with a 100 μl pipet tip (n=3; *, P<0.05). (F) Analyses at day 35 post TICs transplantation (subcutaneously injected into NOG mice). Twist1 silencing reduced the overall tumor volume (1) and weight (2). (3) Gross image of subcutaneous tumors. (4) Non-invasive bioluminescence imaging demonstrates the decrease in overall tumor growth (n=4 NOG mice/cohort; *, P<0.05). (5) H&E staining of xenografted tumor in NOG mice shows HCC histology. The scale bar equals 50μm.
NANOG and pSTAT3 regulate Twist1
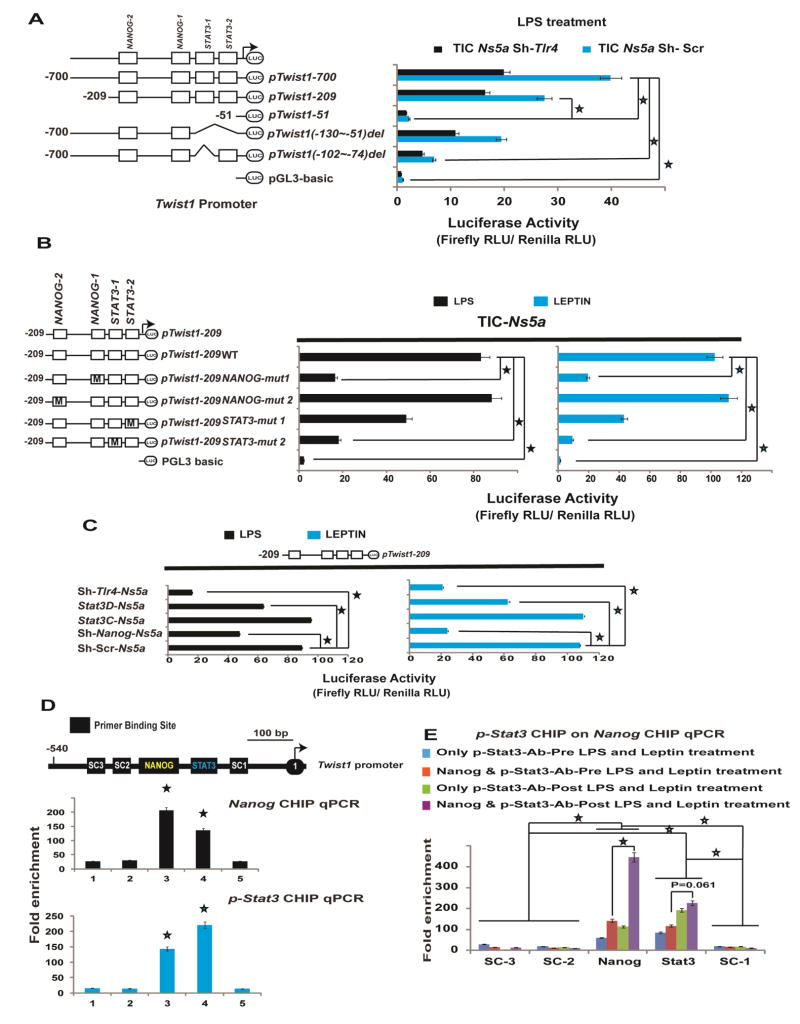
We next investigated the molecular mechanisms responsible for TLR4-dependent activation of Twist1. We carried out Twist1 promoter-reporter assays, using promoter constructs26 containing either WT (nt −700 to −1) or mutated regions upstream of the transcription initiation/start site (TSS). The activation of these reporter constructs was analyzed in cells transduced with either scrambled or Tlr4 shRNA. From this analysis we established that the region between −209 to −51 is essential for the basal and Tlr4-dependent induction of Twist1 in TICs (Fig. 4A; Huh7 cells in Suppl. Fig. 5). In particular, a deletion between nts −102 and −74 markedly reduced Twist1 promoter activity, indicating that this region contained essential cis-elements. Long-term treatment of mice with HCFD activated Tlr4-Nanog signaling and increased leptin and endotoxin levels in the plasma. Furthermore we previously demonstrated that leptin and its receptor (OB-R) augmented pSTAT3 in TICs.16 In addition, NANOG is known to cooperate with STAT3 for maintenance of pluripotency in mouse embryonic stem cells.27 Thus we reasoned for activation of Twist1 in TICs, the adipose tissue-derived leptin-pSTAT3 signal and the TLR4-NANOG signal are needed. In silico analysis using Transcription Element Search System (TESS) and Transfac® identified consensus NANOG and STAT3 binding sites on the Twist1 promoter region. To evaluate the functions of these transcription factors, we mutated (Fig. 4B) the respective NANOG and STAT3 binding sites in the corresponding luciferase reporter construct and discovered that the STAT3-1 (STAT3 site distal to TSS) and NANOG-1 (NANOG site proximal to TSS) sites were critical for Twist1 promoter activity. As shown in Figure 4B, mutations on these specific binding sites markedly attenuated reporter responsiveness to both LPS and leptin induction. In addition, when key upstream cellular signals (Tlr4, Nanog and Stat3) were blocked, Twist1 promoter activity was significantly abrogated (Fig. 4C). This result was further substantiated after chromatin immunoprecipitation-quantitative PCR (ChIP-qPCR) analysis with antibodies specific for NANOG and pSTAT3 (Fig. 4D). Single antibody IP of either NANOG or pSTAT3 enriched the NANOG-1 and STAT3-1 binding sites in qPCR, signifying that these two transcription factors might cooperatively transactivate Twist1 in response to LPS and leptin. As further validation of this model, sequential-ChIP analysis was performed. As shown in Figure 4E, NANOG and pSTAT3 mutually bound each other in the process of transactivating Twist1.
Figure 4. NANOG and STAT3 influence Twist1 promoter activation in NS5A TICs.
(A) LPS-induces Twist1 promoter activity in TICs. Twist1 promoter analysis with various deletion constructs demonstrated the importance of the TSS proximal segment (nt −209/−1). Relative light units (RLU) values were normalized by Renilla luciferase activity driven by a constitutively active SV40 promoter (pTwist1 nts −1 to −700; *, P<0.05; color matched; pTwist1 nts −1 to −209; #, P<0.05; n=3). (B) NANOG and STAT3 activate the Twist1 promoter. NANOG and STAT3 binding elements in Twist1 promoter region (nts −209 to −51) were mutated by in vitro mutagenesis (pTwist1 1–209WT; *, P<0.05; color matched; n=3). (C) Silencing Tlr4 and Nanog using lentivirus expressing shRNA or Stat3 and Stat3D (retrovirus expressing dominant negative Stat3). *, P<0.05; color matched; n=3). (D) Upper panel, schematic representation (SR) of Twist1 promoter region depicting the locations probed for the consensus binding sequences for NANOG (yellow script), STAT3 (Green lettering), and the specificity control (SC) regions analyzed by ChIP (white script). Immediately below the SR are NANOG ChIP-qPCR (black bar graphs) and STAT3 ChIP-qPCR (blue bar graphs) analyses which demonstrated the enrichment of NANOG and STAT3 in TICs post LPS (10 μg/ml) and leptin (5 ng/ml) treatment. The Fold enrichment values are relative expression values normalized to the IgG controls (SC3; *, P<0.05; SC2; $, P<0.05; SC1; #, P<0.05; biological replicates 4; n=2). (E) Protein-Protein-DNA interaction demonstrated by sequential-ChIP-qPCR, indicated that NANOG and STAT3 bind each other on the Twist1 promoter region in TICs post LPS (10 μg/ml) and leptin (5μg/ml) treatment. The Fold enrichment values are relative expression values normalized to the IgG controls (SC3, SC2, SC1; *, P<0.05; color matched; #, P<0.05; biological replicates 4; n=2).
Mouse and human HCC have accentuated expression of TLR4, p-STAT3, and TWIST1
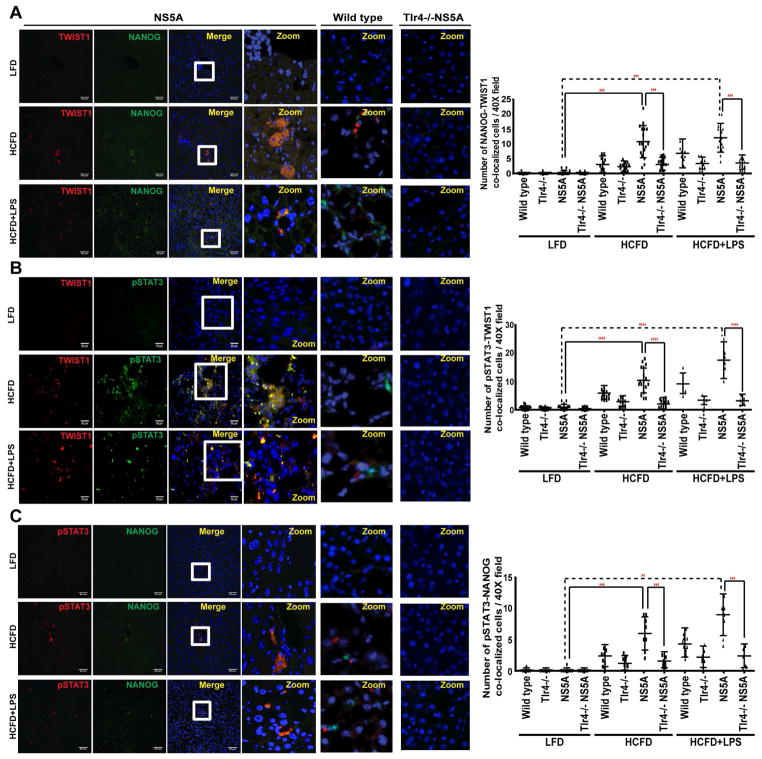
The involvement of both LPS-TLR4-NANOG and Lepin-OB-R-pSTAT3 signaling pathways for Twist1 induction was examined by immunoblotting analysis of lysates from liver tumors isolated from HCFD-fed NS5A Tg mice and normal livers of chow-fed mice. As expected, TLR4, STAT3, pSTAT3 and TWIST1 were all upregulated (Suppl. Fig. 6A). The mRNA levels of TLR4, STAT3 and TWIST1 were also elevated in qRT-PCR analysis (Suppl. Fig. 6B–D). Furthermore, immunostaining demonstrated co-localization of TWIST1 with pSTAT3, and NANOG as well as co-localization of pSTAT3 with NANOG in tumor-bearing HCFD and HCFD+LPS NS5A Tg liver specimens (Fig. 5 and Suppl. Fig. 7), but less co-localization or fewer numbers of CD133+/CD49F+ or AFP+ cells in LFD-fed NS5A Tg or HCFD-fed Tlr4−/− NS5A Tg mice (Suppl. Fig. 7). The major source of TLR4 in the liver of wild type mice is from non-parenchymal cell, including the Kupffer cells and stellate cells. The TICs derived from mice models have significant induction of TLR4. As shown in Suppl. Fig 7 the low fat diet (LFD) cohort IF staining shows TLR4 positive cells, which are presumably Kupffer cells or stellate cells. But in HCFD and HCFD+LPS the TLR4 positive cells have NANOG co-expression, indicating that TLR4 origin is not only from Kupffer cells or stellate cells but rather from the TICs or hepatocytes. This is further corroborated in Suppl. Fig. 7 where co-staining of TWIST1-NANOG and CD133-CD49F is present in HCFD but not in LFD. Non-parenchymal areas of both mice fed HCFD and LFD have TLR4 staining while co-staining of TLR4-NANOG or TLR4-AFP are present mainly in HCFD group but not in LFD group and in groups of Tlr4−/−NS5A Tg mice. In liver of NS5A Tg mice, both parenchymal (ALB: Albumin+) and non-parenchymal staining of TLR4 are positive (Suppl. Fig. 8) while non-parenchymal area of wild type mice fed LFD mainly have positive staining of TLR4 (Suppl. Fig. 7), indicating that hepatocytes and TICs of NS5A Tg mice have elevated levels of TLR4, which are associated with strong staining patterns of AFP and TWIST1.
Figure 5. Induction of NANOG, pSTAT3 and TWIST1 in HCFD and HCFD+LPS NS5A Tg cohorts.
Confocal immunofluorescence (IF) microscopy demonstrated co-localization of TWIST1 with (A) NANOG and (B) pSTAT3 (C) Co-localization of pSTAT3 with NANOG in tumors obtained from HCFD and HCFD+LPS NS5A Tg liver specimens; this immunoreactivity is completely absent in low fat diet liver tissues (magnification 40x oil; n=15 samples/cohort; n=3). Quantifications of the IF data was done using Metamorph software. The scale bar equals 50 μm.
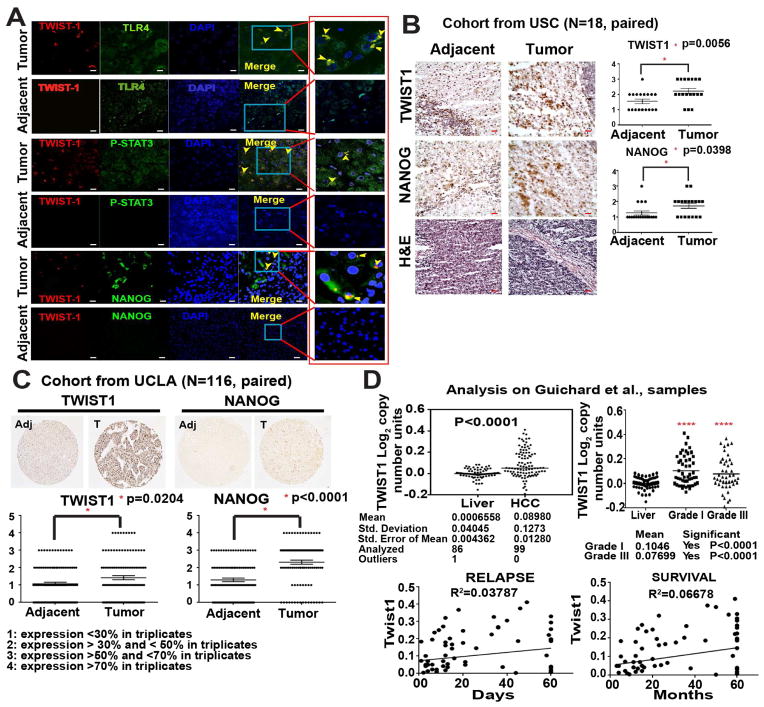
We next assessed the clinical relevance of our findings by analyzing the expression of these proteins in patient-derived HCC samples. Immunofluorescence staining detected co-localization of TWIST1 with TLR4, pSTAT3 and NANOG (Fig. 6A and Suppl. Fig. 10). Moreover, paired IHC analyses of 142 patient samples (116 as a tissue microarray analysis, Suppl. Fig 9 and Suppl. Table 1) were performed to validate the significance of TWIST1 and NANOG in human tissue sections from three different cohorts (Fig. 6B–C and Suppl. Fig. 9A). To corroborate our findings and to gain insights on the correlation of Twist1 with grade, survival, and relapse in HCC patients, we performed in silico analysis using the Oncomine Gene browser. Two independent libraries from the repository were analyzed: TCGA Liver (The Cancer Genome Atlas; probing 97 HCC and 59 paired normal liver tissue) and Guichard Liver28 (probing 99 HCC and 86 normal liver). Both demonstrated the significant impact of TWIST1 on HCC (Fig. 6D and Suppl. Fig. 9B).
Figure 6. Accentuated TWIST1 co-localization with TLR4, P-STAT3 and NANOG in human patient samples.
(A) Confocal immunofluorescence (IF) imaging studies demonstrated TLR4, P-STAT3, and NANOG often colocalized with TWIST1 in HCC patient liver specimens (Tumor), but absent in noncancerous liver tissue (adjacent) (magnification, 40x oil; n=8 samples/cohort; n=3; Red boxed are cropped images). (B) Paired IHC staining performed at USC corroborated with IF, which demonstrated the significant increase in NANOG and TWIST1 expression in HCC tumor samples (100X magnification; n=18 samples, paired; n=3). (C) Tissue microarray analysis confirmed the correlation of TWIST1 and NANOG in a large number of patient HCC tumor samples (100X magnification; n=116 samples, paired). Adjacent = parent non-cancerous liver, Tumor = human HCC. The liver is removed in order to transplant new liver. (D) In silico analysis using Oncomine™ Gene browser, probing for Twist1 correlation with grade, survival and relapse in HCC patients via Guichard libraries. The scale bar equals 50μm.
TWIST1 overexpression promotes tumor formation
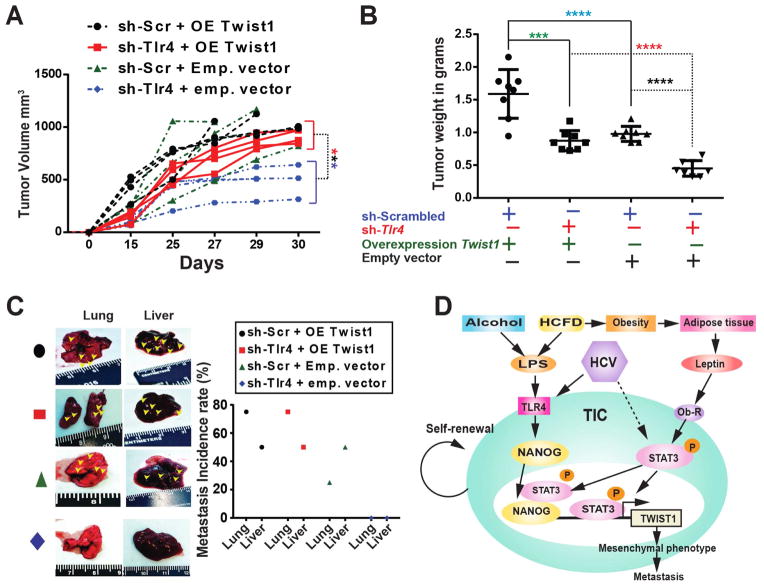
Our results indicated that Twist1 silencing reduces TIC-derived tumorigenesis (Fig. 3F) and that Twist1 is downstream of TLR4 (Fig. 4). We then investigated whether overexpression of Twist1 beyond basal level in TICs can enhance its role in malignant tumor development and metastasis. Additionally we asked how Tlr4 silencing can influence this outcome. To test this hypothesis, we transplanted TICs expressing scrambled or Tlr4 shRNA (Suppl. Fig. 11), TICs containing empty vector or TICs constitutively expressing Twist1 into NOG recipient mice (Suppl. Fig. 11A). Overexpression of Twist1 indeed promoted tumor growth and significantly increased final tumor volume and weight (Fig. 7A–B). Concomitant Tlr4 silencing (Suppl. Fig. 11B) reduced the overall tumor volume and weight, indicating that TLR4 acts upstream of Twist1. Constitutive overexpression of Twist1 resulted in increased metastasis to the lung and the liver, suggesting that it has an important role in metastatic progression (Fig. 7C).
Figure 7. Twist1 overexpression drives tumor growth independently of Tlr4.
TICs were transduced with lentivirus expressing shRNA for Tlr4 or scrambled shRNA followed by a second transduction with retrovirus expressing Twist1 overexpression (OE) plasmid vector or empty vector (Emp). These cells were injected subcutaneously into the rear flanks of NOG mice (1 million cells/injection). (A) Tumor volume measured at day 15, 25 and 30 (also whenever an unexpected death occurred) demonstrated an increasing trend in the tumor volume with intact Tlr4 and Twist1 overexpression when compared to their respective controls (sh-Tlr4+OE vs sh-Tlr4+Emp; ***, P<0.001; n=4 NOG mice/cohort; n=2; statistics performed using 2-way ANOVA). (B) Significant increase in the overall tumor weight (***, P<0.001, ****, P<0.0001, n=4 NOG mice/cohort; n=2). (C) Overexpression of Twist1 promotes Liver and Lung metastasis irrespective of the endogenous Tlr4 expression in TICs. (D) A schematic representation of the proposed link between oncogenic TLR4/NANOG signaling, OB-R/pSTAT3 and an effective TWIST1 pathway in generating TICs.
Discussion
TICs comprise a small percentage of cells with stem-like properties resident in tumors and have been documented in a wide variety of cancerous tissues.29 EMT remodels cells and thus plays a key role in the acquisition of malignant traits.30, 31 In this report, we demonstrated that TLR4 is required for liver oncogenesis and the expansion of liver TICs in HCFD-fed HCV-NS5A Tg mice. Analysis of gene expression in TICs revealed that Twist1, a master regulator of EMT17–19 was increased 11-fold, which was not observed in TICs derived from alcohol diet fed NS5A Tg mice.14 The findings described an unexpected convergence of the NANOG and STAT3 signaling pathways. We have identified an important functional link between the NANOG pathway, by activation of upstream LPS-TLR4 signaling and the STAT3 pathway, driven by leptin-OB-R signaling. These two pathways cooperate to activate Twist1 and augment TIC motility (Fig. 7D).
These studies implicate that life-style diseases, including obesity and alcoholism, promote genesis, mesenchymal phenotype and metastatic characteristics of TICs through synergistic interactions between LPS-TLR4-NANOG pathway and Leptin-Ob-R-STAT3 (Fig. 7D). Therefore, investigation of the effects of combination of inhibitors to prevent this synergistic interaction, including TLR4 antagonist or inhibitors targeting STAT3, NANOG and/or TWIST1, is warranted for further investigation in pre-clinical mouse models.
In conclusion, stemness markers NANOG and STAT3 are activated downstream of the LPS-TLR4 and leptin-OB-R pathways, respectively. NANOG and STAT3 cooperate to drive increased Twist1 levels, promoting the mesenchymal phenotype and metastasis in TICs (Fig. 7D) and contributing to HCC development.
Supplementary Material
Acknowledgments
Grant Support
This project was supported by NIH research grants R01AA018857, P50AA011999 (Southern California Research Center for ALPD and Cirrhosis, pilot project, program, animal core, morphology core), Lee-Summer-Project funding, P30DK048522 (USC Research Center for Liver Diseases, pilot project program), Non-Parenchymal Liver Cell Core (R24AA012885) and UO-021898. This research was also supported by a Research Scholar Grant (RSG-12-177-01-MPC); pilot funding from American Cancer Society (IRG-58-007-48); The Cell and Tissue Imaging Core - USC Research Center for Liver Diseases (P30 DK048522).
We thank Dr. Ratna Ray (Saint Louis Univ.) for providing HCV NS5A Tg mice; Prof. Stanley M. Tahara, Mr. Chad Nakagawa and Mrs. Kelly Brewer (Univ. Conn. Health) for critical reading of the manuscript; Prof. Hidekasu Tsukamoto (USC) and Prof. Si-Yi Chen (USC) for discussion; Prof. Susan Groshen and Ms. Lingyun Ji, of the USC Norris Comprehensive Cancer Center Biostatistics Core supported by NIH/NCI P30 CA 014089 for statistical analyses; USC Molecular Imaging Center supported by NIH/NVRR S10 for animal imaging; Ms. Lewei Duan for technical assistance; Mr. Yibu Chen and Ms. Meng Li Dual in Norris Medical Library supported bioinformatics analyses. The TWIST1-pGL3 reporter constructs were obtained from Dr. Nakamura (Tokyo Medical and Dental University, Japan). Retroviruses expressing Stat3C and Stat3D were obtained from Prof. Daniel C. Link (Washington University of School of Medicine).
Abbreviations
- TICs
tumor-initiating stem-like cells
- NOG
(NOD/Shi-scid/IL-2Rγnull)
- HCC
hepatocellular carcinoma
- HCV
hepatitis C virus
- HBV
hepatitis B virus
- TLR4
Toll-like receptor 4
- LPS
lipopolysaccharide
- NASH
nonalcoholic steatohepatitis
- HCFD
high cholesterol fat diet
Footnotes
Disclosures
Authors have nothing to disclose.
Transcript Profiling
Repository for expression microarray data.
NCBI tracking system number: The data used in this study has been deposited to NCBI under GSE61435 (Microarray).
Author Contributions
D.U., K.M. and D.F. conceived of the study. D.U., C.C., J.L., K.M., J.D., B.N., S.J., S.F., S.W.F., V.A., and A.Z obtained the data. D.U., C.C., K.M., J.L., J.D., B.N., S.J., S.F., S.W.F., V.A., and A.Z. provided data management, and statistical support. D.U., J.L. and K.M. conducted the data analysis and drafted the report. All authors interpreted the data and contributed to the final version of this report.
Publisher's Disclaimer: This is a PDF file of an unedited manuscript that has been accepted for publication. As a service to our customers we are providing this early version of the manuscript. The manuscript will undergo copyediting, typesetting, and review of the resulting proof before it is published in its final citable form. Please note that during the production process errors may be discovered which could affect the content, and all legal disclaimers that apply to the journal pertain.
Contributor Information
Dinesh Babu Uthaya Kumar, Email: uthayaku@usc.edu.
Chia-Lin Chen, Email: chialin.chen@usc.edu.
Jian-Chang Liu, Email: liufelix1008@gmail.com.
Douglas E. Feldman, Email: douglas.feldman@gmail.com.
Linda S. Sher, Email: lsher@health.usc.edu.
Samuel French, Email: sfrench@mednet.ucla.edu.
Joseph DiNorcia, Email: dinorcia@usc.edu.
Samuel W. French, Email: french7@ucla.edu.
Bita V. Naini, Email: bnaini@mednet.ucla.edu.
Sunhawit Junrungsee, Email: junrungsee@gmail.com.
Vatche Garen Agopian, Email: VAgopian@mednet.ucla.edu.
Ali Zarrinpar, Email: AZarrinpar@mednet.ucla.edu.
Keigo Machida, Email: keigo.machida@med.usc.edu.
References
- 1.Peters MG, Terrault NA. Alcohol use and hepatitis C. Hepatology. 2002;36:S220–5. doi: 10.1053/jhep.2002.36811. [DOI] [PMC free article] [PubMed] [Google Scholar]
- 2.Donato F, Gelatti U, Limina RM, et al. Southern Europe as an example of interaction between various environmental factors: a systematic review of the epidemiologic evidence. Oncogene. 2006;25:3756–70. doi: 10.1038/sj.onc.1209557. [DOI] [PubMed] [Google Scholar]
- 3.Hassan MM, Hwang LY, Hatten CJ, et al. Risk factors for hepatocellular carcinoma: synergism of alcohol with viral hepatitis and diabetes mellitus. Hepatology. 2002;36:1206–13. doi: 10.1053/jhep.2002.36780. [DOI] [PubMed] [Google Scholar]
- 4.Song SJ, Poliseno L, Song MS, et al. MicroRNA-antagonism regulates breast cancer stemness and metastasis via TET-family-dependent chromatin remodeling. Cell. 154:311–24. doi: 10.1016/j.cell.2013.06.026. [DOI] [PMC free article] [PubMed] [Google Scholar]
- 5.Lai MS, Hsieh MS, Chiu YH, et al. Type 2 diabetes and hepatocellular carcinoma: A cohort study in high prevalence area of hepatitis virus infection. Hepatology. 2006;43:1295–302. doi: 10.1002/hep.21208. [DOI] [PubMed] [Google Scholar]
- 6.Ribeiro PS, Cortez-Pinto H, Sola S, et al. Hepatocyte apoptosis, expression of death receptors, and activation of NF-kappaB in the liver of nonalcoholic and alcoholic steatohepatitis patients. Am J Gastroenterol. 2004;99:1708–17. doi: 10.1111/j.1572-0241.2004.40009.x. [DOI] [PubMed] [Google Scholar]
- 7.Feingold KR, Grunfeld C. Role of cytokines in inducing hyperlipidemia. Diabetes. 1992;41(Suppl 2):97–101. doi: 10.2337/diab.41.2.s97. [DOI] [PubMed] [Google Scholar]
- 8.Shintani Y, Fujie H, Miyoshi H, et al. Hepatitis C virus infection and diabetes: direct involvement of the virus in the development of insulin resistance. Gastroenterology. 2004;126:840–8. doi: 10.1053/j.gastro.2003.11.056. [DOI] [PubMed] [Google Scholar]
- 9.Singh S, Singh PP, Roberts LR, et al. Chemopreventive strategies in hepatocellular carcinoma. Nat Rev Gastroenterol Hepatol. 2014;11:45–54. doi: 10.1038/nrgastro.2013.143. [DOI] [PMC free article] [PubMed] [Google Scholar]
- 10.Villanueva A, Hernandez-Gea V, Llovet JM. Medical therapies for hepatocellular carcinoma: a critical view of the evidence. Nat Rev Gastroenterol Hepatol. 2013;10:34–42. doi: 10.1038/nrgastro.2012.199. [DOI] [PubMed] [Google Scholar]
- 11.Gale MJ, Jr, Korth MJ, Tang NM, et al. Evidence that hepatitis C virus resistance to interferon is mediated through repression of the PKR protein kinase by the nonstructural 5A protein. Virology. 1997;230:217–27. doi: 10.1006/viro.1997.8493. [DOI] [PubMed] [Google Scholar]
- 12.Kato N, Lan KH, Ono-Nita SK, et al. Hepatitis C virus nonstructural region 5A protein is a potent transcriptional activator. J Virol. 1997;71:8856–9. doi: 10.1128/jvi.71.11.8856-8859.1997. [DOI] [PMC free article] [PubMed] [Google Scholar]
- 13.Machida K, Cheng KT, Sung VM, et al. Hepatitis C virus induces toll-like receptor 4 expression, leading to enhanced production of beta interferon and interleukin-6. J Virol. 2006;80:866–74. doi: 10.1128/JVI.80.2.866-874.2006. [DOI] [PMC free article] [PubMed] [Google Scholar]
- 14.Machida K, Tsukamoto H, Mkrtchyan H, et al. Toll-like receptor 4 mediates synergism between alcohol and HCV in hepatic oncogenesis involving stem cell marker Nanog. Proc Natl Acad Sci U S A. 2009;106:1548–53. doi: 10.1073/pnas.0807390106. [DOI] [PMC free article] [PubMed] [Google Scholar]
- 15.Erridge C, Attina T, Spickett CM, et al. A high-fat meal induces low-grade endotoxemia: evidence of a novel mechanism of postprandial inflammation. Am J Clin Nutr. 2007;86:1286–92. doi: 10.1093/ajcn/86.5.1286. [DOI] [PubMed] [Google Scholar]
- 16.Feldman DE, Chen C, Punj V, et al. Pluripotency factor-mediated expression of the leptin receptor (OB-R) links obesity to oncogenesis through tumor-initiating stem cells. Proc Natl Acad Sci U S A. 109:829–34. doi: 10.1073/pnas.1114438109. [DOI] [PMC free article] [PubMed] [Google Scholar]
- 17.Mani SA, Guo W, Liao MJ, et al. The epithelial-mesenchymal transition generates cells with properties of stem cells. Cell. 2008;133:704–15. doi: 10.1016/j.cell.2008.03.027. [DOI] [PMC free article] [PubMed] [Google Scholar]
- 18.Morel AP, Lievre M, Thomas C, et al. Generation of breast cancer stem cells through epithelial-mesenchymal transition. PLoS One. 2008;3:e2888. doi: 10.1371/journal.pone.0002888. [DOI] [PMC free article] [PubMed] [Google Scholar]
- 19.Yang J, Mani SA, Donaher JL, et al. Twist, a master regulator of morphogenesis, plays an essential role in tumor metastasis. Cell. 2004;117:927–39. doi: 10.1016/j.cell.2004.06.006. [DOI] [PubMed] [Google Scholar]
- 20.Majumder M, Ghosh AK, Steele R, et al. Hepatitis C virus NS5A protein impairs TNF-mediated hepatic apoptosis, but not by an anti-FAS antibody, in transgenic mice. Virology. 2002;294:94–105. doi: 10.1006/viro.2001.1309. [DOI] [PubMed] [Google Scholar]
- 21.Majumder M, Steele R, Ghosh AK, et al. Expression of hepatitis C virus non-structural 5A protein in the liver of transgenic mice. FEBS Lett. 2003;555:528–32. doi: 10.1016/s0014-5793(03)01337-1. [DOI] [PubMed] [Google Scholar]
- 22.Van Heek M, Compton DS, France CF, et al. Diet-induced obese mice develop peripheral, but not central, resistance to leptin. J Clin Invest. 1997;99:385–90. doi: 10.1172/JCI119171. [DOI] [PMC free article] [PubMed] [Google Scholar]
- 23.Haluzik M, Gavrilova O, LeRoith D. Peroxisome proliferator-activated receptor-alpha deficiency does not alter insulin sensitivity in mice maintained on regular or high-fat diet: hyperinsulinemic-euglycemic clamp studies. Endocrinology. 2004;145:1662–7. doi: 10.1210/en.2003-1015. [DOI] [PubMed] [Google Scholar]
- 24.Kang Y, Massague J. Epithelial-mesenchymal transitions: twist in development and metastasis. Cell. 2004;118:277–9. doi: 10.1016/j.cell.2004.07.011. [DOI] [PubMed] [Google Scholar]
- 25.Sun T, Zhao N, Zhao XL, et al. Expression and functional significance of Twist1 in hepatocellular carcinoma: its role in vasculogenic mimicry. Hepatology. 51:545–56. doi: 10.1002/hep.23311. [DOI] [PubMed] [Google Scholar]
- 26.Cheng GZ, Zhang WZ, Sun M, et al. Twist is transcriptionally induced by activation of STAT3 and mediates STAT3 oncogenic function. J Biol Chem. 2008;283:14665–73. doi: 10.1074/jbc.M707429200. [DOI] [PMC free article] [PubMed] [Google Scholar]
- 27.Torres J, Watt FM. Nanog maintains pluripotency of mouse embryonic stem cells by inhibiting NFkappaB and cooperating with Stat3. Nat Cell Biol. 2008;10:194–201. doi: 10.1038/ncb1680. [DOI] [PubMed] [Google Scholar]
- 28.Guichard C, Amaddeo G, Imbeaud S, et al. Integrated analysis of somatic mutations and focal copy-number changes identifies key genes and pathways in hepatocellular carcinoma. Nat Genet. 2012;44:694–8. doi: 10.1038/ng.2256. [DOI] [PMC free article] [PubMed] [Google Scholar]
- 29.Farnie G, Clarke RB. Breast stem cells and cancer. Ernst Schering Found Symp Proc. 2006:141–53. doi: 10.1007/2789_2007_049. [DOI] [PubMed] [Google Scholar]
- 30.Nawshad A, Lagamba D, Polad A, et al. Transforming growth factor-beta signaling during epithelial-mesenchymal transformation: implications for embryogenesis and tumor metastasis. Cells Tissues Organs. 2005;179:11–23. doi: 10.1159/000084505. [DOI] [PubMed] [Google Scholar]
- 31.Thiery JP. Epithelial-mesenchymal transitions in development and pathologies. Curr Opin Cell Biol. 2003;15:740–6. doi: 10.1016/j.ceb.2003.10.006. [DOI] [PubMed] [Google Scholar]
Associated Data
This section collects any data citations, data availability statements, or supplementary materials included in this article.


