Abstract
Objective
To evaluate the effects of obesity-associated inflammation on influenza vaccine responses.
Methods
We measured in young and elderly individuals, both lean and with obesity, antibody responses to influenza vaccination.
Results
We found a decrease in in vivo vaccine responses, circulating switched memory and transitional B cells and an increase in pro-inflammatory late/exhausted memory B cells. In vitro B cell function was measured by activation-induced cytidine deaminase (AID) and E47, markers of optimal antibody responses. Moreover, IL-6 production was increased, whereas IL-10 production was decreased, in cultures of B cells from individuals with obesity. Markers of immune activation (TNF-α, TLR4, micro-RNAs) in unstimulated B cells were also found increased and were negatively correlated with B cell function. In order to reveal potential mechanisms, we stimulated B cells from lean individuals in vitro with leptin, the adipokine increased in obesity. Leptin increased phospho-STAT3, crucial for TNF-α production, and decreased phospho-AMPK, the energy sensing enzyme upstream of phospho-p38 MAPK and E47. Leptin-induced phospho-STAT3 and phospho-AMPK levels were similar to those in B cells from individuals with obesity.
Conclusions
These results demonstrate that leptin can be responsible for decreased B cell function in obesity.
Keywords: Aging, B cells, Obesity, Inflammation
Introduction
Obesity and obesity-related diseases are a significant risk to public health and the numbers of individuals with obesity in the US have increased dramatically in the last few years to affect 24–30% of the population (http://www.cdc.gov/obesity/data/prevalence-maps.html). Obesity is an inflammatory predisposition associated with chronic activation of cells of the innate immune system and consequent local and systemic inflammation, responsible for several pathologic conditions such as Type-2 Diabetes (T2D), cancer, atherosclerosis, Inflammatory Bowel Disease.
Most of the studies conducted so far support a crucial role for pro-inflammatory T cells and macrophages in promoting local inflammation in the visceral adipose tissue (VAT) leading to insulin resistance (IR). Adipose tissue inflammation is characterized by infiltration and activation of immune cells that produce cytokines and chemokines that contribute to the ongoing chronic inflammation that promotes the degradation of metabolic pathways in obesity. It has been shown that in obesity, IFN-γ-producing CD8+ and Th1 CD4+ T cells infiltrate VAT (1) and promote secretion of pro-inflammatory cytokines from M1 macrophages which contributes to both local and systemic IR (2). In lean individuals, conversely, IL-4/5/13 producing Th2 CD4+ T cells, CD4+ T regulatory (Tregs) and iNKT cells are predominant in the VAT and promote secretion of IL-10 and other anti-inflammatory cytokines from M2 macrophages which maintain insulin sensitivity (IS). There is increasing evidence that subcutaneous fat cells in the belly may be dangerous as well in promoting inflammation.
B cells have recently emerged as crucial players in regulating inflammation in murine VAT, by presenting antigens to T cells, secreting pro-inflammatory cytokines and secreting pathogenic antibodies (3). B cells can be activated by products of lipolysis in VAT to release pro-inflammatory mediators, contributing to local and systemic inflammation (4). B cells also support pro-inflammatory T cells (5).
Our laboratory has identified age-related defects in humoral B cell responses [reviewed in (6, 7)] and shown that intrinsic/autonomous defects in B cells compromise optimal antibody responses to vaccines. These defects include reduction in activation-induced cytidine deaminase (AID), the enzyme of class switch recombination (CSR) and somatic hypermutation (SHM), crucial for the generation of optimal antibody responses. We have shown that aging is characterized by systemic inflammation which increases TNF-α production by B cells and this significantly decreases their capacity to make protective antibodies in response to vaccination (8). Based on the published observation that there is increased serum TNF-α in obesity (5), we hypothesized that this chronic inflammation would contribute to B cell defects that are critical for optimal humoral immune responses in individuals with obesity and which would be important factors in their higher susceptibility to infectious diseases.
Methods
Participants
Participants were divided in 4 groups: lean (BMI<24.9) or with obesity (BMI≥30), young (20–40 years) and elderly (≥60 years). We have previously established that by 60 years of age we see deficits in all of the markers we measure in B cells [reviewed in (6, 7)]. We enrolled 9 individuals/group, after appropriate signed informed consent and IRB protocol #20070481 approval at the University of Miami. Each participant was asked a series of questions regarding demographics, his/her health behaviors, as well as questions regarding the presence of symptoms associated with inflammatory conditions or respiratory infections at the time of enrollment. No one reported subclinical inflammatory conditions and/or had any respiratory tract infection at the time of enrollment, nor was on any anti-inflammatory treatment. Participants were excluded if they had diseases or were taking medications known to alter the immune response. Demographic characteristics of the participants, as well as their serum pro-inflammatory profiles, are listed in Table 1.
Table 1.
Demographics and serum inflammation of the individuals participating in the study
| Young | Elderly | |||
|---|---|---|---|---|
| Lean | Obese | Lean | Obese | |
| Number | 8 | 6 | 8 | 4 |
| Age average in years (range) | 28 (22–40) | 30 (20–36) | 69 (63–75) | 66 (60–78) |
| Gender (M/F) | 4/4 | 3/3 | 3/5 | 1/3 |
| Race (W/B) | 10/1 | 9/2 | 7/1 | 2/2 |
| Ethnic groupsb (Hisp/Non Hisp) | 5/6 | 5/6 | 4/4 | 1/3 |
| BMI (mean Kg/m2±SE) | 22±1 | 36±4* | 21±2 | 34±3* |
| Blood Glucose (mg/dL) | 90±5 | 156±9** | 78±3 | 145±11* |
| TNF-α (pg/ml) | 4±1 | 11±2* | 14±2## | 31±6* |
| IL-6 (pg/ml) | 55±18 | 63±12* | 98±16# | 160±25* |
| CRP (pg/ml) | 560±100 | 935±75** | 1120±160## | 1900±175* |
| Leptin (pg/ml) | 440±115 | 955±90** | 833±95# | 1556±111* |
All races. Hispanic are individuals from Mexico, Puerto Rico, Cuba, Central/South America and from other countries with Spanish culture or origin.
Results are means±SE.
Type-2 Diabetic patients are excluded.
Metabolically healthy obese individuals are excluded.
**(p<0.01) and *(p<0.05) refer to differences between lean and obese individuals.
##(p<0.01) and #(p<0.05) refer to differences between young and elderly lean individuals.
Influenza vaccination
The study was conducted during the 2011–2012 and 2012–2013 influenza vaccine seasons, which were characterized by a vaccine containing the pandemic (p)2009 H1N1 strain for the third and fourth consecutive year, respectively. The 2011–2012 vaccine contained the following strains: A/California/7/2009 (H1N1), A/Perth/16/2009 (H3N2), B/Brisbane/60/2008. The 2012–2013 vaccine contained A/California/7/2009 (H1N1), A/Perth/16/2009 (H3N2), B/Wisconsin/1/2010-like. Blood samples were collected before (t0), 1 (t7) and 4–6 (t28) weeks after vaccination. All our subjects were previously immunized and seroprotected at t0 (except 5 elderly).
Hemagglutination inhibition (HAI) assay
The HAI assay is based on the ability of certain viruses or viral components to hemagglutinate the red blood cells of specific animal species. Antibodies specific for influenza antigens can inhibit this agglutination. Paired pre- and post-immunization serum samples from the same individual were tested simultaneously to evaluate antibody production to the vaccine (and therefore to all viral strains present in the vaccine). Serum inhibiting titers of 1/40 or greater are the defined positive measure of seroprotection against infection.
PBMC collection and stimulation
PBMCs were collected by density gradient centrifugation using Vacutainer CPT tubes (BD 362761), washed three times with PBS, stimulated with plate-bound anti-CD3 (eBioscience 16-0037-85) (1 µg/ml) for 48 hrs, then supernatants collected for the quantification of T cell cytokines.
B cell enrichment and RNA extraction from unstimulated B cells
B cells were isolated from PBMCs with anti-CD19 Microbeads (Miltenyi Biotech) according to manufacturer’s instructions. At the end of the purification procedure, cells were >97% CD19+ by cytofluorimetric analysis. After isolation, cells were maintained in serum-free medium for 1 hr at 4°C to minimize potential effects of anti-CD19 antibodies on B cell activation. B cells were resuspended in TRIzol (Ambion) (106 cells in 100 µl), and RNA extracted for quantitative (q)PCR to evaluate miRs.
B cell culture
B cells were cultured in complete medium (RPMI 1640, supplemented with 10% FCS, 10 µg/ml Pen-Strep, 2×10⁻⁵ M 2-ME and 2 mM L-glutamine). B cells (106/ml medium) were stimulated 1–5 days with 1 µg/106 cells of CpG (ODN 2006 In Vivogen) or with 1 µg/106 cells of Lypopolysaccharide (LPS). Cells were harvested and mRNA extracted with µMACS mRNA isolation kit (Miltenyi Biotec) for qPCR to evaluate E47 (1-day stimulation) and AID (5-day stimulation) mRNA expression. To measure IL-10 production, B cells (106/ml medium) were stimulated 2 days with 1 µg/106 cells of CpG and 10 µg/106 cells of anti-Ig (Jackson 109-006-006). To evaluate RNA stability, RNA transcription was blocked in cultures of CpG-stimulated B cells by Actinomycin D (10 µg/ml). After 45 minutes, mRNA was extracted.
Quantitative (q)PCR
Reactions were conducted in MicroAmp 96-well plates (Life Technologies, ABI N8010560) and run in the ABI 7300 machine. Calculations were made with ABI software. Reagents and primers (Taqman) are from Life Technologies. Primers are: E47 (TCF3) Hs00413032_m1, AID Hs00221068_m1, GAPDH Hs99999905_m1, TLR4 Hs00152939_m1. For miRs quantification, RNA was reverse transcribed in the presence of specific primers, then cDNA was amplified using miR-155-5p 002623, miR-16-5p 000391, U6 001973.
Flow Cytometry
One hundred µl of blood were stained for 20 min at room temperature. Red blood cells were lysed using the RBC Lysing Solution (BD). For intracellular TNF-α, cells were fixed and permeabilized with 1X-PBS/0.2%Tween. Up to 105 events in the lymphocyte gate were acquired on an LSR-Fortessa (BD) and analyzed using FACS Diva software.
Enzyme-linked immunoabsorbent assay (ELISA)
Serum TNF-α/IL-6/CRP were measured by Life Technologies kits KHC3013/KHC0062/KHA0032. IL-6/IL-10/IL-17/IFN-γ in culture supernatants were measured by Life Technologies kits KHC0062/KHC0104/KAC1591/KHC4021. IgG in culture supernatants were measured by Bethyl kit E80-104.
Statistical analyses
Data were examined for distributions that violated the assumptions required for parametric analyses and missingness. To examine differences between groups, Student’s t tests (two-tailed) were used and are shown in all Figs. To examine the relationships between variables, bivariate Pearson’s correlation analyses were performed, using GraphPad Prism 5 software. Because power demands were not met with the majority of the analyses, we conclude that there is little stability in the estimates for the two-way ANOVA models we present here. In each analysis where power demands were not met, we describe the results of t-tests which allowed sufficient power to observe group differences, despite a non-significant omnibus ANOVA. This applies to Figs. 2B/D/E, 3A/B/C/D/E, 4A/C, 5A/E/F.
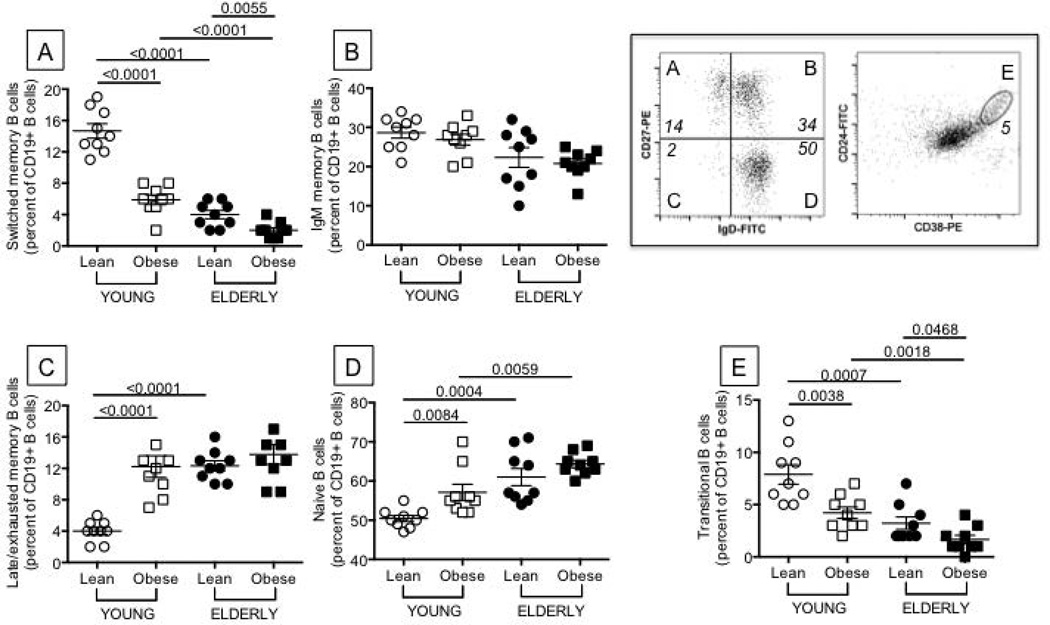
Figure 2. Obesity decreases the percentage of switched memory and transitional B cells and increases that of late/exhausted memory B cells.
One hundred µl of blood from the same individuals as in Figure 1 were stained for 20 min at room temperature with the following antibodies: anti-CD19 (BD 555415), anti-CD27 (BD 555441), and anti-IgD (BD 555778) to measure switched memory (IgD-CD27+), IgM memory (IgD+CD27+), naive (IgD+CD27−), late/exhausted memory (IgD-CD27−) B cells. Anti-CD24 (BD 555427) and anti-CD38 (BD 555460) antibodies were used to measure transitional B cells (CD24brightCD38bright). Switched memory (A) are IgD-CD27+, IgM memory (B) are IgD+CD27+, naive (C) are IgD+CD27−, late/exhausted memory (D) are IgD-CD27−, transitional B cells (E) are CD24brightCD38bright. Results are expressed as percentages of CD19+ B cells. Representative dot plots to evaluate the different subsets are shown in the top right quadrant of the Figure (both are from a lean young individual). B cell percentages and numbers are decreased by obesity in young and elderly individuals. Percentages and numbers are, respectively: 17% and 425 cells/µl (lean young), 12% and 287 cells/µl (young with obesity), 5% and 125 cells/µl (lean elderly) and 3% and 69 cells/µl (elderly with obesity). ANOVA - A: F(3,36)=35.37,p<.01, observed power=1. B: F(3,36)=0.05,p=.94, observed power=.051. C: F(3,36)=1.304,p=.26, observed power=.20. D: F(3,36)=23.19,p<.01, observed power=.997. E: F(3,36)=3.98,p=.054, observed power=.49.
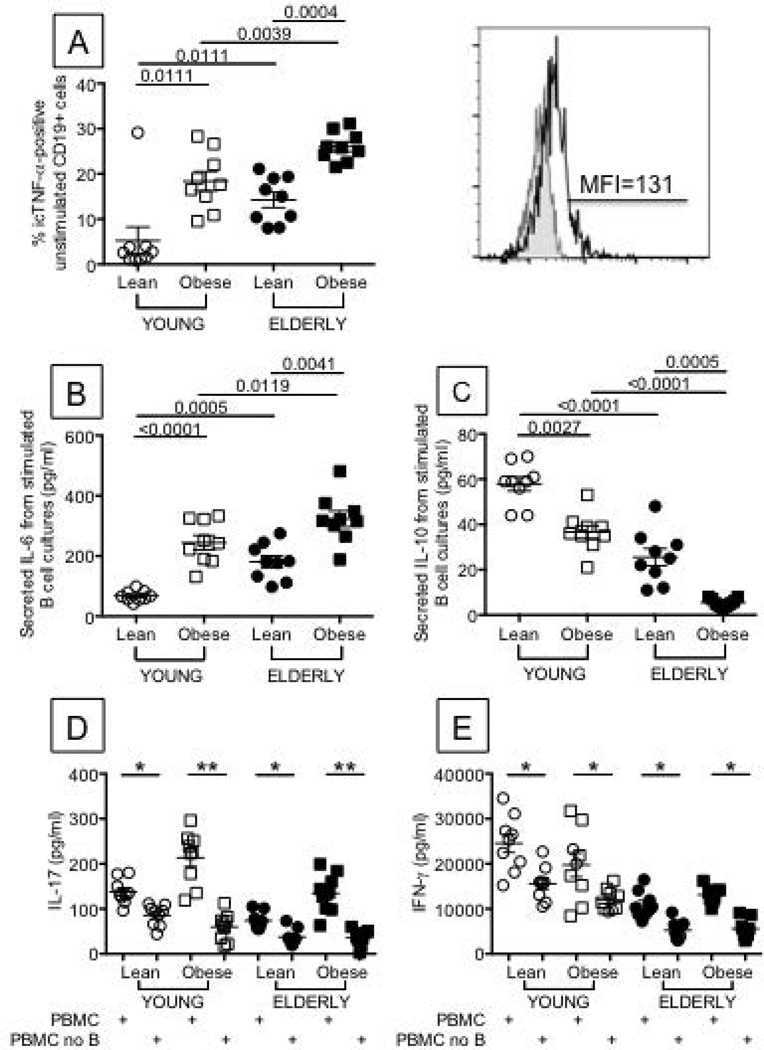
Figure 3. Obesity increases pro-inflammatory cytokines and decreases anti-inflammatory cytokines in ex vivo and in vitro-stimulated B cells from young and elderly individuals.
A. One hundred µl of blood from the same individuals as in Figure 1 were stained with anti-CD19 (BD 555415), then fixed, permeabilized with 1X-PBS/0.2%Tween 20, and incubated with anti-TNF-α (BD 554512). Results are expressed as percentages of CD19+ B cells expressing icTNF-α. A representative histogram of icTNF-α staining (from a young individual with obesity) is shown right of A. MFI values are, respectively: 43±2 (lean young), 138±11 (young with obesity), 133±20 (lean elderly) and 251±9 (elderly with obesity). B. and C. B cells (106 cells/ml) from the same individuals as in Figure 1, were cultured with CpG and anti-Ig antibodies for 2 days. Cultures were harvested and supernatants tested for IL-6 (B) and IL-10 (C) production by ELISA. D and E. PBMCs were stimulated for 48 hrs with plate-bound anti-CD3 in the presence or absence of B cells, which were removed by magnetic sorting using CD19 microbeads (<0.1% B cells in PBMC after selection). IL-17 (D) and IFN-γ (E) were measured in culture supernatants by ELISA. In a pilot experiment, we have stimulated sorted B cells for 48 hrs with plate-bound anti-CD3 and neither IL-17 nor IFN-γ were found in culture supernatants (<2 pg/ml and <4 pg/ml, respectively, data not shown). In another pilot experiment, performed with PBMC from 2 young with obesity and 2 elderly with obesity, B cells were added back to the B cell-depleted PBMC. IL-17 production was similar to that observed in undepleted PBMC cultures (data not shown). *p<0.05, **p<0.01. ANOVA - A: F(3,36)=.131,p=.72, observed power=.064. B: F(3,36)=.847,p=.363, observed power=.146. C: F(3,36)=.057,p=.812, observed power=.056. D (PBMC): F(3,36)=.315,p=.58, observed power=.085. D (PBMC no B): F(3,36)=2.442,p=.13, observed power=.33. E (PBMC): F(3,36)=3.96,p=.06, observed power=.49. E (PBMC no B): F(3,36)=4.944,p=.033, observed power=.578.
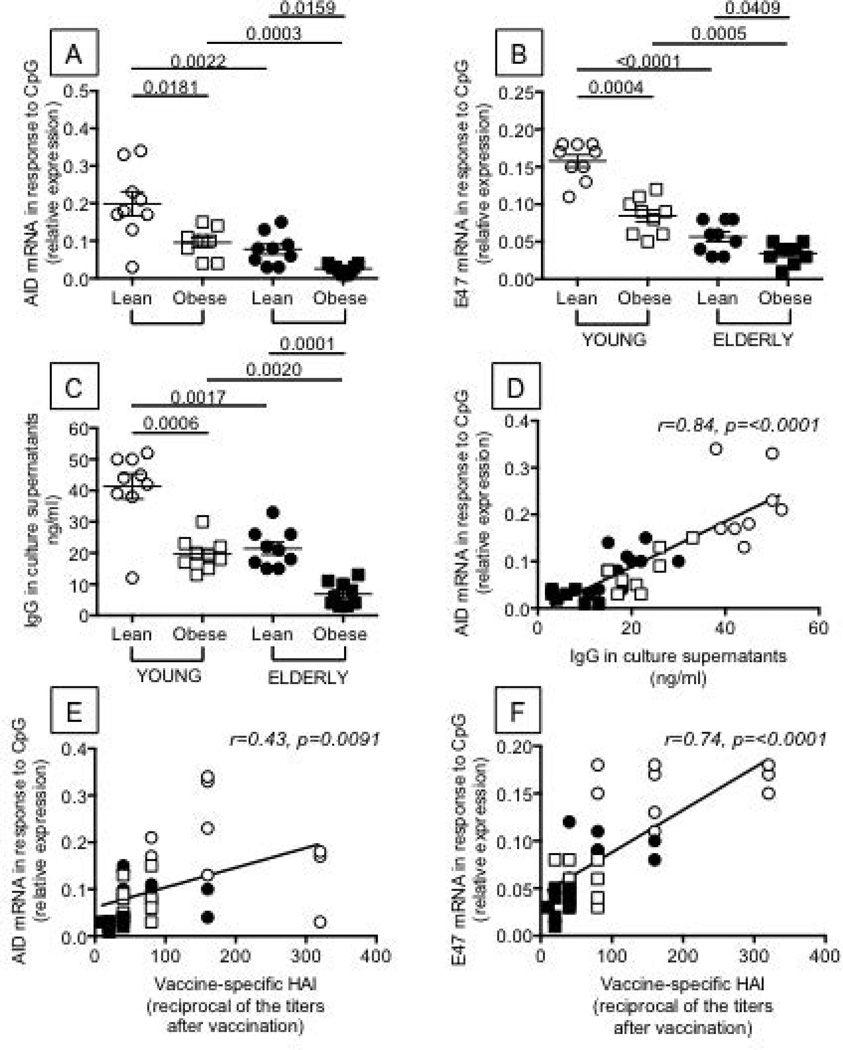
Figure 4. Obesity decreases AID, E47 and IgG production in B cells from both young and elderly individuals.
B cells (106 cells/ml) from the same individuals as in Figure 1 were isolated from the peripheral blood using CD19 microbeads and positive selection. Flow cytometry analysis of sorted B cell subsets shows that the relative percentages of the different B cell subsets are maintained after magnetic sorting (not shown). Using anti-CD3 and anti-CD14 antibodies, contamination with T cells and monocytes is usually less than 3%. In a pilot experiment, we have also stimulated the magnetically-sorted B cells with plate-bound anti-CD3 or LPS and found no IL-2/IFN-γ production and no TNF-α production in culture supernatants by T cells or monocytes, respectively (data not shown). B cells were cultured with CpG for 1 and 5 days to measure E47 and AID, respectively. Results show qPCR values (2−ΔΔCt) of AID (A) and E47 (B) mRNA expression normalized to GAPDH±SE. C. IgG production was measured in culture supernatants by ELISA. D. The in vivo response (HAI) is positively correlated with AID. E. The in vivo response (HAI) is positively correlated with E47. ANOVA - A: F(3,36)=2.332,p=.135, observed power=3.18. B: F(3,36)=16.08,p<.0001, observed power=.974. C: F(3,36)=2.58,p=.12, observed power=.346.
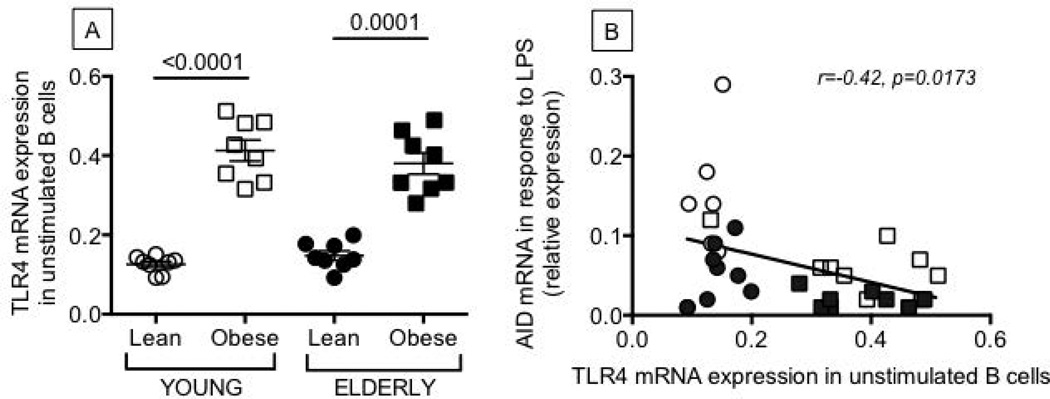
Figure 5. Unstimulated B cells from young and elderly individuals with obesity have higher levels of expression of TLR4 than lean controls.
B cells were isolated from the peripheral blood of the same individuals as in Figure 1, and mRNA extracted to evaluate TLR4 (A) mRNA expression. Results are expressed as qPCR values (2−ΔΔCt) of TLR4 mRNA normalized to GAPDH. B. TLR4 in unstimulated B cells and AID in the same B cells after stimulation with LPS are negatively correlated. ANOVA - A: F(3,36)=2.358,p=.134, observed power=.32.
Results
Obesity is associated with attenuated influenza vaccine responses
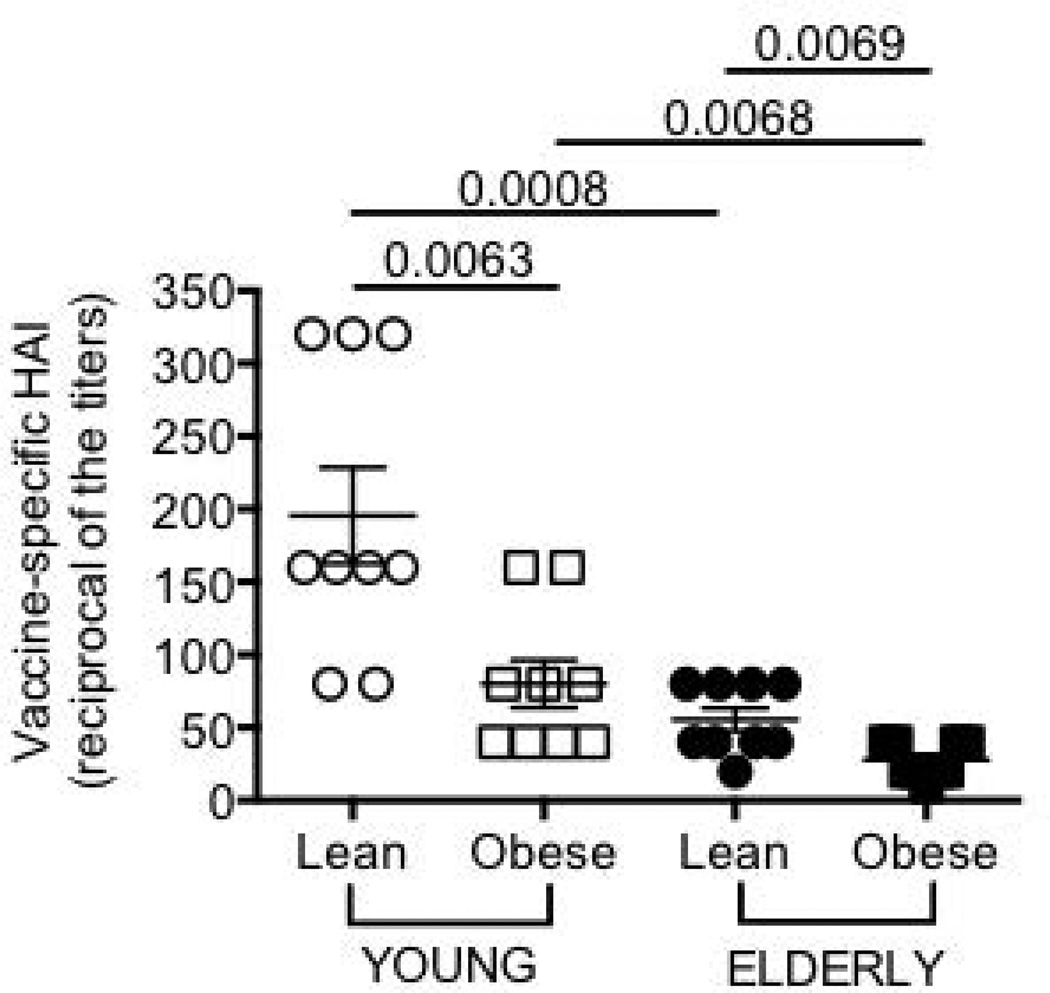
We tested the serum response to the influenza vaccine by HAI assay which is the best correlate for vaccine protection. Results in Fig. 1 show that obesity is significantly associated with decreased in vivo response to the vaccine in both young and elderly individuals. The peak of the response was earlier (t7) as compared to what is usually seen (t28) because of repeated immunizations with a vaccine containing the pandemic (p)2009 H1N1 strain for the third consecutive year. For the same reason, almost all individuals were seroprotected at t0 (not shown).
Figure 1. Obesity decreases the influenza vaccine response in young and elderly individuals.
Sera were collected before (t0) and after vaccination (t7), and analyzed by HAI assay. To evaluate antibody production to the vaccine (and therefore to all viral strains present in the vaccine), the reciprocal of the titers after vaccination is shown. The response peaked at t7 and decreased only minimally at t28. The reciprocal of the titers decreased from 196 to 160 (lean young), from 80 to 62 (young with obesity), from 56 to 51 (lean elderly) and from 28 to 23 (elderly with obesity). ANOVA: F(3,36)=6.719,p<.05, observed power=.713
Obesity is associated with a decreased percentage of switched memory and transitional B cells and an increased percentage of pro-inflammatory late/exhausted memory B cells
The composition of the B cell pool influences the individual’s immune/vaccine response and particular subsets are more inflammatory [late/exhausted memory (9)] whereas other are anti-inflammatory [transitional (10)]. We measured the ex vivo percentages of switched memory, IgM memory, late/exhausted memory, naïve, transitional B cell subsets. Results in Fig. 2 show that obesity significantly decreases the ex vivo percentages of switched memory B cells (Fig. 2A) which are also lower in lean elderly as compared to lean young individuals, as we have previously reported (8, 11, 12, 13). No effect of obesity on IgM memory B cells was observed (Fig. 2B). Obesity increases the ex vivo percentages of late/exhausted memory B cells (Fig. 2C), the pro-inflammatory B cell subset, in young individuals only, and the percentages of this subset in young individuals with obesity are comparable to those observed in all elderly individuals. Late/exhausted memory B cells are also significantly increased in lean elderly as compared to lean young individuals, as we have previously shown (14). A small effect of obesity was observed on naïve B cells (Fig. 2D). Transitional B cells, the anti-inflammatory B cells (Fig. 2E), are decreased in the blood of both young and elderly individuals with obesity as compared to lean controls.
Obesity is associated with an increased production of pro-inflammatory cytokines and a decreased production of anti-inflammatory cytokines in cultured B cells
Not only the phenotypic composition but also the functional quality of the B cell pool influences the individual’s response. We have previously demonstrated that unstimulated B cells from elderly individuals make significantly higher levels of TNF-α, measured by icTNF-α, than those from young individuals, and these positively correlate with serum TNF-α and negatively correlate with B cell function (8). Here, we confirmed these results and also extended them by showing that significantly higher percentages of unstimulated B cells from individuals with obesity make icTNF-α as compared to lean controls (Fig. 3A).
We also measured the production of pro- and anti-inflammatory cytokines by B cells, after in vitro stimulation of B cells with CpG and anti-Ig, which are optimal stimuli for IL-10 production (15). Results show that B cells from individuals with obesity make more IL-6 (Fig. 3B) and less IL-10 than lean controls (Fig. 3C).
B cells from individuals with obesity support T cell inflammation
It has recently been shown that murine and human B cells are critical regulators of inflammation in patients with T2D by supporting pro-inflammatory T cells (5). We wanted to check if this was also true in individuals with obesity. Results in Fig. 3 also show that aging decreases IL-17 and IFN-γ production and that the removal of B cells from PBMC cultures of young and elderly individuals significantly reduces the secretion of both IL-17 (Fig. 3D) and IFN-γ (Fig. 3E), suggesting that the interaction between T and B cells (and perhaps monocytes) is crucial for the secretion of these inflammatory cytokines. This is especially true for participants in the obese condition.
Obesity is associated with decreased AID and E47 in cultured B cells
AID is a marker of optimal B cell responses, as it is necessary for CSR and SHM and is therefore critical for optimal effector functions of the antibodies and for the ability to generate optimal memory B cells. AID is transcriptionally regulated by E47, encoded by the E2A gene, crucial for all processes generating antibody diversity, such as V(D)J recombination, CSR and SHM (16, 17, 18, 19, 20). Results show that B cells from individuals with obesity, both young and elderly, make significantly less AID (Fig. 4A), E47 (Fig. 4B) and IgG in culture supernatants (Fig. 4C) as compared to lean controls, and IgG levels are significantly correlated with AID (Fig. 4D). AID and E47 are also significantly decreased in lean elderly as compared to lean young individuals. When we compare the in vivo response (HAI) to AID and E47 values, we see positive correlations in both cases (Fig.4E and 4F, respectively).
Unstimulated B cells from individuals with obesity have higher levels of expression of TLR4
Obesity is a condition characterized by low-grade chronic inflammation, possibly triggered by activation of TLRs which are activated by fatty acids and endotoxinemia (a marker of gut permeability) (23, 24), resulting in activation of NF-kB and increased release of pro-inflammatory mediators such as IL-6, IL-1β, TNF-α, MCP-1 (25, 26), which play a role in the pathophysiology of obesity. To investigate potential mechanisms for increased inflammation in B cells from individuals with obesity, we measured TLR4 expression on unstimulated B cells. Results in Fig. 5 show that unstimulated B cells from individuals with obesity express significantly higher levels of TLR4 (Fig. 5A) than those from lean controls. In lean individuals, TLR4 expression is comparable, as we have previously published (12). In all individuals, levels of TLR4 in unstimulated B cells were negatively associated with AID in the same B cells after stimulation with the TLR4-agonist LPS (Fig. 5B).
Unstimulated B cells from individuals with obesity have higher levels of expression of miR-155 and miR-16
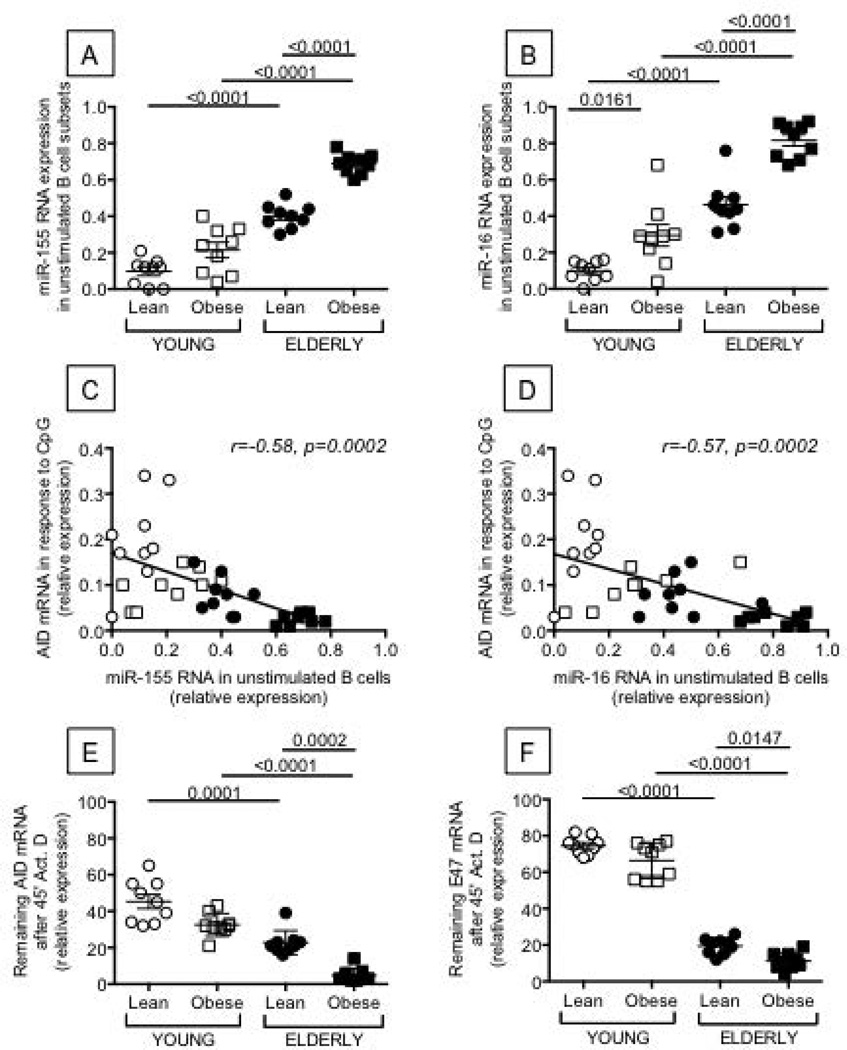
We have recently demonstrated that particular inflammatory miRs contribute to decreased AID in B cells from healthy elderly individuals (27) through at least 2 mechanisms: 1) the direct interaction of miR-155 with the 3’-untranslated region (UTR) of AID mRNA, leading to its degradation, and 2) the direct interaction of miR-16 with the 3’-UTR of E47, the transcriptional activator of AID (19). Results in Fig. 6 confirm our published results showing higher expression of miR-155 and miR-16 in unstimulated B cells from elderly individuals as compared to young controls and extend these findings obtained in a different cohort showing that RNA expression of miR-155 (Fig. 6A) and miR-16 (Fig. 6B) is significantly higher in elderly individuals with obesity. In young individuals, a trend was seen for miR-155 (p=0.15) and significance was reached for miR-16. In all individuals, levels of miR-155 and miR-16 in unstimulated B cells were negatively associated with AID in the same B cells after stimulation with CpG (Fig. 6C and D, respectively).
Figure 6. The expression of miR-155 and miR-16 is higher in unstimulated B cells from young and elderly individuals with obesity as compared to lean controls and is negatively correlated with AID.
B cells were isolated from the peripheral blood of the same individuals as in Figure 1. Trizol was added to the pellets of unstimulated B cells (1 ml/106 B cells). RNA was extracted, RT reactions performed in the presence of specific primers for miR-155, miR-16, or U6 (control), and qPCR performed to evaluate expression levels of miR-155 (A) and miR-16 (B). Results are expressed as ratio miR:U6 levels. C. miR-155 in unstimulated B cells and AID in the same B cells after stimulation are negatively correlated. D. miR-16 in unstimulated B cells and AID in the same B cells after stimulation are negatively correlated. E. AID mRNA stability is decreased in B cells from elderly with obesity as compared to lean elderly individuals. B cells (106 cells/ml) were stimulated with CpG for 5 days. At the end of the stimulation time, RNA transcription was blocked by Actinomycin D (10 µg/ml). After 45 minutes, cells were harvested, RNA extracted and qPCR performed. Results are expressed as percentages of the samples untreated with Actinomycin D. F. E47 mRNA stability is decreased in B cells from elderly with obesity as compared to lean elderly individuals. B cells were processed as in E. ANOVA - A: F(3,36)=11.454,p=.002, observed power=.91. B: F(3,36)=4.62,p=.038, observed power=.552. E: F(3,36)=1.31,p=.26, observed power=.20. F: F(3,36)=.00,p=1.0, observed power=.05.
We also measured the mRNA stability of AID and E47. Results in Fig. 6 (E and F) show that the mRNA stability of both AID and E47 was significantly lower in stimulated B cells from elderly individuals with obesity, mimicking the increase in miR-155. Again, no significant differences were observed in young individuals.
Is leptin inducing intrinsic B cell inflammation?
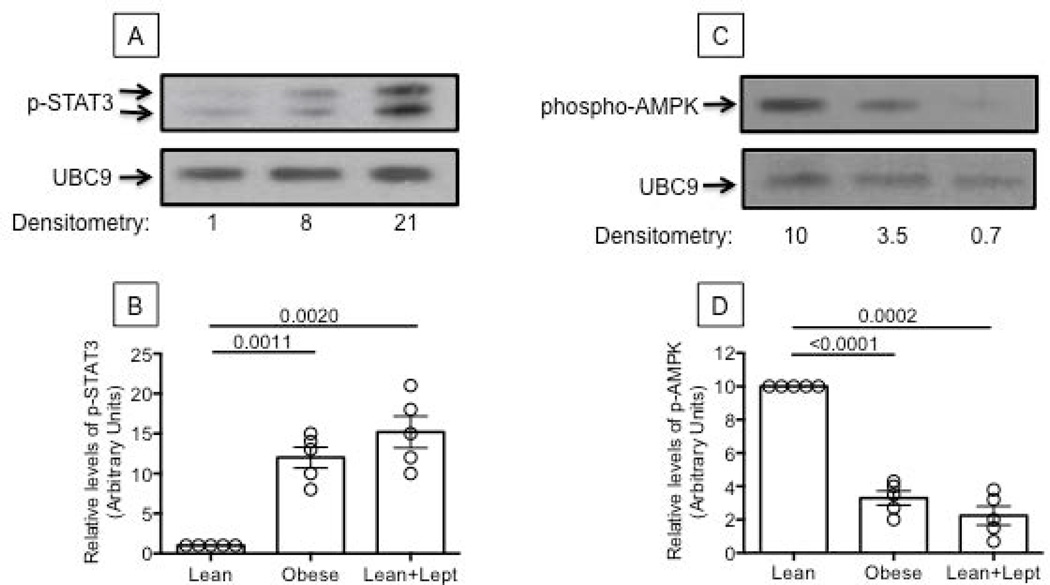
In order to reveal potential mechanisms responsible for increased B cell inflammation in individuals with obesity, we stimulated B cells from lean young individuals in vitro with leptin and compared B cell function with that from young individuals either lean or with obesity. Leptin is an adipocyte-derived cytokine linking nutritional status with neuroendocrine and immune functions whose plasma levels correlate with the amount of body fat. High serum levels of leptin contribute to the inflammatory state of the adipose tissue associated with obesity (28) and are a warning sign of energy imbalance, hyper-insulinemia, IR and other metabolic risk factors associated with T2D. An attenuation of leptin signaling, despite high circulating leptin levels, is a common consequence of obesity and has been proposed to impair innate and adaptive immune responses. When leptin signaling is attenuated, however, cells can still up-regulate pathways leading to TNF-α production (STAT3) in response to inflammatory signals (IL-6/17) (29). Although leptin is not the only cytokine up-regulated in obesity, we used it in in vitro studies to induce B cell intrinsic inflammation because of its potent pro-inflammatory effects on macrophages and T cells. We are aware that other molecules upregulated by obesity might be as effective as leptin. Results in Fig. 7 (A/B) show that leptin induces phospho-STAT3 in B cells from young lean individuals similar to levels in B cells from young individuals with obesity.
Figure 7. Leptin increases phospho-STAT3 and decreases phospho-AMPK in B cells from young lean individuals.
A. Nuclear protein extracts from unstimulated B cells from one lean (left) and one young individual with obesity (middle) were analyzed in Western blot to evaluate phospho-STAT3. B cells from the lean individual were also stimulated with leptin (100 ng/106 cells) for 15 min (right). UBC9 was used as loading control. B. Densitometry (arbitrary units) of phospho-STAT3 (both bands), normalized to UBC9, from 5 young lean and 5 young individuals with obesity. Results refer to normalized phospho-STAT3 in young lean individuals, taken as 1. C. Cytoplasmic extracts from B cells from the same individuals in A and B were analyzed in Western blot to evaluate phospho-AMPK. UBC9 was used as loading control. D. Densitometry (arbitrary units) of phospho-AMPK, normalized to UBC9. Results refer to normalized phospho-AMPK in young lean individuals, taken as 10. ANOVA - B: F(3,36)=.000,p=107.174, observed power=1.00. D: F(3,36)=.000,p=29.511, observed power=1.00.
We next measured AMPK (AMP-activated protein kinase), a serine-threonine kinase ubiquitously expressed in mammalian cells, which is activated when cellular energy is low. Upon activation, AMPK signaling restores normal energy levels by stimulating ATP synthesis and inhibiting ATP usage (30). In this way, AMPK activation by phosphorylation improves insulin sensitivity and glucose homeostasis. The anti-diabetic drug Metformin has been shown to be an activator of AMPK (31). We found that AMPK phosphorylation is reduced in B cells from young lean individuals incubated in vitro with leptin, similar to the reduction in B cells from individuals with obesity (Fig. 7, C/D). This represents an additional pathway for E47/AID/CSR regulation, as phospho-AMPK is upstream of phospho-p38 MAPK, crucial for E47 activation, as previously shown in murine B cells (32). E47 mRNA expression was decreased in cultures of B cells from lean individuals incubated for 24 hrs with CpG+leptin as compared to CpG-stimulated cultures (not shown).
Discussion
Results herein demonstrate that obesity affects B cell function in both young and elderly individuals and provide some mechanisms to explain how this may occur. Further investigations in this area of human immunology are well warranted. Obesity is associated with increased susceptibility to bacterial, fungal and viral infections (33), with higher mortality for influenza-related respiratory complications (34), with poor responses to the Hepatitis B (35) and influenza vaccines (36) and with post-surgical infections (37, 38).
In line with our previously published observations that icTNF-α is a marker of immune activation and that its levels of expression in unstimulated B cells negatively correlate with the function of the same B cells after in vitro stimulation and with the antibody response to the influenza vaccine (8), we identified novel markers of immune activation which can be used to predict B cell function, measured by AID and its transcriptional activator E47. We found that unstimulated B cells from individuals with obesity, both young and elderly, express not only higher levels of icTNF-α, but also higher levels of TLR4 than lean individuals, whereas miR-155 and miR-16 are expressed at higher levels only in the elderly. All these are associated with inflammation and are negatively correlated with AID and E47 after in vitro stimulation, supporting our hypothesis that initial immune activation negatively impacts the ability of B cells to generate optimal responses. Immune activation has been shown to play a significant role in the down-regulation of cellular and humoral immune responses to vaccines in both healthy and HIV-infected individuals (39). Our results are the first to show that higher icTNF-α expression in ex vivo-isolated, unstimulated B cells from individuals with obesity are negatively associated with AID, which should negatively impact their humoral response.
Our results herein are also the first to show that higher basal TLR4 expression in young subjects with obesity as compared with lean young subjects negatively associates with AID, suggesting that TLR4 may be among the markers of immune activation and therefore may be predictive of lower B cell responses. This higher expression of TLRs may also be responsible for higher pro-inflammatory cytokine production in these individuals.
We also propose miR-155 and miR-16 as markers of immune activation, especially in elderly individuals with obesity and found that the basal levels of miR-155 and miR-16 in ex vivo-isolated B cells are negatively correlated with B cell function, measured by AID and E47.
We propose that leptin, the adipokine increased in obesity, may be responsible for most of B cell intrinsic inflammation in these subjects as we have shown that it not only increases STAT3 phosphorylation, crucial for TNF-α production, but also decreases AMPK phosphorylation, crucial for E47 activation through p38 MAPK phosphorylation.
Although further studies need to be done, our results clearly demonstrate that obesity impairs B cell function in both young and elderly individuals. We have shown that B cells from both young and elderly individuals with obesity, as compared to lean individuals, have impaired function, as measured by AID and E47 in response to CpG stimulation, and they secrete more pro-inflammatory and less anti-inflammatory cytokines in culture supernatants. Before stimulation, B cells from these individuals show higher immune activation, as measured by increased levels of icTNF-α, TLRs and inflamma-miRs, all of which negatively associate with AID expression. B cells from young and elderly individuals with obesity also support the production of the pro-inflammatory cytokines IL-17 and IFN-γ in T cells. These results suggest the possibility that targeting B cells through diet and/or pharmacological intervention may be able to reverse the inflammatory conditions in these cells and improve their immune response.
What is already known about this subject?
Obesity is associated with increased susceptibility to bacterial, fungal and viral infections and with poor responses to vaccines.
Studies in mice have shown that the absence of B cells is associated with reduced systemic inflammation and immune activation in response to obesity.
High systemic inflammation and immune activation are negatively associated with optimal humoral responses in both humans and mice.
What does this study add?
This study characterizes cells and molecules involved in the poor antibody response of obese individuals to the influenza vaccine.
This study identifies novel markers of immune activation which are negatively correlated with the response to the influenza vaccine.
This study shows that leptin signaling increases B cell intrinsic inflammation and decreases the activation of pathways known to lead to optimal antibody responses.
Acknowledgements
We thank the volunteers who participated in this study, the personnel of the Department of Family Medicine and Common Health at the University of Miami Miller School of Medicine, in particular Dr. Robert Schwartz, chairman for the recruitment of healthy volunteers; and the SCCC Flow Cytometry Core Resource.
Funding: NIH AG32576 (BBB), NIH AI096446 and AG042826 (BBB and DF).
Footnotes
Disclosure: No potential conflicts of interest relevant to this article are reported.
Author contributions: DF, FF, AD, MR, BBB conceived the experiments. DF, FF, AD, MR carried out the experiments and analyzed data. SL performed statistical analyses. All authors were involved in writing the paper and had final approval of the submitted and published versions.
REFERENCES
- 1.Nishimura S, Manabe I, Nagasaki M, Eto K, Yamashita H, Ohsugi M, et al. CD8+ effector T cells contribute to macrophage recruitment and adipose tissue inflammation in obesity. Nature medicine. 2009;15:914–920. doi: 10.1038/nm.1964. [DOI] [PubMed] [Google Scholar]
- 2.Lumeng CN, Bodzin JL, Saltiel AR. Obesity induces a phenotypic switch in adipose tissue macrophage polarization. J Clin Invest. 2007;117:175–184. doi: 10.1172/JCI29881. [DOI] [PMC free article] [PubMed] [Google Scholar]
- 3.Winer DA, Winer S, Shen L, Wadia PP, Yantha J, Paltser G, et al. B cells promote insulin resistance through modulation of T cells and production of pathogenic IgG antibodies. Nature medicine. 2011;17:610–617. doi: 10.1038/nm.2353. [DOI] [PMC free article] [PubMed] [Google Scholar]
- 4.Nikolajczyk BS. B cells as under-appreciated mediators of non-auto-immune inflammatory disease. Cytokine. 2010;50:234–242. doi: 10.1016/j.cyto.2010.02.022. [DOI] [PMC free article] [PubMed] [Google Scholar]
- 5.DeFuria J, Belkina AC, Jagannathan-Bogdan M, Snyder-Cappione J, Carr JD, Nersesova YR, et al. B cells promote inflammation in obesity and type 2 diabetes through regulation of T-cell function and an inflammatory cytokine profile. Proc Natl Acad Sci U S A. 2013;110:5133–5138. doi: 10.1073/pnas.1215840110. [DOI] [PMC free article] [PubMed] [Google Scholar]
- 6.Blomberg BB, Frasca D. Age effects on mouse and human B cells. Immunologic research. 2013;57:354–360. doi: 10.1007/s12026-013-8440-9. [DOI] [PMC free article] [PubMed] [Google Scholar]
- 7.Frasca D, Blomberg BB. B cell function and influenza vaccine responses in healthy aging and disease. Curr Opin Immunol. 2014;29:112–118. doi: 10.1016/j.coi.2014.05.008. [DOI] [PMC free article] [PubMed] [Google Scholar]
- 8.Frasca D, Diaz A, Romero M, Landin AM, Blomberg BB. High TNF-alpha levels in resting B cells negatively correlate with their response. Exp Gerontol. 2014;54:116–122. doi: 10.1016/j.exger.2014.01.004. [DOI] [PMC free article] [PubMed] [Google Scholar]
- 9.Buffa S, Pellicano M, Bulati M, Martorana A, Goldeck D, Caruso C, et al. A novel B cell population revealed by a CD38/CD24 gating strategy: CD38(−)CD24 (−) B cells in centenarian offspring and elderly people. Age. 2013;35:2009–2024. doi: 10.1007/s11357-012-9488-5. [DOI] [PMC free article] [PubMed] [Google Scholar]
- 10.Duggal NA, Upton J, Phillips AC, Sapey E, Lord JM. An age-related numerical and functional deficit in CD19(+) CD24(hi) CD38(hi) B cells is associated with an increase in systemic autoimmunity. Aging Cell. 2013;12:873–881. doi: 10.1111/acel.12114. [DOI] [PMC free article] [PubMed] [Google Scholar]
- 11.Frasca D, Diaz A, Romero M, Landin AM, Phillips M, Lechner SC, et al. Intrinsic defects in B cell response to seasonal influenza vaccination in elderly humans. Vaccine. 2010;28:8077–8084. doi: 10.1016/j.vaccine.2010.10.023. [DOI] [PMC free article] [PubMed] [Google Scholar]
- 12.Frasca D, Diaz A, Romero M, Mendez NV, Landin AM, Ryan JG, et al. Young and elderly patients with type 2 diabetes have optimal B cell responses to the seasonal influenza vaccine. Vaccine. 2013;31:3603–3610. doi: 10.1016/j.vaccine.2013.05.003. [DOI] [PMC free article] [PubMed] [Google Scholar]
- 13.Frasca D, Diaz A, Romero M, Phillips M, Mendez NV, Landin AM, et al. Unique biomarkers for B-cell function predict the serum response to pandemic H1N1 influenza vaccine. Int Immunol. 2012;24:175–182. doi: 10.1093/intimm/dxr123. [DOI] [PMC free article] [PubMed] [Google Scholar]
- 14.Frasca D, Diaz A, Romero M, Landin AM, Blomberg BB. Cytomegalovirus (CMV) seropositivity decreases B cell responses to the influenza vaccine. Vaccine. 2015;33:1433–1439. doi: 10.1016/j.vaccine.2015.01.071. [DOI] [PMC free article] [PubMed] [Google Scholar]
- 15.Bouaziz JD, Calbo S, Maho-Vaillant M, Saussine A, Bagot M, Bensussan A, et al. IL-10 produced by activated human B cells regulates CD4(+) T-cell activation in vitro. European journal of immunology. 2010;40:2686–2691. doi: 10.1002/eji.201040673. [DOI] [PubMed] [Google Scholar]
- 16.Goebel P, Janney N, Valenzuela JR, Romanow WJ, Murre C, Feeney AJ. Localized gene-specific induction of accessibility to V(D)J recombination induced by E2A and early B cell factor in nonlymphoid cells. J Exp Med. 2001;194:645–656. doi: 10.1084/jem.194.5.645. [DOI] [PMC free article] [PubMed] [Google Scholar]
- 17.Quong MW, Harris DP, Swain SL, Murre C. E2A activity is induced during B-cell activation to promote immunoglobulin class switch recombination. EMBO J. 1999;18:6307–6318. doi: 10.1093/emboj/18.22.6307. [DOI] [PMC free article] [PubMed] [Google Scholar]
- 18.Quong MW, Romanow WJ, Murre C. E protein function in lymphocyte development. Annual review of immunology. 2002;20:301–322. doi: 10.1146/annurev.immunol.20.092501.162048. [DOI] [PubMed] [Google Scholar]
- 19.Sayegh CE, Quong MW, Agata Y, Murre C. E-proteins directly regulate expression of activation-induced deaminase in mature B cells. Nat Immunol. 2003;4:586–593. doi: 10.1038/ni923. [DOI] [PubMed] [Google Scholar]
- 20.Schlissel M, Voronova A, Baltimore D. Helix-loop-helix transcription factor E47 activates germ-line immunoglobulin heavy-chain gene transcription and rearrangement in a pre-T-cell line. Genes Dev. 1991;5:1367–1376. doi: 10.1101/gad.5.8.1367. [DOI] [PubMed] [Google Scholar]
- 21.Frasca D, Landin AM, Lechner SC, Ryan JG, Schwartz R, Riley RL, et al. Aging down-regulates the transcription factor E2A, activation-induced cytidine deaminase, and Ig class switch in human B cells. J Immunol. 2008;180:5283–5290. doi: 10.4049/jimmunol.180.8.5283. [DOI] [PubMed] [Google Scholar]
- 22.Frasca D, Diaz A, Romero M, Mendez NV, Landin AM, Blomberg BB. Effects of age on H1N1-specific serum IgG1 and IgG3 levels evaluated during the 2011–2012 influenza vaccine season. Immun Ageing. 2013;10:14. doi: 10.1186/1742-4933-10-14. [DOI] [PMC free article] [PubMed] [Google Scholar]
- 23.Senn JJ. Toll-like receptor-2 is essential for the development of palmitate-induced insulin resistance in myotubes. J Biol Chem. 2006;281:26865–26875. doi: 10.1074/jbc.M513304200. [DOI] [PubMed] [Google Scholar]
- 24.Shi H, Kokoeva MV, Inouye K, Tzameli I, Yin H, Flier JS. TLR4 links innate immunity and fatty acid-induced insulin resistance. J Clin Invest. 2006;116:3015–3025. doi: 10.1172/JCI28898. [DOI] [PMC free article] [PubMed] [Google Scholar]
- 25.Bowie A, O'Neill LA. The interleukin-1 receptor/Toll-like receptor superfamily: signal generators for pro-inflammatory interleukins and microbial products. J Leukoc Biol. 2000;67:508–514. doi: 10.1002/jlb.67.4.508. [DOI] [PubMed] [Google Scholar]
- 26.Nikolajczyk BS, Jagannathan-Bogdan M, Shin H, Gyurko R. State of the union between metabolism and the immune system in type 2 diabetes. Genes and immunity. 2011;12:239–250. doi: 10.1038/gene.2011.14. [DOI] [PMC free article] [PubMed] [Google Scholar]
- 27.Frasca D, Diaz A, Romero M, Ferracci F, Blomberg BB. Micro-RNAs miR-155 and miR-16 decrease AID and E47 in B cells from elderly individuals. J Immunol in press. 2015 doi: 10.4049/jimmunol.1500520. [DOI] [PMC free article] [PubMed] [Google Scholar]
- 28.La Cava A, Matarese G. The weight of leptin in immunity. Nat Rev Immunol. 2004;4:371–379. doi: 10.1038/nri1350. [DOI] [PubMed] [Google Scholar]
- 29.Wang H, Lafdil F, Kong X, Gao B. Signal transducer and activator of transcription 3 in liver diseases: a novel therapeutic target. International journal of biological sciences. 2011;7:536–550. doi: 10.7150/ijbs.7.536. [DOI] [PMC free article] [PubMed] [Google Scholar]
- 30.Ruderman NB, Carling D, Prentki M, Cacicedo JM. AMPK, insulin resistance, and the metabolic syndrome. J Clin Invest. 2013;123:2764–2772. doi: 10.1172/JCI67227. [DOI] [PMC free article] [PubMed] [Google Scholar]
- 31.Coughlan KA, Valentine RJ, Ruderman NB, Saha AK. AMPK activation: a therapeutic target for type 2 diabetes? Diabetes, metabolic syndrome and obesity : targets and therapy. 2014;7:241–253. doi: 10.2147/DMSO.S43731. [DOI] [PMC free article] [PubMed] [Google Scholar]
- 32.Frasca D, Romero M, Landin AM, Diaz A, Riley RL, Blomberg BB. Protein phosphatase 2A (PP2A) is increased in old murine B cells and mediates p38 MAPK/tristetraprolin dephosphorylation and E47 mRNA instability. Mech Ageing Dev. 2010;131:306–314. doi: 10.1016/j.mad.2010.02.002. [DOI] [PMC free article] [PubMed] [Google Scholar]
- 33.Alemayehu B, Buysman E, Parry D, Becker L, Nathan F. Economic burden and healthcare utilization associated with castration-resistant prostate cancer in a commercial and Medicare Advantage US patient population. Journal of medical economics. 2010;13:351–361. doi: 10.3111/13696998.2010.491435. [DOI] [PubMed] [Google Scholar]
- 34.Zhou Y, Cowling BJ, Wu P, Chan WM, Lee SY, Lau EH, et al. Adiposity and influenza-associated respiratory mortality: a cohort study. Clinical infectious diseases : an official publication of the Infectious Diseases Society of America. 2015;60:e49–e57. doi: 10.1093/cid/civ060. [DOI] [PubMed] [Google Scholar]
- 35.Weber DJ, Rutala WA, Samsa GP, Santimaw JE, Lemon SM. Obesity as a predictor of poor antibody response to hepatitis B plasma vaccine. Jama. 1985;254:3187–3189. [PubMed] [Google Scholar]
- 36.Sheridan PA, Paich HA, Handy J, Karlsson EA, Hudgens MG, Sammon AB, et al. Obesity is associated with impaired immune response to influenza vaccination in humans. International journal of obesity. 2012;36:1072–1077. doi: 10.1038/ijo.2011.208. [DOI] [PMC free article] [PubMed] [Google Scholar]
- 37.Anaya DA, Dellinger EP. The obese surgical patient: a susceptible host for infection. Surgical infections. 2006;7:473–480. doi: 10.1089/sur.2006.7.473. [DOI] [PubMed] [Google Scholar]
- 38.Choban PS, Flancbaum L. The impact of obesity on surgical outcomes: a review. Journal of the American College of Surgeons. 1997;185:593–603. doi: 10.1016/s1072-7515(97)00109-9. [DOI] [PubMed] [Google Scholar]
- 39.Parmigiani A, Alcaide ML, Freguja R, Pallikkuth S, Frasca D, Fischl MA, et al. Impaired antibody response to influenza vaccine in HIV-infected and uninfected aging women is associated with immune activation and inflammation. PLoS One. 2013;8:e79816. doi: 10.1371/journal.pone.0079816. [DOI] [PMC free article] [PubMed] [Google Scholar]


