

Abstract
The past 3 years have witnessed a dramatic expansion in our knowledge of the genetic determinants of estimated glomerular filtration rate (eGFR) and chronic kidney disease (CKD). However, heritability estimates of eGFR indicate that we have only identified a small proportion of the total heritable contribution to the phenotypic variation. The majority of associations reported from genome-wide association studies identify genomic regions of interest and further work will be required to identify the causal variants responsible for a specific phenotype. Progress in this area is likely to stem from the identification of novel risk genotypes, which will offer insight into the pathogenesis of disease and potential novel therapeutic targets. Follow-up studies stimulated by findings from genome-wide association studies of kidney disease are already yielding promising results, such as the identification of an association between urinary uromodulin levels and incident CKD. Although this work is at an early stage, prospects for progress in our understanding of CKD and its treatment look more promising now than at any point in the past.
Introduction
Genome-wide association studies (GWASs), which scan hundreds of thousands of single nucleotide polymorphisms (SNPs) for association with a quantitative trait or disease of interest, have revolutionized the search for genetic variants that underpin complex, polygenic traits.1 Before GWASs were introduced, the primary methods available to study the association between genotype and phenotype were candidate gene studies and linkage analysis. Candidate gene studies investigated genes that were compelling ‘biological candidates’ based on the understanding of disease pathogenesis. Examples of candidate proteins whose genes were investigated for association with kidney disease phenotypes include angiotensin-converting enzyme,2 angiotensinogen,3 aldose reductase,4 guanine nucleotide-binding proteins,5 apolipoprotein E,6 sodium/hydrogen exchanger 5,7 neuronal nitric oxide synthase,8 endothelial nitric oxide synthase,9 platelet-activating factor acetylhydrolase10 and the T-cell receptor constant α chain.11 Disappointingly, few of these findings were successfully replicated in subsequent independent studies, and enthusiasm for this approach waned.12
Valuable insights were acquired from identifying and understanding the weaknesses of the candidate gene approach, such as the use of insufficient thresholds for declaring statistical significance, the failure to consider ethnic variation between populations, inadequate statistical power, inconsistent study phenotypes and a biased approach to candidate gene selection.13 These important lessons guided the development of GWASs by highlighting the need for unbiased analyses of large cohorts, rigorous criteria for publication and external replication of findings as an essential quality-control measure.
Linkage analysis was an early approach that enabled investigators to screen the genome for genetic causes of a quantitative trait or disease in an unbiased fashion. Linkage studies related the inheritance of sparsely distributed polymorphic genetic markers with disease phenotypes within families. This approach was primarily successful in identifying rare genetic variants with strong effects in monogenic disorders, such as in the case of adult polycystic kidney disease.14 The completion of the Human Genome Project and International HapMap Project were major steps forward that enabled researchers to simultaneously detect multiple genetic variants for polygenic diseases or traits of individually small effect across large cohorts of unrelated individuals.
Major advances in our knowledge of the genetic basis of estimated glomerular filtration rate (eGFR) and chronic kidney disease (CKD) have been made using the GWAS technique, and yet less than 2% of the estimated heritability of eGFR has been explained thus far.15 In this Review, we will summarize the theoretical and practical aspects of the GWAS method, and discuss discoveries identified by GWASs for CKD and renal traits. We will also discuss what we have learned from the explosion of data in the past 3 years and examine the immediate and future implications for clinical practice. Finally, we will explore how we can apply our knowledge to future investigations in order to gain further understanding of the genetic basis of CKD.
Phenotype definitions
Accurate phenotype definition is necessary when conducting genetic studies in order to establish reliable genotype–phenotype relationships. Poorly defined phenotypes can lead to inaccurate results and may affect the estimated magnitude of genetic effects. In the studies discussed below, CKD was generally defined as an eGFR of <60 ml/min/1.73 m2 using the four-variable Modification of Diet in Renal Disease Study equation according to the National Kidney Foundation guidelines.16,17 When available, GFR based on cystatin C was also estimated.18 This definition of CKD is generally used in the setting of epidemiologic research.19 Albuminuria was assessed by urinary albumin-to-creatinine ratio, where micro albuminuria was defined as a urinary albumin-to-creatinine ratio of >17 mg/g for men and >25 mg/g for women.20
In the context of large-scale GWASs, these phenotype definitions of kidney disease share several strengths. Specifically, they are well validated, widely available and suited to high-throughput analysis. However, they also have some important limitations. For example, these definitions are effectively marker phenotypes for unknown underlying causes of kidney disease, and may therefore represent heterogeneous causes of CKD. More precise phenotyping could improve statistical power and stronger markers of effect size might be identified, although potentially at the expense of analytical efficiency.
Genome-wide association studies
Genetic diversity in humans is surprisingly limited, as the global population has grown exponentially from a relatively small size within a few generations.21 Although SNPs are the most common form of genomic variation, they occur in only about one in every 1,000 bases22,23 and 90% of SNPs are shared among continental populations.24 Furthermore, SNPs tend to be transmitted across generations in blocks, a phenomenon known as linkage disequilibrium (the likelihood that alleles of nearby SNPs are inherited together), which further reduces genetic variability. Completion of the International HapMap Project, which illuminated the underlying patterns of linkage disequilibrium in the genome, enabled remarkable efficiencies in the study of polygenic diseases. With a few carefully selected ‘tag’ SNPs, researchers could capture the vast majority of SNP variation within each haplotype block.25 SNPs that were not directly genotyped could be ‘imputed’ (inferred) with the use of densely genotyped HapMap (and later the ‘1,000 Genomes’ Project) reference panels.26 The contemporaneous development of gene chips made screening of genetic variation from SNPs across an individual's entire genome feasible for the first time, at least in populations of European ancestry. Early gene chips, capable of genotyping 500,000 to 1 million SNPs, were less efficient at capturing variation in non-European individuals. For example, less than 60% of the variation in African ancestry populations was captured by early gene chips owing to the increased degree of genetic diversity, extensive and complex population substructure, and short linkage disequilibrium blocks which characterize that ethnic group.27 However, modern chips that are capable of affordably genotyping up to 5 million SNPs are likely to resolve this issue.28
GWASs employ a variety of familiar study designs, such as case–control or cohort studies, the key difference being one of scale. Mean values of a clinical measure (such as eGFR), or the proportion of affected cases (such as CKD) within a population are compared across the three possible genotype combinations for each SNP (that is, zero, one or two copies of a SNP of interest). Figure 1 shows an example of how the mean clinical measure, eGFR, differs across three possible genotype combinations. As each SNP assessed against a trait of interest represents a single statistical test, thresholds for declaring statistical significance need to be stringent to avoid identifying false positives. A Bonferroni correction is most often used, whereby the α level (the chance of a type I error, or incorrectly declaring a statistically significant difference or association) of each individual test is adjusted downwards to ensure that the total, study-wide risk for a number of tests remains at the prespecified level. The Bonferroni-adjusted threshold for declaring statistical significance is usually <5.0 × 10⁻⁸ (0.05 corrected for 1 million tests).29 Although 2.5 million SNPs are typically analyzed in an imputed dataset, the lesser correction factor of 1 million is generally used because of the high prevalence of linkage disequilibrium between genetic markers. Despite this, the Bonferroni adjustment is widely held to be too conservative, as it has the effect of inflating the rate of false-negative findings. As a result, a variety of other methods are commonly used to reduce the false-positive rate, such as the false discovery rate analysis or correcting for fewer SNPs when there is a reason able prior hypothesis.30
Figure 1.

An additive genetic model for GFR. In this additive model, each copy of the G allele is associated with an increase in GFR. The β-coefficient (β) indicates the unit increase in GFR (a continuous trait) per copy of the G allele. The blue circles represent individual GFR estimates for individuals with the genotype indicated on the x-axis. The red line indicates the regression slope of GFR on genotype. Abbreviation: GFR, glomerular filtration rate.
The requirement for a high degree of statistical significance before declaring an association, coupled with the fact that risk variants for complex traits confer small to modest increases in disease risk, makes very large sample sizes essential for adequate statistical power.31 A large sample size is achieved by pooling samples in large consortia, such as the CKDGen Consortium. As extremely low P values are not uncommon when using very large cohorts, it is important to appreciate the distinction between statistical significance and effect size: variants of minor effect size can attain very high levels of statistical significance if the sample cohort is large enough. Conversely, SNPs with large effect sizes may not attain statistical significance at all if insufficient numbers of samples are included.
When pooling such large cohorts, one must be aware that mixing populations of different ethnicities can create false-positive associations owing to differences in the frequencies of common variants across populations.32 Phased designs, whereby a panel of SNPs identified from an initial ‘discovery’ GWAS are whittled down in subsequent independent replication analyses, tend to reduce the likelihood of false positives.33 However, an observation should be independently replicated, ideally across multiple samples, before declaring a true genetic association.34 Once a genotype–phenotype association is identified, it is often annotated by the gene in closest proximity to that SNP. Critically, this association does not imply a causal relationship between the SNP in question and the molecular defect responsible for the phenotype. Instead, it merely identifies a genomic region that harbors the true causal variant, which typically requires further investigation with fine-mapping and functional studies for definitive identification.
Because of the enormous amounts of data generated by GWASs, the results are usually presented graphically for ease of interpretation. The three graphs most commonly used are the Manhattan plot, the quantile–quantile plot (Q–Q plot) and the regional association plot (Figure 2).
Figure 2.
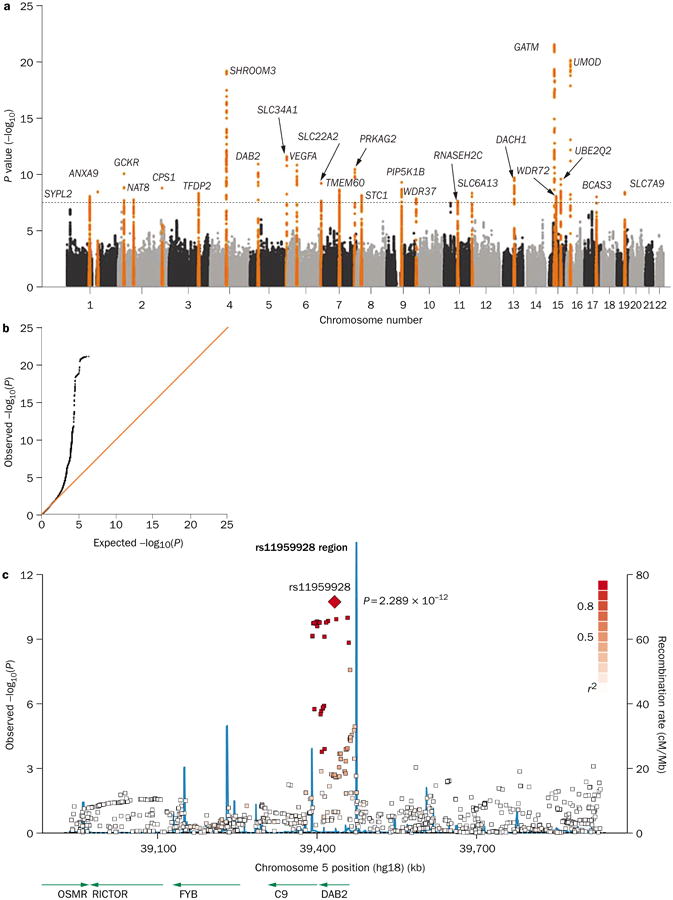
Graphical presentation of results from a GWAS of eGFR. a | A Manhattan plot showing significance level for each of the SNPs tested. SNP locations on the plot reflect their position across the 23 human chromosomes. SNPs with P values below 5.0 × 10⁻⁸ are colored orange. Regions with multiple significant SNPs are labeled by the likely disease-related gene. b | A quantile–quantile (Q–Q) plot detects systematic bias in a GWAS. Observed and expected P values are plotted for each SNP, ordered from the lowest to the highest level of significance. Under the null distribution, where there are no significant associations, the Q–Q plot will lie along the 45° line. Extremely small P values deviate from this line at the right-hand tail of the distribution. c | A regional association plot shows a close-up of one association peak from the Manhattan plot. The lead SNP is labeled, with other SNPs in the region color-coded based on the degree of linkage disequilibrium with the lead SNP. The blue lines illustrate the inferred local rate of recombination across the region. Recombination hotspots are indicated by peaks in the blue lines, with SNPs lying between these hotspots being strongly correlated with each other in several haplotypes. Abbreviations: eGFR, estimated glomerular filtration rate; GWAS, genome-wide association study; SNP, single nucleotide polymorphism. Permission obtained from Nature Publishing Group © Köttgen, A. et al. Nat. Genet. 42, 376–384 (2010).
GWASs of kidney disease phenotypes
CKD and measures of kidney function
In 2009, a GWAS of CKD and indices of renal function (eGFR based on creatinine [eGFRcrea] and cystatin C [eGFRcys]) in the general population was conducted in 19,877 individuals of European ancestry from the Cohorts for Heart and Aging Research in Genomic Epidemiology (CHARGE) Consortium.35 The primary finding from this analysis was an association between the SNP rs12917707 in the UMOD locus and CKD. UMOD encodes uromodulin, also known as Tamm-Horsfall protein, a glycoprotein exclusively expressed in the kidney. A follow-up proof-of-principle analysis demon strated that urinary uromodulin concentrations were associated with the UMOD SNP rs4293393, and elevated uromodulin concentrations increased the 10-year risk of CKD by over 70%.36 Rare autosomal dominant kidney diseases, such as medullary cystic kidney disease type 2 and familial juvenile hyperuricemic nephropathy, had previously been attributed to mutations in UMOD.37,38 However, the finding of a common variant, present in 18% of the study population, in association with population-based CKD was novel and illustrates a key theme of findings from the GWAS era: common variants of genes responsible for severe, monogenic disorders may be associated with milder presentations in the general population.39
Several other loci were identified in association with indices of renal function in this early GWAS.35 SHROOM3, which encodes a cytoskeletal protein expressed in the kidney, and GATM–SPATA5L1 on chromo some 15, were identified as associated with eGFRcrea. Furthermore, stanniocalcin 1 (STC1) on chromo some 8 and an intergenic SNP between the gene loci for cystatin C (CST3) and cystatin-9 (CST9) on chromo some 20 were found to be associated with eGFRcys. GATM–SPATA5L1 and the cystatin super family gene cluster loci, CST3 and CST9, are involved in the synthesis of creatinine and cystatin respectively, and are unlikely to be pathogenic variants (Figure 3 and Box 1).
Figure 3.

Magnitude of association between GFR estimated from creatinine and cystatin C and SNPs identified in a GWAS of GFR and CKD. Loci lying along the red line are equally associated with both measures of kidney function (creatinine and cystatin C), which suggests that they are related to true GFR. Loci that lie along the x-axis or y-axis are predominantly associated with GFR estimated from creatinine (eGFRcrea) or cystatin C (eGFRcys), respectively. These loci are more likely to be related to genetic variability in the production of creatinine or cystatin C than to true GFR. Abbreviations: CKD, chronic kidney disease; eGFR, estimated GFR; GFR, glomerular filtration rate; GWAS, genome-wide association study; SNP, single nucleotide polymorphism. Permission obtained from Nature Publishing Group © Köttgen, A. et al. Nat. Genet. 42, 376–384 (2010).
Box 1. Assessing loci associated with biomarker synthesis or secretion or GFR.
The synthesis and secretion of creatinine and cystatin C have a strong genetic contribution. However, loci associated with renal function are usually of more interest than loci involved in biomarker synthesis or secretion. These two types of loci can be distinguished based on their association with GFR estimated from creatinine and cystatin C. Loci associated with both creatinine-based eGFR and cystatin C-based eGFR are likely to be true GFR loci, whereas loci associated with one measure, but not the other, are more likely to be involved in the synthesis or secretion of that molecule.
Abbreviations: eGFR, estimated GFR; GFR, glomerular filtration rate.
Following the success of this GWAS, a further 16 population- based cohorts joined the collaboration to form the CKDGen Consortium, bringing the total number of cohorts to 20 and total participants to 67,093, with external replication performed in an additional 20,466 individuals from outside the consortium. This collaborative GWAS identified an additional 13 new loci associated with indices of kidney function (Table 1).15 Among these loci are genes involved in nephro genesis (ALMS1, VEGFA and DACH1), podocyte function and glomerular filtration barrier formation (DAB2 and VEGFA), angiogenesis (VEGFA), solute transport (SLC7A9 and SLC34A1) and kidney metabolism (PRKAG2, GCKR and LASS2), as well as genes not previously known to be related to kidney disease or develop ment (ATXN2). The majority of these identified loci were also associated with CKD, with the exceptions of STC1, GCKR and ATXN2, which may be explained by the fact that dichotomous outcomes such as CKD, are less well powered than continuous traits, such as eGFR. Many of these loci are associated with kidney diseases and disorders of renal function, such as CKD (SLC7A9), nephrolithiasis (SLC7A9), phosphaturia (SLC34A1), tubular dysfunction (SLC7A9 and DAB2), cystinuria (SLC7A9), ciliopathies (ALMS1) and congenital kidney disease (DACH1). Two of these loci, ALMS1/NAT8 and SLC7A9, were reported as being associated with renal function and CKD in an independent GWAS.40 As well as these putatively functional loci, several loci were also identified in the CKDGen study that are likely to be associated with creatinine production or secretion (CPS1, SLC6A13, SLC22A2, TBX2/BCAS3, TMEM60, WDR37 and WDR72). These loci are unlikely to be associated with true GFR as they are not associated with GFRcys (Figure 3).15
Table 1. Independent replication of loci associated with CKD identified from GWASs.
| Gene (chromosome) | SNP | Ethnicity of discovery cohort | Participants (cases) | Replication cohort | Reference |
|---|---|---|---|---|---|
| Population-based CKD | |||||
| UMOD (16p12.3) | rs12917707 | European | 19,877 (2,388) | European | Köttgen et al.35 |
| PRKAG2 (7q36.1) | rs7805747 | European | 62,237 (5,807) | European | Köttgen et al.15 |
| MYH9 (22q12.3) | rs4821480 | European | 13,133 (1,236) | European | O'Seaghdha et al.53 |
| Diabetic nephropathy | |||||
| SOD1 (21q22.11) | rs17880135 | White | 1,362 (212)* | European Asian‡ | Al-Kateb et al.,94 Lim et al.,95 Nomiyama et al.,96 Lee et al.,97 Möllsten et al.98 |
| ELMO1 (7p14) | rs741301 | Asian | 188 (94) | European African American | Leak et al.,58 Pezzolesi et al.,59 Shimazaki et al.60 |
| CNDP1/CNDP2 (18q22.3) | Trinucleotide repeat | European Arabian | 242 (135) | European African American§ | Janssen et al.,99 Freedman et al.,100 McDonough et al.101 |
| FRMD3 (9q21-22) | rs1888746; rs13289150 | European | 1,705 (820) | European | Pezzolesi et al.55 |
| GREM1 (15q13.3) | rs1129456 | European | 709 (267) | European | McKnight et al.102 |
| CARS (11p15.5) | rs739401; rs451041 | European | 1,705 (820) | European | Pezzolesi et al.55 |
| ACACB (12q24.1) | rs2268388 | Asian | 188 (94) | European | Maeda et al.62 |
| PVT1 (8q24.21) | rs2648875 | Pima Indian | 207 (105) | European | Millis et al.,103 Hanson et al.104 |
| eGFR | |||||
| ANXA9/LASS2 (1q21.3) | rs267734 | European | 67,093 | European African American | Köttgen et al.,15 Chambers et al.,40 Liu et al.43 |
| GCKR (2p23) | rs1260326 | European | 67,093 | European African American | Köttgen et al.,15 Liu et al.43 |
| ALMS1/NAT8 (2p13) | rs13538 | European | 67,093 | European African American | Köttgen et al.,15 Chambers et al.,40 Liu et al.43 |
| TFDP2 (3q23) | rs347685 | European | 67,093 | European African American | Köttgen et al.,15 Liu et al.43 |
| SHROOM3 (4q21.1) | rs17319721 | European | 67,093 | European African American | Köttgen et al.,15 Liu et al.43 |
| DAB2 (5p13) | rs11959928 | European | 67,093 | European African American | Köttgen et al.,15 Liu et al.43 |
| SLC34A1 (5q35) | rs6420094 | European | 67,093 | European | Köttgen et al.15 |
| VEGFA (6p12) | rs881858 | European | 67,093 | European African American | Köttgen et al.,15 Liu et al.43 |
| PRKAG2 (7q36.1) | rs7805747 | European | 67,093 | European African American | Köttgen et al.,15 Liu et al.43 |
| PIP5K1B (9q13) | rs4744712 | European | 67,093 | European African American | Köttgen et al.,15 Liu et al.43 |
| ATXN2/SH2B3 (12q24.1) | rs653178 | European | 67,093 | European African American | Köttgen et al.,15 Liu et al.43 |
| DACH1 (13q22) | rs626277 | European | 67,093 | European African American | Köttgen et al.,15 Liu et al.43 |
| UBE2Q2 (15q24.2) | rs1394125 | European | 67,093 | European African American | Köttgen et al.,15 Liu et al.43 |
| SLC7A9 (19q13.1) | rs12460876 | European | 67,093 | European African American | Köttgen et al.,15 Chambers et al.,40 Liu et al.43 |
| KCNQ1 (11p15.5) | rs7111394 | African American | 8,110 | European | Liu et al.43 |
| Albuminuria | |||||
| CUBN (10p12.31) | rs1801239 | European | 31,580 | European African American | Böger et al.65 |
No P value for replication of <0.05 in three cross-sectional studies.
Did not replicate in one study of European individuals.107
Abbreviations: CKD, chronic kidney disease; eGFR, estimated glomerular filtration rate; GWAS, genome-wide association study; SNP, single nucleotide polymorphism.
A limitation of the majority of GWASs conducted to date is the paucity of studies conducted in individuals who are not of European ancestry. This lack of data is of particular importance in nephrology in view of the increased risk of CKD observed among African American, Mexican American and Asian individuals.41,42 To address this issue, a study examined the extent to which SNPs identified in association with kidney disease phenotypes in European populations, including the 16 SNPs described above, performed in individuals of African ancestry.42 Using data from over 8,000 individuals from the CARe Consortium, over 95% of SNPs were observed to have the same effect direction in cross-ethnic analyses.43 Furthermore, by interrogating the flanking regions of known loci, the investigators also identified and replicated 12 new index SNPs previously detected in European ancestry populations as being related to eGFR (UMOD, ANXA9, GCKR, TFDP2, DAB2, VEGFA, ATXN2, GATM, SLC22A2, TMEM60, SLC6A13 and BCAS3). This finding suggests that there are genomic risk regions that are shared across ethnic groups. Furthermore, the investigators identified a novel eGFR locus, KCNQ1, in a discovery analysis. Although this gene was identified in African Americans, it was also shown to be associated with eGFR among individuals of European ancestry. Gene knockdown studies of KCNQ1 using a zebrafish model resulted in renal dysgenesis and altered filtration capacity, suggesting that this locus may be important for renal function.43
MYH9/APOL1 and end-stage renal disease
Variants in the nonmuscle myosin heavy chain 9 (MYH9) locus were identified as powerful predictors of kidney disease in African Americans using mapping by admixture linkage disequilibrium (MALD), an early method of unbiased genome screening.44,45 Genetic admixture occurs when individuals from previously separated populations start to interbreed. The resulting gene flow (transfer of alleles from one population to another) generates long, unbroken stretches of genetic material, known as haplotype blocks, which shorten over successive generations as a result of recombination. MALD exploits the fact that haplotype blocks containing a causative SNP segregate with a trait of interest in admixed populations such as African Americans. Although MALD has now largely been superseded by modern GWASs, this method made early unbiased genome-wide interrogation feasible as smaller sample sizes and fewer genetic markers are required than for GWASs,46 thus significantly reducing costs. Using MALD, the E-1 haplotype of MYH9 on 22q11–13 was identified as a powerful risk variant for end-stage renal disease (ESRD),44,45 as well as increasing the risk of hyper tensive nephro sclerosis and focal segmental glomerulo sclerosis.47 However, prompted by evidence of strong linkage disequilibrium patterns in this region of chromosome 22,48–50 variants in the adjacent apolipoprotein L1 (APOL1) gene, which occur exclusively in individuals of African descent, were found to have an even stronger statistical association with ESRD than those of MYH9.51 The unusually strong linkage patterns in this chromosomal segment seem to have been caused by intense selective pressure during the past 10,000 years, seemingly driven by an associated survival advantage in APOL1 mutation carriers.52 This survival advantage seems to be mediated by increased serum trypanolytic activity in APOL1 mutation carriers, which confers resistance to African sleeping sickness.51 It should be emphasized that the APOL1 variants are very atypical of GWAS findings in that they are both very common and have extremely large effect sizes.
he polymorphic nature of this region of chromosome 22 was further highlighted by a separate analysis, which demonstrated that an MYH9 variant, rs4821480, was associated with an increased risk of CKD in individuals of European ancestry.53 Importantly, the aforementioned APOL1 SNPs did not explain disease susceptibility in this group, nor could the finding be explained by unsuspected African ancestry in the study sample. This finding indicates that more than one renal risk variant might be operational in this chromosomal segment, as no single polymorphism adequately explains the totality of risk linked to this region. Furthermore, separate analyses indicate additional, as yet undefined, MYH9 variants associated with focal segmental glomerulosclerosis susceptibility54 and it remains plausible that further variants in APOL1, MYH9 or other genes could be identified in this hotspot for kidney disease risk.
Diabetic nephropathy
Type 1 diabetes
Two potential diabetic nephropathy risk variants near FRMD3 (FERM domain-containing protein 3) and CARS (cysteinyl-tRNA synthetase) were identified by a large GWAS of the Genetics of Kidneys in Diabetes (GoKinD) collection (Table 1).55 FERM3 encodes a structural protein of unknown function, protein 4.1O, which belongs to the 4.1 family of cytoskeletal proteins.56 External validation of both loci was performed in a cohort of 1,304 participants of the Diabetes Control and Complications Trial (DCCT)/Epidemiology of Diabetes Interventions and Complications (EDIC) study.55
Type 2 diabetes
An early GWAS of Japanese individuals with type 2 diabetes mellitus identified nephropathy susceptibility variants in ELMO1 (engulfment and cell motility 1).57 This finding was replicated both in African American58 and in European American participants in the GoKinD study, 59 albeit for different ELMO1 gene polymorphisms and in individuals with type 1 diabetes mellitus in GoKinD. ELMO1 activity is associated with the increased expression of extracellular matrix proteins, leading to expansion and thickening of the glomerular basement membrane,60 which are two characteristic histological lesions of diabetic nephropathy.61
Maeda et al. analyzed SNPs of borderline statistical significance from their original analysis that identified ELMO1 in a larger cohort with type 2 diabetes mellitus, and identified a SNP within ACACB, which encodes acetyl-coenzyme A (CoA) carboxylase 2.62 This finding was then replicated in samples from European and East Asian individuals. Acetyl-CoA carboxylase 2 is expressed in mouse and human kidney, and seems to orchestrate fatty acid oxidation and influence insulin sensitivity via modulation of fatty acid metabolism.63
Albuminuria
Albuminuria is an important predictor of CKD progression, and is often the only manifestation of CKD in young adults.64 A GWAS to identify susceptibility loci for albumin uria, using the phenotypes urinary albumin-to-creatinine ratio and microalbuminuria, was performed in 31,580 individuals of European ancestry from the CKDGen and CARe consortia.65 A missense SNP in the CUBN gene, rs1801239, which occurs in 10% of the general population, was associated with both urinary albumin-to-creatinine ratio and microalbuminuria, a finding replicated in independent cohorts of European and African ancestry.65 This CUBN allele is associated with an increased risk of microalbuminuria in apparently healthy individuals of the general population, as well as in those with diabetes mellitus and/or hyper tension. CUBN encodes cubilin, which is expressed predominantly in the apical brush border of the renal proximal tubular cell.66 Cubilin forms a complex with megalin (LRP2) and amnionless (AMN), and mediates receptor-mediated endocytic reabsorption of albumin and other filtered proteins in the proximal tubule.67 Patients with Imerslund– Graesbeck disease, an autosomal recessive condition caused by mutations in CUBN, exhibit varying degrees of tubular proteinuria.68 Dysfunction of the megalin–cubilin system is also implicated in the patho genesis of diabetic nephropathy in both animal and human studies.69–72 The suggestion that albuminuria occurring in the general population might be primarily tubular, as opposed to glomerular, in origin represents a potential paradigm shift in how we think about this condition.
Missing heritability
The studies discussed above illustrate the power of the GWAS approach to reveal novel biology by identifying genomic regions previously unsuspected of being involved in disease pathways. Cumulatively, these loci explain only a small fraction of the total heritable contribution to traits such as eGFR, prompting the question as to the best method to identify the remainder. Several proposals have been made. First, it has been suggested that larger sample sizes should be used in an attempt to increase statistical power. Most early GWASs were actually underpowered to discover the loci under investigation and benefitted from improved detectability due to sampling error. Consequently, the first report of a significant association is statistically more likely to identify a larger effect size than is seen in subsequent replication studies. This overestimation of effect size has become known as the ‘winner's curse’,73–75 as it may cause follow-up studies to fail to replicate a finding owing to lack of statistical power, although power issues are becoming less of a concern in the current era of the ‘mega consortium’. Second, those loci already identified require considerably more investigation, and should be explored for additional variation (common or rare) that may contribute to the total heritable risk. The true causal variant might be more strongly associated than the GWAS marker, or additional independent causal alleles might exist in the region, hence explaining a larger proportion of the total heritability of a particular trait. Third, the effects of a single gene are often modified by one or more modifier genes, a phenomenon known as epistasis. Whereas these effects are often multiplicative, the method for calculating heritability in GWASs is additive. Accounting for these epistatic gene– gene and gene–environment interactions could amplify the effect size of a given identified locus, and account for a greater proportion of the heritability.76 Finally, while rare variants of large effect are detectable using family-based linkage analyses, and common variants of modest to small effect are detectable using GWASs, these methods are not suitable for identifying variants that fall between these categories. It is hoped that next-generation sequencing technologies will enable the exploration of rare variants in a systematic and comprehensive fashion. As such, the current wave of GWASs is only a starting point towards an understanding of the genetic basis of CKD, which will ultimately lead to clinically meaningful insights.
Future directions
Next-generation sequencing
Following a 13-year international collaborative effort and at a cost of almost US$3 billion, the sequencing of the first human genome was completed in 2001 by the Human Genome Project.22,77,78 Now, just one decade later, whole-genome sequencing is technically feasible in days through the use of new DNA-sequencing technologies, known as next-generation sequencing.79 Unlike microarray-based GWASs described above, which are designed to cover common variants present in at least 5% of the human population, next-generation sequencing can cover the entire genome (or the entire genetic coding segment, known as the exome) using massively parallel pyrosequencing platforms. Deep resequencing of all genes by next-generation sequencing improves resolution, permitting the detection of rare allelic variants not identifiable by GWASs.80 While the costs of whole-genome sequencing may still be prohibitive for most investigators (approximately $10,000 per individual in late 2011),80 less expensive whole-exome sequencing is already in clinical use for the diagnosis and study of rare human diseases.81 Furthermore, several projects utilizing whole-exome sequencing to characterize Mendelian disorders have been initiated by the NIH, Finding of Rare Disease Genes in Canada (FORGE Canada) and Rare Disease Consortium for Autosomal Loci (RaDiCAL).
Although sequencing technologies will detect millions of novel rare variants, there are substantial analytical challenges to be overcome before they can be reliably used for large-scale phenotype association studies, including a high proportion of sequence errors and large amounts of missing data.82 Furthermore, the explosion of data that will result from the decrease in next-generation sequencing costs will bring considerable challenges, not least with respect to bioinformatic analytical capacity and data storage. How these issues are resolved will determine the impact that next-generation sequencing will have on the investigation of common, complex genetic traits in the post-GWAS era.
Risk prediction and personalized medicine
The potential for genetic discoveries to enable a personalized prediction of disease risk has been touted as a major translational application of GWASs,83 but how realistic a prospect is gene-based prediction of complex disease? Despite the robust and statistically significant associations between genetic variants and disease risk, effect sizes are generally small, with an increased risk of disease usually ranging from 10% to 30% per copy of the risk allele. These effects would be expected to confer only modest improvements, if any, in risk discrimination or calibration.84 To address the feasibility of gene-based prediction of CKD, a genetic risk score was constructed from the panel of 16 SNPs identified by the CKDGen GWAS.15 The ability of the genotype score to predict cases of incident CKD, beyond information provided by known CKD risk factors, was tested in 2,129 participants from the Framingham Heart Study.85,86 Although it was possible to identify some individuals at increased risk of CKD by the presence of a high number of CKD risk variants, the observed effects were small. More importantly, the genotype score did not improve disease prediction beyond what was achievable using classical, nongenetic CKD risk factors. These results are consistent with those of similarly designed genetic prediction studies conducted for other complex disease phenotypes, including type 2 diabetes mellitus,87,88 incident myocardial infarction,89 coronary heart disease90 and coronary artery disease, myocardial infarction and stroke in women.91
As such, assessment of validated risk factors remains the only validated method for predicting disease risk, and personal genetic data using common variants cannot further refine this prediction given the current state of the science. Genetic discoveries are more likely to lead to personalized care in other ways, such as predicting variability in drug response and adverse effects, or using genetic information to identify the most appropriate therapy for individual patients, a branch of research known as pharmacogenomics. Developments in this area already show promise, particularly in the fields of oncology and cardiovascular medicine.92
Finally, although the effect sizes of loci identified by GWASs are often small, there is not necessarily a relationship between effect size and the discovery of important novel pathophysiological mechanisms or potential targets for intervention. For example, a variant in HMGCR, which encodes 3-hydroxy-3-methyl-glutaryl-CoA reductase (HMG-CoA), was associated with decreased LDL-cholesterol levels and a reduced risk of coronary artery disease in a large GWAS of blood lipid levels.93 Although the observed effect size was small—each copy of the minor allele resulted in a 0.07 mmol/l decrease in LDL-cholesterol level—inhibiting HMG-CoA with statins has proven to be a major advance in the primary and secondary prevention of cardiovascular disease.
Conclusions
Genetic studies such as GWASs provide a powerful tool to systematically illuminate the complex biology of fundamental disease processes, as well as characterize aspects of an individual's predisposition to a disease that remain stable over a lifetime. With translational benefits that are likely to include an improved understanding of the pathogenesis of CKD and the possibility to identify novel therapeutic targets for kidney disease, the prospects for progress in the future look very promising.
Key points.
Early attempts to identify the genetic basis of kidney disease in unselected populations, for example using the candidate gene approach or linkage analysis, were largely unsuccessful
Genome-wide association studies (GWASs) are unbiased screens of the genome for disease associations, and have revolutionized the study of complex, polygenic traits
Progress has been made in identifying novel loci associated with several renal traits, such as glomerular filtration rate, chronic kidney disease and albuminuria, using the GWAS approach
GWASs identify single nucleotide polymorphisms that tag a genomic region harboring the true causal variant, which requires further fine-mapping and functional studies for definitive identification of the causal variant
The major translational benefits of findings from GWASs are likely to be the identification of novel therapeutic targets and an improved understanding of the pathogenesis of chronic kidney disease
Review criteria.
A literature search of PubMed was performed using a combination of the search terms “chronic kidney disease”, “albuminuria”, “nephropathy” and “genome”. In addition, we searched the bibliographies and discussion sections of the identified articles for other relevant papers. Original manuscripts reporting the results of genome-wide association studies of specific renal traits in humans were included. No date restrictions were placed on the search.
Footnotes
Competing interests: The authors declare no competing interests.
References
- 1.Hardy J, Singleton A. Genomewide association studies and human disease. N Engl J Med. 2009;360:1759–1768. doi: 10.1056/NEJMra0808700. [DOI] [PMC free article] [PubMed] [Google Scholar]
- 2.Ruggenenti P, Bettinaglio P, Pinares F, Remuzzi G. Angiotensin converting enzyme insertion/deletion polymorphism and renoprotection in diabetic and nondiabetic nephropathies. Clin J Am Soc Nephrol. 2008;3:1511–1525. doi: 10.2215/CJN.04140907. [DOI] [PMC free article] [PubMed] [Google Scholar]
- 3.Le TH, Coffman TM. Targeting genes in the renin-angiotensin system. Curr Opin Nephrol Hypertens. 2008;17:57–63. doi: 10.1097/MNH.0b013e3282f2fd39. [DOI] [PubMed] [Google Scholar]
- 4.Heesom AE, Hibberd ML, Millward A, Demaine AG. Polymorphism in the 5′-end of the aldose reductase gene is strongly associated with the development of diabetic nephropathy in type I diabetes. Diabetes. 1997;46:287–291. doi: 10.2337/diab.46.2.287. [DOI] [PubMed] [Google Scholar]
- 5.Blüthner M, et al. Increased frequency of G-protein β3-subunit 825 T allele in dialyzed patients with type 2 diabetes. Kidney Int. 1999;55:1247–1250. doi: 10.1046/j.1523-1755.1999.00399.x. [DOI] [PubMed] [Google Scholar]
- 6.Chowdhury TA, et al. Association of apolipoprotein epsilon2 allele with diabetic nephropathy in Caucasian subjects with IDDM. Diabetes. 1998;47:278–280. doi: 10.2337/diab.47.2.278. [DOI] [PubMed] [Google Scholar]
- 7.Yu H, Freedman BI, Rich SS, Bowden DW. Human Na+/H+ exchanger genes: identification of polymorphisms by radiation hybrid mapping and analysis of linkage in end-stage renal disease. Hypertension. 2000;35:135–143. doi: 10.1161/01.hyp.35.1.135. [DOI] [PubMed] [Google Scholar]
- 8.Freedman BI, et al. Genetic analysis of nitric oxide and endothelin in end-stage renal disease. Nephrol Dial Transplant. 2000;15:1794–1800. doi: 10.1093/ndt/15.11.1794. [DOI] [PubMed] [Google Scholar]
- 9.Morita T, et al. Effect of a polymorphism of endothelial nitric oxide synthase gene in Japanese patients with IgA nephropathy. Clin Nephrol. 1999;52:203–209. [PubMed] [Google Scholar]
- 10.Tanaka R, et al. Role of platelet-activating factor acetylhydrolase gene mutation in Japanese childhood IgA nephropathy. Am J Kidney Dis. 1999;34:289–295. doi: 10.1016/s0272-6386(99)70357-4. [DOI] [PubMed] [Google Scholar]
- 11.Deenitchina SS, et al. Association of a T-cell receptor constant alpha chain gene polymorphism with progression of IgA nephropathy in Japanese patients. Am J Kidney Dis. 1999;34:279–288. doi: 10.1016/s0272-6386(99)70356-2. [DOI] [PubMed] [Google Scholar]
- 12.Hirschhorn JN, Daly MJ. Genome-wide association studies for common diseases and complex traits. Nat Rev Genet. 2005;6:95–108. doi: 10.1038/nrg1521. [DOI] [PubMed] [Google Scholar]
- 13.Hirschhorn JN, Lohmueller K, Byrne E, Hirschhorn K. A comprehensive review of genetic association studies. Genet Med. 2002;4:45–61. doi: 10.1097/00125817-200203000-00002. [DOI] [PubMed] [Google Scholar]
- 14.Reeders ST, et al. A highly polymorphic DNA marker linked to adult polycystic kidney disease on chromosome 16. Nature. 1985;317:542–544. doi: 10.1038/317542a0. [DOI] [PubMed] [Google Scholar]
- 15.Köttgen A, et al. New loci associated with kidney function and chronic kidney disease. Nat Genet. 2010;42:376–384. doi: 10.1038/ng.568. [DOI] [PMC free article] [PubMed] [Google Scholar]
- 16.Levey AS, et al. A more accurate method to estimate glomerular filtration rate from serum creatinine: a new prediction equation. Modification of Diet in Renal Disease Study Group. Ann Intern Med. 1999;130:461–470. doi: 10.7326/0003-4819-130-6-199903160-00002. [DOI] [PubMed] [Google Scholar]
- 17.National Kidney Foundation. K/DOQI clinical practice guidelines for chronic kidney disease: evaluation, classification, and stratification. Am J Kidney Dis. 2002;39:S1–S266. [PubMed] [Google Scholar]
- 18.Stevens LA, et al. Estimating GFR using serum cystatin C alone and in combination with serum creatinine: a pooled analysis of 3,418 individuals with CKD. Am J Kidney Dis. 2008;51:395–406. doi: 10.1053/j.ajkd.2007.11.018. [DOI] [PMC free article] [PubMed] [Google Scholar]
- 19.Bash LD, et al. Defining incident chronic kidney disease in the research setting: The ARIC Study. Am J Epidemiol. 2009;170:414–424. doi: 10.1093/aje/kwp151. [DOI] [PMC free article] [PubMed] [Google Scholar]
- 20.Mattix HJ, Hsu CY, Shaykevich S, Curhan G. Use of the albumin/creatinine ratio to detect microalbuminuria: implications of sex and race. J Am Soc Nephrol. 2002;13:1034–1039. doi: 10.1681/ASN.V1341034. [DOI] [PubMed] [Google Scholar]
- 21.Jorde LB, Wooding SP. Genetic variation, classification and ‘race’. Nat Genet. 2004;36:S28–S33. doi: 10.1038/ng1435. [DOI] [PubMed] [Google Scholar]
- 22.Sachidanandam R, et al. A map of human genome sequence variation containing 1.42 million single nucleotide polymorphisms. Nature. 2001;409:928–933. doi: 10.1038/35057149. [DOI] [PubMed] [Google Scholar]
- 23.Li WH, Sadler LA. Low nucleotide diversity in man. Genetics. 1991;129:513–523. doi: 10.1093/genetics/129.2.513. [DOI] [PMC free article] [PubMed] [Google Scholar]
- 24.Altshuler D, Daly MJ, Lander ES. Genetic mapping in human disease. Science. 2008;322:881–888. doi: 10.1126/science.1156409. [DOI] [PMC free article] [PubMed] [Google Scholar]
- 25.Gabriel SB, et al. The structure of haplotype blocks in the human genome. Science. 2002;296:2225–2229. doi: 10.1126/science.1069424. [DOI] [PubMed] [Google Scholar]
- 26.Neale BM. Introduction to linkage disequilibrium, the HapMap, and imputation. Cold Spring Harb Protoc. doi: 10.1101/pdb.top74. http://dx.doi.org/10.1101/pdb.top74. [DOI] [PubMed]
- 27.Tishkoff SA, et al. The genetic structure and history of Africans and African Americans. Science. 2009;324:1035–1044. doi: 10.1126/science.1172257. [DOI] [PMC free article] [PubMed] [Google Scholar]
- 28.Spencer CC, Su Z, Donnelly P, Marchini J. Designing genome-wide association studies: sample size, power, imputation, and the choice of genotyping chip. PLoS Genet. 2009;5:e1000477. doi: 10.1371/journal.pgen.1000477. [DOI] [PMC free article] [PubMed] [Google Scholar]
- 29.Johnson RC, et al. Accounting for multiple comparisons in a genome-wide association study (GWAS) BMC Genomics. 2010;11:724. doi: 10.1186/1471-2164-11-724. [DOI] [PMC free article] [PubMed] [Google Scholar]
- 30.van den Oord EJ. Controlling false discoveries in genetic studies. Am J Med Genet B Neuropsychiatr Genet. 2008;147B:637–644. doi: 10.1002/ajmg.b.30650. [DOI] [PubMed] [Google Scholar]
- 31.Hunter DJ, Kraft P. Drinking from the fire hose—statistical issues in genomewide association studies. N Engl J Med. 2007;357:436–439. doi: 10.1056/NEJMp078120. [DOI] [PubMed] [Google Scholar]
- 32.Pearson TA, Manolio TA. How to interpret a genome-wide association study. JAMA. 2008;299:1335–1344. doi: 10.1001/jama.299.11.1335. [DOI] [PubMed] [Google Scholar]
- 33.Manolio TA. Genomewide association studies and assessment of the risk of disease. N Engl J Med. 2010;363:166–176. doi: 10.1056/NEJMra0905980. [DOI] [PubMed] [Google Scholar]
- 34.Chanock SJ, et al. Replicating genotype-phenotype associations. Nature. 2007;447:655–660. doi: 10.1038/447655a. [DOI] [PubMed] [Google Scholar]
- 35.Köttgen A, et al. Multiple loci associated with indices of renal function and chronic kidney disease. Nat Genet. 2009;41:712–717. doi: 10.1038/ng.377. [DOI] [PMC free article] [PubMed] [Google Scholar]
- 36.Köttgen A, et al. Uromodulin levels associate with a common UMOD variant and risk for incident CKD. J Am Soc Nephrol. 2010;21:337–344. doi: 10.1681/ASN.2009070725. [DOI] [PMC free article] [PubMed] [Google Scholar]
- 37.Rampoldi L, et al. Allelism of MCKD, FJHN and GCKD caused by impairment of uromodulin export dynamics. Hum Mol Genet. 2003;12:3369–3384. doi: 10.1093/hmg/ddg353. [DOI] [PubMed] [Google Scholar]
- 38.Vylet'al P, et al. Alterations of uromodulin biology: a common denominator of the genetically heterogeneous FJHN/MCKD syndrome. Kidney Int. 2006;70:1155–1169. doi: 10.1038/sj.ki.5001728. [DOI] [PubMed] [Google Scholar]
- 39.Hirschhorn JN. Genomewide association studies—illuminating biologic pathways. N Engl J Med. 2009;360:1699–1701. doi: 10.1056/NEJMp0808934. [DOI] [PubMed] [Google Scholar]
- 40.Chambers JC, et al. Genetic loci influencing kidney function and chronic kidney disease. Nat Genet. 2010;42:373–375. doi: 10.1038/ng.566. [DOI] [PMC free article] [PubMed] [Google Scholar]
- 41.Perkovic V, et al. High prevalence of chronic kidney disease in Thailand. Kidney Int. 2008;73:473–479. doi: 10.1038/sj.ki.5002701. [DOI] [PubMed] [Google Scholar]
- 42.Tareen N, et al. Chronic kidney disease in African American and Mexican American populations. Kidney Int Suppl. 2005;97:S137–S140. doi: 10.1111/j.1523-1755.2005.09723.x. [DOI] [PubMed] [Google Scholar]
- 43.Liu CT, et al. Genetic association for renal traits among participants of African ancestry reveals new loci for renal function. PLoS Genet. 2011;7:e1002264. doi: 10.1371/journal.pgen.1002264. [DOI] [PMC free article] [PubMed] [Google Scholar]
- 44.Kao WH, et al. MYH9 is associated with nondiabetic end-stage renal disease in African Americans. Nat Genet. 2008;40:1185–1192. doi: 10.1038/ng.232. [DOI] [PMC free article] [PubMed] [Google Scholar]
- 45.Kopp JB, et al. MYH9is a major-effect risk gene for focal segmental glomerulosclerosis. Nat Genet. 2008;40:1175–1184. doi: 10.1038/ng.226. [DOI] [PMC free article] [PubMed] [Google Scholar]
- 46.Smith MW, O'Brien SJ. Mapping by admixture linkage disequilibrium: advances, limitations and guidelines. Nat Rev Genet. 2005;6:623–632. doi: 10.1038/nrg1657. [DOI] [PubMed] [Google Scholar]
- 47.Freedman BI, et al. Non-muscle myosin heavy chain 9 gene MYH9 associations in African Americans with clinically diagnosed type 2 diabetes mellitus-associated ESRD. Nephrol Dial Transplant. 2009;24:3366–3371. doi: 10.1093/ndt/gfp316. [DOI] [PMC free article] [PubMed] [Google Scholar]
- 48.Barreiro LB, Laval G, Quach H, Patin E, Quintana-Murci L. Natural selection has driven population differentiation in modern humans. Nat Genet. 2008;40:340–345. doi: 10.1038/ng.78. [DOI] [PubMed] [Google Scholar]
- 49.Sabeti PC, et al. Genome-wide detection and characterization of positive selection in human populations. Nature. 2007;449:913–918. doi: 10.1038/nature06250. [DOI] [PMC free article] [PubMed] [Google Scholar]
- 50.Oleksyk TK, Nelson GW, An P, Kopp JB, Winkler CA. Worldwide distribution of the MYH9 kidney disease susceptibility alleles and haplotypes: evidence of historical selection in Africa. PLoS ONE. 2010;5:e11474. doi: 10.1371/journal.pone.0011474. [DOI] [PMC free article] [PubMed] [Google Scholar]
- 51.Genovese G, et al. Association of trypanolytic ApoL1 variants with kidney disease in African Americans. Science. 2010;329:841–845. doi: 10.1126/science.1193032. [DOI] [PMC free article] [PubMed] [Google Scholar]
- 52.Sabeti PC, et al. Positive natural selection in the human lineage. Science. 2006;312:1614–1620. doi: 10.1126/science.1124309. [DOI] [PubMed] [Google Scholar]
- 53.O'Seaghdha CM, et al. The MYH9/APOL1 region and chronic kidney disease in European-Americans. Hum Mol Genet. 2011;20:2450–2456. doi: 10.1093/hmg/ddr118. [DOI] [PMC free article] [PubMed] [Google Scholar]
- 54.Freedman BI, et al. The apolipoprotein L1 (APOL1) gene and nondiabetic nephropathy in African Americans. J Am Soc Nephrol. 2010;21:1422–1426. doi: 10.1681/ASN.2010070730. [DOI] [PMC free article] [PubMed] [Google Scholar]
- 55.Pezzolesi MG, et al. Genome-wide association scan for diabetic nephropathy susceptibility genes in type 1 diabetes. Diabetes. 2009;58:1403–1410. doi: 10.2337/db08-1514. [DOI] [PMC free article] [PubMed] [Google Scholar]
- 56.Ni X, et al. Molecular cloning and characterization of the protein 4.10 gene, a novel member of the protein 4.1 family with focal expression in ovary. J Hum Genet. 2003;48:101–106. doi: 10.1007/s100380300015. [DOI] [PubMed] [Google Scholar]
- 57.Shimazaki A, et al. Genetic variations in the gene encoding ELMO1 are associated with susceptibility to diabetic nephropathy. Diabetes. 2005;54:1171–1178. doi: 10.2337/diabetes.54.4.1171. [DOI] [PubMed] [Google Scholar]
- 58.Leak TS, et al. Variants in intron 13 of the ELMO1 gene are associated with diabetic nephropathy in African Americans. Ann Hum Genet. 2009;73:152–159. doi: 10.1111/j.1469-1809.2008.00498.x. [DOI] [PMC free article] [PubMed] [Google Scholar]
- 59.Pezzolesi MG, et al. Confirmation of genetic associations at ELMO1 in the GoKinD collection supports its role as a susceptibility gene in diabetic nephropathy. Diabetes. 2009;58:2698–2702. doi: 10.2337/db09-0641. [DOI] [PMC free article] [PubMed] [Google Scholar]
- 60.Shimazaki A, et al. ELMO1 increases expression of extracellular matrix proteins and inhibits cell adhesion to ECMs. Kidney Int. 2006;70:1769–1776. doi: 10.1038/sj.ki.5001939. [DOI] [PubMed] [Google Scholar]
- 61.Caramori ML, et al. Cellular basis of diabetic nephropathy: 1. Study design and renal structural-functional relationships in patients with long-standing type 1 diabetes. Diabetes. 2002;51:506–513. doi: 10.2337/diabetes.51.2.506. [DOI] [PubMed] [Google Scholar]
- 62.Maeda S, et al. A single nucleotide polymorphism within the acetyl-coenzyme A carboxylase beta gene is associated with proteinuria in patients with type 2 diabetes. PLoS Genet. 2010;6:e1000842. doi: 10.1371/journal.pgen.1000842. [DOI] [PMC free article] [PubMed] [Google Scholar]
- 63.Abu-Elheiga L, Matzuk MM, Abo-Hashema KA, Wakil SJ. Continuous fatty acid oxidation and reduced fat storage in mice lacking acetyl-CoA carboxylase 2. Science. 2001;291:2613–2616. doi: 10.1126/science.1056843. [DOI] [PubMed] [Google Scholar]
- 64.James MT, Hemmelgarn BR, Tonelli M. Early recognition and prevention of chronic kidney disease. Lancet. 2010;375:1296–1309. doi: 10.1016/S0140-6736(09)62004-3. [DOI] [PubMed] [Google Scholar]
- 65.Böger CA, et al. CUBN is a gene locus for albuminuria. J Am Soc Nephrol. 2011;22:555–570. doi: 10.1681/ASN.2010060598. [DOI] [PMC free article] [PubMed] [Google Scholar]
- 66.Birn H, et al. Characterization of an epithelial approximately 460-kDa protein that facilitates endocytosis of intrinsic factor-vitamin B12 and binds receptor-associated protein. J Biol Chem. 1997;272:26497–26504. doi: 10.1074/jbc.272.42.26497. [DOI] [PubMed] [Google Scholar]
- 67.Christensen EI, Verroust PJ, Nielsen R. Receptor-mediated endocytosis in renal proximal tubule. Pflugers Arch. 2009;458:1039–1048. doi: 10.1007/s00424-009-0685-8. [DOI] [PubMed] [Google Scholar]
- 68.Birn H, Christensen EI. Renal albumin absorption in physiology and pathology. Kidney Int. 2006;69:440–449. doi: 10.1038/sj.ki.5000141. [DOI] [PubMed] [Google Scholar]
- 69.Feng M, et al. Expression level of cubilin in the rat model of diabetic nephropathy [Chinese] Sichuan Da Xue Xue Bao Yi Xue Ban. 2006;37:738–741. [PubMed] [Google Scholar]
- 70.Russo LM, et al. Impaired tubular uptake explains albuminuria in early diabetic nephropathy. J Am Soc Nephrol. 2009;20:489–494. doi: 10.1681/ASN.2008050503. [DOI] [PMC free article] [PubMed] [Google Scholar]
- 71.Tojo A, et al. Reduced albumin reabsorption in the proximal tubule of early-stage diabetic rats. Histochem Cell Biol. 2001;116:269–276. doi: 10.1007/s004180100317. [DOI] [PubMed] [Google Scholar]
- 72.Thrailkill KM, et al. Microalbuminuria in type 1 diabetes is associated with enhanced excretion of the endocytic multiligand receptors megalin and cubilin. Diabetes Care. 2009;32:1266–1268. doi: 10.2337/dc09-0112. [DOI] [PMC free article] [PubMed] [Google Scholar]
- 73.Lohmueller KE, Pearce CL, Pike M, Lander ES, Hirschhorn JN. Meta-analysis of genetic association studies supports a contribution of common variants to susceptibility to common disease. Nat Genet. 2003;33:177–182. doi: 10.1038/ng1071. [DOI] [PubMed] [Google Scholar]
- 74.Göring HH, Terwilliger JD, Blangero J. Large upward bias in estimation of locus-specific effects from genomewide scans. Am J Hum Genet. 2001;69:1357–1369. doi: 10.1086/324471. [DOI] [PMC free article] [PubMed] [Google Scholar]
- 75.McCarthy MI, Hirschhorn JN. Genome-wide association studies: potential next steps on a genetic journey. Hum Mol Genet. 2008;17:R156–R165. doi: 10.1093/hmg/ddn289. [DOI] [PMC free article] [PubMed] [Google Scholar]
- 76.Haig D. Does heritability hide in epistasis between linked SNPs? Eur J Hum Genet. 2011;19:123. doi: 10.1038/ejhg.2010.161. [DOI] [PMC free article] [PubMed] [Google Scholar]
- 77.Lander ES, et al. Initial sequencing and analysis of the human genome. Nature. 2001;409:860–921. doi: 10.1038/35057062. [DOI] [PubMed] [Google Scholar]
- 78.McPherson JD, et al. A physical map of the human genome. Nature. 2001;409:934–941. doi: 10.1038/35057157. [DOI] [PubMed] [Google Scholar]
- 79.Pareek CS, Smoczynski R, Tretyn A. Sequencing technologies and genome sequencing. J Appl Genet. 2011;52:413–435. doi: 10.1007/s13353-011-0057-x. [DOI] [PMC free article] [PubMed] [Google Scholar]
- 80.Majewski J, Schwartzentruber J, Lalonde E, Montpetit A, Jabado N. What can exome sequencing do for you? J Med Genet. 2011;48:580–589. doi: 10.1136/jmedgenet-2011-100223. [DOI] [PubMed] [Google Scholar]
- 81.Bamshad MJ, et al. Exome sequencing as a tool for Mendelian disease gene discovery. Nat Rev Genet. 2011;12:745–755. doi: 10.1038/nrg3031. [DOI] [PubMed] [Google Scholar]
- 82.Luo L, Boerwinkle E, Xiong M. Association studies for next-generation sequencing. Genome Res. 2011;21:1099–1108. doi: 10.1101/gr.115998.110. [DOI] [PMC free article] [PubMed] [Google Scholar]
- 83.O'Donnell CJ, Nabel EG. Cardiovascular genomics, personalized medicine, and the National Heart, Lung, and Blood Institute: part I: the beginning of an era. Circ Cardiovasc Genet. 2008;1:51–57. doi: 10.1161/CIRCGENETICS.108.813337. [DOI] [PMC free article] [PubMed] [Google Scholar]
- 84.Wang TJ. Assessing the role of circulating, genetic, and imaging biomarkers in cardiovascular risk prediction. Circulation. 2011;123:551–565. doi: 10.1161/CIRCULATIONAHA.109.912568. [DOI] [PMC free article] [PubMed] [Google Scholar]
- 85.O'Seaghdha CM, Yang Q, Wu H, Hwang SJ, Fox CS. Performance of a genetic risk score for CKD stage 3 in the general population. Am J Kidney Dis. doi: 10.1053/j.ajkd.2011.08.030. http://dx.doi.org/10.1053/j.ajkd.2011.08.030. [DOI] [PMC free article] [PubMed]
- 86.O'Seaghdha CM, et al. Development of a risk score for chronic kidney disease in population-based studies [abstract] American Society of Nephrology Renal Week. 2010 F-PO1920. [Google Scholar]
- 87.Meigs JB, et al. Genotype score in addition to common risk factors for prediction of type 2 diabetes. N Engl J Med. 2008;359:2208–2219. doi: 10.1056/NEJMoa0804742. [DOI] [PMC free article] [PubMed] [Google Scholar]
- 88.Talmud PJ, et al. Utility of genetic and non-genetic risk factors in prediction of type 2 diabetes: Whitehall II prospective cohort study. BMJ. 2010;340:b4838. doi: 10.1136/bmj.b4838. [DOI] [PMC free article] [PubMed] [Google Scholar]
- 89.Qi L, et al. Genetic risk score and risk of myocardial infarction in Hispanics. Circulation. 2011;123:374–380. doi: 10.1161/CIRCULATIONAHA.110.976613. [DOI] [PMC free article] [PubMed] [Google Scholar]
- 90.Ripatti S, et al. A multilocus genetic risk score for coronary heart disease: case-control and prospective cohort analyses. Lancet. 2010;376:1393–1400. doi: 10.1016/S0140-6736(10)61267-6. [DOI] [PMC free article] [PubMed] [Google Scholar]
- 91.Paynter NP, et al. Association between a literature-based genetic risk score and cardiovascular events in women. JAMA. 2010;303:631–637. doi: 10.1001/jama.2010.119. [DOI] [PMC free article] [PubMed] [Google Scholar]
- 92.Pirmohamed M. Pharmacogenetics: past, present and future. Drug Discov Today. 2011;16:852–861. doi: 10.1016/j.drudis.2011.08.006. [DOI] [PubMed] [Google Scholar]
- 93.Teslovich TM, et al. Biological, clinical and population relevance of 95 loci for blood lipids. Nature. 2010;466:707–713. doi: 10.1038/nature09270. [DOI] [PMC free article] [PubMed] [Google Scholar]
- 94.Al-Kateb H, et al. Multiple superoxide dismutase 1/splicing factor serine alanine 15 variants are associated with the development and progression of diabetic nephropathy: the Diabetes Control and Complications Trial/ Epidemiology of Diabetes Interventions and Complications Genetics study. Diabetes. 2008;57:218–228. doi: 10.2337/db07-1059. [DOI] [PMC free article] [PubMed] [Google Scholar]
- 95.Lim SC, et al. Microarray analysis of multiple candidate genes and associated plasma proteins for nephropathy secondary to type 2 diabetes among Chinese individuals. Diabetologia. 2009;52:1343–1351. doi: 10.1007/s00125-009-1368-x. [DOI] [PubMed] [Google Scholar]
- 96.Nomiyama T, et al. The polymorphism of manganese superoxide dismutase is associated with diabetic nephropathy in Japanese type 2 diabetic patients. J Hum Genet. 2003;48:138–141. doi: 10.1007/s100380300021. [DOI] [PubMed] [Google Scholar]
- 97.Lee SJ, Choi MG, Kim DS, Kim TW. Manganese superoxide dismutase gene polymorphism (V16A) is associated with stages of albuminuria in Korean type 2 diabetic patients. Metabolism. 2006;55:1–7. doi: 10.1016/j.metabol.2005.04.030. [DOI] [PubMed] [Google Scholar]
- 98.Möllsten A, et al. A functional polymorphism in the manganese superoxide dismutase gene and diabetic nephropathy. Diabetes. 2007;56:265–269. doi: 10.2337/db06-0698. [DOI] [PubMed] [Google Scholar]
- 99.Janssen B, et al. Carnosine as a protective factor in diabetic nephropathy: association with a leucine repeat of the carnosinase gene CNDP1. Diabetes. 2005;54:2320–2327. doi: 10.2337/diabetes.54.8.2320. [DOI] [PubMed] [Google Scholar]
- 100.Freedman BI, et al. A leucine repeat in the carnosinase gene CNDP1 is associated with diabetic end-stage renal disease in European Americans. Nephrol Dial Transplant. 2007;22:1131–1135. doi: 10.1093/ndt/gfl717. [DOI] [PubMed] [Google Scholar]
- 101.McDonough CW, et al. The influence of carnosinase gene polymorphisms on diabetic nephropathy risk in African-Americans. Hum Genet. 2009;126:265–275. doi: 10.1007/s00439-009-0667-0. [DOI] [PMC free article] [PubMed] [Google Scholar]
- 102.McKnight AJ, et al. A GREM1 gene variant associates with diabetic nephropathy. J Am Soc Nephrol. 2010;21:773–781. doi: 10.1681/ASN.2009070773. [DOI] [PMC free article] [PubMed] [Google Scholar]
- 103.Millis MP, Bowen D, Kingsley C, Watanabe RM, Wolford JK. Variants in the plasmacytoma variant translocation gene (PVT1) are associated with end-stage renal disease attributed to type 1 diabetes. Diabetes. 2007;56:3027–3032. doi: 10.2337/db07-0675. [DOI] [PubMed] [Google Scholar]
- 104.Hanson RL, et al. Identification of PVT1 as a candidate gene for end-stage renal disease in type 2 diabetes using a pooling-based genome-wide single nucleotide polymorphism association study. Diabetes. 2007;56:975–983. doi: 10.2337/db06-1072. [DOI] [PubMed] [Google Scholar]
- 105.Tiwari AK, et al. Oxidative stress pathway genes and chronic renal insufficiency in Asian Indians with type 2 diabetes. J Diabetes Complications. 2009;23:102–111. doi: 10.1016/j.jdiacomp.2007.10.003. [DOI] [PubMed] [Google Scholar]
- 106.Liu L, et al. The manganese superoxide dismutase Val16Ala polymorphism is associated with decreased risk of diabetic nephropathy in Chinese patients with type 2 diabetes. Mol Cell Biochem. 2009;322:87–91. doi: 10.1007/s11010-008-9943-x. [DOI] [PubMed] [Google Scholar]
- 107.Wanic K, et al. Exclusion of polymorphisms in carnosinase genes (CNDP1 and CNDP2) as a cause of diabetic nephropathy in type 1 diabetes: results of large case-control and follow-up studies. Diabetes. 2008;57:2547–2551. doi: 10.2337/db07-1303. [DOI] [PMC free article] [PubMed] [Google Scholar]