The consistently high image contrast produced with 100–140 kVp by tantalum compared with other feasible elements suggests that tantalum might be favorable for use as a general purpose clinical CT contrast agent in average-sized and larger patients.
Abstract
Purpose
To quantify the computed tomographic (CT) image contrast produced by potentially useful contrast material elements in clinically relevant imaging conditions.
Materials and Methods
Equal mass concentrations (grams of active element per milliliter of solution) of seven radiodense elements, including iodine, barium, gadolinium, tantalum, ytterbium, gold, and bismuth, were formulated as compounds in aqueous solutions. The compounds were chosen such that the active element dominated the x-ray attenuation of the solution. The solutions were imaged within a modified 32-cm CT dose index phantom at 80, 100, 120, and 140 kVp at CT. To simulate larger body sizes, 0.2-, 0.5-, and 1.0-mm-thick copper filters were applied. CT image contrast was measured and corrected for measured concentrations and presence of chlorine in some compounds.
Results
Each element tested provided higher image contrast than iodine at some tube potential levels. Over the range of tube potentials that are clinically practical for average-sized and larger adults—that is, 100 kVp and higher—barium, gadolinium, ytterbium, and tantalum provided consistently increased image contrast compared with iodine, respectively demonstrating 39%, 56%, 34%, and 24% increases at 100 kVp; 39%, 66%, 53%, and 46% increases at 120 kVp; and 40%, 72%, 65%, and 60% increases at 140 kVp, with no added x-ray filter.
Conclusion
The consistently high image contrast produced with 100–140 kVp by tantalum compared with bismuth and iodine at equal mass concentration suggests that tantalum could potentially be favorable for use as a clinical CT contrast agent.
© RSNA, 2015
Introduction
Intravenous contrast agents are of such immense value that they are administered for most computed tomographic (CT) examinations, despite concerns about risk of renal toxicity and hypersensitivity toxicity (1–4). Although variants of the tri-iodinated benzene ring have been introduced, no substantively new contrast agent has been introduced for CT use in more than 20 years, and iodine is used as the radiodense element in all intravascular CT contrast agents. Aside from drug-specific toxicity, a disadvantage of iodinated contrast agents is the severely reduced CT image contrast when scanned at higher x-ray tube potentials (5,6).
New, more effective contrast agents are needed to improve the conspicuity of minimally enhanced features in all patients, to improve the general conspicuity of contrast material enhancement in large or obese patients, and to permit contrast-enhanced examinations in patients with contraindications to iodinated agents. Nanoparticles that contain higher atomic number (Z) elements offer a potential solution to this challenge, provided they are well tolerated and safe and can be manufactured at a reasonable cost (7–12). Several candidate high-Z elements have been reported in the literature as potential alternatives to iodine (7–29); however, the relative imaging effectiveness produced by each element has not been well quantified with clinical CT scanners.
Imaging efficacy evaluation of various elements requires consideration of image contrast, noise, and radiation dose. To compare the performance of two elements when using different CT imaging spectra—for example, iodine at 80 kVp versus a higher-Z element at 120 kVp—we need to evaluate these three parameters. Image contrast is the most critical of these when screening candidate elements for use in contrast agents because image contrast depends on both the element and the x-ray imaging spectrum, whereas radiation dose and background noise depend on the spectrum but are essentially independent of the image contrast–producing element.
It is possible to simulate the expected CT image contrast produced by a given material by using x-ray spectrum and material attenuation estimation tools (12,25,30). However, spectral models are difficult to validate, and nonideal effects, such as x-ray scatter, are difficult to model. Therefore, empirical results rigorously obtained with a clinical CT scanner are valuable. Others have reported testing a subset of the elements we evaluated, with varying levels of rigor (9,11–20,23,24,26–30). Examples of shortcomings in literature reports include the following: (a) Too few elements were evaluated (11,13–20,23,24,26,27,29); (b) elemental concentrations were unverified and/or uncorrected or were based on molarity rather than mass (11–20,23,26–29); (c) no patient-relevant phantom was used (11,13,14,16,18–20,23,26–29); (d) the full range of clinically used tube potentials was not evaluated or the tube potential that was evaluated was unreported (11,13–15,18–20,23,24,27–29); (e) a small region of interest was used, which leads to uncertainty and reproducibility concerns (5,9,11–13,16–20,23,24,26,28,29); (f) considerations that affect the measured image contrast were unaccounted for and/or uncorrected, such as the solvent in which the tested compound was dissolved (23,28) and elements other than the active element in the compound (11,18,23,26,28); and (g) image contrast (in Hounsfield units) was not explicitly or precisely reported (11,12,17,20,24,26,28,29).
We therefore sought to design a comprehensive, rigorous evaluation to avoid these shortcomings. The primary purpose of our study was to quantify the CT image contrast produced by potentially useful contrast material elements in clinically relevant imaging conditions.
Materials and Methods
Authors (B.M.Y. and J.W.L.) who are not General Electric employees had control of inclusion of all data and information that might present a conflict of interest for those authors who are GE employees (P.F.F., R.E.C., P.M.E., A.S.T., and P.J.B.). Three authors (R.E.C., P.J.B., and A.S.T.) are coauthors of U.S. patent 8728440, which describes the tantalum-based material that was tested in this report.
We measured the CT image contrast produced by seven candidate elements at equal mass concentration in a phantom representative of a large patient across the range of clinically relevant tube potentials.
Element Selection
We selected three candidate elements–iodine, barium, and gadolinium–because they are currently used in medical imaging, although only iodine is used as an intravascular CT agent. We selected four other candidate elements–ytterbium, tantalum, gold, and bismuth–because they are the most frequently cited in the literature as potential clinical CT contrast agents (7–12,31).
CT Phantom Construction
We formulated aqueous solutions of compounds that contain the candidate elements at a nominal concentration of 10 mg of element per milliliter of solution (Table 1). Because the compounds of gadolinium, ytterbium, and bismuth did not readily dissolve in water, sodium citrate was used to facilitate preparation of a homogeneous solution. We measured the concentration by using inductively coupled plasma optical emission spectrometry (Table 1).
Table 1.
Materials Evaluated and Measured Active Element Concentrations
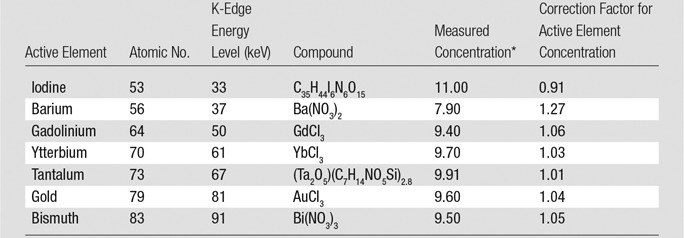
*Data are presented in milligrams of active element per milliliter of solution.
We placed each solution, as well as separate water and aqueous NaCl samples, in specially designed vials with 13-mm inside diameter and placed each vial in the center of a 32-cm–diameter polymethyl methacrylate (PMMA) CT dose index phantom, which had been modified to accept the 19-mm outside diameter of the vial (Fig 1). This apparatus represented a large adult patient and provided a large region of interest in which to precisely estimate the image contrast.
Figure 1:
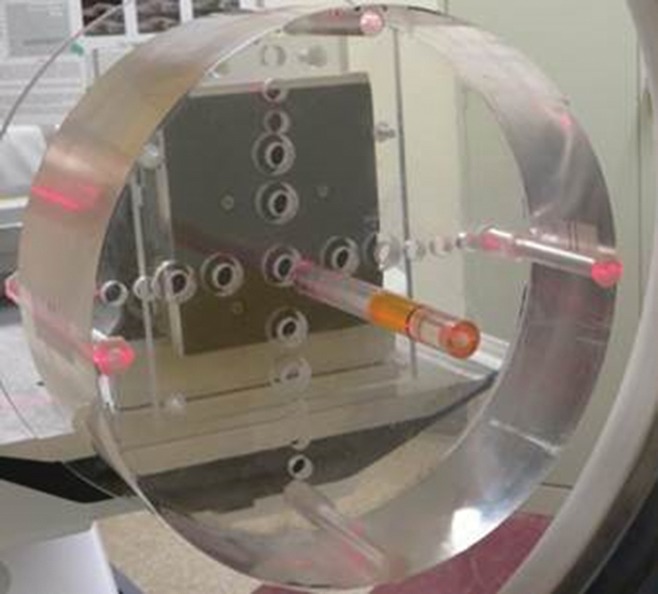
Photograph of the 32-cm CT dose index phantom, with an insert for measuring the image contrast of liquids partly installed in the phantom.
CT Imaging and Image Contrast Measurements
We scanned the phantom in a 64-row CT scanner (LightSpeed VCT; GE Healthcare, Little Chalfont, United Kingdom) with 80, 100, 120, and 140 kVp; 600 mA; 10-mm collimation; large bowtie filter; 1-second rotation; and axial mode. To evaluate the effect of even larger subjects and to consider possible x-ray spectrum optimization, we added filters at the x-ray tube output of 0.2-, 0.5-, and 1.0-mm-thick copper. We reconstructed 0.625-mm-thick images by using a “standard” kernel into a 512 × 512-voxel 32-cm field of view, resulting in (0.625 mm)3 voxels. We measured the CT numbers in Hounsfield units in a 10-mm–diameter region of interest on the reconstructed images; each region of interest included approximately 200 pixels. We averaged measurements from 16 images for contrast material solutions and four sets of 16 images for water and NaCl solutions.
Corrections for Image Contrast
Clinical CT scanners are calibrated to water, and beam-hardening correction algorithms for water are applied to the measured projection data, such that water in reconstructed images is reported as 0 HU. With these corrections, it is assumed that water is the primary material in the subject, and the corrections are valid only for the spectrum with which they were derived. We used a large PMMA phantom and strongly affected the spectrum with the addition of copper filters, so the Hounsfield unit values of the scanner were compromised and thus required further correction. Also, we wanted to compare the image contrast of the candidate elements at equal mass concentration, without the influence of other elements. We corrected our raw results for water calibration, measured mass concentrations, and presence of chlorine in some solutions. Step-by-step correction is explained in Appendix E1 (online).
Illustration of Energy-dependent Attenuation Effects
To illustrate the underlying physical effects that contributed to the results, we estimated the applied spectra by using XSPECT (University of Michigan, Ann Arbor, Mich) (32) and calculated the mass attenuation coefficients of copper, PMMA, and each candidate element by using CatSim (GE Global Research, Niskayuna, NY) (33) and Geant4 (CERN, Geneva, Switzerland) material data (34). For each of the tube potentials used, we calculated the incident spectrum, applied 32-cm PMMA and each of the added filters, and calculated the energy fluence spectrum (ie, the product of the number of photons and the photon energy at each energy level) that would be applied to the candidate image contrast–producing elements. For each candidate element, we calculated an image contrast factor as follows:
where E is the discrete energy in kilo-electron volts; μ(E)/ρ is the mass attenuation coefficient for the material in square centimeters per gram; ρ is the density of the material, which was set to 10 mg/cm3; and L is the path length through the material, which was set to 2 cm. This factor allowed us to illustrate the effect of adding a realistic concentration of contrast element to a realistic-diameter blood vessel. Finally, at each energy level we calculated the product of the energy fluence and the contrast factor and plotted each of the resulting curves.
Results
Empirical Measurements
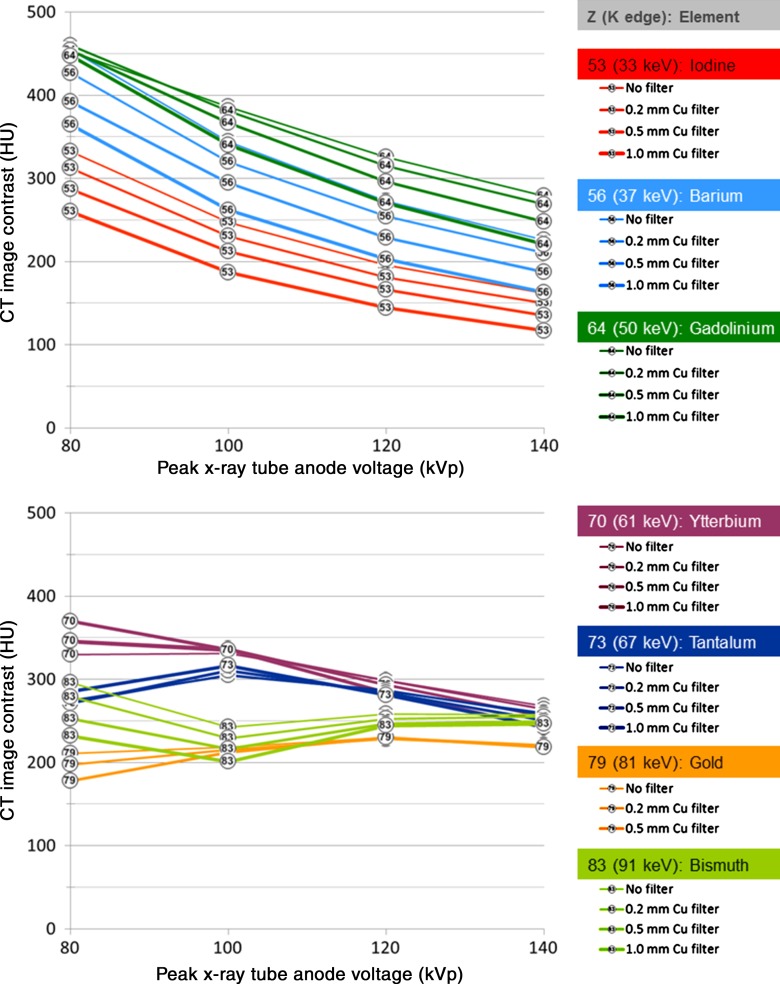
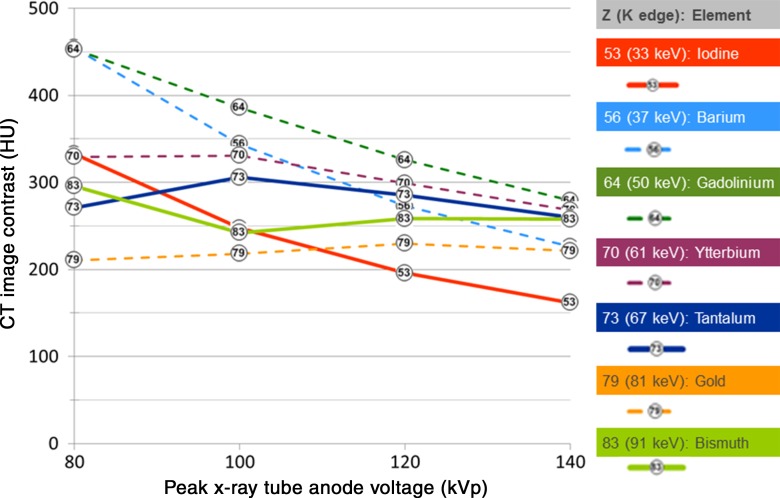
The final corrected results from the empirical study are shown in Table 2, Figure 2, and Figure 3. The raw data (Table E1 [online]) and the data correction process (Tables E2, E3 [online]) are detailed in Appendix E1 (online).
Table 2.
Image Contrast after Corrections Applied for Water Calibration, Measured Elemental Concentration, and Chlorine Content in Formulations of Gadolinium, Ytterbium, and Gold
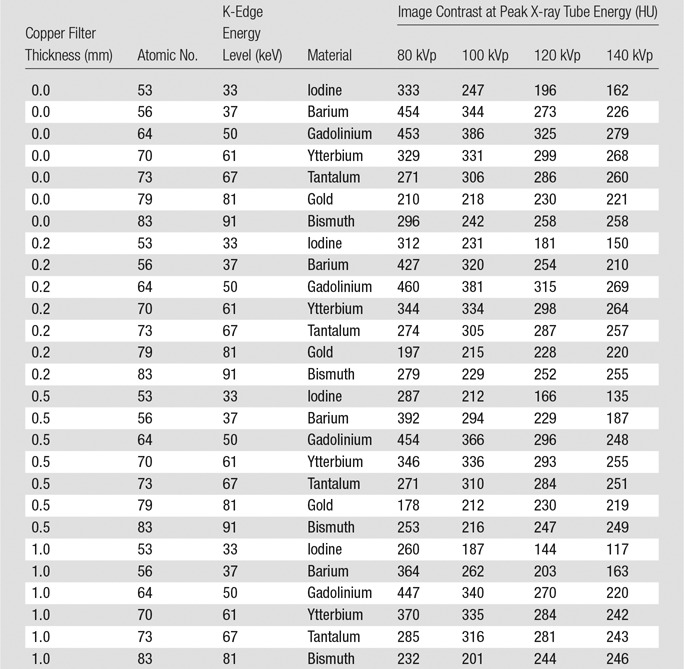
Figure 2:
Graphs of the CT image contrast for lower-Z elements (top) and higher-Z elements (bottom). The material concentration was 10 mg of active element per milliliter of solution, with the sample placed in the center of a 32-cm CT dose index phantom. Increasingly heavy lines indicate increasing x-ray filter thickness.
Figure 3:
Graph of the CT image contrast for all elements tested, with no added x-ray filter. The material concentration was 10 mg of active element per milliliter of solution, with the sample placed in the center of a 32-cm CT dose index phantom. Solid lines indicate candidates that are believed to be potentially viable in general purpose contrast agents; dashed lines indicate candidates that have important limitations.
The image contrast produced by the lower-Z elements (Fig 2, top) monotonically decreased with tube potential; iodine provided the lowest image contrast, and gadolinium provided the highest, in the range of 36%–72% higher than iodine (Table 3). The image contrast produced by these lower-Z elements decreased with increasing filter thickness, which is consistent with the image contrast degradation observed when using iodine in large patients.
Table 3.
Percentage Image Contrast Change versus Iodine with the Same Tube Potential and Copper Filter
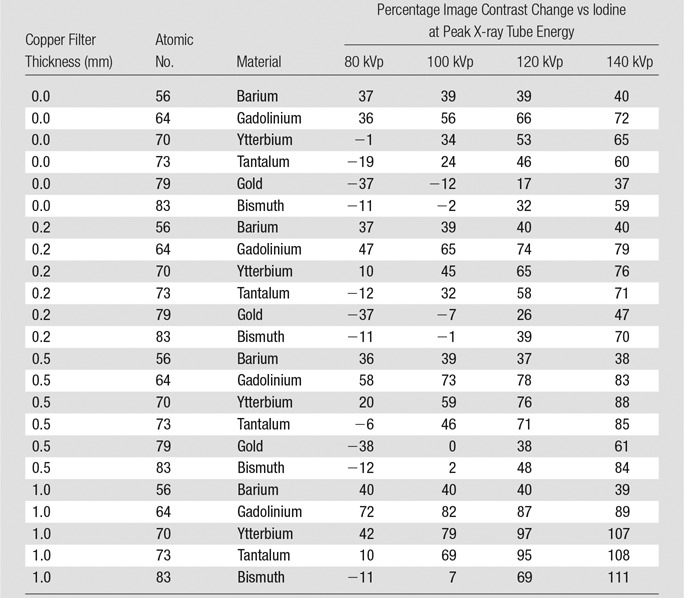
The image contrast curves of higher-Z elements (Fig 2, bottom) were generally nonmonotonic. Gold and bismuth showed higher image contrast than iodine at 120–140 kVp but showed lower image contrast than iodine at 80–100 kVp, except with the thickest filters. Gold and bismuth generally provided lower image contrast than ytterbium and tantalum at all tube potentials. At higher tube potentials (100–140 kVp), ytterbium, tantalum, gold, and bismuth were generally insensitive to signal loss, with added filtration that simulated imaging larger body sizes. Ytterbium and tantalum both substantially outperformed iodine over the range of 100–140 kVp, resulting in image contrast improvement in the range of 24%–108%. At 80 kVp with no added filtration, ytterbium provided 18% higher image contrast than tantalum; however, this benefit became smaller with increasing tube potential.
Illustration of Energy-dependent Attenuation Effects
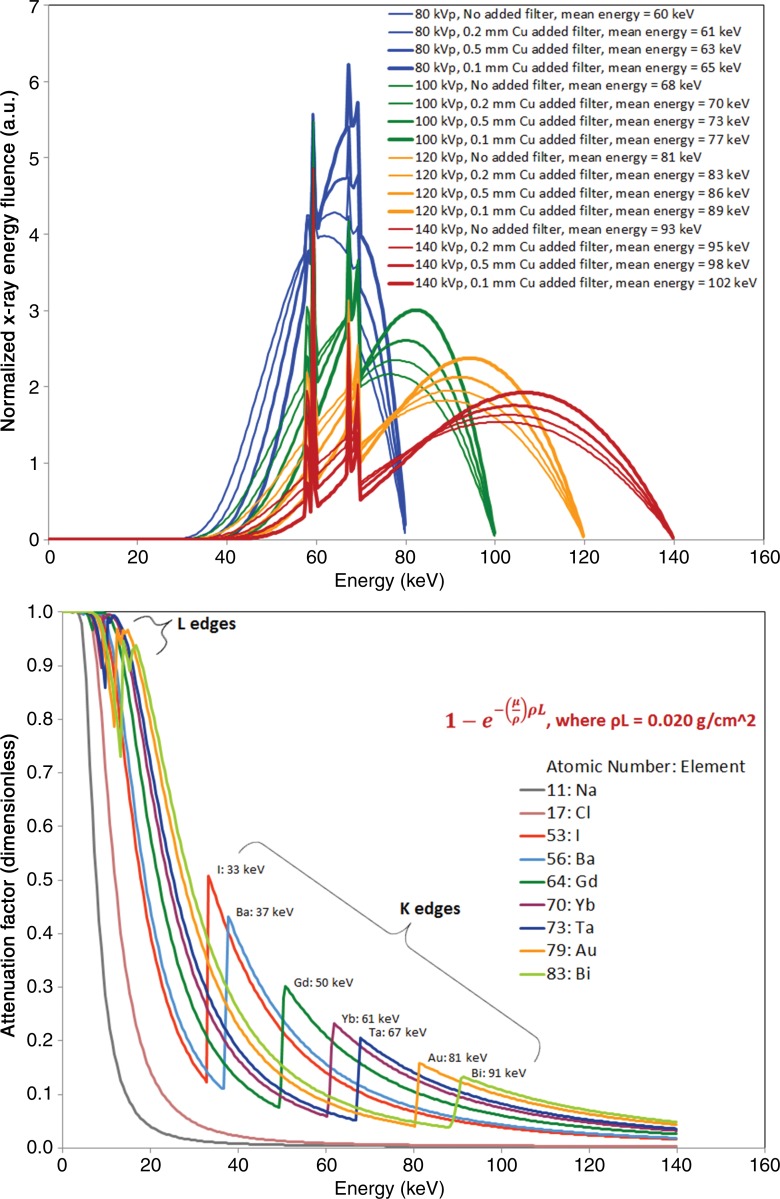
The observed image contrast can be understood by considering the relevant x-ray spectra and attenuation factors shown in Figure 4. The spectra shown in the top of Figure 4 are produced from a tungsten anode; note the x-ray emission peaks at the tungsten K-shell energies in the range of 58–59 keV and 67–69 keV and the sharp decrease in emission at the tungsten 69.5-keV K-edge. The spectra are energy weighted (ie, the vertical axis is in units of energy, not number of photons), and these curves are normalized to equal integrated energy. Furthermore, the spectra plotted are after attenuation of the “patient”—that is, the 32-cm PMMA. Therefore, we can consider these spectra together with the attenuation of each element shown in the bottom of Figure 4 to compare the image contrast produced by each element, with a realistic “patient” and clinical CT system.
Figure 4:
Graph of simulated energy-weighted x-ray spectra after attenuation by intrinsic x-ray tube filtration, bowtie filter, additional copper filter, and 32 cm of PMMA (top). The curves are normalized to equal integrated energy in arbitrary linear units. Mean energies are shown in the legend. Characteristic emission lines from the tungsten anode of the x-ray tube produce increased fluence at the tungsten Kα energies of 58–59 keV and Kβ energies at 67–69 keV; the self-filtration of the tungsten anode produces the sharp decrease in x-ray fluence at the tungsten K-edge at 70 keV. Attenuation factors of various elements (bottom), calculated at ρL = 0.02 g/cm2, illustrate the effect of adding 10 mg per milliliter of the element to a 2-cm–diameter blood vessel (10 mg/cm3 × 2 cm = 0.02 g/cm2).
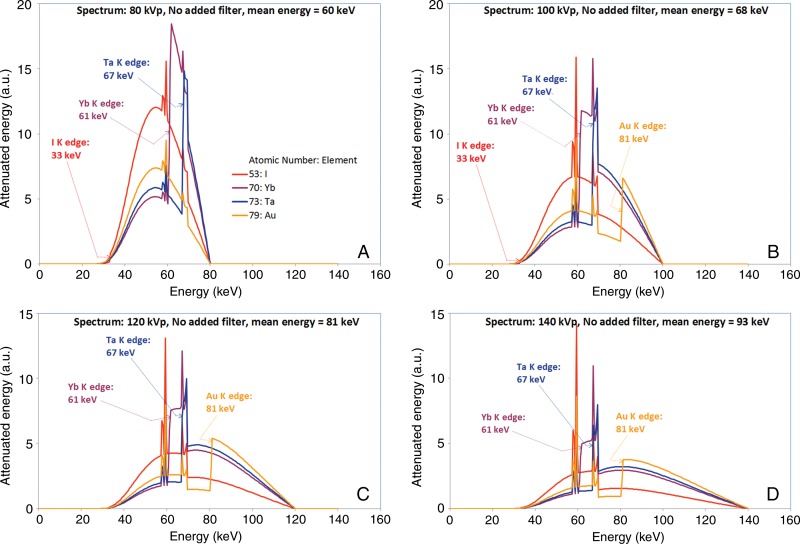
The bottom of Figure 4 shows the result of calculating a contrast factor function as described in Materials and Methods. By calculating the product of any curve from the top of Figure 4 and any curve from the bottom of Figure 4, we can understand how the spectra interact with each element to produce the image contrast we observed. It can be instructive to consider a few example cases, as shown in Figure 5. The image contrast produced by those elements with those spectra is determined by the areas under the curves.
Figure 5:
Graphs of simulated x-ray attenuation produced by a 2-cm-thick layer of each specified element by using simulated spectra of A, 80 kVp, B, 100 kVp, C, 120 kVp, and D, 140 kVp, each attenuated by intrinsic x-ray tube filtration, the bowtie filter, and a 30-cm-thick layer of PMMA.
80-kVp Examples
As shown in the bottom of Figure 4, the K-edge of iodine occurs at 33 keV, and iodine exhibits a large increase in attenuation at that energy level. However, the spectrum is weak at that energy level (Fig 4, top), so there is little to be attenuated. But from 33 keV to the K-edge of ytterbium at 61 keV, iodine produces much higher attenuation than the other elements considered in Figure 5, A. As a result, iodine produces good overall image contrast with an 80-kVp spectrum.
Up to 61 keV, ytterbium produces the lowest attenuation of any element in Figure 5, A. At 61 keV, the K-edge of ytterbium interacts with the near-peak 80-kVp spectrum, and the resulting high attenuation of ytterbium from 61 to 80 keV gives ytterbium good overall image contrast, comparable to that of iodine.
Tantalum produces the second-lowest attenuation of any element in this plot below its K-edge at 67 keV, which is close to the 80-keV peak energy, so tantalum can only provide moderate image contrast with an 80-kVp spectrum.
With its K-edge at 81 keV, gold provides the lowest image contrast among these four elements at 80 kVp.
120-kVp Examples
With a 120-kVp spectrum (Fig 5, C), from the K-edge of iodine at 33 keV to the K-edge of ytterbium at 61 keV, iodine again produces the highest attenuation among these four elements. However, since the mean energy of the 120-kVp incident spectrum is 81 keV, the other elements have a large range of energy levels in which to make up for the strength of iodine in the lower energy levels. As a result, iodine produces lower overall image contrast with a 120-kVp spectrum versus an 80-kVp spectrum.
Ytterbium produces higher attenuation than tantalum from its 61-keV K-edge until the 67-keV K-edge of tantalum, at which point ytterbium and tantalum are essentially equal until the 69.5-keV K-edge of the tungsten anode of the x-ray source, which causes the sharp decrease in attenuated energy for all elements. Above 69.5 keV, tantalum slightly outperforms ytterbium, almost making up for the higher attenuation of ytterbium from 61 to 67 keV, and the result is that both ytterbium and tantalum provide good overall image contrast at 120 kVp–substantially higher than that of iodine at 120 kVp and comparable to that of iodine at 80 kVp.
With its K-edge at 81 keV, gold has low attenuation below that energy level and good attenuation above its K-edge. This tends to average such that at 120 kVp, gold provides lower overall image contrast than ytterbium and tantalum and only modestly higher image contrast than iodine.
All of the energies that influence our image contrast measurements are summarized in Table 4. With regard to Figure 2 and Table 4, the K-edges of iodine, barium, and gadolinium are all well below the mean energies of all spectra, which leads to their monotonically decreasing image contrast. In comparison, the spectrum mean energy levels are intermingled with the K-edge energy levels of ytterbium and tantalum, resulting in image contrast with a local maximum at 100 kVp with the unfiltered spectra. The interesting behavior of ytterbium at 80 kVp is due to its K-edge being near the various mean energy levels of the 80-kVp spectra. The high K-edge energy levels of gold and bismuth result in low image contrast at the lower tube potentials, except that at 80 kVp, the L-edge of bismuth leads to increased attenuation (Fig 4, bottom). The maximum image contrast at 120 kVp for gold and 140 kVp for bismuth are lower than those of ytterbium and tantalum because of the high K-edge energy levels of gold and bismuth and the relatively low magnitude of attenuation increase at the K-edges of those elements.
Table 4.
Summary of Energies That Contribute to the Observed Image Contrast
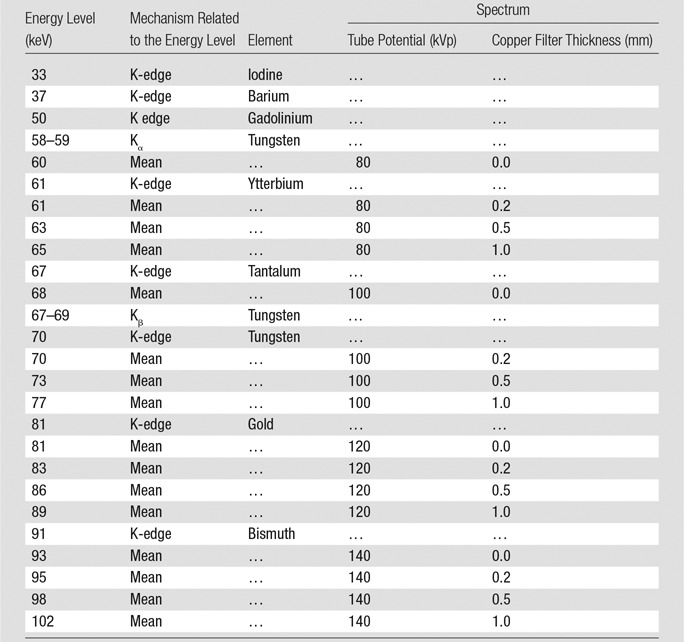
Note.—Mean energies are those of the spectra after filtration by the bowtie filter and the 32-cm PMMA phantom.
Discussion
We found that in terms of image contrast, iodine is the lowest-performing element of those we tested at tube potentials that are practical for medium-sized and larger adults; the highest overall performance is demonstrated by gadolinium, barium, ytterbium, and tantalum. The medical CT systems today permit scanning at 80–140 kVp and at 70 kVp on some scanners. A level of 70–80 kVp can be used for pediatric and small adult patients; however, x-ray tube current limitations require the use of higher tube potential settings as the patient size increases (5,6). We found that gadolinium, ytterbium, and tantalum show the highest improvement in image contrast over iodine at the higher tube potentials. These findings suggest that one of these elements or an element in the range of atomic numbers of these elements (Z = 64–73) could potentially be developed into a clinical contrast agent that would offer a higher-performing alternative to iodine.
Gadolinium is the highest-performing element of those we tested. Gadolinium-based contrast agents are approved for use at MR imaging and have been used off-label at CT at higher doses than are prescribed for MR imaging (35). The dose prescribed for gadolinium-based agents at MR imaging has approximately 25 times lower mass concentration of gadolinium than the mass concentration of iodine from a typical injection of iodine-based agent at CT (36); this more than offsets the approximately 1.5 times improved image contrast of gadolinium-based contrast material at equal mass concentration. There has been heated debate regarding the safe use of higher doses of gadolinium-based agents (35,36); a clinical trial is now starting for the evaluation of the effectiveness of low-dose gadolinium-based agents at dual-energy CT (37). Nevertheless, it seems unlikely that gadolinium could be used safely and routinely at the doses required for general-purpose CT.
Barium has been used for decades as an oral contrast agent; however, toxicity concerns, particularly regarding toxicity to cardiovascular and renal systems (38), discourage consideration for development as an intravascular contrast agent.
Ytterbium and tantalum have similar performance to each other, except that ytterbium has improved image contrast at 80 kVp. Ytterbium-based agents are currently being investigated in a research environment, and the published physicochemical and biological data are preliminary (23,28). Although the prevalence of ytterbium in the earth’s crust is reasonably high, the entire current worldwide annual production of ytterbium would only be enough for approximately 1 million CT examinations (39), or only a few percent of the estimated 30 million contrast-enhanced CT examinations performed annually in the United States alone (2).
Gold provides substantially lower image contrast than that of ytterbium and tantalum at all tube potentials. Furthermore, a single dose of gold-based contrast agent for a conventional CT scan would cost more than $1000. Therefore, gold isn’t a practical candidate for use in a general-purpose CT contrast agent.
Bismuth provides lower image contrast than iodine at 80 kVp and lower or equal image contrast when compared with that of ytterbium and tantalum at 100–140 kVp. Although bismuth is plentiful and inexpensive, there are toxicity concerns associated with orally administered bismuth (40,41), and the safety profile of some bismuth compounds for intravenous use is a concern (42). However, because bismuth has been used orally at high doses for a very long time, we believe that it cannot be excluded from consideration on the basis of toxicity concerns alone.
Considering the substantial limitations associated with gadolinium, barium, ytterbium, gold, and bismuth, tantalum clearly merits further consideration. Results published to date suggest that some tantalum oxide nanoparticles have physicochemical and biological characteristics that make them attractive for use as intravascular CT contrast agents (16,19,21,22). These water-soluble agents can be formulated at concentrations required for CT and radiography and are well tolerated at high doses. Furthermore, the formulations with particle size on the order of a few nanometers are excreted primarily via renal clearance mechanisms, resulting in a low retention in tissues when injected into rats. With its outstanding performance compared with iodine at 100–140 kVp, tantalum could lead to reduced radiation dose and/or reduced contrast agent dose and/or improved image quality for most adult patients. At 120 kVp, tantalum produces approximately 50% higher image contrast than that of iodine. If this improvement is used to reduce radiation dose rather than reduce contrast agent dose or improve image quality, dose reduction of more than 50% can be realized, and higher dose reduction can be expected for overweight and obese patients. Alternatively, the increased image contrast over iodine could be used to proportionately reduce contrast agent dose for patients with renal impairment—that is, the 50% improvement in image contrast could permit a one-third reduction in contrast agent dose. Furthermore, the nanoparticle size could potentially be optimized to improve in vivo performance compared with small-molecule iodinated agents, if reduced extravasation can be achieved while retaining excellent renal clearance.
Our study had several limitations. First, we only evaluated one phantom size, and the CT dose index phantom is a less-than-ideal approximation of a human patient. We only measured the image contrast of the selected elements–no evaluation of soft-tissue image contrast versus tube potential was performed. Second, we did not evaluate radiation dose or image noise to quantify the tradeoffs between those parameters, image contrast, and contrast agent dose. Third, in our study, we did not address the many critically important considerations related to developing a safe and viable contrast agent by using these elements. These elements could conceivably be formed into small molecules or particles ranging from one nanometer to hundreds of nanometers in size and could involve many different variations in surface chemistry, all of which could lead to dramatically varying biological, physicochemical, and pharmacokinetic performance and thus a wide range of safety profiles. Concerns include possible toxicity and biocompatibility of the various elements themselves, potential toxicity associated with nanoscale particles, and the many complex factors that lead to dynamic imaging effectiveness and biological clearance. These important considerations are beyond the scope of our current investigation and will require extensive testing of specific compounds and formulations. Nevertheless, our study allowed us to identify the most promising candidate elements for future development from an image contrast perspective.
In conclusion, our phantom CT study indicates that a range of heavy metal elements provides superior image contrast to iodine across clinically used CT tube potentials. The consistently high image contrast produced at 100–140 kVp by tantalum compared with other feasible elements suggests that tantalum might be favorable for use as a general purpose clinical CT contrast agent in average-sized and larger patients. This benefit could be used to improve image quality or reduce radiation dose or contrast agent dose, as compared with an iodinated agent.
Advances in Knowledge
■ Over the range of 100–140 kVp, which are settings practical for CT of average-sized and larger adults, barium, gadolinium, ytterbium, and tantalum produce higher CT image contrast than that achieved with currently available iodinated contrast agents at equal mass concentration; however, barium, gadolinium, and ytterbium have critical limitations that may preclude their broad use as general purpose intravascular CT contrast agents.
■ Tantalum generally produces higher CT image contrast than that with gold or bismuth at equal mass concentration.
■ Tantalum is the highest-performing element that has been identified as a feasible candidate for a general purpose intravenous radiography and/or CT contrast agent and provides an image contrast improvement of 24%, 46%, and 60% compared with iodine at 100, 120, and 140 kVp, respectively.
Implications for Patient Care
■ Use of tantalum-based rather than iodinated contrast agents for CT may enable higher conspicuity and/or lower radiation dose, especially for average-sized and larger adult patients.
■ Use of tantalum-based rather than iodinated contrast agents for CT may enable use of a lower contrast agent dose, especially for older patients who may be less sensitive to radiation dose but may have renal challenges.
■ Tantalum-based contrast agents may enable CT in patients with contraindications to iodinated agents.
■ Use of tantalum-based contrast agents together with iodinated contrast agents in the same CT examination may enable new diagnostic CT capabilities.
APPENDIX
Received March 20, 2015; revision requested April 27; revision received May 18; accepted June 23; final version accepted July 6.
From the 2014 RSNA Annual Meeting.
Research reported in this publication was supported by the National Institute of Biomedical Imaging and Bioengineering of the National Institutes of Health under award number R01EB015476. The content is solely the responsibility of the authors and does not necessarily represent the official views of the National Institutes of Health.
Funding: This research was supported by the National Institutes of Health (grant R01EB015476).
Disclosures of Conflicts of Interest: P.F.F. Activities related to the present article: disclosed no relevant relationships. Activities not related to the present article: author is an employee of GE Global Research, General Electric Company. Other relationships: disclosed no relevant relationships. R.E.C. Activities related to the present article: disclosed no relevant relationships. Activities not related to the present article: author is an employee of General Electric. Other relationships: author has patents. P.M.E. Activities related to the present article: disclosed no relevant relationships. Activities not related to the present article: author is an employee of GE Global Research. Other relationships: disclosed no relevant relationships. J.W.L. disclosed no relevant relationships. A.S.T. Activities related to the present article: disclosed no relevant relationships. Activities not related to the present article: author is an employee of General Electric Company. Other relationships: author has patents relating to tantalum contrast agents. P.J.B. Activities related to the present article: disclosed no relevant relationships. Activities not related to the present article: author is an employee of General Electric Company. Other relationships: author has patents related to tantalum contrast agents. B.M.Y. Activities related to the present article: disclosed no relevant relationships. Activities not related to the present article: disclosed no relevant relationships. Other relationships: author is a shareholder of Nextrast.
Abbreviation:
- PMMA
- polymethyl methacrylate
References
- 1.Solomon R, Dauerman HL. Contrast-induced acute kidney injury. Circulation 2010;122(23):2451–2455. [DOI] [PubMed] [Google Scholar]
- 2.McDonald JS, McDonald RJ, Comin J, et al. Frequency of acute kidney injury following intravenous contrast medium administration: a systematic review and meta-analysis. Radiology 2013;267(1):119–128. [DOI] [PubMed] [Google Scholar]
- 3.McDonald RJ, McDonald JS, Bida JP, et al. Intravenous contrast material-induced nephropathy: causal or coincident phenomenon? Radiology 2013;267(1):106–118. [DOI] [PMC free article] [PubMed] [Google Scholar]
- 4.Solomon R. Contrast media: are there differences in nephrotoxicity among contrast media? BioMed Res Int 2014;2014:934947. [DOI] [PMC free article] [PubMed] [Google Scholar]
- 5.Kalender WA, Deak P, Kellermeier M, van Straten M, Vollmar SV. Application- and patient size-dependent optimization of x-ray spectra for CT. Med Phys 2009;36(3):993–1007. [DOI] [PubMed] [Google Scholar]
- 6.Yu L, Li H, Fletcher JG, McCollough CH. Automatic selection of tube potential for radiation dose reduction in CT: a general strategy. Med Phys 2010;37(1):234–243. [DOI] [PubMed] [Google Scholar]
- 7.Lusic H, Grinstaff MW. X-ray-computed tomography contrast agents. Chem Rev 2013;113(3):1641–1666. [DOI] [PMC free article] [PubMed] [Google Scholar]
- 8.Cormode DP, Naha PC, Fayad ZA. Nanoparticle contrast agents for computed tomography: a focus on micelles. Contrast Media Mol Imaging 2014;9(1):37–52. [DOI] [PMC free article] [PubMed] [Google Scholar]
- 9.Jakhmola A, Anton N, Vandamme TF. Inorganic nanoparticles based contrast agents for x-ray computed tomography. Adv Healthc Mater 2012;1(4):413–431. [DOI] [PubMed] [Google Scholar]
- 10.Lee N, Choi SH, Hyeon T. Nano-sized CT contrast agents. Adv Mater 2013;25(19):2641–2660. [DOI] [PubMed] [Google Scholar]
- 11.Liu Y, Ai K, Lu L. Nanoparticulate x-ray computed tomography contrast agents: from design validation to in vivo applications. Acc Chem Res 2012;45(10):1817–1827. [DOI] [PubMed] [Google Scholar]
- 12.Nowak T, Hupfer M, Brauweiler R, Eisa F, Kalender WA. Potential of high-Z contrast agents in clinical contrast-enhanced computed tomography. Med Phys 2011;38(12):6469–6482. [DOI] [PubMed] [Google Scholar]
- 13.Gierada DS, Bae KT. Gadolinium as a CT contrast agent: assessment in a porcine model. Radiology 1999;210(3):829–834. [DOI] [PubMed] [Google Scholar]
- 14.Rabin O, Manuel Perez J, Grimm J, Wojtkiewicz G, Weissleder R. An x-ray computed tomography imaging agent based on long-circulating bismuth sulphide nanoparticles. Nat Mater 2006;5(2):118–122. [DOI] [PubMed] [Google Scholar]
- 15.Boote E, Fent G, Kattumuri V, et al. Gold nanoparticle contrast in a phantom and juvenile swine: models for molecular imaging of human organs using x-ray computed tomography. Acad Radiol 2010;17(4):410–417. [DOI] [PMC free article] [PubMed] [Google Scholar]
- 16.Bonitatibus PJ, Jr, Torres AS, Goddard GD, FitzGerald PF, Kulkarni AM. Synthesis, characterization, and computed tomography imaging of a tantalum oxide nanoparticle imaging agent. Chem Commun (Camb) 2010;46(47):8956–8958. [DOI] [PubMed] [Google Scholar]
- 17.Jackson PA, Rahman WNWA, Wong CJ, Ackerly T, Geso M. Potential dependent superiority of gold nanoparticles in comparison to iodinated contrast agents. Eur J Radiol 2010;75(1):104–109. [DOI] [PubMed] [Google Scholar]
- 18.Chou SW, Shau YH, Wu PC, Yang YS, Shieh DB, Chen CC. In vitro and in vivo studies of FePt nanoparticles for dual modal CT/MRI molecular imaging. J Am Chem Soc 2010;132(38):13270–13278. [DOI] [PubMed] [Google Scholar]
- 19.Oh MH, Lee N, Kim H, et al. Large-scale synthesis of bioinert tantalum oxide nanoparticles for x-ray computed tomography imaging and bimodal image-guided sentinel lymph node mapping. J Am Chem Soc 2011;133(14):5508–5515. [DOI] [PubMed] [Google Scholar]
- 20.Ai K, Liu Y, Liu J, Yuan Q, He Y, Lu L. Large-scale synthesis of Bi(2)S(3) nanodots as a contrast agent for in vivo x-ray computed tomography imaging. Adv Mater 2011;23(42):4886–4891. [DOI] [PubMed] [Google Scholar]
- 21.Torres AS, Bonitatibus PJ, Jr, Colborn RE, et al. Biological performance of a size-fractionated core-shell tantalum oxide nanoparticle x-ray contrast agent. Invest Radiol 2012;47(10):578–587. [DOI] [PubMed] [Google Scholar]
- 22.Bonitatibus PJ, Jr, Torres AS, Kandapallil B, et al. Preclinical assessment of a zwitterionic tantalum oxide nanoparticle x-ray contrast agent. ACS Nano 2012;6(8):6650–6658. [DOI] [PubMed] [Google Scholar]
- 23.Liu Y, Ai K, Liu J, Yuan Q, He Y, Lu L. A high-performance ytterbium-based nanoparticulate contrast agent for in vivo x-ray computed tomography imaging. Angew Chem Int Ed Engl 2012;51(6):1437–1442. [DOI] [PubMed] [Google Scholar]
- 24.Galper MW, Saung MT, Fuster V, et al. Effect of computed tomography scanning parameters on gold nanoparticle and iodine contrast. Invest Radiol 2012;47(8):475–481. [DOI] [PMC free article] [PubMed] [Google Scholar]
- 25.Ghadiri H, Ay MR, Shiran MB, Soltanian-Zadeh H, Zaidi H. K-edge ratio method for identification of multiple nanoparticulate contrast agents by spectral CT imaging. Br J Radiol 2013;86(1029):20130308. [DOI] [PMC free article] [PubMed] [Google Scholar]
- 26.Liu Z, Ju E, Liu J, et al. Direct visualization of gastrointestinal tract with lanthanide-doped BaYbF5 upconversion nanoprobes. Biomaterials 2013;34(30):7444–7452. [DOI] [PubMed] [Google Scholar]
- 27.Jakhmola A, Anton N, Anton H, et al. Poly-ε-caprolactone tungsten oxide nanoparticles as a contrast agent for x-ray computed tomography. Biomaterials 2014;35(9):2981–2986. [DOI] [PubMed] [Google Scholar]
- 28.Liu Y, Liu J, Ai K, Yuan Q, Lu L. Recent advances in ytterbium-based contrast agents for in vivo x-ray computed tomography imaging: promises and prospects. Contrast Media Mol Imaging 2014;9(1):26–36. [DOI] [PubMed] [Google Scholar]
- 29.Rieffel J, Chen F, Kim J, et al. Hexamodal imaging with porphyrin-phospholipid-coated upconversion nanoparticles. Adv Mater 2015;27(10):1785–1790. [DOI] [PMC free article] [PubMed] [Google Scholar]
- 30.Fitzgerald P, Colborn RE, Edic P, Yeh BM, Torres AS. CT image contrast of seven high-Z elements within a 32 cm phantom and using various additional x-ray filters [abstr]. In: Radiological Society of North America Scientific Assembly and Annual Meeting Program. Oak Brook, Ill: Radiological Society of North America, 2014; 144. [Google Scholar]
- 31.He W, Ai K, Lu L. Nanoparticulate x-ray CT contrast agents. Sci China Chem 2015;58(5):753–760. [Google Scholar]
- 32.Dodge CWI. A rapid method for the simulation of filtered x-ray spectra in diagnostic imaging systems. Detroit, Mich: Wayne State University, 2008. [Google Scholar]
- 33.De Man B, Basu S, Chandra N, et al. CatSim: a new computer assisted tomography simulation environment. In: Hsieh J, Flynn MJ, eds. Proceedings of SPIE: medical imaging 2007—physics of medical imaging. Vol 6510. Bellingham, Wash: International Society for Optics and Photonics, 2007; 65102G. [Google Scholar]
- 34.Agostinelli S, Allison J, Amako K, et al. Geant4—a simulation toolkit. Nucl Instrum Meth A 2003;506(3):250–303. [Google Scholar]
- 35.Esteban JM, Alonso A, Cervera V, Martínez V. One-molar gadolinium chelate (gadobutrol) as a contrast agent for CT angiography of the thoracic and abdominal aorta. Eur Radiol 2007;17(9):2394–2400. [DOI] [PubMed] [Google Scholar]
- 36.Nyman U, Elmståhl B, Leander P, Almén T. Iodine contrast media doses equal-attenuating with gadolinium chelates at CT-aortography may have less risk of contrast-induced nephropathy and no risk of nephrogenic systemic fibrosis in azotaemic patients! Eur Radiol 2008;18(9):2013–2014. [DOI] [PubMed] [Google Scholar]
- 37.Sharma A. A feasibility study to assess the use of gadolinium in computed tomography. U.S. National Institutes of Health. https://clinicaltrials.gov/ct2/show/NCT02163005. Published 2015. Accessed August 24, 2015. [Google Scholar]
- 38.Foster S, Choudhury H, Colman J, Ingerman L, Robbins P. Toxicological Review of Barium and Compounds. EPA/635/R-05/001. http://www.epa.gov/iris/toxreviews/0010tr.pdf. Published 2005. Accessed August 24, 2015. [Google Scholar]
- 39.Emsley J. Nature’s building blocks: an A-Z guide to the elements. New York, NY: Oxford University Press, 2011; 614–615. [Google Scholar]
- 40.Bradley B, Singleton M, Lin Wan Po A. Bismuth toxicity—a reassessment. J Clin Pharm Ther 1989;14(6):423–441. [DOI] [PubMed] [Google Scholar]
- 41.Reynolds PT, Abalos KC, Hopp J, Williams ME. Bismuth toxicity: a rare cause of neurologic dysfunction. Int J Clin Med 2012;3(1):46–48. [Google Scholar]
- 42.Goodman L. Sudden death after intravenous sodium bismuth tartrate. BMJ 1948;1(4559):978–979. [DOI] [PMC free article] [PubMed] [Google Scholar]
Associated Data
This section collects any data citations, data availability statements, or supplementary materials included in this article.


