

Abstract
Background
The prevailing efforts for cardiovascular disease (CVD) prevention focused on treatment of common CVD risk factors rather than primordial prevention of risk factors through health behaviors. The previously validated Healthy Heart Score effectively predicted the 20-year risk of CVD in mid-adulthood; however, it is unknown whether this risk score is associated with clinically-relevant CVD risk factors.
Methods and Results
We analyzed the association between the Healthy Heart Score and incidence of clinical CVD risk factors, including diabetes, hypertension, and hypercholesterolemia among 69,505 U.S women in the Nurses' Health Study II (1991-2011). The Healthy Heart Score estimates the 20 –year CVD risk based on 9 lifestyle factors, thus a higher score reflected a higher predictive CVD risk. Over 20 years, we documented 3,275 incident cases of diabetes, 17,420 of hypertension, and 24,385 of hypercholesterolemia. Women with higher predicted CVD risk based on the Healthy Heart Score (highest quintile vs. lowest) had significantly greater risk of each clinical risk factor individually: Hazard Ratio (HR) 18.1 (95% confidence interval (CI): 14.4-22.7) for diabetes; 5.10 (4.66, 5.57) for hypertension; and 2.57 (2.40, 2.75) for hypercholesterolemia. The HR for developing the high-CVD profile was 52.5 (33.6-82.1). These associations were most pronounced among women who were younger, non-smokers, or had optimal weight.
Conclusions
An absolute 20-year risk of CVD, estimated by the Healthy Heart Score, was strongly associated with the development of CVD clinically-relevant risk factors. This risk score may serve as the first step for CVD risk assessment in primordial prevention.
Keywords: lifestyle, prevention, women, epidemiology, clinical risk factors
Despite significant reductions in mortality, cardiovascular disease (CVD) remains the leading cause of death in the US.1 Clinical risk factors such as diabetes, hypertension, and dyslipidemia are associated with substantial long-term risk of CVD.2, 3 Current prevention strategies focus on the primary prevention of CVD through the reduction in levels of clinical risk factors, primarily through drug therapy.4 However, successful pharmacological treatment of clinical risk factors does not eliminate the harmful effects of having developed risk factors entirely and is associated with substantial costs and side effects.5 Alternatively, primordial prevention of CVD focuses on the prevention of the development of clinical risk factors through healthy lifestyle factors.6 Nonetheless, the prevalence of these healthy behaviors among US adults remains low.7, 8
We recently derived and validated the Healthy Heart Score, a 20-year CVD risk prediction model based on modifiable lifestyle factors in middle-aged adults.9 Such a tool may help prioritize primordial prevention strategies in clinical and community-based settings; however, whether the Healthy Heart Score is associated with intermediate clinical CVD risk factors is not known. We aimed to quantify the association between the previously derived Healthy Heart Score and incidence of clinical risk factors, including diabetes, hypertension, and hypercholesterolemia, among women in the Nurses' Health Study II (NHSII).
Methods
Study population
The NHSII was established in 1989 when 116,430 registered nurses aged 25-42 years responded to a self-administered questionnaire about detailed medical history, lifestyle and other health information. Participants first completed a validated semi-quantitative food frequency questionnaire (FFQ)10 to assess dietary intake in 1991, which served as the baseline for the current investigation. We send follow-up questionnaires biennially to update participant information on potential risk factors and to identify newly diagnosed diseases.
We excluded women who had invalid dietary data (>70 food items blank or reported energy intake <600 kcal/d or > 3500 kcal/d) or who were missing information on alcohol, physical activity, BMI, or smoking in 1991. Additionally, we excluded women who had CVD, cancer, diabetes, hypertension, or hypercholesterolemia at baseline, leaving 69,505 women available for the current analysis. The IRB at Brigham and Women's Hospital approved the study protocol and return of the questionnaire implied informed consent.
Assessment of healthy lifestyle
The Healthy Heart Score is a CVD risk prediction model that estimates the 20-year risk of CVD based on lifestyle factors and was developed separately within 2 cohorts of men [the Health Professional Follow-up Study(HPFS)]11 and women [the Nurses' Health Study (NHS))12 free of CVD, diabetes and cancer at baseline.9 The Score demonstrated good discrimination, fit and calibration. We applied the Healthy Heart Score derived in the NHS to this new cohort of younger female nurses. While numerous lifestyle predictors of CVD were considered, the final parsimonious model included the 9 most critical factors that best estimated CVD risk: current smoking, higher BMI, low physical activity, lack of moderate alcohol consumption, low intakes of fruits, vegetables, cereal fiber, and nuts, and high intakes of sugar-sweetened beverages and red and processed meats (Figure 1). A higher Healthy Heart Scores reflected a higher risk of CVD.
Figure 1.

Formula to estimate the 20-Year Risk of CVD based on lifestyle predictors in women
Smoking status was self-reported and categorized as ‘never’, ‘past’, or ‘current’. BMI (kg/m2) was calculated from self-reported height and weight which was highly correlated with directly measured weight previously (r=0.96).13 For physical activity, we used a previously validated physical activity questionnaire14, 15 to estimate the average hours per week spent in moderate or vigorous intensity activity (≥3 metabolic equivalent tasks [METs]). For each food item, participants were asked how often on average a specified portion was consumed during the past year.10 Cereal fiber and alcohol intake were calculated by multiplying the nutrient content of each food item (from the Harvard University Food Composition Database) by the frequency of intake and summed across all food items. We used the residual method to adjust cereal fiber for total energy.16 We calculated average g/day of alcohol intake, assuming 12.8g of alcohol in 12oz of beer, 11.0g of alcohol in 4oz of wine, and 14.0g of alcohol in 1.5oz of liquor. Every two years, we updated information on smoking status, weight and physical activity. Diet was updated every four years.
Data on parental history of myocardial infarction (MI), aspirin use, menopausal status, postmenopausal hormone use, parity, and oral contraceptive use were assessed on biennial self-reported questionnaires.
Assessment of clinical risk factors
The outcomes for this study included three health factors included in the American Heart Association's definition of cardiovascular health: type 2 diabetes, hypertension, and hypercholesterolemia.7 Self-reported type 2 diabetes was confirmed by a validated supplemental questionnaire using the National Diabetes Data Group criteria17 for cases identified before 1998 and the American Diabetes Association criteria18 for cases identified after 1998. In a previous validation study, 98% of self-reported cases were confirmed by medical records.19 Participants self-reported physician-diagnosed hypertension and hypercholesterolemia. We defined incident hypertension and hypercholesterolemia as the first report of either the physician diagnosis of the risk factor or the reported use of medication for lowering blood pressure or cholesterol, respectively. In validation studies, 94% of self-reported cases of hypertension and 86% of self-reported cases of hypercholesterolemia were confirmed by medical records.20, 21 The calendar year of diagnosis was recorded and used to estimate a time-to-event month assignment for the purposes of survival analysis, based on the month of questionnaire return.22 We defined a high CVD risk profile as the diagnosis of all 3 clinical risk factors.
We conducted sensitivity analyses with alternative case definitions for hypercholesterolemia and hypertension to test the robustness of the association. First we defined hypertension and hypercholesterolemia based on self-reported physician diagnosis only, without considering medication use. Second, we restricted cases of incident hypertension and hypercholesterolemia to participants also reporting medication use.
Statistical Analysis
Women contributed person-time from the return of the 1991 questionnaire until the date of diagnosis of the first clinical risk factor, CVD, death, or end of follow-up (June 2011), whichever came first. For the analysis of the high CVD risk profile, we used the date of diagnosis of the final clinical risk factor. We skipped any questionnaire cycle during which a participant was pregnant, as lifestyle habits among pregnant women may not be reflective of typical habits. To obtain the best estimate of the long-term Healthy Heart Score and to reduce measurement error, we used the cumulative average of the Healthy Heart Score from repeated time-point assessments.16 We categorized the Healthy Heart Score into quintiles based on the distribution of the study population.
We estimated the hazard ratio (HR) and 95% confidence interval (CI) for each clinical risk factor individually and the high CVD risk profile according to quintiles of the Healthy Heart Score using Cox proportional hazards models adjusting for adjusted for age (in months) calendar time, parental history of MI before 60 years, aspirin use, menopausal status, postmenopausal hormone use, parity, and oral contraceptive use. We did not have direct information on socioeconomic variables, such as household income. However, we further adjusted for current employment status, marital status, and spouse's attained education status to account for potential variation in SES in this population. All variables were modeled as time-varying covariates. When we analyzed each clinical risk factor individually, we included the other clinical risk factors in the model.
We conducted a test for linear trend across quintiles of the Healthy Heart Score by assigning the median value to each quintile and modeling this as a continuous variable. We examined potential deviation from linearity with a likelihood ratio test, comparing a model with the linear term with a model including the linear term plus restricted cubic spline transformations.23 For this analysis, we excluded women with a Healthy Heart Score above the 99th percentile below the 1st percentile (2.3% of total person-years) to make the estimates more stable and meaningful.
We tested for effect modification by age (<45y vs. ≥45y), smoking status (not current vs. current), and BMI (<25 vs ≥25kg/m2). For each potential modifier, we created a cross-product term between the modifier and the quintiles of the Healthy Heart Score. We used the quintile cutpoints established in the entire population to maintain consistency in the distribution of the Score between different categories of the effect modifiers. We used likelihood ratio tests to compare models with and without the cross-product terms to test formally for an interaction. All analyses were performed using SAS statistical software, version 9.3 (SAS Institute Inc, Cary, NC).
Results
Over 20 years, we documented 3,275 cases of diabetes, 17,420 of hypertension and 24,385 of hypercholesterolemia. In total, 32,505 women were diagnosed with ≥1 clinical risk factor, 2,794 women had ≥2 risk factors and 1,641 women had the high-CVD risk profile. In this population of women (mean age 36 ± 4.7 years), the mean 20-year risk of CVD at baseline, estimated by the Healthy Heart Score, was 0.83% (10th percentile 0.28%, 90th percentile 1.56%). Women with a higher predicted CVD risk were more likely to be older, have a higher BMI, be a current smoker, have a family history of MI, and use aspirin. In addition, women with a higher predicted CVD risk were less physical active, and had a lower alcohol intake and diet score (Table 1).
Table 1. Age-adjusted baseline characteristics according to quintiles of Healthy Heart Score.
| Predictive 20-year risk of CVD (%) based on the Healthy Heart Score* | |||||
|---|---|---|---|---|---|
|
| |||||
| Q1 | Q2 | Q3 | Q4 | Q5 | |
| Healthy Heart Score (20-y risk)† | 0.3 (0.1) | 0.5 (0.1) | 0.7 (0.1) | 0.9 (0.1) | 1.9 (0.8) |
|
| |||||
| No. of participants‡ | 10831 | 11386 | 11960 | 12462 | 13178 |
| Age, y | 31 (3) | 34 (3) | 37 (3) | 39 (3) | 40 (3) |
| BMI kg/m2 | 21.6 (2.5) | 22.7 (3.2) | 23.4 (3.7) | 24.4 (4.4) | 27.2 (6.1) |
| Current smoker, % | 0.5 | 2.2 | 5.3 | 10.7 | 39.3 |
| Diet score (points)¥ | 2.5 (2.3) | 2.2 (2.4) | 2.0 (2.4) | 1.8 (2.4) | 1.0 (2.5) |
| Alcohol intake, g/d | 3.5 (5.2) | 3.2 (5.2) | 3.0 (5.1) | 3.1 (5.5) | 2.9 (5.7) |
| Physical activity, MET-h/wk | 5.1 (5.2) | 3.5 (4.0) | 3.0 (3.6) | 2.5 (3.1) | 1.8 (2.6) |
| Parental history of MI before 65y, % | 13.3 | 17.0 | 20.6 | 23.4 | 27.0 |
| Post-menopausal status, % | 0.5 | 1.1 | 2.1 | 3.3 | 5.5 |
| Postmenopausal hormone use | |||||
| never users | 90.7 | 88.6 | 87.3 | 85.6 | 82.1 |
| past users | 7.3 | 8.5 | 8.5 | 8.9 | 9.4 |
| current users | 1.3 | 1.9 | 3.2 | 4.5 | 7.3 |
| Missing | 0.8 | 1.0 | 1.1 | 1.0 | 1.2 |
| Past oral contraceptive, % | 53.8 | 66.8 | 75.6 | 80.7 | 83.9 |
| Current oral contraceptive, % | 27.5 | 14.5 | 8.9 | 5.1 | 2.6 |
| Parity | 1.2 (1.2) | 1.6 (1.2) | 1.8 (1.2) | 1.8 (1.2) | 1.8 (1.2) |
| Aspirin use (yes), % | 7.0 | 8.5 | 10.5 | 12.4 | 14.5 |
MI, Myocardial Infarction
Continuous variables are presented as means (SD) and categorical values as %.
The formula to estimate the 20-year risk of CVD based on lifestyle predictors derived including smoking, BMI, physical activity, alcohol, and a
composite diet score (fruit and vegetables, sugar-sweetened beverages, red/processed meats, cereal fiber, nuts)(Figure 1).
The quintiles were determined by the distribution of the Healthy Heart Score across the total person-time of the study
A higher Healthy Heart Score was significantly associated with each clinical risk factor and this Score was associated most strongly with risk of diabetes (Table 2). In multivariable models, women in the highest compared to lowest quintile of the Healthy Heart Score had a HR of 18.1 (95%CI: 14.4-22.7) for diabetes; 5.10 (95%CI: 4.66-5.57) for hypertension; and 2.57 (95%CI: 2.40-2.75) for hypercholesterolemia (Table 2). Further adjustment for variables that may impact SES did not appreciably alter the results (data not shown). For a 2% increment in the Healthy Heart Score, the HR was 5.94 (95%CI: 5.38-6.55) for diabetes, 2.62 (95%CI: 2.50-2.73) for hypertension, and 1.72 (1.66-1.79) for hypercholesterolemia. In a sensitivity analysis, we removed age as a covariate in our multivariate models, to understand better the magnitude of the association driven by lifestyle factors only (Supplemental Table1). The magnitude of association between the Healthy Heart Score and risk of diabetes was attenuated when age was not included the multivariable model. In contrast, the association between the Healthy Heart Score and risk of hypertension and hypercholesterolemia was not appreciably altered when we did not adjust for age. When we calculated the Healthy Heart Score at baseline only, the associations were attenuated. The HR comparing 5th vs. 1st quintile: 13.80 (95%CI: 11.51-16.54) for diabetes, 4.38 (95%CI: 4.04-4.74) for hypertension and 2.40 (95%CI: 2.25-2.56) for hypercholesterolemia. The associations were not appreciably altered when we defined hypertension and hypercholesterolemia based only on self-reported physician diagnosis or when we restricted cases of incident hypertension and hypercholesterolemia to women also reporting medication use (data not shown).
Table 2. Hazard ratios (95%CI) of the clinical risk factors(diabetes, hypertension, and hypercholesterolemia) according to quintiles of the Healthy Heart Score.
| Predictive 20-year risk of CVD (%) based on the Healthy Heart Score | ||||||
|---|---|---|---|---|---|---|
|
| ||||||
| Clinical risk factors | Q1 | Q2 | Q3 | Q4 | Q5 | P-trend |
| Diabetes | ||||||
| Median Healthy Heart Score (20-y risk)* | 0.42 | 0.74 | 1.13 | 1.77 | 3.37 | |
| Cases | 141 | 277 | 391 | 714 | 1752 | |
| Person-years | 243373 | 241775 | 240486 | 238424 | 2343301 | |
| Model 1 | 1 [Ref] | 2.30 (1.84-2.87) | 4.00 (3.19- 5.02) | 8.46 (6.76-10.6) | 25.1 (20.0-31.5) | <.0001 |
| Model 2 | 1 [Ref] | 2.38 (1.90-2.97) | 4.15 (3.31-5.20) | 8.73 (6.98-10.9) | 25.2 (20.1-31.7) | <.0001 |
| Model 3 | 1 [Ref] | 2.26 (1.81-2.82) | 3.71 (2.96-4.64) | 7.26 (5.80-9.09) | 18.1 (14.4-22.7) | <.0001 |
|
| ||||||
| Hypertension | ||||||
| Median Healthy Heart Score (20-y risk)* | 0.40 | 0.70 | 1.06 | 1.62 | 3.02 | |
| Cases | 1182 | 2191 | 3187 | 4613 | 6247 | |
| Person-years | 219229 | 216967 | 214992 | 212239 | 208080 | |
| Model 1 | 1 [Ref] | 1.61 (1.48-1.75) | 2.34 (2.15-2.54) | 3.47 (3.19-3.78) | 5.54 (5.08-6.06) | <.0001 |
| Model 2 | 1 [Ref] | 1.61 (1.48-1.75) | 2.34 (2.15-2.55) | 3.47 (3.18-3.78) | 5.52 (5.05-6.04) | <.0001 |
| Model 3 | 1 [Ref] | 1.59 (1.46-1.73) | 2.28 (2.09-2.48) | 3.31 (3.03-3.60) | 5.10 (4.66-5.57) | <.0001 |
|
| ||||||
| Hypercholesterolemia | ||||||
| Median Healthy Heart Score (20-y risk)* | 0.39 | 0.68 | 1.02 | 1.56 | 2.93 | |
| Cases | 2435 | 3462 | 4664 | 6081 | 7743 | |
| Person-years | 201696 | 199607 | 197529 | 195070 | 191326 | |
| Model 1 | 1 [Ref] | 1.43 (1.35-1.52) | 1.88 (1.76-2.00) | 2.33 (2.19-2.49) | 2.98 (2.78-3.18) | <.0001 |
| Model 2 | 1 [Ref] | 1.41 (1.33-1.50) | 1.83 (1.72-1.95) | 2.24 (2.10-2.39) | 2.79 (2.61-2.98) | <.0001 |
| Model 3 | 1 [Ref] | 1.40 (1.32-1.48) | 1.80 (1.69-1.92) | 2.17 (2.03-2.31) | 2.57 (2.40-2.75) | <.0001 |
Model 1: Adjusted for age. Model 2: Model 1 + parental history of MI before 60 years of age, aspirin use, menopausal status, postmenopausal hormone use, parity, oral contraceptive use. Model 3: Model 2 + respectively adjusted by the other clinical risk factors (i.e., model 3 with diabetes as outcome is further adjusted for hypertension and hypercholesterolemia).
The formula to estimate the 20-year risk of CVD based on lifestyle predictors derived including smoking, BMI, physical activity, alcohol, and a composite diet score (fruit and vegetables, sugar-sweetened beverages, red/processed meats, cereal fiber, nuts)(Figure 1)
There was a strong, linear association between the Healthy Heart Score and the risk of the high CVD risk profile (p, linear trend <0.001, Figure 2). The HR for the high CVD risk profile was 52.5 (95%CI: 33.6-82.1) comparing women in the highest to lowest quintile of the Healthy Heart Score (Table 3).In addition, for a 2% increment in the predicted CVD risk based on Healthy Heart Score, the HR was 1.51 (95%CI: 1.46, 1.55) for developing ≥1 risk factor, 5.33 (95%CI: 4.86, 5.85) for developing ≥2 risk factors, and 6.01 (95%CI: 5.31-6.79) for developing the high CVD risk profile. The association between the Healthy Heart Score and the high CVD risk profile was greatest in magnitude among women who were <45 years, non-smokers, had a BMI <25 Kg/m2 (p, interaction<0.001) (Table 4).
Figure 2.
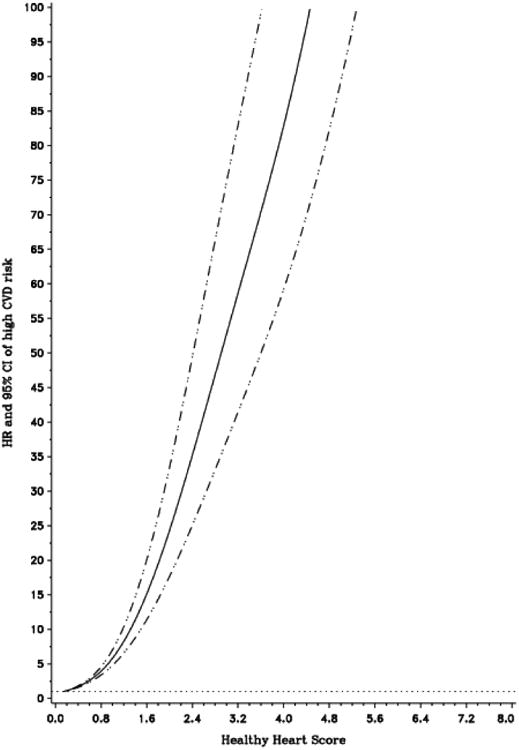
Dose-Response relationship between the Healthy Heart Score and risk of developing the high CVD risk profile. Multivariable hazard ratio (95%CI) of the high CVD risk profile as a function the Healthy Heart Score updated every 4 years. Data were fitted by a restricted cubic spline Cox proportional hazards model, adjusted for age, calendar time, parental history of MI before 60 years of age, aspirin use, menopausal status, postmenopausal hormone use, parity, and oral contraceptive use. Solid line represents point estimate and dashed lines are 95%CIs. The models were based on 1419 cases after the exclusion of women with a Healthy Heart Score <0.15 (1st percentile) and >6.09 (99th percentile)
Table 3. Hazard ratios of the combination of clinical risk factors according to quintiles of the Healthy Heart Score.
| Predictive 20-year risk of CVD (%) based on the Healthy Heart Score | ||||||
|---|---|---|---|---|---|---|
|
| ||||||
| Combination of clinical risk factors | Q1 | Q2 | Q3 | Q4 | Q5 | P-trend |
| At least 1 | ||||||
| Median Healthy Heart Score (20-y risk)a | 0.42 | 0.74 | 1.14 | 1.77 | 3.39 | |
| Cases | 3824 | 5603 | 7254 | 8279 | 7545 | |
| Person-years | 240660 | 237332 | 234399 | 231404 | 228934 | |
| Model 1 | 1 [Ref] | 1.47 (1.40-1.54) | 1.95 (1.86-2.05) | 2.36 (2.25-2.49) | 2.69 (2.54-2.85) | <.0001 |
| Model 2 | 1 [Ref] | 1.47 (1.40-1.54) | 1.95 (1.85-2.05) | 2.36 (2.24-2.48) | 2.66 (2.52-2.82) | <.0001 |
| At least 2 | ||||||
| Median Healthy Heart Score (20-y risk)* | 0.42 | 0.74 | 1.14 | 1.77 | 3.38 | |
| Cases | 79 | 174 | 319 | 616 | 1606 | |
| Person-years | 244340 | 242781 | 241414 | 239410 | 235265 | |
| Model 1 | 1 [Ref] | 2.09 (1.56-2.78) | 4.36 (3.28-5.79) | 9.30 (7.01-12.3) | 28.3 (21.3-37.6) | <.0001 |
| Model 2 | 1 [Ref] | 2.15 (1.61-2.87) | 4.46 (3.36-5.92) | 9.33 (7.04-12.4) | 27.3 (20.6-36.2) | <.0001 |
| All 3 | ||||||
| Median Healthy Heart Score (20-y risk)* | 0.42 | 0.74 | 1.14 | 1.78 | 3.40 | |
| Cases | 28 | 88 | 182 | 339 | 1004 | |
| Person-years | 245510 | 244003 | 242672 | 240678 | 236846 | |
| Model 1 | 1 [Ref] | 3.27 (2.07-5.16) | 8.02 (5.13-12.5) | 16.9 (10.8-26.4) | 58.5 (37.4-91.5) | <.0001 |
| Model 2 | 1 [Ref] | 3.28 (2.08-5.17) | 7.88 (5.05-12.3) | 16.0 (10.2-25.0) | 52.5 (33.6-82.1) | <.0001 |
Model 1: Adjusted for age. Model 2: Model 1 + parental history of MI before 60 years of age, aspirin use, menopausal status, postmenopausal hormone use, parity, oral contraceptive use.
The formula to estimate the 20-year risk of CVD based on lifestyle predictors derived including smoking, BMI, physical activity, alcohol, and a composite diet score (fruit and vegetables, sugar-sweetened beverages, red/processed meats, cereal fiber, nuts)(Figure 1)
Table 4. Hazard ratios of the high CVD risk profile* stratified by age, smoker status and BMI based on quintiles of the Healthy Heart Score.
| Predictive 20-year risk of CVD (%) based on the Healthy Heart Score | |||||||
|---|---|---|---|---|---|---|---|
|
| |||||||
| Q1 | Q2 | Q3 | Q4 | Q5 | p trend | P- interaction | |
| Age | |||||||
| < 45 years | |||||||
| Median Healthy Heart Score (20-y risk)** | 0.41 | 0.73 | 1.10 | 1.70 | 2.85 | ||
| Cases | 17 | 54 | 93 | 86 | 37 | ||
| Person-years | 230091 | 185730 | 105033 | 49018 | 16545 | ||
| Model 2 | 1 [Ref] | 4.25 (2.39-7.54) | 15.6 (8.94-27.2) | 32.9 (18.5-58.3) | 47.3 (25.0-89.5) | <.0001 | <.0001 |
| ≥45 years | |||||||
| Median Healthy Heart Score (20-y risk)** | 0.47 | 0.79 | 1.17 | 1.80 | 3.45 | ||
| Cases | 11 | 34 | 89 | 253 | 967 | ||
| Person-years | 15419 | 58273 | 137639 | 191660 | 220301 | ||
| Model 2 | 1 [Ref] | 0.93 (0.47-1.85) | 1.22 (0.65-2.31) | 2.80 (1.51-5.21) | 10.4 (5.6-19.2) | <.0001 | |
| Smoking status | |||||||
| Non smokers | |||||||
| Median Healthy Heart Score (20-y risk)** | 0.42 | 0.74 | 1.14 | 1.77 | 3.32 | ||
| Cases | 25 | 85 | 177 | 326 | 871 | ||
| Person-years | 240548 | 233547 | 225110 | 212651 | 184538 | ||
| Model 2 | 1 [Ref] | 4.35 (2.67-7.08) | 12.6 (7.71-20.5) | 30.4 (18.6-49.8) | 122.4 (74.5- 201.2) | <.0001 | 0.002 |
| Current smokers | |||||||
| Median Healthy Heart Score (20-y risk)** | 0.46 | 0.77 | 1.16 | 1.84 | 3.87 | ||
| Cases | 3 | 3 | 5 | 13 | 133 | ||
| Person-years | 4962 | 10456 | 17562 | 28027 | 52309 | ||
| Model 2 | 1 [Ref] | 0.61 (0.11- 3.42) | 0.51 (0.10-2.57) | 0.57 (0.13-2.54) | 2.32 (0.53-10.0) | <.0001 | |
| BMI | |||||||
| Median Healthy Heart Score (20-y risk)** | 0.41 | 0.74 | 1.13 | 1.75 | 3.14 | ||
| < 25 kg/m2 | |||||||
| Cases | 6 | 22 | 50 | 56 | 111 | ||
| Person-years | 201120 | 171435 | 147154 | 119590 | 80021 | ||
| Model 2 | 1 [Ref] | 4.55 (1.76-11.8) | 13.8 (5.36-35.5) | 19.0 (7.22-49.9) | 62.1 (23.4-164.5) | <.0001 | 0.003 |
| BMI≥25 kg/m2 | |||||||
| Median Healthy Heart Score (20-y risk)** | 0.76 | 0.76 | 1.15 | 1.81 | 3.59 | ||
| Cases | 22 | 66 | 132 | 283 | 893 | ||
| Person-years | 44391 | 72568 | 95519 | 121088 | 156824 | ||
| Model 2 | 1 [Ref] | 1.61 (0.96-2.69) | 2.53 (1.53-4.19) | 4.36 (2.63-7.22) | 10.1 (6.06-16.7) | <.0001 | |
High risk profile=having all 3 clinical risk factors (type 2 diabetes, hypertension, and hypercholesterolemia). Model 2: Adjusted for age, parental history of MI before 60 years of age, aspirin use, menopausal status, postmenopausal hormone use, parity, oral contraceptive use
The formula to estimate the 20-year risk of CVD based on lifestyle predictors derived including smoking, BMI, physical activity, alcohol, and a composite diet score (fruit and vegetables, sugar-sweetened beverages, red/processed meats, cereal fiber, nuts)(Figure 1)
Discussion
In this large prospective cohort of middle-age women, a higher predicted CVD risk, estimated by the Healthy Heart Score, was associated with a greater risk of developing clinical risk factors. Specifically, women with a higher predictive CVD risk had an 18-fold higher risk of type 2 diabetes, 5-fold higher risk of hypertension, and 3-fold higher risk of hypercholesterolemia over 20-years. Further, a higher predictive CVD risk was associated with a 53-fold greater risk of developing a high CVD risk profile and this association was most pronounced among women who were younger, did not smoke, and had optimal weight.
Clinical risk factors during early and mid-adulthood are associated with elevated long-term risk of CVD.2, 3, 24 Conversely, the maintenance of a low-risk profile, defined as blood glucose levels <120mg/dl, untreated blood pressure <120/80 mmHg, and untreated cholesterol <200mg/dl, is associated with substantially low risk of CVD.24-26 Adults who reach age 55 with the low-risk profile have a lifetime risk of CVD of 5-8%.24, 25 In contrast, adults who develop ≥2 risk factors have a lifetime risk of 29-50%.4,25 Further, adults with the low-risk profile live free of CVD 14 years longer than individuals with ≥2 risk factors.26 Yet, the prevalence of optimal risk factor status is low. Among US adults >50 years old, 38% have ideal levels of fasting glucose, 20% have ideal blood pressure, and 25% have ideal levels of total cholesterol.1,27 It has been posited that treating clinical risk factors is not equivalent to avoiding them because even with optimal treatment, the risk of CVD remains elevated.5, 7, 27, 28 Thus, primordial prevention strategies are needed to prevent the development of CVD risk factors and eventual CVD.
Higher predicted CVD risk based on the Healthy Heart Score was strongly associated with the risk of type 2 diabetes, in particular. The findings in the current study are consistent with prior studies that found over 90% of diabetes cases, compared with 57% of hypertension and 40% of hypercholesterolemia cases, may be attributed to poor lifestyle factors.29 Further, several components of the Healthy Heart Score such as sugar sweetened beverages30, red meats31, and BMI32 are extremely strong risk factors for diabetes. In fact, excess adiposity is the single most important lifestyle determinant of type 2 diabetes. In previous studies, 60-85% of cases of diabetes may be attributed to overweight (BMI ≥25) in women. 29, 32 Further, the magnitude of association between the Healthy Heart Score and risk of diabetes was attenuated when we did not adjust for age in our multivariable models, suggesting that the lifestyle factor components in the Score were more strongly associated with diabetes risk than age. In contrast, the association between the Score and risk of hypertension and hypercholesterolemia were similar when age was included and not included as a covariate in the multivariable model.
The Healthy Heart Score was most strongly associated with a higher CVD risk profile among women who were younger, were non-smokers, and were at a healthy weight. In other words, even among women who may be considered low-risk because they do not smoke or are at a healthy weight, other lifestyle factors that contribute to the Healthy Heart Score play an important role in the development of clinical CVD risk factors. These results highlight the need for educational strategies on CVD prevention that address many lifestyle factors simultaneously and further support the benefits of healthy lifestyle behaviors initiated in adolescence33 and young adulthood6, 34.
The Healthy Heart Score is a unique, scientifically-derived lifestyle-based prediction model with important clinical and public health relevance. First, the Healthy Heart Score may identify individuals who are likely to develop clinical risk factors and ultimately CVD due to poor lifestyle habits,29, 35 but who would not be classified at high risk by existing primary prevention risk models.36-38 Second, many existing CVD prediction tools are based on clinical risk factors4, 36-41 and address primary care prevention. Because many clinical risk factors may mediate the effect of lifestyle on CVD risk, the addition of lifestyle factors to established risk prediction models does not improve risk prediction.42 Third, physicians have limited time to assess lifestyle factors, even among patients who would be classified as low risk by the Framingham Risk Score.28 The Healthy Heart Score may be a practical tool that can initiate the communication about primordial prevention between patients and clinicians and can complement existing primary prevention models. A predictive model that includes lifestyle measures without the need for clinical measurements may be useful beyond the clinical setting, such as workplace wellness programs or community-based health fairs.
BMI is a component of the Healthy Heart Score, even though BMI is not a true lifestyle “behavior” and is determined in part by other factors in the Score. The magnitude of association between the Healthy Heart Score and clinical risk factors was greatest among women with a BMI<25 kg/m2. Notably, the Healthy Heart Score was also significantly associated with risk among women with elevated BMI. In prior studies, healthy lifestyle factors were associated with a lower risk of coronary heart disease (CHD) among both obese and non-obese individuals.43 The findings from the current study provide further support for the importance of weight control for the prevention of clinical risk factors, even among individuals who maintain other behaviors.
This population is well suited to explore the Healthy Heart Score due to its prospective design, large sample size of women free of clinical risk factors, long follow-up, and repeated dietary and lifestyle measurements. However, there are also limitations. First, the Healthy Heart Score prediction model includes key dietary and lifestyle factors associated with CVD. However, there are numerous emerging lifestyle factors of CVD that are not included, such as sleep44, sedentary behaviors45, and other dietary components.46 The Healthy Heart Score was created as a parsimonious, rather than comprehensive, model for CVD risk prediction given that time is already limited in the clinical setting. We focused on lifestyle factors that are modifiable on an individual level although an individual's ability to choose a healthy lifestyle is facilitated and influenced by the built environment, social network and public health policies that can influence the accessibility to healthy lifestyle options.47,48, 49 Second, although some measurement error in self-reported lifestyle variables is inevitable, the data are collected prospectively. Therefore, this error is likely non-differential with respect to the risk factors and would underestimate the true relative risk.29, 32 We relied on self-reported diagnosis of hypertension and hypercholesterolemia, rather than directly measured clinical factors. Among health care professionals, reporting of these risk factors is fairly reliable,20 but we cannot rule out the potential for misclassification. The generalizability of our results from a population of predominantly white, well-educated nurses to men and individuals of diverse racial/ethnic or socioeconomic compositions is limited. Finally, while we adjusted for many confounders in our analysis, residual confounding remains a potential source of bias.
Conclusion
In this large population of middle-aged women free of clinical risk factors, the predicted CVD risk estimated by the Healthy Heart Score, a lifestyle-based prediction model, was strongly associated with the development of CVD clinical risk factors. Additional research that evaluates the use of this scientifically-derived tool as a primordial prevention strategy in the clinical or community-based setting is warranted.
Supplementary Material
What is Known
The prevention of risk factor development through healthy lifestyle factors, or primordial prevention, is of paramount importance to minimize the long-term risk of CVD. However, the prevalence of these healthy behaviors among US adults remains low.
The Healthy Heart Score, a 20-year CVD risk prediction model based on modifiable lifestyle factors, effectively predicted the 20-year risk of CVD in mid-adulthood, but whether this risk score is associated with clinically-relevant CVD risk factors is unknown.
What the Study Adds
A higher predicted CVD risk, estimated by the Healthy Heart Score, was associated with a greater risk of developing clinical risk factors.
The Healthy Heart Score is a patient-oriented, scientifically derived lifestyle-based prediction model that may eventually serve as the first step for risk assessment and a catalyst for communication between patients and clinicians in the primordial prevention setting.
Acknowledgments
Sources of Funding: The NHSII is supported by research grants UM1 CA176726 from the NIH. Dr. Sotos-Prieto was supported by a research fellowship from Fundación Alfonso Martín Escudero (FAME), Spain. Dr. Chiuve is supported by HL097068. Grant HL60712
Footnotes
Author Contributions: M.S.P. formulated the study question and design, performed the statistical analyses, interpreted the results, and drafted the manuscript. S.E.C., contributed to the development of the study question, statistical modeling and drafting of the manuscript. J.M., F.B.H., A.C., E.B.R., W.C.W, and A.H.E. contributed to the conception and design of the study and acquisition of the data. All authors contributed to the interpretation of data and critical revision of the manuscript and approved the final version. M.S.P. and S.E.C. share primary responsibility for the final content.
Disclosures: None.
References
- 1.Mozaffarian D, Benjamin EJ, Go AS, Arnett DK, Blaha MJ, Cushman M, de Ferranti S, Despres JP, Fullerton HJ, Howard VJ, Huffman MD, Judd SE, Kissela BM, Lackland DT, Lichtman JH, Lisabeth LD, Liu S, Mackey RH, Matchar DB, McGuire DK, Mohler ER, 3rd, Moy CS, Muntner P, Mussolino ME, Nasir K, Neumar RW, Nichol G, Palaniappan L, Pandey DK, Reeves MJ, Rodriguez CJ, Sorlie PD, Stein J, Towfighi A, Turan TN, Virani SS, Willey JZ, Woo D, Yeh RW, Turner MB. Heart disease and stroke statistics--2015 update: A report from the american heart association. Circulation. 2015;131:e29–322. doi: 10.1161/CIR.0000000000000152. [DOI] [PubMed] [Google Scholar]
- 2.Miura K, Daviglus ML, Dyer AR, Liu K, Garside DB, Stamler J, Greenland P. Relationship of blood pressure to 25-year mortality due to coronary heart disease, cardiovascular diseases, and all causes in young adult men: The chicago heart association detection project in industry. Arch Intern Med. 2001;161:1501–1508. doi: 10.1001/archinte.161.12.1501. [DOI] [PubMed] [Google Scholar]
- 3.Stamler J, Daviglus ML, Garside DB, Dyer AR, Greenland P, Neaton JD. Relationship of baseline serum cholesterol levels in 3 large cohorts of younger men to long-term coronary, cardiovascular, and all-cause mortality and to longevity. JAMA. 2000;284:311–318. doi: 10.1001/jama.284.3.311. [DOI] [PubMed] [Google Scholar]
- 4.Greenland P, Alpert JS, Beller GA, Benjamin EJ, Budoff MJ, Fayad ZA, Foster E, Hlatky MA, Hodgson JM, Kushner FG, Lauer MS, Shaw LJ, Smith SC, Jr, Taylor AJ, Weintraub WS, Wenger NK, Jacobs AK, Anderson JL, Albert N, Buller CE, Creager MA, Ettinger SM, Guyton RA, Halperin JL, Hochman JS, Nishimura R, Ohman EM, Page RL, Stevenson WG, Tarkington LG, Yancy CW. 2010 accf/aha guideline for assessment of cardiovascular risk in asymptomatic adults: A report of the american college of cardiology foundation/american heart association task force on practice guidelines. J Am Coll Cardiol. 2010;56:e50–103. doi: 10.1016/j.jacc.2010.09.001. [DOI] [PubMed] [Google Scholar]
- 5.Howard G, Banach M, Cushman M, Goff DC, Howard VJ, Lackland DT, McVay J, Meschia JF, Muntner P, Oparil S, Rightmyer M, Taylor HA. Is blood pressure control for stroke prevention the correct goal? The lost opportunity of preventing hypertension. Stroke. 2015;46:1595–600. doi: 10.1161/STROKEAHA.115.009128. [DOI] [PMC free article] [PubMed] [Google Scholar]
- 6.Liu K, Daviglus ML, Loria CM, Colangelo LA, Spring B, Moller AC, Lloyd-Jones DM. Healthy lifestyle through young adulthood and the presence of low cardiovascular disease risk profile in middle age: The coronary artery risk development in (young) adults (cardia) study. Circulation. 2012;125:996–1004. doi: 10.1161/CIRCULATIONAHA.111.060681. [DOI] [PMC free article] [PubMed] [Google Scholar]
- 7.Lloyd-Jones DM, Hong Y, Labarthe D, Mozaffarian D, Appel LJ, Van Horn L, Greenlund K, Daniels S, Nichol G, Tomaselli GF, Arnett DK, Fonarow GC, Ho PM, Lauer MS, Masoudi FA, Robertson RM, Roger V, Schwamm LH, Sorlie P, Yancy CW, Rosamond WD. Defining and setting national goals for cardiovascular health promotion and disease reduction: The american heart association's strategic impact goal through 2020 and beyond. Circulation. 2010;121:586–613. doi: 10.1161/CIRCULATIONAHA.109.192703. [DOI] [PubMed] [Google Scholar]
- 8.Shay CM, Ning H, Allen NB, Carnethon MR, Chiuve SE, Greenlund KJ, Daviglus ML, Lloyd-Jones DM. Status of cardiovascular health in us adults: Prevalence estimates from the national health and nutrition examination surveys (nhanes) 2003-2008. Circulation. 2012;125:45–56. doi: 10.1161/CIRCULATIONAHA.111.035733. [DOI] [PMC free article] [PubMed] [Google Scholar]
- 9.Chiuve SE, Cook NR, Shay CM, Rexrode KM, Albert CM, Manson JE, Willett WC, Rimm EB. Lifestyle-based prediction model for the prevention of cvd: The healthy heart score. J Am Heart Assoc. 2014;3:e000954. doi: 10.1161/JAHA.114.000954. [DOI] [PMC free article] [PubMed] [Google Scholar]
- 10.Willett WC, Sampson L, Stampfer MJ, Rosner B, Bain C, Witschi J, Hennekens CH, Speizer FE. Reproducibility and validity of a semiquantitative food frequency questionnaire. Am J Epidemiol. 1985;122:51–65. doi: 10.1093/oxfordjournals.aje.a114086. [DOI] [PubMed] [Google Scholar]
- 11.Colditz GA, Rimm EB, Giovannucci E, Stampfer MJ, Rosner B, Willett WC. A prospective study of parental history of myocardial infarction and coronary artery disease in men. Am J Cardiol. 1991;67:933–938. doi: 10.1016/0002-9149(91)90163-f. [DOI] [PubMed] [Google Scholar]
- 12.Willett WC, Green A, Stampfer MJ, Speizer FE, Colditz GA, Rosner B, Monson RR, Stason W, Hennekens CH. Relative and absolute excess risks of coronary heart disease among women who smoke cigarettes. N Engl J Med. 1987;317:1303–1309. doi: 10.1056/NEJM198711193172102. [DOI] [PubMed] [Google Scholar]
- 13.Rimm EB, Stampfer MJ, Colditz GA, Chute CG, Litin LB, Willett WC. Validity of self-reported waist and hip circumferences in men and women. Epidemiology. 1990;1:466–473. doi: 10.1097/00001648-199011000-00009. [DOI] [PubMed] [Google Scholar]
- 14.Wolf AM, Hunter DJ, Colditz GA, Manson JE, Stampfer MJ, Corsano KA, Rosner B, Kriska A, Willett WC. Reproducibility and validity of a self-administered physical activity questionnaire. Int J Epidemiol. 1994;23:991–999. doi: 10.1093/ije/23.5.991. [DOI] [PubMed] [Google Scholar]
- 15.Ainsworth BE, Haskell WL, Leon AS, Jacobs DR, Jr, Montoye HJ, Sallis JF, Paffenbarger RS., Jr Compendium of physical activities: Classification of energy costs of human physical activities. Med Sci Sports Exerc. 1993;25:71–80. doi: 10.1249/00005768-199301000-00011. [DOI] [PubMed] [Google Scholar]
- 16.Hu FB, Stampfer MJ, Rimm E, Ascherio A, Rosner BA, Spiegelman D, Willett WC. Dietary fat and coronary heart disease: A comparison of approaches for adjusting for total energy intake and modeling repeated dietary measurements. Am J Epidemiol. 1999;149:531–540. doi: 10.1093/oxfordjournals.aje.a009849. [DOI] [PubMed] [Google Scholar]
- 17.Classification and diagnosis of diabetes mellitus and other categories of glucose intolerance. National diabetes data group. Diabetes. 1979;28:1039–1057. doi: 10.2337/diab.28.12.1039. [DOI] [PubMed] [Google Scholar]
- 18.Report of the expert committee on the diagnosis and classification of diabetes mellitus. Diabetes Care. 1997;20:1183–1197. doi: 10.2337/diacare.20.7.1183. [DOI] [PubMed] [Google Scholar]
- 19.Manson JE, Rimm EB, Stampfer MJ, Colditz GA, Willett WC, Krolewski AS, Rosner B, Hennekens CH, Speizer FE. Physical activity and incidence of non-insulin-dependent diabetes mellitus in women. Lancet. 1991;338:774–778. doi: 10.1016/0140-6736(91)90664-b. [DOI] [PubMed] [Google Scholar]
- 20.Colditz GA, Martin P, Stampfer MJ, Willett WC, Sampson L, Rosner B, Hennekens CH, Speizer FE. Validation of questionnaire information on risk factors and disease outcomes in a prospective cohort study of women. Am J Epidemiol. 1986;123:894–900. doi: 10.1093/oxfordjournals.aje.a114319. [DOI] [PubMed] [Google Scholar]
- 21.Forman JP, Curhan GC, Taylor EN. Plasma 25-hydroxyvitamin d levels and risk of incident hypertension among young women. Hypertension. 2008;52:828–832. doi: 10.1161/HYPERTENSIONAHA.108.117630. [DOI] [PMC free article] [PubMed] [Google Scholar]
- 22.Flint AJ, Hu FB, Glynn RJ, Jensen MK, Franz M, Sampson L, Rimm EB. Whole grains and incident hypertension in men. Am J Clin Nutr. 2009;90:493–498. doi: 10.3945/ajcn.2009.27460. [DOI] [PMC free article] [PubMed] [Google Scholar]
- 23.Durrleman S, Simon R. Flexible regression models with cubic splines. Stat Med. 1989;8:551–561. doi: 10.1002/sim.4780080504. [DOI] [PubMed] [Google Scholar]
- 24.Berry JD, Dyer A, Cai X, Garside DB, Ning H, Thomas A, Greenland P, Van Horn L, Tracy RP, Lloyd-Jones DM. Lifetime risks of cardiovascular disease. N Engl J Med. 2012;366:321–329. doi: 10.1056/NEJMoa1012848. [DOI] [PMC free article] [PubMed] [Google Scholar]
- 25.Lloyd-Jones DM, Leip EP, Larson MG, D'Agostino RB, Beiser A, Wilson PW, Wolf PA, Levy D. Prediction of lifetime risk for cardiovascular disease by risk factor burden at 50 years of age. Circulation. 2006;113:791–798. doi: 10.1161/CIRCULATIONAHA.105.548206. [DOI] [PubMed] [Google Scholar]
- 26.Wilkins JT, Ning H, Berry J, Zhao L, Dyer AR, Lloyd-Jones DM. Lifetime risk and years lived free of total cardiovascular disease. JAMA. 2012;308:1795–1801. doi: 10.1001/jama.2012.14312. [DOI] [PMC free article] [PubMed] [Google Scholar]
- 27.Ford ES, Ajani UA, Croft JB, Critchley JA, Labarthe DR, Kottke TE, Giles WH, Capewell S. Explaining the decrease in u.S. Deaths from coronary disease, 1980-2000. N Engl J Med. 2007;356:2388–2398. doi: 10.1056/NEJMsa053935. [DOI] [PubMed] [Google Scholar]
- 28.Mosca L, Linfante AH, Benjamin EJ, Berra K, Hayes SN, Walsh BW, Fabunmi RP, Kwan J, Mills T, Simpson SL. National study of physician awareness and adherence to cardiovascular disease prevention guidelines. Circulation. 2005;111:499–510. doi: 10.1161/01.CIR.0000154568.43333.82. [DOI] [PubMed] [Google Scholar]
- 29.Chomistek AK, Chiuve SE, Eliassen AH, Mukamal KJ, Willett WC, Rimm EB. Healthy lifestyle in the primordial prevention of cardiovascular disease among young women. J Am Coll Cardiol. 2015;65:43–51. doi: 10.1016/j.jacc.2014.10.024. [DOI] [PMC free article] [PubMed] [Google Scholar]
- 30.Ardisson Korat AV, Willett WC, Hu FB. Diet, lifestyle, and genetic risk factors for type 2 diabetes: A review from the nurses' health study, nurses' health study 2, and health professionals' follow-up study. Curr Nutr Rep. 2014;3:345–354. doi: 10.1007/s13668-014-0103-5. [DOI] [PMC free article] [PubMed] [Google Scholar]
- 31.Pan A, Sun Q, Bernstein AM, Manson JE, Willett WC, Hu FB. Changes in red meat consumption and subsequent risk of type 2 diabetes mellitus: Three cohorts of us men and women. JAMA Intern Med. 2013;173:1328–1335. doi: 10.1001/jamainternmed.2013.6633. [DOI] [PMC free article] [PubMed] [Google Scholar]
- 32.Hu FB, Manson JE, Stampfer MJ, Colditz G, Liu S, Solomon CG, Willett WC. Diet, lifestyle, and the risk of type 2 diabetes mellitus in women. N Engl J Med. 2001;345:790–797. doi: 10.1056/NEJMoa010492. [DOI] [PubMed] [Google Scholar]
- 33.Pahkala K, Hietalampi H, Laitinen TT, Viikari JS, Ronnemaa T, Niinikoski H, Lagstrom H, Talvia S, Jula A, Heinonen OJ, Juonala M, Simell O, Raitakari OT. Ideal cardiovascular health in adolescence: Effect of lifestyle intervention and association with vascular intima-media thickness and elasticity (the special turku coronary risk factor intervention project for children [strip] study) Circulation. 2013;127:2088–2096. doi: 10.1161/CIRCULATIONAHA.112.000761. [DOI] [PubMed] [Google Scholar]
- 34.Spring B, Moller AC, Colangelo LA, Siddique J, Roehrig M, Daviglus ML, Polak JF, Reis JP, Sidney S, Liu K. Healthy lifestyle change and subclinical atherosclerosis in young adults: Coronary artery risk development in young adults (cardia) study. Circulation. 2014;130:10–17. doi: 10.1161/CIRCULATIONAHA.113.005445. [DOI] [PMC free article] [PubMed] [Google Scholar]
- 35.Yusuf S, Hawken S, Ounpuu S, Dans T, Avezum A, Lanas F, McQueen M, Budaj A, Pais P, Varigos J, Lisheng L. Effect of potentially modifiable risk factors associated with myocardial infarction in 52 countries (the interheart study): Case-control study. Lancet. 2004;364:937–952. doi: 10.1016/S0140-6736(04)17018-9. [DOI] [PubMed] [Google Scholar]
- 36.Goff DC, Jr, Lloyd-Jones DM, Bennett G, Coady S, D'Agostino RB, Sr, Gibbons R, Greenland P, Lackland DT, Levy D, O'Donnell CJ, Robinson JG, Schwartz JS, Shero ST, Smith SC, Jr, Sorlie P, Stone NJ, Wilson PW. 2013 acc/aha guideline on the assessment of cardiovascular risk: A report of the american college of cardiology/american heart association task force on practice guidelines. J Am Coll Cardiol. 2014;63:2935–2959. doi: 10.1016/j.jacc.2013.11.005. [DOI] [PMC free article] [PubMed] [Google Scholar]
- 37.D'Agostino RB, Sr, Vasan RS, Pencina MJ, Wolf PA, Cobain M, Massaro JM, Kannel WB. General cardiovascular risk profile for use in primary care: The framingham heart study. Circulation. 2008;117:743–753. doi: 10.1161/CIRCULATIONAHA.107.699579. [DOI] [PubMed] [Google Scholar]
- 38.Ridker PM, Buring JE, Rifai N, Cook NR. Development and validation of improved algorithms for the assessment of global cardiovascular risk in women: The reynolds risk score. JAMA. 2007;297:611–619. doi: 10.1001/jama.297.6.611. [DOI] [PubMed] [Google Scholar]
- 39.Hippisley-Cox J, Coupland C, Vinogradova Y, Robson J, May M, Brindle P. Derivation and validation of qrisk, a new cardiovascular disease risk score for the united kingdom: Prospective open cohort study. BMJ. 2007;335:136. doi: 10.1136/bmj.39261.471806.55. [DOI] [PMC free article] [PubMed] [Google Scholar]
- 40.Conroy RM, Pyorala K, Fitzgerald AP, Sans S, Menotti A, De Backer G, De Bacquer D, Ducimetiere P, Jousilahti P, Keil U, Njolstad I, Oganov RG, Thomsen T, Tunstall-Pedoe H, Tverdal A, Wedel H, Whincup P, Wilhelmsen L, Graham IM. Estimation of ten-year risk of fatal cardiovascular disease in europe: The score project. Eur Heart J. 2003;24:987–1003. doi: 10.1016/s0195-668x(03)00114-3. [DOI] [PubMed] [Google Scholar]
- 41.Kulshreshtha A, Vaccarino V, Judd SE, Howard VJ, McClellan WM, Muntner P, Hong Y, Safford MM, Goyal A, Cushman M. Life's simple 7 and risk of incident stroke: The reasons for geographic and racial differences in stroke study. Stroke. 2013;44:1909–1914. doi: 10.1161/STROKEAHA.111.000352. [DOI] [PMC free article] [PubMed] [Google Scholar]
- 42.Paynter NP, LaMonte MJ, Manson JE, Martin LW, Phillips LS, Ridker PM, Robinson JG, Cook NR. Comparison of lifestyle-based and traditional cardiovascular disease prediction in a multiethnic cohort of nonsmoking women. Circulation. 2014;130:1466–1473. doi: 10.1161/CIRCULATIONAHA.114.012069. [DOI] [PMC free article] [PubMed] [Google Scholar]
- 43.Jensen MK, Chiuve SE, Rimm EB, Dethlefsen C, Tjonneland A, Joensen AM, Overvad K. Obesity, behavioral lifestyle factors, and risk of acute coronary events. Circulation. 2008;117:3062–3069. doi: 10.1161/CIRCULATIONAHA.107.759951. [DOI] [PubMed] [Google Scholar]
- 44.Cappuccio FP, Cooper D, D'Elia L, Strazzullo P, Miller MA. Sleep duration predicts cardiovascular outcomes: A systematic review and meta-analysis of prospective studies. European Heart Journal. 2011;32:1484–1492. doi: 10.1093/eurheartj/ehr007. [DOI] [PubMed] [Google Scholar]
- 45.Chomistek AK, Manson JE, Stefanick ML, Lu B, Sands-Lincoln M, Going SB, Garcia L, Allison MA, Sims ST, LaMonte MJ, Johnson KC, Eaton CB. Relationship of sedentary behavior and physical activity to incident cardiovascular disease. Journal of the American College of Cardiology. 2013;61:2346–2354. doi: 10.1016/j.jacc.2013.03.031. [DOI] [PMC free article] [PubMed] [Google Scholar]
- 46.Chiuve SE, Fung TT, Rimm EB, Hu FB, McCullough ML, Wang M, Stampfer MJ, Willett WC. Alternative dietary indices both strongly predict risk of chronic disease. Journal of Nutrition. 2012;142:1009–1018. doi: 10.3945/jn.111.157222. [DOI] [PMC free article] [PubMed] [Google Scholar]
- 47.Rosengren A, Wilhelmsen L, Orth-Gomer K. Coronary disease in relation to social support and social class in swedish men. A 15 year follow-up in the study of men born in 1933. Eur Heart J. 2004;25:56–63. doi: 10.1016/j.ehj.2003.10.005. [DOI] [PubMed] [Google Scholar]
- 48.Roger VL. Lifestyle and cardiovascular health: Individual and societal choices. JAMA. 2009;302:437–439. doi: 10.1001/jama.2009.1075. [DOI] [PubMed] [Google Scholar]
- 49.Nitzke S, Freeland-Graves J. Position of the american dietetic association: Total diet approach to communicating food and nutrition information. J Am Diet Assoc. 2007;107:1224–1232. doi: 10.1016/j.jada.2007.05.025. [DOI] [PubMed] [Google Scholar]
Associated Data
This section collects any data citations, data availability statements, or supplementary materials included in this article.