

Abstract
Immunological memory is a defining feature of vertebrate physiology, allowing rapid responses to repeat infections. However, the molecular mechanisms required for its establishment and maintenance remain poorly understood. Here, we demonstrated that the first steps in the acquisition of T‐cell memory occurred during the initial activation phase of naïve T cells by an antigenic stimulus. This event initiated extensive chromatin remodeling that reprogrammed immune response genes toward a stably maintained primed state, prior to terminal differentiation. Activation induced the transcription factors NFAT and AP‐1 which created thousands of new DNase I‐hypersensitive sites (DHSs), enabling ETS‐1 and RUNX1 recruitment to previously inaccessible sites. Significantly, these DHSs remained stable long after activation ceased, were preserved following replication, and were maintained in memory‐phenotype cells. We show that primed DHSs maintain regions of active chromatin in the vicinity of inducible genes and enhancers that regulate immune responses. We suggest that this priming mechanism may contribute to immunological memory in T cells by facilitating the induction of nearby inducible regulatory elements in previously activated T cells.
Keywords: chromatin, epigenetics, gene regulation, immunity, memory T cell
Subject Categories: Chromatin, Epigenetics, Genomics & Functional Genomics; Immunology
Introduction
Immunological memory plays a crucial role in maintaining the mammalian immune response, enabling a rapid reaction to foreign pathogens when they are re‐encountered. Memory T cells (TM) arise as a consequence of previous immune reactions and are primed to efficiently upregulate key response genes when re‐challenged, while antigen‐inexperienced naive T cells (TN) take much longer to respond to the same stimuli (Rogers et al, 2000; Sprent & Surh, 2002). The initial activation of TN by antigen‐presenting cells (APC) involves an interaction of the T‐cell receptor (TCR) with a specific antigen bound to the major histocompatibility complex on the APC. This occurs in parallel with additional interactions with co‐stimulatory molecules, such as CD28 (Brownlie & Zamoyska, 2013). These responses trigger protein kinase and calcineurin signaling pathways which activate inducible transcription factors (TFs) such as AP‐1, NFAT, and NF‐κB. These TFs, together with preexisting developmentally regulated TFs such as RUNX1 and ETS‐1, are required for the expression of inducible cytokines and cytolytic molecules which function within a complex network of immune cells to eliminate infections. The work of numerous laboratories has led to a detailed understanding of the Ca2+‐dependent activation of NFAT and the kinase‐dependent activation of AP‐1 and NF‐κB, and the roles they play in creating inducible DNase I‐hypersensitive sites (DHSs) and in the regulation of TCR‐inducible genes such as IL2, IL3, and CSF2 (Hogan et al, 2003; Johnson et al, 2004). ETS‐1 and RUNX1 also play wider important roles throughout T‐cell development and activation (Muthusamy et al, 1995; Telfer & Rothenberg, 2001; Egawa et al, 2007; Hollenhorst et al, 2009).
When stimulated for the first time, TN undergo a protracted process of internal reorganization taking 1–2 days, during which they transform from a quiescent spore‐like state to actively proliferating T blast cells (TB) (Zhao et al, 1998). During this period, the nucleus undergoes extensive Brg1‐dependent chromatin remodeling and increases 5‐ to 10‐fold in volume. Once formed, TB are capable of undergoing many rounds of proliferation in the absence of further TCR stimulation, using IL‐2 as a growth factor. In the absence of TCR signaling, these recently activated TB cells no longer express the inducible cytokines and cytolytic molecules normally associated with fully activated T cells. However, upon re‐stimulation, TB respond like TM and rapidly react to TCR signaling (Mirabella et al, 2010). For example, we previously showed that in TB cells, a NFAT‐dependent DHS at the inducible CSF2 enhancer can be formed within just 20 min of stimulation (Johnson et al, 2004). In vivo, the blast transformation phase is typically followed by further differentiation to effector cells such as Th1 and Th2 cells, according to the type of infection. Following clonal expansion and pathogen clearance, the effector T‐cell population contracts, leaving a small proportion of surviving cells. These cells return to the quiescent state as TM, while retaining some of the properties of TB.
Several studies have compared steady‐state levels of chromatin modifications and gene expression and identified differences between TN and TM in the balance between Trithorax and Polycomb‐regulated chromatin domains of histone methylation (Yamashita et al, 2004; Araki et al, 2009; Nakayama & Yamashita, 2009; Russ et al, 2014; Seumois et al, 2014; Crompton et al, 2015), in domains of histone acetylation (Araki et al, 2008), and in DNA methylation (Hashimoto et al, 2013; Komori et al, 2015). However, while these domains can correlate with differences in steady‐state mRNA levels in resting TN and TM, their relevance to inducible gene expression remains largely unexplored. Furthermore, no mechanisms have yet been described to account for how these domains are created and maintained.
The molecular mechanisms responsible for the disparity between TN and TM remain unclear, as there are no obvious candidates for TM‐specific TFs. There is, however, ample evidence that epigenetic mechanisms play a role in maintaining T‐cell differentiation and memory (Rothenberg & Zhang, 2012). It has long been known that terminal T‐cell differentiation to Th1 or Th2 T cells is accompanied by the gain of DHSs at specific cytokine gene loci (Agarwal & Rao, 1998), in parallel with the induction of Th1‐ and Th2‐specific factors such as TBX21 and GATA‐3. However, many of the DHSs acquired during the process of activation and differentiation are shared across different classes of differentiated T cells, and the significance of many of these sites remains unclear. For example, the Th2‐specific Il4 gene is associated with several DHSs in the Il4/Rad50 locus that are present in both Th1 and Th2 cells, but absent in naïve T cells (Agarwal & Rao, 1998; Fields et al, 2004). The Il10 gene is similarly regulated by both Th2‐specific DHSs, and DHSs which are also present in undifferentiated T blast cells or in Th1 cells (Jones & Flavell, 2005). Regulatory T cells (Treg) represent another class of differentiated T cells which acquire a specific set of DHSs that are absent in TN. Differentiation to Treg is driven by the TF FOXP3, but also in this case, many of the Treg‐specific DHSs are acquired prior to terminal differentiation to Treg (Samstein et al, 2012). Taken together, these studies suggest that T‐cell activation may create a permissive state at many loci that renders them receptive to any of the various subsequent differentiation‐inducing signals they may encounter which are mediated by lineage‐specific factors that include FOXP3, TBX21, and GATA‐3.
In our previous studies of the human IL3/CSF2 locus, we investigated the properties of regulatory elements that control the activation of these two highly inducible cytokine genes in T cells. Similar to the above studies, we identified two distinct classes of DHS that were acquired at different stages of T‐cell differentiation and activation (Mirabella et al, 2010; Baxter et al, 2012). One class existed as stably maintained DHSs that were absent in the thymus and in naïve T cells, and were formed during the process of T blast cell transformation, when T cells become activated via TCR signaling for the first time. Once formed, these primed DHS (pDHSs) were preserved for many cell cycles in the absence of continued TCR signaling. Furthermore, the pDHSs in this locus were detected in circulating human memory T cells, suggesting that they are also temporally stable for what might be months or years (Mirabella et al, 2010). However, the function of these pDHSs remained unclear as they had no detectable enhancer activity when measured by transient transfection assays using reporter genes (Hawwari et al, 2002; Baxter et al, 2012). In addition to these pDHSs, we also identified several inducible DHSs (iDHSs) that appeared transiently in direct response to activation of TCR signaling (Cockerill, 2004; Baxter et al, 2012). Similar to iDHSs detected in other inducible genes in T cells, such as Il4 (Fields et al, 2004) and Il10 (Jones & Flavell, 2005), the iDHSs in the IL3/CSF2 locus were associated with strong inducible enhancer function in both transient transfection assays and transgenic mice (Cockerill et al, 1999; Baxter et al, 2012).
In the current study, our aim was to globally identify and characterize the regulatory elements and factors that maintain alternate chromatin states and underpin the recall response characteristic of both TM and TB. Our aim was to identify common mechanisms that might be shared across all classes of T cells to establish a permissive state that facilitates secondary responses in previously activated T cells. We performed genomewide sequencing of DHSs (DNase‐Seq) and chromatin immunoprecipitation assays (ChIP‐Seq) of TFs and histone modifications in TN, TM, and TB before and after stimulation. We identified over 2,000 pDHSs which were absent in TN but present in both TM and TB and were shared by CD4+ T helper cells and CD8+ cytotoxic T cells. In actively dividing TB cells, many of these pDHSs were stably bound by ETS‐1 and RUNX1, which we propose function to maintain chromatin priming. Upon re‐stimulation, they were also bound by AP‐1 which we propose is required to both establish priming and promote subsequent inducible responses. Significantly, the pDHSs were embedded within islands of active chromatin marked by H3K4me2 and H3K27ac which often encompassed inducible enhancers that could be activated in TB, but not in TN. In contrast to some genes which are silenced in naïve T cells by the Polycomb‐regulated H3K27me3 modification, the pDHSs we identified were not marked by H3K27me3 in naïve T cells.
We therefore propose a model whereby many inducible immune response genes exist within inaccessible chromatin in TN cells until they become primed toward an active chromatin state that is permissive for rapid enhancer induction by NFAT and AP‐1, and accessible to additional differentiation‐inducing TFs. Our model provides a simple chromatin‐based mechanism for maintaining the priming of TM‐specific regulatory elements using preexisting TFs which might allow T cells to retain immunological memory without the need for additional specific factors to silence genes in TN.
Results
To define the regulatory network establishing immunological memory, we performed an integrated set of genome‐wide analyses to identify the DNA elements, TFs, co‐activators, and histone modifications that correlate with a stable reprogrammed state in TM and TB. Because we wanted to investigate global mechanisms of T‐cell regulation, we chose to examine naturally arising memory‐phenotype cells (TM) instead of TCR‐specific T cells that may be restricted to a single T‐cell lineage and differentiation state. We first purified different populations of CD4+ T helper cells and CD8+ cytotoxic T cells from mice and then analyzed their responses to stimulation of TCR signaling pathways. For this purpose, we used the C42 transgenic mouse model which contains the intact human IL3/CSF2 locus encoding IL‐3 and GM‐CSF (Fig 1A) (Mirabella et al, 2010; Baxter et al, 2012). IL3 and CSF2 are prototypical cytokine genes that are efficiently induced in TM or TB, but not in TN or thymocytes (Mirabella et al, 2010). This locus has been intensively studied as a model for defining inducible mechanisms of enhancer activation in TB (Johnson et al, 2004; Bert et al, 2007; Baxter et al, 2012). Furthermore, this locus contains DHSs which are already known to exist in TB and TM, but not in thymocytes or TN (Mirabella et al, 2010; Baxter et al, 2012), providing obvious candidates for a study of DNA elements that maintain memory and at the same time allowed us to examine whether the actual mechanisms of memory maintenance were conserved between human and mouse.
Figure 1. Previously activated T cells stably maintain an extensive array of DHSs at the IL3/CSF2 locus.

-
AThe 130‐kb human IL3/CSF2 BAC transgene. The insulator (Ins) and enhancer elements (E) are shown as boxes.
-
BSteps in the route to T blast cell transformation and re‐activation. Purified CD4+ or CD8+ T cells were activated with 2 μg/ml ConA for 40 h and then maintained in IL‐2 as TB. Cells were re‐stimulated with 20 ng/ml PMA and 2 μM calcium ionophore (PMA/I).
-
CInducible mRNA expression levels in CD4 TN and TB stimulated with PMA/I for the indicated times. mRNA levels were expressed relative to the levels of beta‐2 microglobulin (B2m) with SEM. The number of replicates (n) for each is shown underneath.
-
DUCSC genome browser shot of the human IL3/CSF2 locus showing DNase‐Seq and ChIP‐Seq in CD4 TN and TB with (red) and without stimulation (black) with PMA/I for 2 h, plus the ENCODE Jurkat T‐cell DNase‐Seq data (Thurman et al, 2012). Black arrows represent stable DHSs and red arrows are inducible DHSs, with the distances in kilobases of the DHS from either the IL3 or CSF2 promoters.
-
EHuman CSF2 mRNA expression in CD4 TN and CD4 TM stimulated for 2 h with PMA/I, expressed as in (C).
-
FSouthern blot DNA hybridization analyses of DHSs in human TN and TM and C42 TB.
-
G, HLuciferase reporter gene assays in stimulated Jurkat T cells transfected with the pXPG plasmid containing the CSF2 (G) or IL3 (H) promoter alone or in combination with the indicated pDHS and enhancer DNA regions as defined in (D). The IL3 −4.1/1.5 construct contains a contiguous region spanning the IL3 promoter from −4.3 kb to +50 bp. The number of replicates (n) is shown below, and the error bars indicate SEM (G) or SD (H).
We prepared subsets of resting T lymphocytes from C42 mouse spleens and further purified TN and TM. Actively proliferating TB were prepared by stimulation of CD4 and CD8 T cells for 2 days with the lectin concanavalin A (ConA) to activate surface receptors, followed by a period of rapid proliferation for 2–3 days in the presence of IL‐2 (Fig 1B). We confirmed that the process of ConA stimulation was sufficient to rapidly induce the AP‐1 family gene Fos. However, the human CSF2 transgene and the mouse chemokine (C‐C motif) ligand1 gene (Ccl1) were induced much more slowly over a period of 16 h (Appendix Fig S1A). We also used flow cytometry (FACS) to demonstrate that the bulk of each population of CD4 T cells had the expected properties: (i) TN were predominantly CD62L+ cells lacking the activation markers CD44 and CD25, (ii) TM were predominantly memory‐phenotype cells expressing CD44 but lacking CD62L and CD25, thereby resembling effector memory T cells, and (iii) TB predominantly expressed the activation markers CD25 and CD44, consistent with activated effector T cells (Appendix Fig S1B).
Each population of T cells was then stimulated for 2 h with PMA and the calcium ionophore A23187 (PMA/I) to activate TCR signaling pathways that induce AP‐1 and NFAT activity. By directly activating pathways downstream of the TCR, we ensured that we investigated mechanisms directly associated with epigenetic and transcriptional responses and not just differences in the expression or function of molecules mediating signaling from the cell surface. Analyses of mRNA expression for human IL3 and CSF2, as well as mouse Il4 and Il10, confirmed that each gene was rapidly and strongly induced by PMA/I in CD4 TB but not in TN cells (Fig 1C). These experiments verified that inducible cytokine gene loci in TN and TB stimulated by PMA/I provide a meaningful model for studying the memory recall response. Both cell types expressed the mRNA for NFAT and AP‐1 family proteins at comparable levels prior to stimulation. Following induction with PMA/I over a 2‐h time course, both TB and TN induced the mRNA to a similar level albeit with slightly different kinetics (Fig EV1A). This demonstrated that it was not just a difference in TF mRNA expression that distinguishes the responses of TB and TM cells from TN, but a differential usage or processing of such factors.
Figure EV1. Comparisons of mouse TN and TB TF mRNA and chromatin profiles.

- PCR analyses of mRNA expression of NFAT and AP‐1 family transcription factors in CD4 TN and TB stimulated with PMA/I for the times indicated. Expression levels are normalized to the levels of B2m. Values represent the mean and SEM of 3 to 10 replicates, with a median of 5 replicates for each value shown.
- UCSC genome browser shot of a 900‐kb region of mouse chr11 showing DNase I‐Seq for CD4 and CD8 TN, TB, and TM plus published datasets for H3K27me3 in CD4 and CD8 TN and Th2 cells. TN(2) and TB(2) represent biological replicates.
The human IL‐3/GM‐CSF gene loci display specific DHSs in TM and TB
To map all potentially active cis‐regulatory elements in T cells from C42 mice, we performed global DNase‐Seq which identifies accessible regions of chromatin bound by transcription factors (Cockerill, 2011). Specific analyses of the region covered by the human IL3/CSF2 transgene detected all of the DHSs previously defined by conventional assays (Baxter et al, 2012), plus a previously unknown cluster of DHSs downstream of CSF2 (Fig 1D). Many of these DHSs had properties consistent with the class of regulatory element defined above as pDHSs. The IL3 −1.5‐kb, −4.1‐kb, −34‐kb, and −41‐kb pDHSs, and the CSF2 +30‐kb DHS were all present in TB and not in TN. CSF2 mRNA was also highly inducible in both TB and TM but not in TN (Fig 1C and E). Furthermore, both the CSF2 +30‐kb and IL3 −34‐kb pDHSs were present in circulating human peripheral blood CD4+ CD45RA− memory‐phenotype T cells, at a level indistinguishable from C42 mouse TB, and were weak or absent in human CD4+ CD45RA+ naive T cells (Fig 1F). These findings suggest that pDHSs are (i) maintained in actively proliferating TB in the absence of TCR signaling, and (ii) contribute to the long‐term maintenance of memory in non‐dividing circulating TM. These analyses also confirmed that preparation of TB by stimulation with ConA gave an identical pattern of DHSs in the human IL3/CSF2 locus to that seen previously for TB prepared by specific stimulation of the TCR complex and CD28 (Baxter et al, 2012), thereby validating the choice of our in vitro model.
To further define the features of the stably maintained pDHSs, we performed ChIP‐Seq assays for histone H3K4me2 and H3K27ac in CD4TB. These active chromatin modifications are routinely used to map active enhancer elements (Rivera & Ren, 2013). Within the transgene, pDHSs resided within broad domains marked by both H3K4me2 and H3K27ac specifically in TB (Fig 1D). In stimulated CD4 TB (TB +), we detected additional inducible DHSs (iDHSs) which included the well‐defined −37‐kb and −4.5‐kb IL3 enhancers and the IL3 promoter, and novel iDHSs 25 and 28 kb downstream of CSF2. Significantly, these iDHSs existed in close proximity to pDHSs and zones of active chromatin modifications. Each of these iDHSs, plus the iDHS at the −3‐kb CSF2 enhancer, was highly inducible in TB but not in TN, consistent with a mechanism whereby the stable pDHSs function to maintain chromatin spanning inducible enhancers in a primed state that allows their rapid response to TCR signaling.
We have previously shown that the −4.1‐kb, −34‐kb, and −41‐kb pDHSs in the IL3 locus lack enhancer activity, whereas the −37‐kb iDHS is a powerful inducible enhancer (Hawwari et al, 2002; Baxter et al, 2012). We therefore hypothesized that the human IL3 −34‐kb and −41‐kb DHSs were representative of a distinct class of regulatory element that maintain stable zones of active chromatin, but lack classical enhancer activity (Baxter et al, 2012). Consistent with this idea, the CSF2 +22‐kb and +30‐kb pDHSs also lacked independent enhancer activity when linked to the CSF2 promoter and tested in reporter gene assays in stimulated Jurkat T cells (Fig 1G), while in the same assay the +28‐kb iDHS functioned as a classical inducible enhancer which increased CSF2 promoter activity threefold. However, although it was inactive on its own, the +30‐kb pDHS synergized with the +28‐kb enhancer in the activation of the promoter. In addition, a DNA segment that contains both the IL3 −1.5‐kb and −4.1‐kb pDHSs similarly lacked enhancer activity in the context of the IL3 promoter, just like the IL3 −34‐kb and −41‐kb pDHSs, and in marked contrast to the −37‐kb iDHS (Fig 1H). Taken together, these data suggested that the stable pDHSs are not necessarily classical enhancers, but may aid the induction of inducible enhancers in a natural context when T cells are re‐stimulated.
Activation of the human IL3 locus is assisted by locus priming
Human Jurkat T cells display a pattern of DHSs at the IL3 locus that closely resembles the state seen in TB (Fig 1D). To investigate the potential function of pDHSs in the absence of classical enhancer activity, we used CRISPR technology to specifically delete the human IL3 −34‐kb pDHS from both alleles in Jurkat cells (Fig 2A). Analyses of average mRNA levels revealed a substantial delay in the activation of IL3, but not JUN, in 2 clones lacking the −34‐kb pDHS when compared to clones with an intact locus (Fig 2B and C). We next employed a PCR‐based chromatin accessibility assay to demonstrate that the adjacent −37‐kb IL3 enhancer iDHS had reduced accessibility to DNase I in the clones where the −34‐kb pDHS was deleted, whereas no consistent differences were observed in the active TBP promoter or in an inactive control region (Fig 2D). These data are consistent with pDHSs functioning to facilitate inducible enhancer activation by establishing permissive active chromatin domains.
Figure 2. Impaired induction of IL3 gene expression and enhancer DHS formation following deletion of a pDHS in human Jurkat T cells.

- Map of the region upstream of IL3 gene spanning the −34‐kb pDHS and −37‐kb inducible enhancer, together with the locations of the guide RNAs used to delete the −34‐kb pDHS and the PCR primers used to detect the deletion. On the right is a PCR analysis confirming deletion of the −34‐kb pDHS on both alleles in 2 out of 4 clones selected for the analyses shown below.
- Average IL3 (upper) and JUN (lower) mRNA expression in the −34‐kb−/− clones A and B compared to the WT clones A and B stimulated for 2, 4, and 8 h with PMA/I. mRNA levels were normalized first to GAPDH and then to the level of gene expression in untransfected Jurkat T cells. Values represent the average of two −34‐kb−/− and two WT clones from two independent experiments (n = 4) with SD.
- IL3 and JUN mRNA expression levels after 2 h of stimulation with PMA/I normalized as in (B). The standard error is shown from five independent experiments.
- Deletion of the −34‐kb pDHS impairs induction of the iDHS at the −37‐kb inducible enhancer. The −34‐kb−/− clones A and B, the WT clones A and B, and untransfected Jurkat T cells were stimulated with PMA/I for 3 h. A range of DNase I concentrations were used to determine the chromatin accessibility of the −37‐kb iDHS in two independent clones, with values expressed relative to normal unstimulated Jurkat cells. Increased accessibility was detected by a reduction in signal detected by qPCR. The active TBP promoter and an inactive region on Chr18 are used as controls. Independent experiments for the −34‐kb−/− and WT clones A and B compared to the untransfected Jurkat T cells are shown in the upper and lower panels, respectively.
The human and mouse IL‐3/GM‐CSF gene loci share conserved pDHSs
To investigate the formation of pDHSs on a global scale, we used the DNase‐Seq data to map DHSs throughout the mouse genome. Figure EV1B shows a comparison of CD4 TN, TB, and TM and CD8 TN and TB across a 900‐kb region of the mouse genome which includes the Il3/Csf2 locus, the Il4/Il13/Il5 Th2 cytokine gene cluster, plus several other unrelated genes. Shared DHSs present in all samples served as useful internal controls to confirm that appropriate scales were depicted and that equivalent levels of DNase digestion were employed. Most DHSs were conserved between the human and mouse Il3/Csf2 loci (Figs 1D and EV1B). Most importantly, we detected the same general pattern of pDHSs and iDHSs as seen in the human locus in both CD4 TM, CD4, CD8 TB and TN, confirming the existence of a distinct class of TB/TM‐specific pDHSs that are stably maintained by memory‐phenotype cells. This pattern was highly reproducible because it was seen in 2 independent analyses of CD4 TN and TB (Fig EV1B). The 900‐kb window, shown in Fig EV1B, plus many other ubiquitously active loci, was used to set all browser tracks to equivalent levels of detection. The scales used here, and in all the browser tracks depicted below, are shown in Appendix Fig S2. Shown underneath are Venn diagrams depicting overlaps between DHS peak sets detected for the most prominent peaks for the three datasets where biological replicates were available.
Previous studies observed that the promoters of a subset of memory T‐cell‐specific genes were repressed by the Polycomb‐regulated modification H3K27me3 in naïve T cells and thymocytes (Nakayama & Yamashita, 2009). However, this is unlikely to be a universal mechanism, as we showed previously that this was not the case for the promoters of the inducible human IL3/CSF2 transgene which also cannot be induced in the thymus (Mirabella et al, 2010). Consistent with this finding, our analyses of additional published datasets (Wei et al, 2009; Russ et al, 2014) confirmed that regions spanning the above TB‐specific DHSs in the mouse genome had only background levels of H3K27me3 in both CD4 and CD8 TN, where these loci are inactive, and showed the same pattern as differentiated Th2 cells (Fig EV1B).
Mouse T cells display thousands of memory T‐cell‐specific pDHSs
Our next goal was to identify the full complement of pDHSs and iDHSs in mouse T cells. However, this is not a straightforward task because gene regulatory elements are an extremely diverse population that span a broad continuum of DNA elements with varying degrees of similarity to either pDHSs or iDHSs. In order to define the general properties of pDHSs and iDHSs, we first needed to identify representative groups of the most enriched and most specific DHSs within each subset.
We began by evaluating the different properties of DHSs in CD4 and CD8 TN and TB, and in CD4 TM to identify the most specific DHSs within each population. To this end, the TM and TB DHS datasets were each separately ranked according to fold change of DNase‐Seq tag counts first for (i) CD4 TM relative to CD4 TN (Fig 3A) and then for (ii) CD4 TB relative to CD4 TN (Fig 3B), and data were plotted as density maps spanning a 2‐kb window centered on the peak summits. In Fig 3B, the TM data was also plotted directly alongside the coordinates of the TB/TN comparison. Two observations were noteworthy: (i) TB and TM shared many specific DHSs that were absent in TN, highlighting the similarity between the recently activated proliferating TB and the quiescent primary TM; (ii) we reproducibly observed global enrichment of the same population of DHSs in TB compared to TN for both CD4 and CD8 T cells when all the data, including independent replicates of the CD4 TN and TB samples, were plotted using the same ranking as used for the original CD4 TN and TB data shown in Fig 3B (Fig EV2A). Overall, these data suggest that CD4+ T helper cells and CD8+ cytotoxic T cells utilize a common set of DHSs to maintain epigenetic priming in previously activated T cells. It is likely that these sites become established soon after cells first become activated, prior to terminal T‐cell differentiation to specific subtypes such as Th1 and Th2. The persistence of pDHSs in CD4 TM raised the interesting possibility that they may serve the additional purpose of enabling the rapid reactivation of inducible genes in memory T cells.
Figure 3. Genomewide mapping identifies a class of DHSs restricted to previously activated T cells.
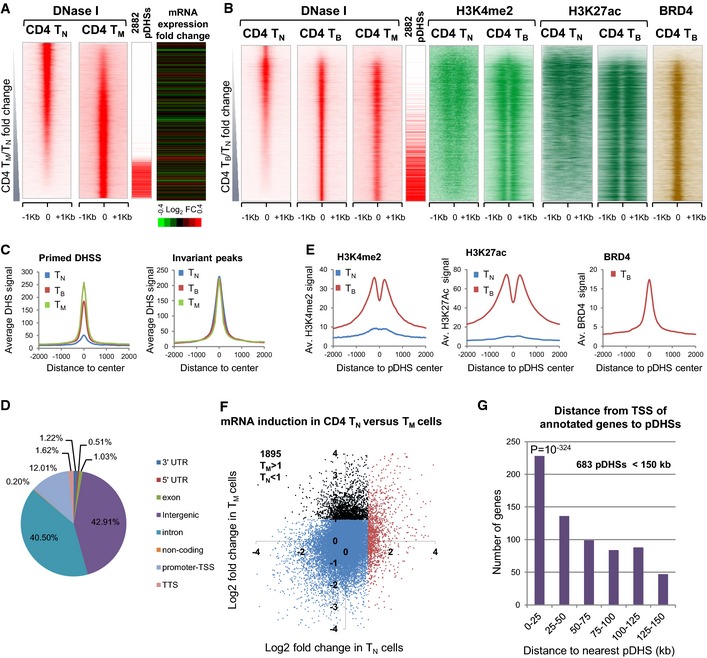
- Density maps depicting all DNase‐Seq peaks in the order of increasing DNase‐Seq tag count signal for CD4 TM compared to TN. On the right are the locations of the defined subset of 2,882 pDHSs and the log2 TM/TN fold change in expression of the closest gene to the corresponding DHS.
- Density maps for all DNase‐Seq and ChIP‐Seq peaks shown in order of increasing DNase‐Seq tag count signal for CD4 TB compared to TN. The TN H3K27ac track is from published data (Lara‐Astiaso et al, 2014).
- Average DHS signal at 2,882 pDHSs and 2,882 invariant DHSs in CD4 TN, TB, and TM. The locations of the 2,882 pDHSs are indicated in (A) and (B).
- Pie chart showing the genomic distribution of pDHSs.
- Average H3K4me2, H3K27ac, and BRD4 signal at 2,882 pDHSs.
- Plot of the log2 fold change in gene expression following 2 h PMA/I for CD4 TM compared to TN. 1,895 genes (black) have a log2 fold change of 1 or above in TM but not TN.
- Distance and gene expression analyses. P‐value represents χ2 significance against randomly expected number of pDHSs within 25 kb of a TSS (method described in Appendix).
Figure EV2. CD4 and CD8 T cells share a common set of pDHSs.

-
ADensity maps representing the DNase‐Seq peaks in the cell types indicated at the top, shown in the order of increasing DNase‐Seq tag count signal for the CD4 TB compared to CD4 TN. TB(2) and TN(2) are biological replicates.
-
BAverage DNase I profile at the pDHSs in CD4 TB(2) and TN(2), CD8 TB and TN, plus the average H3K27me3 profiles for publically available CD4 and CD8 datasets in TN TM, effector T cells (TE), and Th2 cells.
-
C, DBoxplots of log2 mRNA expression fold change (C) and absolute expression levels (D) of the 1,895 TM‐specific genes in CD4 TN, CD4 TB and CD4 TM. Boxes represent the first and third quartile, respectively. Bottom and top whiskers represent the first and third quartile minus and plus 1.5 times the interquartile range.
-
EGene ontology for the 1,895 TM‐specific genes.
-
FMean cumulative mRNA array values for two alternatively spliced forms of the gene encoding NFATc1. Values are based on 4 separate micro‐array values and are shown with SD.
-
GHierarchical correlation clustering of mRNA levels for the top 1% of genes with the highest variance of mRNA expression between populations of CD4 and CD8 TN , TB, and TM. Treatment with PMA/I is indicated by a “+” sign. Pearson correlations are shown according to the color scale (top left). B, N, and + (right) indicate the dominant groups resulting from clustering.
To obtain mechanistic insights into global mechanisms of pDHS formation, we identified the most prominent pDHSs by using the analysis shown in Fig 3A to define peaks that were at least threefold enriched in CD4 TM relative to CD4 TN. After excluding minor peaks, we selected a reproducible subset of 2,882 of the CD4 TM pDHSs that were also present in the CD4 TB DHS dataset (Dataset EV1). The majority of the 2,882 CD4 pDHSs were also present in the CD8 TB (2,382 = 83%) and the replicate CD4 TB (85%) datasets shown in Fig EV2A. These 2,882 shared DHSs were then used as a representative, but not necessarily all‐encompassing, population of pDHSs for our further analyses. The average DHS profiles for these pDHSs in CD4+ cells (Fig 3C) confirmed that they are strong DHSs in both TM and TB but weak in TN. This was also true for the average profiles of the 2,882 CD4 pDHSs in CD8 TN and TB, and in replicate samples of CD4 TN and TB (Fig EV2B). As an internal control for non‐specific DHSs, we used a randomly selected subset of 2,882 invariant DHSs which were confirmed as being present in all three CD4 T‐cell types (Fig 3C). The 2,882 pDHSs were mapped back to the genome and consisted mainly of distal sites (83%) in intergenic and intronic regions, with just 12% being within 1 kb of a transcription start site (TSS) (Fig 3D).
We next measured the level of two enhancer‐associated histone modifications at all of the DHSs by ChIP‐Seq. The enrichment of H3K4me2 and H3K27ac in TN and TB was plotted for each of the DHSs as density maps (Fig 3B). As observed for the pDHSs at the human IL3/CSF2 locus (Fig 1D), the 2,882 pDHSs were marked with H3K4me2 and H3K27ac only in TB and not TN (Fig 3B and E). We also performed ChIP‐Seq for the transcriptional activator BRD4, which binds to acetylated histones and has been shown to maintain binding during mitosis (Zhao et al, 2011), and found a strong enrichment at pDHSs in TB (Fig 3B and E). In contrast, the average profiles for H3K27me3 taken from published datasets (Wei et al, 2009; Russ et al, 2014) were essentially baseline across the pDHSs in CD4 and CD8 TN, and in Th2 cells (Fig EV2B), suggesting that these regions are not differentially regulated via loss of a repressive histone modification.
Activated TB and TM express a common set of inducible genes
In parallel with the genomewide DNase‐Seq and ChIP‐Seq analyses, we measured mRNA expression levels in duplicate in the different CD4 cell types (TN, TB, TM) and in CD8 TN and TB by microarray analysis in both untreated cells and cells after 2 h of stimulation with PMA/I. The comparison of the fold induction for each gene in CD4 TN and TB showed 1,895 TM‐specific genes being at least twofold induced in TM and less than twofold induced in TN (black dots, Fig 3F, Dataset EV2). In addition, the average fold change values confirmed that the 1,895 CD4 TM‐specific induced genes were upregulated in both CD4 TM and TB (Fig EV2C). However, there was little difference in steady‐state levels of mRNA among TN, TB, and TM, with values actually being slightly lower in TM and TB (Fig EV2D). Gene ontology analysis indicated that these 1,895 upregulated genes were generally associated with immune responses and the activation of signaling pathways (Fig EV2E). In addition to the genes discussed above, this included many immune regulators such as the interleukins 9, 19, 20, 22, 27, and 31, receptors for CSF‐1, IL‐1, IL‐2, IL‐12, IL‐15, and IL‐13, other genes in cytokine or chemokine pathways such as Cxcl3, and Cxcl5, Cxcr3, Cxcr5, Ccl2, Ccl19, Ccl24, Ccr2, Ccr6, Tnfrsf4 and Tnfrsf9, Tnfsf8, and genes encoding the transcription factors NFIL3, NFATc1, and NFAT5. Note that although Nfatc1 was only modestly induced in TB (Fig EV1A), it was induced more strongly in TM than in TB (Fig EV2F).
To search for common patterns of differential mRNA expression among the various T‐cell subsets, we performed a clustering analysis of correlation coefficients for the top 1% of genes showing the highest variance between all the subsets (242 genes, Fig EV2G). This revealed a common expression pattern shared by stimulated CD4 TM, CD4 TB, and CD8 TB, whereas the patterns for stimulated TN cells more closely resembled non‐stimulated TN cells for both CD4+ and CD8+ T cells. Interestingly, the basal pattern for CD4 TM was more similar to CD4 TN than it was to the stimulated CD4 TM, likely reflecting the resting proliferation status of these cells. These observations are significant because they suggest that the presence of 2,882 pDHSs has little impact on baseline levels of gene expression, consistent with Figs 3A and EV2D and the notions that (i) the role of pDHSs is to regulate inducible, not basal gene expression, and (ii) that pDHSs are not classical enhancers that activate genes in the absence of stimulation. A direct comparison of mRNA values for the genes nearest to the 2,882 pDHSs, and for the 1,895 inducible genes identified in Fig 3F, also demonstrated that there was no substantial difference in the expression of these genes in the absence of stimulation in TN compared to TM (Appendix Fig S3).
Primed DHSs are located proximal to inducible genes carrying inducible DHSs
To globally assess the role of pDHSs in regulating inducible gene expression, we mapped the distances from the TSSs of the 1,895 TM‐specific inducible genes to the nearest pDHS. We identified 683 genes (Dataset EV3) that had a pDHS located within 150 kb of the TSS of the induced gene, representing 23.7% of all pDHSs (Fig 3G). This figure was higher compared to the number of similarly sized, randomly generated coordinates (214/2,882, 7.4%), randomly selected constitutive DHSs (223/2,882, 7.7%) and randomly selected iDHSs (438/2,882, 15.2%) located within 150 kb of an inducible gene. Remarkably, more than 200 of these 683 pDHSs were located within just 25 kb of the start site (P ≤ 10−324), indicating a strong correlation between proximity to preexisting pDHSs and inducible gene expression in memory T cells. Of the remaining inducible genes, 91% did nevertheless contain a constitutive DHS within 150 kb.
To identify DNA elements controlling the induction of gene expression, we mapped the inducible DHSs (iDHSs) throughout the genome in CD4 TB which had been stimulated for 2 h with PMA/I (TB +). In parallel, we performed ChIP‐Seq for H3K4me2, H3K27ac, and BRD4. The two sets of DHS data were plotted as density maps ranked according to the fold change of DNase‐Seq tag counts for the combined TB + and TB datasets (Fig 4A). This analysis revealed several thousand iDHSs which were associated with steadily increasing levels of H3K4me2 flanking the iDHSs, and increasing levels of mRNA expression for the adjacent genes, suggesting that many of these elements act as enhancers.
Figure 4. iDHSs lie close to pDHSs and are associated with inducible genes.

-
ADensity maps identifying iDHSs and showing DNase‐Seq and H3K4me2 ChIP‐Seq peaks in order of increasing DNase‐Seq tag count signal for CD4 TB + compared to TB cells. Also depicted are the locations of 6,823 major DHSs that are 5.5‐fold induced and a subset of 1,217 of these iDHSs that are 11‐fold induced. On the right is the log2 TB +/TB fold change in expression of the closest gene to the corresponding DHS.
-
BAverage DNase I profiles of the 1,217 iDHSs in TN (+/− PMA/I) and TB (+/− PMA/I) (left), and in TM (+/− PMA/I) (right).
-
CAverage DNase I and H3K27ac profiles of the 1,049 dDHSs in TN and TB (+/− PMA/I) which are fourfold diminished after stimulation.
-
DThe genomic distribution of the 1,217 iDHSs.
-
E–HBarplots showing the number of TM‐specific genes with an iDHS within 150 kb of the TSS (E); the median distances between the TSSs and the closest iDHS of the TM‐specific genes grouped according to the fold induction in TM after 2 h plus PMA/I compared to TM for genes which had a TSS < 1 Mb from an iDHS (F); the number of TM‐specific genes which have an iDHS within 150 kb of the 683 pDHSs (G); and the median distances from the closest pDHS to the closest iDHS grouped according to the fold induction in TM after 2 h plus PMA/I compared to TM (H). P‐values represent either χ2 significance against randomly expected number of DHSs within 25 kb (F and H) or t‐test significance against equally sized random DHSs (E and G). The methods used to calculate P‐values are described in the Appendix.
-
IUCSC genome browser shot of the Th2 Il4/Il13/Rad50 locus showing DNaseI‐Seq and ChIP‐Seq. Black and red arrows represent pDHSs and iDHSs, respectively. The values above the arrows indicate the distance in kb from the Il4 promoter.
To identify and characterize iDHSs, we initially focused on the top 15% of iDHSs and defined a population of 6,823 iDHSs that were induced by at least 5.5‐fold relative to CD4 TB (Fig 4A). However, since the most highly induced peaks showed the strongest correlation with changes in both H3K4me2 and mRNA expression, we also performed a more stringent selection of the 1,217 strongest iDHSs that were enriched by at least 11‐fold (Dataset EV4). The average DHS profiles for these 1,217 highly specific iDHSs confirmed that they were strictly inducible, present only in TB + and TM + and not in the un‐stimulated TB, TN, or TM (Fig 4B). However, there was also a subset of 1,049 DHSs that were diminished by at least fourfold after stimulation (dDHSs), and the inducible changes in the average H3K27ac profiles of dDHSs suggested both a decrease in the level of H3K27ac and a closing up of the nucleosome‐free regions at these sites (Fig 4C). This subset included 249 pDHSs, suggesting that the chromatin encompassing pDHSs and iDHSs is highly dynamic. In contrast, iDHSs became highly enriched for H3K27ac, H3K4me2, and BRD4 specifically after the cells were stimulated (Fig EV3A). Similar to the pDHSs, the 1,217 iDHSs were located mainly in intragenic and intronic regions, with just 1.4% being within 1 kb of a TSS (Fig 4D).
Figure EV3. Properties in inducible DHSs.

- Average H3K4me2, H3K27ac, and BRD4 signals at the 1,217 iDHSs in CD4 TB and TB +, plus H3K4me2 and H3K27ac for TN.
- Gene ontology for the 187 TM‐specific genes located within 25 kb of both a pDHS and an iDHS.
- DNase I‐Seq and ChIP‐Seq at the Il10 locus in CD4 TN , TM , TB , TB +, and Th2 cells and CD8 TN and TB.
- Il4 and Il10 mRNA expression in CD4 TN and CD4 TM stimulated with PMA/I for the times indicated. Relative mRNA values are expressed as in Fig 1C, with SEM. The number of replicates for each (n) is shown underneath.
We next investigated the potential significance of the iDHSs with respect to gene expression and measured the distances from the TSSs of the 1,895 TM‐specific inducible genes (Fig 3F) to the nearest iDHS (using the more inclusive 6,823 subset). Approximately 1,000 of the inducible genes had an iDHS within 150 kb of the TSS, and nearly 500 of these elements were located within just 25 kb which was highly significant (P = 10−92) (Fig 4E), further signifying a role for the iDHSs as inducible enhancers of these genes. Consistent with this finding, the most highly induced TM‐specific genes were associated with the closest iDHSs, whereby the 48 genes that were induced greater than 10‐fold were on average within 10 kb of an iDHS (Fig 4F) suggesting a role of these elements as enhancers.
We next addressed the question of the potential relationships between pDHSs, iDHSs, and inducible genes by focusing on the 683 pDHSs which were within 150 kb of a TM‐specific inducible gene (Fig 3G) and measuring the distances between these pDHSs and the closest iDHS (Fig 4G). Significantly, 587 (86%) of the 685 pDHSs contained an iDHS within 150 kb, and 312 of these (46%) were within just 25 kb (P = 10−132). These data reinforce the view that pDHSs function at close range to support inducible enhancer function. In addition, we found that the most highly induced genes also displayed the shortest distances between the pDHSs and iDHSs (Fig 4H). Hence, the 54 genes that were induced at least sixfold featured a pDHS located within an average of 15 kb of an iDHS. Significantly, 187 of these 312 loci also carried an iDHS that was located within 25 kb of the TSS. Gene ontology analysis of these 187 genes showed a highly significant association with immune responses and the activation of signaling pathways (Fig EV3B) including immune regulators such as Il3, Il4, Il31, Il15ra, Il1rl1, Il18rap, Cxcr3, Ccr2, Tnfrsf4, Tnfrsf9, Tnfsf8, Tnfaip8, Itga3, Itgav, Alcam, Mpzl2, Lpar3, Notch1, Icos, Map3k5, and Fyn, and key TF genes such as Rela, Nfil3, and Nfatc1.
To further investigate the potential significance of pDHSs, we plotted their positions relative to iDHSs located within 150 kb of a promoter of an inducible TM‐specific gene (Appendix Fig S3C). This confirmed the strong trend for pDHSs to be located close to iDHSs, independently of the distances of these DHSs from the promoter.
To provide additional examples for loci that utilize pDHSs and iDHSs, we examined two other classic models of inducible cytokine loci: the Th2 cytokine gene locus, encompassing Il4, Il13, and the Th2 locus control region (LCR) (Lee et al, 2005) (Fig 4I), and the Il10 locus (Jones & Flavell, 2005) (Fig EV3C). Similar to Il3 and CSF2, Il4 and Il10 were specifically induced in TB and TM but not TN (Figs 1C and EV3D) and contain multiple pDHSs and iDHSs which were only detected in previously activated T cells (Figs 4I and EV3C). The Th2 cytokine locus contains several TB‐specific iDHSs, including one 11.5 kb downstream of Il4, and one within the Th2 LCR, which were each shown previously to function as enhancers (Lee et al, 2001). Both of these iDHSs lie close to pDHSs in TB and TM (Fig 4I). Like the pDHSs at the IL3/CSF2 locus (Fig 1D) (Baxter et al, 2012), the Il4 +9‐kb pDHS (defined by others as HS4) also lacked independent enhancer function (Lee et al, 2001). A similar example is shown for Il10 (Fig EV3C) where an array of pDHSs and iDHSs extends 30 kb upstream of the promoter specifically in previously activated cells. The Il4 +11.5‐kb and the Il10 −24‐kb iDHSs are both included within primed regions having elevated levels of H3K27ac and H3K4me2 in TB prior to stimulation. A parallel analysis of published H3K27me3 datasets for Il4 and Il10 again showed no prior enrichment for this modification in CD4 or CD8 TN in regions that subsequently form TM‐specific DHS during blast cell transformation (Figs 4I and EV3C). However, there was a TN‐specific enrichment for H3K27me3 at the Il10 promoter, consistent with this being a parallel mechanism of regulating the transition from TN to TB and TM, but operating at a different class of regulatory elements.
Primed DHSs bind constitutively expressed transcription factors
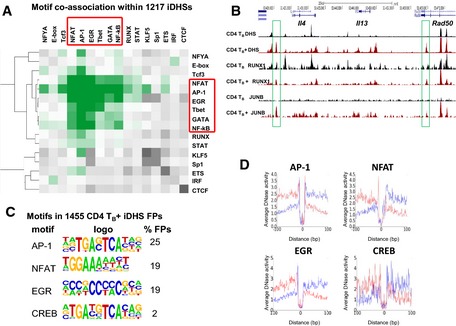
The 2,882 pDHSs created during T‐cell blast cell transformation are stably maintained in both dividing and non‐dividing cells, without any substantial change to the TF expression program. Therefore, a key question is why the pDHSs remain open in TB and TM, while the iDHSs are not maintained. To this end, we investigated which transcription factors remained stably bound to pDHSs in the unstimulated state by searching for enriched DNA motifs within the pDHSs using HOMER (Heinz et al, 2013). The most enriched motifs corresponded to the known consensus binding sequences for ETS and RUNX family transcription factors, which were present in 44 and 47% of the targets, respectively (Fig 5A). Significantly, the ETS motif identified here corresponds to the composite ETS/RUNX motif to which these factors bind in a cooperative fashion in T cells (Hollenhorst et al, 2009). To a lesser extent, pDHSs were also enriched for motifs for inducible factors which respond to TCR and growth factor signaling, including AP‐1, IRF, and STAT family proteins. We plotted the coordinates of the motifs back onto the DHSs, ordering them as previously according to the DHS intensity fold change for TB compared to TN (Fig 5B). Consistent with their known functions throughout T‐cell development, the RUNX and ETS motifs were found both at TB‐specific pDHSs and at constitutive DHSs shared by TB and TN. In contrast, the motifs for AP‐1 and STAT were predominantly found within the TB‐specific DHSs. We also performed a bootstrapping analysis which determined the statistical significance of motif co‐occurrence within 50 bp and observed that the ETS, RUNX, STAT, GATA, and AP‐1 motifs co‐localized within the pDHSs (Fig 6A) and most likely form interacting complexes.
Figure 5. pDHSs bind constitutively expressed transcription factors.

- De novo motifs enriched within 2,882 pDHSs determined using HOMER.
- Motif distribution in all DHSs ordered by increasing DNase‐Seq tag count signal for CD4 TB relative to TN as in Fig 3B.
- DNase‐Seq and RUNX1 and ETS‐1 ChIP‐Seq density maps showing the binding at the DHSs ordered as for (B), with average profiles of RUNX1 and ETS‐1 binding to the pDHSs in TB compared to TN shown below.
- JUNB ChIP‐Seq in TB and TB + at the DHSs defined in TN and TB and ordered as in (B) with average profiles shown below.
- Patterns of RUNX1, ETS‐1, and JUNB binding at RUNX, ETS, and AP‐1 motifs at the Trpm6 locus.
Figure 6. Co‐association of ETS‐1 and RUNX1 in pDHSs, and the role of RUNX1 in establishing priming.

- Hierarchical clustering of motif co‐association enrichments in pDHSs. Z‐scores represent enrichment of observed versus background co‐associations computed in 1,000 randomly selected, chromatin‐accessible regions.
- Log2 mRNA expression levels of Runx1, Ets1, and B2m in untreated and PMA/I‐treated TN , TM , and TB from the microarray analysis.
To verify that the predicted TF motifs were occupied in vivo, we performed ChIP‐Seq to assess the levels of RUNX1 and ETS‐1 binding to the DHSs in both TN and TB (Fig 5C). RUNX1 and ETS‐1 binding was detected in both cell types at the shared DHSs. However, binding of these factors to the pDHSs was restricted to TB (Fig 5C, Appendix Fig S4). We excluded the idea that this result was caused by increased RUNX1 and ETS‐1 expression by examining gene expression microarray data obtained from independently prepared duplicates for each of the different cell types (Fig 6B) which revealed similar levels of Runx1 and Ets1 mRNA in TN, TM, and TB. We therefore hypothesized that additional inducible factors may be required for the original genesis of the pDHSs and investigated the levels of AP‐1 binding by performing a JUNB ChIP‐Seq assay. Whereas very little basal level AP‐1 binding was observed in TB (Fig 5D), AP‐1 binding was greatly increased in TB + after stimulation, with high enrichment at the pDHSs, consistent with the elevated AP‐1 family mRNA levels (Fig EV1A) and the observed distribution of AP‐1 motifs and ChIP peaks (Fig 5B, Appendix Fig S4). We previously showed above that Fos mRNA was induced in TN by ConA during blast cell transformation (Appendix Fig S1A). These data support the view that AP‐1 plays a role in the creation, and subsequent reactivation, but not necessarily the steady‐state maintenance of pDHSs when much lower levels of at least Fos, Fosb, and Jun mRNA are detected (Fig EV1A).
A specific example of TM‐specific DHSs which contained the predicted motifs and which showed enrichment by ChIP is shown in Fig 5E depicting the transient receptor potential M6 (Trpm6) locus which contained multiple TM/TB‐specific DHSs. At the −3.2‐kb and +21‐kb pDHSs, ChIP peaks were detected for RUNX1 and ETS‐1 in TB but not TN. Importantly, motifs for both these factors were present within the hypersensitive region. At the −2.4‐kb DHS, we identified a RUNX motif, but no ETS motif, and this was reflected by binding of RUNX1 but not ETS‐1. Furthermore, at least 6 DHSs within this locus encompass AP‐1 motifs, and this was reflected by specific JUNB binding in TB + and not in TB (Fig 5E).
Further efforts are needed to investigate functions of RUNX1 and ETS‐1, but this is a difficult issue to address because RUNX and ETS proteins play important roles in many aspects of T‐cell development and function (Muthusamy et al, 1995; Telfer & Rothenberg, 2001; Egawa et al, 2007). We began with a preliminary attempt at evaluating the roles of roles of RUNX1 in blast cell transformation and the activation of inducible cytokine genes associated with pDHSs. For this purpose, we prepared TB in the presence of either the inhibitor Ro5‐3335, which is reported to suppress RUNX1 function (Cunningham et al, 2012), or with DMSO as a control. The inhibitor was included during the activation of CD4 T cells by ConA, after which the cells were cultured for 24 h with the inhibitor and IL‐2. However, the inhibitor greatly decreased the proportion of T cells that survive the transformation process as live non‐apoptotic cells (Appendix Fig S5A). Nevertheless, when the inhibitor was removed and the surviving live cells were stimulated, the residual effect of the inhibitor was to suppress the induction of genes associated with pDHSs (Il4, Il3, and CSF2) but not inducible genes or constitutive genes believed to be independent of pDHSs (Tnf and Cd2) (Appendix Fig S5B). These data are consistent with a requirement for RUNX1 both in efficient blast cell transformation and in the memory recall response.
RUNX and ETS motifs are occupied in TB and TM
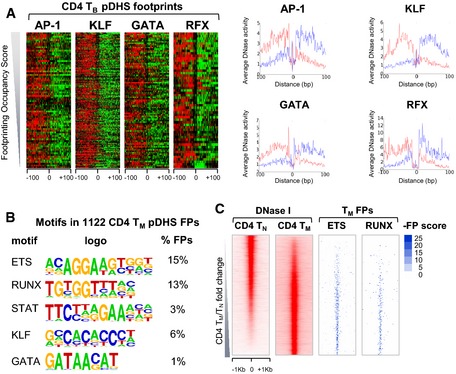
To screen for potential additional factors without having to speculate on which antibody to use for ChIP assays, we employed our recently developed Wellington algorithm (Piper et al, 2013) to perform in silico DNase I footprinting on the DNase‐Seq data from TB. This algorithm statistically scores an imbalanced pattern of positive strand reads starting immediately 5′ of the footprint and negative strand reads starting immediately 3′ of the footprint, spanning the binding site which is detected as a region with reduced reads. The distribution of motifs detected by HOMER within these footprints (Fig 7A) resembled that of motifs detected in the full‐length DHSs (Fig 5A), with RUNX and ETS the most prominent motifs, accounting for more than half of all the predicted FPs. These were followed by STAT motifs, representing another inducible factor family potentially influencing pDHS formation. Figure 7B depicts the relative DNase I profiles surrounding the FPs at each protected RUNX, ETS, and STAT motif, showing the relative density of the upper (red) versus lower (green) strand DNase I cuts. Equivalent profiles are shown for footprinted AP‐1, KLF, GATA, and RFX motifs in Fig EV4A. FPs were ordered according to increasing occupancy score with the most prominent patterns representing the best FPs (Figs 7B and EV4A). Figures 7B and EV4A also show the average DNase I profiles to illustrate the average cuts on each of the upper (red) and lower (blue) strands centered about the motif. A similar pattern of footprinted RUNX and ETS motifs was detected in TM (Figs 7C and EV4B). An evaluation of the locations of footprinted ETS and RUNX motifs revealed the same patterns of binding to pDHSs in TM as was seen for the shared DHSs in TN (Fig EV4C). Examples of occupied ETS and/or RUNX motifs in TB are shown for 2 pDHSs located 3.7 and 35 kb upstream of Ccl1 where binding of both ETS‐1 and RUNX1 was demonstrated by ChIP‐Seq (Fig 7D). In keeping with a role for the pDHSs in priming inducible gene expression, Ccl1 is upregulated more efficiently in TB and TM compared to TN (Fig 7E). We also assayed the −3.7‐kb and −35‐kb pDHSs for potential enhancer activity using the same assay system employed above for testing the IL3 pDHSs. Similar to the IL3 pDHSs, these two Ccl1 pDHSs had no significant enhancer activity in a transfection assay (Fig 7F).
Figure 7. Motifs for constitutive TFs are footprinted in vivo in pDHSs.

- Enriched motifs defined by HOMER using a de novo motif search of the digital DNase I FPs identified in the pDHSs in TB.
- DNase I cleavage patterns in TB from the FPs determined by Wellington at the pDHSs centered on the motif named at the top and ordered according to increasing FP occupancy score. Left: Cuts are shown within a 200‐bp window with positive (red) and negative (green) strand imbalances in DNase I cuts. Right: Average profiles of the actual DNase I cuts at footprinted motifs within the pDHSs, with upper strand DNA cuts shown in red and lower strand cuts in blue.
- Average profiles of the DNase I cuts at footprinted motifs within the pDHSs in TM determined as in (B).
- Example of FP patterns and motifs at the −3.7‐kb and −35‐kb pDHSs at the Ccl1 locus in TB.
- mRNA array values for Ccl1 expression.
- Luciferase reporter gene assays in stimulated Jurkat T cells performed as in Fig 1H of the IL3 promoter alone or in combination with the Ccl1 −3.7‐kb or −35‐kb DHSs, with SD. Values are expressed as the mean with the number of replicates for each (n) shown underneath.
- Footprinting of AP‐1 sites in TB +. DNase I upper and lower strand cleavage patterns were calculated as in (B) (left) plus the average DNase I profiles (right) for all AP‐1 motifs within the subset of 2,882 defined pDHSs in TB cells before and after stimulation, ranked in order of decreasing FP probability score.
- Distribution of the FP probability scores for the data shown in (G).
Figure EV4. DNase I footprints of TFs in TB .
- Left: DNase I cleavage strand imbalance patterns within the footprints identified by Wellington at the pDHSs centered on the motif named at the top and ordered according to increasing FP occupancy score. Relative levels of DNase I cuts are shown within a 200‐bp window with upper strand DNA cuts shown in red and lower strand cuts in green. Right: Average profiles of the DNase I cuts at the different motifs within the pDHSs, upper strand DNA cuts shown in red and lower strand cuts in blue.
- Results of the HOMER de novo motif search of pDHS digitally footprinted regions in CD4 TM.
- ETS and RUNX motif‐containing footprints (right) within DHSs in TM sorted by TM/TN fold change (left).
A much smaller percentage of pDHS FPs in non‐stimulated TB (4%) contained occupied AP‐1 motifs compared to the number of occupied RUNX and ETS motifs (Fig 7A). However, after stimulation, protection at the AP‐1 sites increased significantly in TB + (P = 10−51, Fig 7G), consistent with the increased JUNB binding (Fig 5D) that occurred upon treatment with PMA/I. This was reflected by the distribution of footprint probability scores (Fig 7H).
Taken together, our ChIP and footprinting analyses suggest that RUNX1 and ETS‐1 cooperate with inducible factors such as AP‐1 to establish pDHS, and are important players in the maintenance of open chromatin at these sites.
The ratio of inducible versus constitutive transcription factors determines the properties of transient and stable DHS
We next addressed the question of what distinguished constitutive pDHSs from the highly inducible iDHSs in TB +. To this end, we performed a de novo motif search using the subset of the 1,217 most enriched iDHSs (Fig 8A). The distribution of motifs in the iDHSs in TB + was markedly different to the pDHSs in TB as the pattern was dominated by motifs for the inducible TFs AP‐1 (58%) and NFAT (56%). Many of these were composite NFAT/AP‐1 motifs of the type first described for the Il2 promoter and CSF2 enhancer (Cockerill et al, 1995; Chen et al, 1998), and observed above in the Trpm6 +23‐kb iDHS (Fig 5E). The full‐length composite NFAT/AP‐1 motif depicted in Fig 8A was present in 34% of iDHSs, which were also enriched with motifs for the inducible EGR and NF‐κB families of TFs. The enrichment of RUNX motifs was considerably lower in iDHSs (12%) than in pDHSs (47%), and ETS motifs were not enriched at all. These results were supported by bootstrapping analyses of the statistical significance of motif co‐occurrence within 50 bp, which demonstrated that inducible factors, but not ETS‐1 or RUNX1, co‐localized in iDHSs (Fig EV5A).
Figure 8. Inducible DHSs bind inducible and constitutively expressed transcription factors.

- De novo motif search of the 1,217 iDHSs using HOMER.
- Motif distributions in the DHSs ordered by increasing DNase‐Seq tag count signal for CD4 TB + cells compared to TB cells as in Fig 4A.
- RUNX1 and JUNB ChIP‐Seq density maps depicting binding at all DHSs ordered as in (B).
- RUNX1 and JUNB ChIP‐Seq profiles for DHSs at the Il10 locus in TB and TB +.
- DNase I cleavage strand imbalance patterns displayed as in Fig 7G for footprinted TF motifs in TB + at the iDHSs.
- Example of FP patterns and motifs at the −15‐kb and −35‐kb iDHSs in TB + cells at the Ccl1 locus.
Figure EV5. Co‐association of inducible TFs in iDHSs.
- Hierarchical clustering of motif co‐association enrichments in iDHSs. Z‐scores represent enrichment of observed versus background co‐associations computed in 1,000 randomly selected, chromatin‐accessible regions. Z‐score scale as in Fig 6A.
- UCSC genome browser shot of the Il4, Il13, and Rad50 loci showing DNase‐Seq and ChIP‐Seq for TB and TB +.
- De novo motifs identified by HOMER within iDHS digital FPs.
- Average profiles of DNase I cuts at motifs within the iDHSs. Upper strand DNA cuts are shown in red and lower strand cuts in blue.
The inducible TF motifs were mapped back onto the combined TB and TB + DHS dataset (Fig 8B), once again ranked according to the degree of DHS enrichment in TB + compared to TB as in Fig 4A. This revealed that the inducible TF binding sites were highly enriched in the iDHSs and were located predominantly at their centers. In contrast, the RUNX motifs and the RUNX1‐bound DHSs were divided between the shared DHSs and the iDHSs (Fig 8B and C), similar to what was observed in the TB and TN analysis (Fig 5B). However, the ChIP‐Seq analyses showed that RUNX1 only bound to the iDHSs after stimulation (Fig 8C). JUNB ChIP‐Seq also confirmed that AP‐1 bound specifically to the inducible sites only when the cells were stimulated (Fig 8C). In contrast, the dDHSs that were lost upon stimulation did not encompass AP‐1 motifs. The inability to recruit AP‐1 most likely makes them susceptible to the effects of chromatin remodeling that stems from other nearby DHSs which do bind AP‐1.
An example of the above patterns of TF binding is shown for the Il10 locus (Fig 8D) where RUNX1 and JUNB bound to the −24‐kb and −30‐kb iDHSs only in TB +. RUNX1 also bound to the −9‐kb and −26‐kb pDHSs prior to stimulation, whereas AP‐1 only bound to these sites after treatment with PMA/I. A similar pattern of binding was observed at the Th2 cytokine gene locus (Fig EV5B). Wellington FP analyses of the TB + DNase‐Seq data revealed strong footprints at the iDHSs, with AP‐1, NFAT, and EGR motifs being the most abundant occupied motifs (Figs 8E and EV5C and D). This result is consistent with the notion that iDHSs are enriched in motifs occupied by multiple species of inducible TFs, responding to concurrent signals. Examples of AP‐1 and AP‐1/NFAT FPs are shown here for the −15‐kb and −35‐kb DHSs at the Ccl1 locus. In this instance, the −35‐kb DHS represented a preexisting DHS which recruited AP‐1 and became a broader DHS after stimulation. Overall, our analyses identified a strong trend toward a significant difference in the binding motif composition between pDHSs and iDHSs.
The above studies revealed that the iDHSs and pDHSs bind a common set of inducible and constitutively expressed transcription factors yet exhibit different kinetic behaviors within chromatin with one class of binding sites being maintained but not the other. To further investigate the reason for this difference, we determined the number of motifs per DHS within the most enriched population of each class of DHSs. For this purpose, we compared the most specific subset of 1,217 iDHSs with the 2,882 pDHSs identified in TM. To further validate TB as a surrogate model for TM, we also analyzed the equivalent subset of the 3,085 most enriched DHSs detected in a comparison of TB and TN (Fig 9A and B), as these should give the same pattern as TM. As expected, the TM‐ and TB‐specific DHSs had an essentially identical motif composition, with RUNX, ETS, and STAT motifs being abundant, whereas NFAT and AP‐1 motifs were more frequent in iDHSs (Fig 9A). We tabulated the motif counts for each dataset for the 5 most abundant motifs for inducible factors (AP‐1, NFAT, EGR, NF‐κB, and CREB/ATF) and the 5 most abundant motifs for constitutive factors (ETS, RUNX, KLF, GATA, and E‐box) (Fig 9B). The motifs used for this purpose were the ones identified as de novo motifs by HOMER above (Dataset EV5). An analysis of the ChIP peaks confirmed that ETS‐1 and RUNX1 were each bound to two‐third of 2,882 pDHSs (Fig 9C). Overall, these analyses revealed that TM‐ and TB‐specific pDHSs contained three times more motifs for constitutive than inducible factors and the converse was true for iDHSs with the ratio of inducible versus constitutive factor binding sites being two to one. Moreover, the comparison of co‐localizing motifs within pDHSs and iDHSs showed a strong co‐localization between inducible and constitutive factor binding sites in pDHSs, but not in iDHSs (Figs 6A and EV5A). These different motif compositions are exemplified by the +9‐kb pDHS and the +6.5‐kb iDHS at the Syne3 locus, the Th2 LCR, and the Cxcr3 locus (Appendix Fig S6). In the Syne3 +9‐kb pDHS, there is also an example of a composite ETS/RUNX motif of the type shown in Fig 5A.
Figure 9. Composition and properties of pDHSs and iDHSs.

- Motif counts for abundant TF binding sites at the specific DHSs in TM, TB, and TB +.
- Total motif counts for 5 inducible motifs (AP‐1, NFAT, EGR, NF‐κB, and CREB/ATF) and 5 constitutive motifs (ETS, RUNX, KLF, GATA, and E‐box) in the specific DHSs in TM, TB, and TB +. The motifs used here are defined in Dataset EV5.
- Overlaps between ETS‐1 and RUNX1 ChIP peaks and the 2,882 pDHSs in TN compared to TB.
- Mechanisms of pDHS and iDHS regulation in T cells.
Taken together, these data suggest a model whereby the balance of a common set of factors at specific cis‐elements determines the kinetic behavior of transcription factor assembly and maintenance, and nucleosome occupancy (Fig 9D). This finding supports a model whereby the acquisition of immunological memory in T cells is driven during blast cell transformation by inducible factors that enable the redistribution of preexisting factors. The key to this model is that the density of constitutive factors bound at pDHSs is sufficient to maintain them in the long term, once they have formed, but is insufficient to initially create these DHSs without additional support from inducible factors. The converse is true of the inducible DHSs, which use a high density of inducible motifs to function as rapid response elements, and cannot be maintained once the inducing stimulus is removed. In addition, there will be many other DHSs which share some of the properties of both pDHSs and iDHSs.
Discussion
This study significantly advances our understanding of the fundamental molecular mechanisms that underpin the long‐term maintenance of stable molecular memory in cells that have previously responded to transient stimuli. In our model, inducible factors activated by the primary response in naïve T cells direct the re‐localization of the preexisting factors ETS‐1 and RUNX1 to thousands of newly established pDHSs which remain associated with pDHSs and continue to modify chromatin structure after the initial stimulation has ceased. Their binding is likely to be further stabilized due to the fact that the ETS motif identified in Fig 5A is a composite ETS/RUNX motif binding these factors cooperatively (Hollenhorst et al, 2009). Based on the functional and correlative studies described here, many of these pDHSs are not typically classical enhancers, but function at close range to maintain a regional state of active chromatin in the absence of stimulation and increase the accessibility of inducible enhancers to the factors that direct the immunological recall response. Significantly, the chromatin of inducible enhancers linked to pDHSs in TM and TB is inaccessible in TN, and these elements therefore fail to respond efficiently to the same stimuli. In support of the idea of a facilitator role for pDHSs, we demonstrate a tight correlation between the preferential induction of genes in previously activated T cells and the close proximity of (i) pDHSs to iDHSs, and (ii) iDHSs to the TSSs of these inducible genes. Significantly, the presence or absence pDHSs has little impact on steady‐state transcription of nearby genes, in contrast to classical enhancers. Others have also recently observed that evidence of TF binding is a much more reliable guide to enhancer function than the mere presence of open chromatin or active histone modifications (Kwasnieski et al, 2014; Dogan et al, 2015). Given that just 11% of these modified regions tested had strong enhancer activity (Kwasnieski et al, 2014), it is evident that there is a growing need to define distinct classes of distal regulatory element.
Our data also provide a valuable resource defining all potential inducible enhancers in T cells, plus the factors required for their activation. The mechanisms driving inducible gene expression in activated T cells have been well defined at numerous individual loci, including the cytokine genes described above. This typically involves the induction of NFAT, AP‐1, and NF‐κB by TCR signaling pathways, which in turn mediate the induction of DHSs at promoters and enhancers, and the activation of mRNA expression. Here we show that one‐third of all iDHSs utilize composite NFAT/AP‐1 elements where NFAT and AP‐1 are known to bind cooperatively. We previously reported on such a mechanism for the CSF2 locus (Cockerill et al, 1995; Johnson et al, 2004), and in the current study, we defined the consensus sequence underpinning the cooperative binding of NFAT and AP‐1 for the full complement of iDHSs. Furthermore, our study provides a firm basis for why these enhancers at iDHSs are non‐functional in TN, even though TN efficiently express NFAT and AP‐1 upon activation, simply by virtue of their chromatin being inaccessible.
Intriguingly, pDHSs and iDHSs utilize essentially the same set of TFs, yet they behave in very different ways. We provide convincing global evidence that the difference in the ratios of constitutive to inducible TF motifs distinguishes these two classes of regulatory element and accounts for their properties. The low density of inducible TF motifs in pDHSs correlates with a requirement for extensive exposure to TCR signaling during blast cell transformation before the chromatin encompassing these elements is rendered accessible. However, once activated via such a hit‐and‐run mechanism, their high density of constitutive TF motifs allows them to remain accessible. Conversely, the high density of inducible TF motifs plus low density of constitutive TF motifs in iDHSs ensures their tight regulation whereby they are rapidly induced, but readily become reoccupied by nucleosomes once the stimulus is removed.
Previous studies have found that a subset of DHSs, and a subset of the TFs bound to these DHSs, can be maintained during mitosis (Martinez‐Balbas et al, 1995; Kadauke et al, 2012; Hsiung et al, 2015). These studies defined GATA‐1 as a mitotic bookmarking factor. However, these studies also found that the majority of mitotically preserved DHSs were localized at promoters, whereas the majority of the distal DHSs which include enhancers were erased. The fact that pDHSs are maintained during multiple rounds of cell division suggests that pDHSs may form a class of distal elements that can, unlike most enhancers, maintain accessible chromatin during mitosis. This is made more likely by the fact that pDHSs bind co‐localizing, constitutively expressed TFs such as RUNX1 and ETS‐1 which can bind in a concerted fashion to composite ETS/RUNX elements (Hollenhorst et al, 2009). In this context, it is interesting to note that all members of the RUNX transcription factor family have been shown to associate with mitotic chromatin (Young et al, 2007; Bakshi et al, 2008; Pande et al, 2009). Transcription factor complexes recruit chromatin modifiers and chromatin regions flanking pDHSs are marked by the active modifications H3K4me2 and H3K27ac, which can attract chromatin additional modifying complexes containing PHD domain or Bromo domains. We show here that pDHSs bind the co‐activator BRD4 whose binding is also maintained during mitosis (Zhao et al, 2011). We propose, therefore, that pDHSs contain stable transcription factor complexes that keep such elements nucleosome‐free during cell division, thus creating a looser and more dynamic chromatin structure which (i) allows the re‐assembly of the full complex after cell division and (ii) exposes more of the chromatin‐bound DNA to the inducible TFs searching for their binding sites.
Our current work also increases our understanding of the tightly regulated context‐dependent expression of key immunological regulators in differentiated T cells, such as Il4 in Th2 cells and Cxcr3 in Th1 cells. When first activated in uncommitted TN, both genes make use of a similar set of TFs to establish specific pDHSs and iDHSs. However, their pDHSs differ with respect to the additional GATA and T‐box motifs present, allowing them to exist in an accessible state ready to respond to alternate additional signals. In this way, unpolarized TB are able to respond to either GATA‐3 binding to the Th2 LCR GATA motifs, or TBX21 binding to T‐box motifs in the Cxcr3 −3‐kb pDHS, dependent upon which Th2 or Th1 differentiation‐inducing signals they subsequently encounter. We propose, therefore, that the acquisition of pDHSs represents a form of chromatin imprinting used universally across all classes of T cells when they are first activated, irrespective of whether they are CD4 or CD8 T cells, and independent of subsequent differentiation decisions. Others have also predicted a role for regions of chromatin marked by H3K4me2 in supporting gene activation in Th1 and Th2 cells (Seumois et al, 2014), but the mechanism by which such patterns were established was unclear. The mechanisms described here may also help to account for the origins of a class of preexisting DHSs which are present in activated T cells and recruit FOXP3 during the course of regulatory T‐cell differentiation (Samstein et al, 2012). Taken together, this body of evidence supports the emerging view that the critical steps in establishing immunological memory do indeed occur early during the initial stages of naïve T‐cell activation, and not during the subsequent differentiation stages when additional cell type‐specific TFs get recruited (Badovinac et al, 2005; Kedzierska et al, 2007; Russ et al, 2014; Crompton et al, 2015).
Last, but not least, our work explains previous studies demonstrating differences in the distribution of activating and repressive chromatin marks in TN and TM (Rothenberg & Zhang, 2012) and provides the likely regulatory mechanisms underlying these patterns. A recent study found that a lower level of DNA methylation in the TM was generally associated with a higher level of induction upon stimulation (Komori et al, 2015). There is also evidence linking loss of the repressive H3K27me3 modification with gene activation in effector T cells (Araki et al, 2009). However, not all inducible TM‐specific genes are marked by higher levels of H3K27me3 or DNA methylation in TN prior to TCR activation (Mirabella et al, 2010; Zediak et al, 2011). These modifications cannot, therefore, be solely responsible for the silent gene state in the naive T cells. Our study now suggests that there are at least two parallel modes of regulation controlling the establishment of the gene expression program in memory T cells: one involving the loss of H3K27me3 and gain of H3K4me3, primarily at promoters, and an additional one involving the de novo activation of a separate set of predominantly distal regulatory elements associated with H3K4me2. In the case of inducible genes, our data suggest that it is not primarily loss of repressive modifications in naïve cells that accounts for the memory recall effect in memory T cells. Rather, it is the intrinsic inaccessibility of inactive compact chromatin in TN and the gain of active modifications to increase accessibility in TB and TN that makes gene reactivation a much more efficient process. We present this here as a fundamental mechanism that has the potential to ensure the tight regulation of the immune system (Fig 9D), which is likely to play a major role in the acquisition of immunological memory in T cells and which places the accessibility of chromatin to the binding of transcriptional regulators into the heart of this process.
Materials and Methods
Detailed methods are available in the Supplementary Methods in the Appendix.
Mice
C42 transgenic mice containing a 130‐kb AgeI genomic DNA fragment of the human IL3/CSF2 locus on a C57BL/6J background were described previously (Mirabella et al, 2010). Studies involving these mice were approved by the ethically reviewed U.K. Home Office animal license PPL 40/3086.
Cell culture and purification
TN and TM were isolated and purified using MACS (Miltenyi) and Easy Sep (Stem Cell Technologies) purification kits (see Appendix Supplementary Methods). TB were generated from purified TN cultured at 5 × 10⁵ cells/ml in IMDM and activated with 2 μg/ml concanavalin A for 40 h. Cells were maintained at 5 × 10⁵ cells/ml in 50 U/ml IL‐2 (Peprotech) for an additional 2–3 days before harvesting. Cells were stimulated with 20 ng/ml phorbol myristate acetate (PMA) and 2 μM calcium ionophore (I) for up to 4 h.
DNase I‐hypersensitive site analysis
DNase I digestion assays were carried out as previously described (Bert et al, 2007). A more detailed protocol is available in the Appendix Supplementary Methods.
Chromatin immunoprecipitation
ChIP for the H3K4me2 and H3K27ac antibodies was carried out as previously described (Lichtinger et al, 2012). For all other antibodies, chromatin was prepared and immunoprecipitated as described in the Supplementary Methods in the Appendix.
mRNA expression analyses
Total RNA was extracted from cells using TRIzol (Invitrogen). RNA was either (i) reverse‐transcribed to cDNA using M‐MLV Reverse Transcriptase (Invitrogen) for analysis by quantitative PCR or (ii) prepared for microarray analysis (Supplementary Methods in the Appendix).
Library preparation
DNA libraries for sequencing were prepared from ~10 ng DNA from DNase I or ChIP samples. Libraries for DNase‐Seq of untreated CD4 and CD8 TN and TB were prepared for sequencing on the SOLiD™ platform according to the manufacturer's instructions (Applied Biosystems). All other libraries were prepared using the Tru‐Seq library preparation kit according to the manufacturer's instructions (Illumina).
Bioinformatics and data analysis
Detailed data analysis is provided in the Supplementary Methods in the Appendix.
Accession numbers
ChIP‐Seq, DNase‐Seq, and expression microarray datasets have been deposited on the Gene Expression Omnibus (GEO) as a super series under GEO accession number GSE67465. Individual datasets were deposited as follows: ChIP‐Seq under accession number GSE67443, DNase‐Seq under accession number GSE67451, and expression microarrays under accession number GSE67464.
Public datasets
H3K27me3 ChIP‐Seq datasets in naïve CD4 T cells [(Wei et al, 2009), GEO accession number GSM361998], naïve, effector, memory CD8 T cells [(Russ et al, 2014), SRA accession numbers SRX793474, SRX793485, respectively], Th2 cells [(Wei et al, 2009), GEO accession number GSM362002], as well as ENCODE Jurkat DNaseI‐Seq [(Thurman et al, 2012), GEO accession number GSM736501], and H3K27ac in naïve CD4 T cells [(Lara‐Astiaso et al, 2014), GEO accession number GSM1441281] were retrieved, aligned, and processed as described above and selected for viewing using the UCSC Genome Browser.
Author contributions
SLB, EB, RCJ, LNG, and PNC performed the laboratory studies, PC, JP, NL, and SO performed bioinformatics analyses, and SLB, PC, CB, and PNC designed the experiments and wrote the manuscript.
Conflict of interest
The authors declare that they have no conflict of interest.
Supporting information
Appendix
Expanded View Figures PDF
Dataset EV1
Dataset EV2
Dataset EV3
Dataset EV4
Dataset EV5
Review Process File
Acknowledgements
This work was supported by the BBSRC and Bloodwise. We thank Steve Kissane for help with DNA sequencing and micro‐array analyses, Maria Rosaria Imperato for help with mRNA analyses, Matthew MacKenzie for help with cell sorting, and Andrew Bert, Fabio Mirabella, Euan Baxter, Sally James, Aude‐Marine Bonavita, and Sarion Bowers for assistance with the large body of experimental work leading up to this study. We thank Peter Lane and David Withers for their valuable advice relating to the properties of memory T cells.
The EMBO Journal (2016) 35: 515–535
References
- Agarwal S, Rao A (1998) Modulation of chromatin structure regulates cytokine gene expression during T cell differentiation. Immunity 9: 765–775 [DOI] [PubMed] [Google Scholar]
- Araki Y, Fann M, Wersto R, Weng NP (2008) Histone acetylation facilitates rapid and robust memory CD8 T cell response through differential expression of effector molecules (eomesodermin and its targets: perforin and granzyme B). J Immunol 180: 8102–8108 [DOI] [PMC free article] [PubMed] [Google Scholar]
- Araki Y, Wang Z, Zang C, Wood WH III, Schones D, Cui K, Roh TY, Lhotsky B, Wersto RP, Peng W, Becker KG, Zhao K, Weng NP (2009) Genome‐wide analysis of histone methylation reveals chromatin state‐based regulation of gene transcription and function of memory CD8+ T cells. Immunity 30: 912–925 [DOI] [PMC free article] [PubMed] [Google Scholar]
- Badovinac VP, Messingham KA, Jabbari A, Haring JS, Harty JT (2005) Accelerated CD8+ T‐cell memory and prime‐boost response after dendritic‐cell vaccination. Nat Med 11: 748–756 [DOI] [PubMed] [Google Scholar]
- Bakshi R, Zaidi SK, Pande S, Hassan MQ, Young DW, Montecino M, Lian JB, van Wijnen AJ, Stein JL, Stein GS (2008) The leukemogenic t(8;21) fusion protein AML1‐ETO controls rRNA genes and associates with nucleolar‐organizing regions at mitotic chromosomes. J Cell Sci 121: 3981–3990 [DOI] [PMC free article] [PubMed] [Google Scholar]
- Baxter EW, Mirabella F, Bowers SR, James SR, Bonavita AM, Bertrand E, Strogantsev R, Hawwari A, Bert AG, Gonzalez de Arce A, West AG, Bonifer C, Cockerill PN (2012) The inducible tissue‐specific expression of the human IL‐3/GM‐CSF locus is controlled by a complex array of developmentally regulated enhancers. J Immunol 189: 4459–4469 [DOI] [PMC free article] [PubMed] [Google Scholar]
- Bert AG, Johnson BV, Baxter EW, Cockerill PN (2007) A modular enhancer is differentially regulated by GATA and NFAT elements that direct different tissue‐specific patterns of nucleosome positioning and inducible chromatin remodeling. Mol Cell Biol 27: 2870–2885 [DOI] [PMC free article] [PubMed] [Google Scholar]
- Brownlie RJ, Zamoyska R (2013) T cell receptor signalling networks: branched, diversified and bounded. Nat Rev Immunol 13: 257–269 [DOI] [PubMed] [Google Scholar]
- Chen L, Glover JN, Hogan PG, Rao A, Harrison SC (1998) Structure of the DNA‐binding domains from NFAT, Fos and Jun bound specifically to DNA. Nature 392: 42–48 [DOI] [PubMed] [Google Scholar]
- Cockerill PN, Bert AG, Jenkins F, Ryan GR, Shannon MF, Vadas MA (1995) Human GM‐CSF enhancer function is associated with cooperative interactions between AP‐1 and NFATp/c. Mol Cell Biol 15: 2071–2079 [DOI] [PMC free article] [PubMed] [Google Scholar]
- Cockerill PN, Bert AG, Roberts D, Vadas MA (1999) The human granulocyte‐macrophage colony‐stimulating factor gene is autonomously regulated in vivo by an inducible tissue‐specific enhancer. Proc Natl Acad Sci USA 96: 15097–15102 [DOI] [PMC free article] [PubMed] [Google Scholar]
- Cockerill PN (2004) Mechanisms of transcriptional regulation of the human IL‐3/GM‐CSF locus by inducible tissue‐specific promoters and enhancers. Crit Rev Immunol 24: 385–408 [DOI] [PubMed] [Google Scholar]
- Cockerill PN (2011) Structure and function of active chromatin and DNase I hypersensitive sites. FEBS J 278: 2182–2210 [DOI] [PubMed] [Google Scholar]
- Crompton JG, Narayanan M, Cuddapah S, Roychoudhuri R, Ji Y, Yang W, Patel SJ, Sukumar M, Palmer DC, Peng W, Wang E, Marincola FM, Klebanoff CA, Zhao K, Tsang JS, Gattinoni L, Restifo NP (2015) Lineage relationship of CD8 T cell subsets is revealed by progressive changes in the epigenetic landscape. Cell Mol Immunol doi: 10.1038/cmi.2015.032 [DOI] [PMC free article] [PubMed] [Google Scholar]
- Cunningham L, Finckbeiner S, Hyde RK, Southall N, Marugan J, Yedavalli VR, Dehdashti SJ, Reinhold WC, Alemu L, Zhao L, Yeh JR, Sood R, Pommier Y, Austin CP, Jeang KT, Zheng W, Liu P (2012) Identification of benzodiazepine Ro5‐3335 as an inhibitor of CBF leukemia through quantitative high throughput screen against RUNX1‐CBFbeta interaction. Proc Natl Acad Sci USA 109: 14592–14597 [DOI] [PMC free article] [PubMed] [Google Scholar]
- Dogan N, Wu W, Morrissey CS, Chen KB, Stonestrom A, Long M, Keller CA, Cheng Y, Jain D, Visel A, Pennacchio LA, Weiss MJ, Blobel GA, Hardison RC (2015) Occupancy by key transcription factors is a more accurate predictor of enhancer activity than histone modifications or chromatin accessibility. Epigenetics Chromatin 8: 16 [DOI] [PMC free article] [PubMed] [Google Scholar]
- Egawa T, Tillman RE, Naoe Y, Taniuchi I, Littman DR (2007) The role of the Runx transcription factors in thymocyte differentiation and in homeostasis of naive T cells. J Exp Med 204: 1945–1957 [DOI] [PMC free article] [PubMed] [Google Scholar]
- Fields PE, Lee GR, Kim ST, Bartsevich VV, Flavell RA (2004) Th2‐specific chromatin remodeling and enhancer activity in the Th2 cytokine locus control region. Immunity 21: 865–876 [DOI] [PubMed] [Google Scholar]
- Hashimoto S, Ogoshi K, Sasaki A, Abe J, Qu W, Nakatani Y, Ahsan B, Oshima K, Shand FH, Ametani A, Suzuki Y, Kaneko S, Wada T, Hattori M, Sugano S, Morishita S, Matsushima K (2013) Coordinated changes in DNA methylation in antigen‐specific memory CD4 T cells. J Immunol 190: 4076–4091 [DOI] [PMC free article] [PubMed] [Google Scholar]
- Hawwari A, Burrows J, Vadas MA, Cockerill PN (2002) The human IL‐3 locus is regulated cooperatively by two NFAT‐dependent enhancers that have distinct tissue‐specific activities. J Immunol 169: 1876–1886 [DOI] [PubMed] [Google Scholar]
- Heinz S, Romanoski CE, Benner C, Allison KA, Kaikkonen MU, Orozco LD, Glass CK (2013) Effect of natural genetic variation on enhancer selection and function. Nature 503: 487–492 [DOI] [PMC free article] [PubMed] [Google Scholar]
- Hogan PG, Chen L, Nardone J, Rao A (2003) Transcriptional regulation by calcium, calcineurin, and NFAT. Genes Dev 17: 2205–2232 [DOI] [PubMed] [Google Scholar]
- Hollenhorst PC, Chandler KJ, Poulsen RL, Johnson WE, Speck NA, Graves BJ (2009) DNA specificity determinants associate with distinct transcription factor functions. PLoS Genet 5: e1000778 [DOI] [PMC free article] [PubMed] [Google Scholar]
- Hsiung CC, Morrissey CS, Udugama M, Frank CL, Keller CA, Baek S, Giardine B, Crawford GE, Sung MH, Hardison RC, Blobel GA (2015) Genome accessibility is widely preserved and locally modulated during mitosis. Genome Res 25: 213–225 [DOI] [PMC free article] [PubMed] [Google Scholar]
- Johnson BV, Bert AG, Ryan GR, Condina A, Cockerill PN (2004) GM‐CSF enhancer activation requires cooperation between NFAT and AP‐1 elements and is associated with extensive nucleosome reorganization. Mol Cell Biol 24: 7914–7930 [DOI] [PMC free article] [PubMed] [Google Scholar]
- Jones EA, Flavell RA (2005) Distal enhancer elements transcribe intergenic RNA in the IL‐10 family gene cluster. J Immunol 175: 7437–7446 [DOI] [PubMed] [Google Scholar]
- Kadauke S, Udugama MI, Pawlicki JM, Achtman JC, Jain DP, Cheng Y, Hardison RC, Blobel GA (2012) Tissue‐specific mitotic bookmarking by hematopoietic transcription factor GATA1. Cell 150: 725–737 [DOI] [PMC free article] [PubMed] [Google Scholar]
- Kedzierska K, Stambas J, Jenkins MR, Keating R, Turner SJ, Doherty PC (2007) Location rather than CD62L phenotype is critical in the early establishment of influenza‐specific CD8+ T cell memory. Proc Natl Acad Sci USA 104: 9782–9787 [DOI] [PMC free article] [PubMed] [Google Scholar]
- Komori HK, Hart T, LaMere SA, Chew PV, Salomon DR (2015) Defining CD4 T cell memory by the epigenetic landscape of CpG DNA methylation. J Immunol 194: 1565–1579 [DOI] [PMC free article] [PubMed] [Google Scholar]
- Kwasnieski JC, Fiore C, Chaudhari HG, Cohen BA (2014) High‐throughput functional testing of ENCODE segmentation predictions. Genome Res 24: 1595–1602 [DOI] [PMC free article] [PubMed] [Google Scholar]
- Lara‐Astiaso D, Weiner A, Lorenzo‐Vivas E, Zaretsky I, Jaitin DA, David E, Keren‐Shaul H, Mildner A, Winter D, Jung S, Friedman N, Amit I (2014) Immunogenetics. Chromatin state dynamics during blood formation. Science 345: 943–949 [DOI] [PMC free article] [PubMed] [Google Scholar]
- Lee GR, Fields PE, Flavell RA (2001) Regulation of IL‐4 gene expression by distal regulatory elements and GATA‐3 at the chromatin level. Immunity 14: 447–459 [DOI] [PubMed] [Google Scholar]
- Lee GR, Spilianakis CG, Flavell RA (2005) Hypersensitive site 7 of the TH2 locus control region is essential for expressing TH2 cytokine genes and for long‐range intrachromosomal interactions. Nat Immunol 6: 42–48 [DOI] [PubMed] [Google Scholar]
- Lichtinger M, Ingram R, Hannah R, Muller D, Clarke D, Assi SA, Lie ALM, Noailles L, Vijayabaskar MS, Wu M, Tenen DG, Westhead DR, Kouskoff V, Lacaud G, Gottgens B, Bonifer C (2012) RUNX1 reshapes the epigenetic landscape at the onset of haematopoiesis. EMBO J 31: 4318–4333 [DOI] [PMC free article] [PubMed] [Google Scholar]
- Martinez‐Balbas MA, Dey A, Rabindran SK, Ozato K, Wu C (1995) Displacement of sequence‐specific transcription factors from mitotic chromatin. Cell 83: 29–38 [DOI] [PubMed] [Google Scholar]
- Mirabella F, Baxter EW, Boissinot M, James SR, Cockerill PN (2010) The human IL‐3/granulocyte‐macrophage colony‐stimulating factor locus is epigenetically silent in immature thymocytes and is progressively activated during T cell development. J Immunol 184: 3043–3054 [DOI] [PubMed] [Google Scholar]
- Muthusamy N, Barton K, Leiden JM (1995) Defective activation and survival of T cells lacking the Ets‐1 transcription factor. Nature 377: 639–642 [DOI] [PubMed] [Google Scholar]
- Nakayama T, Yamashita M (2009) Critical role of the Polycomb and Trithorax complexes in the maintenance of CD4 T cell memory. Semin Immunol 21: 78–83 [DOI] [PubMed] [Google Scholar]
- Pande S, Ali SA, Dowdy C, Zaidi SK, Ito K, Ito Y, Montecino MA, Lian JB, Stein JL, van Wijnen AJ, Stein GS (2009) Subnuclear targeting of the Runx3 tumor suppressor and its epigenetic association with mitotic chromosomes. J Cell Physiol 218: 473–479 [DOI] [PMC free article] [PubMed] [Google Scholar]
- Piper J, Elze MC, Cauchy P, Cockerill PN, Bonifer C, Ott S (2013) Wellington: a novel method for the accurate identification of digital genomic footprints from DNase‐seq data. Nucleic Acids Res 41: e201 [DOI] [PMC free article] [PubMed] [Google Scholar]
- Rivera CM, Ren B (2013) Mapping human epigenomes. Cell 155: 39–55 [DOI] [PMC free article] [PubMed] [Google Scholar]
- Rogers PR, Dubey C, Swain SL (2000) Qualitative changes accompany memory T cell generation: faster, more effective responses at lower doses of antigen. J Immunol 164: 2338–2346 [DOI] [PubMed] [Google Scholar]
- Rothenberg EV, Zhang JA (2012) T‐cell identity and epigenetic memory. Curr Top Microbiol Immunol 356: 117–143 [DOI] [PMC free article] [PubMed] [Google Scholar]
- Russ BE, Olshanksy M, Smallwood HS, Li J, Denton AE, Prier JE, Stock AT, Croom HA, Cullen JG, Nguyen ML, Rowe S, Olson MR, Finkelstein DB, Kelso A, Thomas PG, Speed TP, Rao S, Turner SJ (2014) Distinct epigenetic signatures delineate transcriptional programs during virus‐specific CD8(+) T cell differentiation. Immunity 41: 853–865 [DOI] [PMC free article] [PubMed] [Google Scholar]
- Samstein RM, Arvey A, Josefowicz SZ, Peng X, Reynolds A, Sandstrom R, Neph S, Sabo P, Kim JM, Liao W, Li MO, Leslie C, Stamatoyannopoulos JA, Rudensky AY (2012) Foxp3 exploits a pre‐existent enhancer landscape for regulatory T cell lineage specification. Cell 151: 153–166 [DOI] [PMC free article] [PubMed] [Google Scholar]
- Seumois G, Chavez L, Gerasimova A, Lienhard M, Omran N, Kalinke L, Vedanayagam M, Ganesan AP, Chawla A, Djukanovic R, Ansel KM, Peters B, Rao A, Vijayanand P (2014) Epigenomic analysis of primary human T cells reveals enhancers associated with TH2 memory cell differentiation and asthma susceptibility. Nat Immunol 15: 777–788 [DOI] [PMC free article] [PubMed] [Google Scholar]
- Sprent J, Surh CD (2002) T cell memory. Annu Rev Immunol 20: 551–579 [DOI] [PubMed] [Google Scholar]
- Telfer JC, Rothenberg EV (2001) Expression and function of a stem cell promoter for the murine CBFalpha2 gene: distinct roles and regulation in natural killer and T cell development. Dev Biol 229: 363–382 [DOI] [PubMed] [Google Scholar]
- Thurman RE, Rynes E, Humbert R, Vierstra J, Maurano MT, Haugen E, Sheffield NC, Stergachis AB, Wang H, Vernot B, Garg K, John S, Sandstrom R, Bates D, Boatman L, Canfield TK, Diegel M, Dunn D, Ebersol AK, Frum T et al (2012) The accessible chromatin landscape of the human genome. Nature 489: 75–82 [DOI] [PMC free article] [PubMed] [Google Scholar]
- Wei G, Wei L, Zhu J, Zang C, Hu‐Li J, Yao Z, Cui K, Kanno Y, Roh TY, Watford WT, Schones DE, Peng W, Sun HW, Paul WE, O'Shea JJ, Zhao K (2009) Global mapping of H3K4me3 and H3K27me3 reveals specificity and plasticity in lineage fate determination of differentiating CD4+ T cells. Immunity 30: 155–167 [DOI] [PMC free article] [PubMed] [Google Scholar]
- Yamashita M, Shinnakasu R, Nigo Y, Kimura M, Hasegawa A, Taniguchi M, Nakayama T (2004) Interleukin (IL)‐4‐independent maintenance of histone modification of the IL‐4 gene loci in memory Th2 cells. J Biol Chem 279: 39454–39464 [DOI] [PubMed] [Google Scholar]
- Young DW, Hassan MQ, Pratap J, Galindo M, Zaidi SK, Lee SH, Yang X, Xie R, Javed A, Underwood JM, Furcinitti P, Imbalzano AN, Penman S, Nickerson JA, Montecino MA, Lian JB, Stein JL, van Wijnen AJ, Stein GS (2007) Mitotic occupancy and lineage‐specific transcriptional control of rRNA genes by Runx2. Nature 445: 442–446 [DOI] [PubMed] [Google Scholar]
- Zediak VP, Johnnidis JB, Wherry EJ, Berger SL (2011) Cutting edge: persistently open chromatin at effector gene loci in resting memory CD8+ T cells independent of transcriptional status. J Immunol 186: 2705–2709 [DOI] [PMC free article] [PubMed] [Google Scholar]
- Zhao K, Wang W, Rando OJ, Xue Y, Swiderek K, Kuo A, Crabtree GR (1998) Rapid and phosphoinositol‐dependent binding of the SWI/SNF‐like BAF complex to chromatin after T lymphocyte receptor signaling. Cell 95: 625–636 [DOI] [PubMed] [Google Scholar]
- Zhao R, Nakamura T, Fu Y, Lazar Z, Spector DL (2011) Gene bookmarking accelerates the kinetics of post‐mitotic transcriptional re‐activation. Nat Cell Biol 13: 1295–1304 [DOI] [PMC free article] [PubMed] [Google Scholar]
Associated Data
This section collects any data citations, data availability statements, or supplementary materials included in this article.
Supplementary Materials
Appendix
Expanded View Figures PDF
Dataset EV1
Dataset EV2
Dataset EV3
Dataset EV4
Dataset EV5
Review Process File