Abstract
High resolution (11.7T) cardiac magnetic resonance imaging (MRI) and histological approaches have been employed in tandem to characterize the secondary damage suffered by the murine myocardium following the initial insult caused by ischemia-reperfusion (IR). IR induced changes in the myocardium were examined in five separate groups at the following time-points after IR: 1h, 1d, 3d, 7d and 14 d. Infarct volume increased from 1h to 1d post-IR. Over time, loss of myocardial function was observed to be associated with increased infarct volume and worsened regional wall motion. In the infarct region, IR caused a decrease in end-systolic thickness coupled with small changes in end-diastolic thickness, leading to massive wall thickening abnormalities. In addition, compromised wall thickening was also observed in left ventricular regions adjacent to the infarct region. A tight correlation (r2 = 0.86) between measured MRI and triphenyltetrazolium chloride (TTC) infarct volumes was noted. Our observation that until day 3 post-IR, the infarct size as measured by TTC staining and MRI were much larger than the myocyte-silent regions in trichrome or H&E stained sections is consistent with the literature and leads to the conclusion that at such early phase the infarct site contains structurally intact myocytes that are functionally compromised. Over time, such affected myocytes were noted to structurally disappear resulting in consistent infarct sizes obtained from MRI, TTC as well as trichrome and hematoxylin/eosin analyses on day 7 following IR. Myocardial remodeling following IR includes secondary myocyte death followed by loss of cardiac function over time.
Introduction
Acute myocardial damage caused by a surge in reactive oxygen species following ischemia-reperfusion (IR) has been demonstrated and extensively studied (25, 26, 39). The secondary loss of myocytes subsequent to the initial insult is a progressive phase reported by numerous laboratories (2, 3, 12, 15, 18, 31, 32), and remains poorly understood. In addition, the functional significance of this secondary death process remains to be characterized.
The current state of magnetic resonance imaging (MRI) represents a versatile non-invasive tool for measuring cardiac function and structure (7, 8, 24, 28, 34, 37). Cardiac MRI has been applied to study ischemia reperfusion (IR) injury (8-11, 23, 24, 35-37), left ventricular (LV) remodeling (13) and myocardial metabolism (5, 19, 33) in canine as well as rodent models. Contrast enhanced MRI monitors infarct damage after myocardial infarction (9, 10, 21, 30, 34). Because these observations are obtained from rodent as well as canine models it is important to recognize that the rodent and canine models do have some contrasting features primarily because of a higher abundance of collateral circulation in dogs. Unlike in rodents where complete ischemia is achieved, most dog models represent an uncontrolled mixture of incomplete and complete ischemia, which gives rise to a delay in cell death in those areas that were never totally ischemic. Murine MRI has been hampered by the lack of widespread availability of high resolution scanners that provide requisite spatial and temporal resolution. The high (400-600 beats per min) heart rate of the anesthetized mouse coupled with limited dimensions (5 mm in diameter, 8 mm in length) of the heart pose significant challenges for routine high resolution cardiac MRI. The ability to non-invasively and accurately perform repeated examination of cardiac parameters without operator bias over a period of time after a myocardial insult is a major advantage of MRI over other techniques including echocardiography, hemodynamic measurement techniques and histology. In this study, we have simultaneously employed histological analyses and 11.7 Tesla high resolution cardiac MRI (2-3 time-points per mouse) to study LV function, structure and infarct volume in mice after IR injury.
Materials and Methods
Animal and experimental protocol
All animal procedures were approved by the Institutional Laboratory Animal Care and Use Committee of the Ohio State University. Thirty-one young adult (10–12 wk of age) male C57BL/6 mice (Harlan Technologies, IN) were used in this study. Vast majority (94%) of the animals survived the study protocol. Baseline magnetic resonance (MR) images were obtained 5-7 days before surgery to ensure normalization of all cardiovascular parameters. Mice were divided into 5 groups (n=4-9) and were euthanized for harvesting heart tissue accordingly. Mice were euthanized either at 1h, 1d, 3d, 7d or 14d post reperfusion, immediately after MR imaging.
Survival surgery for myocardial ischemia-reperfusion
Mice were anesthetized, held on a warm tray (37°C), and intubated endotracheally. The mice were ventilated on air-isoflurane at an appropriate rate and tidal volume. Cardiac electrophysiology was monitored throughout the surgery using a standard three-lead ECG setup, and changes were recorded using PC Powerlab software (AD Instruments). The heart was accessed via left thoracotomy. The left lung was retracted to allow entrance to the pericardium. The left auricle was elevated to expose the coronary left anterior descending artery, which was isolated using 7-0 silk suture on a taper needle. The suture was tightened over a piece of PE-10 tubing to provide for reversible ischemia via occlusion of the coronary artery. Ischemia, documented by laser- Doppler blood flow measurement, continued for 60 min after occlusion. After 60 min, the suture was released to allow for reperfusion of the injured myocardium. On successful reperfusion, the thorax was closed with interrupted sutures, and the skin incision was closed with surgical clips. A catheter was used to aspirate the left thorax to reestablish the negative thoracic pressure and facilitate lung re-expansion (17, 27).
Histological determination of infarct size
Mice were killed and hearts were excised and encased in 2% agarose solution. After settling the agarose for 2 minutes, the heart was laterally cut just below the left auricle and 1 mm thick sections were made. The agarose was removed and sections were incubated with 2% 2,3,5-triphenyltetrazolium chloride (TTC) at 37°C for 20 min, with rotation every 2 min to allow uniform tissue staining. Each slice was photographed with a digital camera mounted on a dissecting microscope. Following photography, the sections were fixed in 10% buffered formalin solution for 2 weeks after which they were processed for hematoxylin-eosin (H&E) staining. ImageJ software (NIH) was used for planimetry of the LV border and infarct region on TTC images. Infarct volume was calculated as a percentage of total left ventricular volume (including septum). Exact correlation between TTC and MRI slice was not always possible because of slice thickness mismatch and partial voluming effects. Masson’s trichrome and H & E staining were done on same heart sections used for TTC staining. Standard paraffin embedding and tissue processing protocols were used. Sections of 5 μm thickness obtained from each 1 mm thick slice were mounted on glass slides and stained with H&E and standard Masson’s trichrome staining protocol. The stained sections were photographed using a digital camera (model D30, Hitachi) mounted on a microscope (Axiovert 200M, Zeiss). Manual planimetry was performed on the microscope using PALM RoboSoftware v 2.2 to calculate infarct volume using H&E stained slices. Myocyte-silent space in H&E sections were interpreted as infarct area in this study.
MR image acquisition
In the animal preparation for MRI, mice were anesthetized with 1.5% isoflurane mixed with 1.5 L/min carbogen. Subdermal ECG leads were fixed on right forelimb and right leg of animal. A respiratory sensor placed under the abdomen and secured to the animal. Gd-DTPA-BMA contrast agent (Omniscan) was injected intraperitoneally at a dose of 0.6-0.9 mmol/kg of body weight just before placing the animal in the magnet. Core body temperature was maintained at 37.0 ± 0.5 using circulating warm air. Core body temperature, respiration and ECG were monitored with SAII Model 1025 monitoring and gating system (Small Animal Instruments Inc., Stony Brook, NY, USA). The MRI protocol included: 1) localizer FLASH scans, 2) short-axis cine loops (6-8 slices), and 3) Contrast-enhanced infarct imaging (6-8 slices). MR imaging was performed on a Bruker 11.7 T vertical MR scanner with maximum gradient strength of 1000 mT/m. A 30 mm birdcage RF coil was used. Shim currents were initialized to previously saved values from earlier imaging experiments, and then automatic shimming was done. Proton linewidth of less than 600 Hz (1.2 ppm) was routinely obtained in less than 30s, and yielded good SNR on the MR images. After localizer scans were completed, an ECG-triggered 2D FLASH pulse sequence was used to generate cine loops of cardiac motion. For baseline images, a flip angle of 20° was used as it generated good contrast between blood and myocardium at heart rates from 375-500 beats per minute (R-R interval from 160 ms to 120 ms). Flip angle was increased to 60° (to increase T1 weighting) for post-contrast images in an attempt to obtain contrast-enhanced images concurrently with cine images (38). Sixteen frames were obtained in each cardiac cycle that led to a TR between 7.5 and 10 ms. TE was kept constant at 1.43 ms. Spatial resolution of 117 micron in-plane (slice thickness 1 mm, FOV 3 cm × 3 cm, matrix size 256 × 192) was obtained. To obtain contrast enhanced images, an ECG-triggered inversion recovery (IR) sequence with TI 150-200 ms was used. Double inversion preparation pulses were used as required to null blood signal and improve image quality. This sequence was used to obtain six to eight 1 mm thick sections at 117 micron in-plane resolution. Contrast enhanced images were acquired 30-45 minutes post contrast administration to accurately measure infarct volume (21, 34). Contrast enhanced images from cine loops were later correlated with inversion recovery images to provide additional frames of reference for measurement of infarct area. The full imaging protocol was completed within 1h after anesthetizing the animal.
Determination of cardiac functional parameters
MR images were converted to DICOM format using Paravision 4.0 and processed with ImageJ software. After the end-diastolic and end-systolic phases were identified on a slice-by-slice basis, the endocardial and epicardial borders were traced and LV end-systolic volume (LVESV), LV end-diastolic volume (LVEDV), LV stroke volume (LVSV), cardiac output (CO) and LV ejection fraction (LVEF) were computed from the traced borders (24). LV mass was calculated by multiplying LV myocardial volume with density (34).
Determination of infarct volume
Contrast enhanced MR images in DICOM format were processed in ImageJ. Appropriate contrast enhancement of the images was done to maximize signal from hyperintense region and null signal from non-enhanced region. Manual planimetry was performed on images obtained from inversion recovery imaging sequence. To help exclude artifacts during planimetry, contrast-enhanced images obtained with FLASH cine sequence were examined as required to provide an additional reference. For each slice, hyperenhanced region and total LV myocardial area was calculated. Slice hyperintense areas were then summated to generate infarct volume as a percentage of LV myocardial volume.
Determination of LV wall thickening
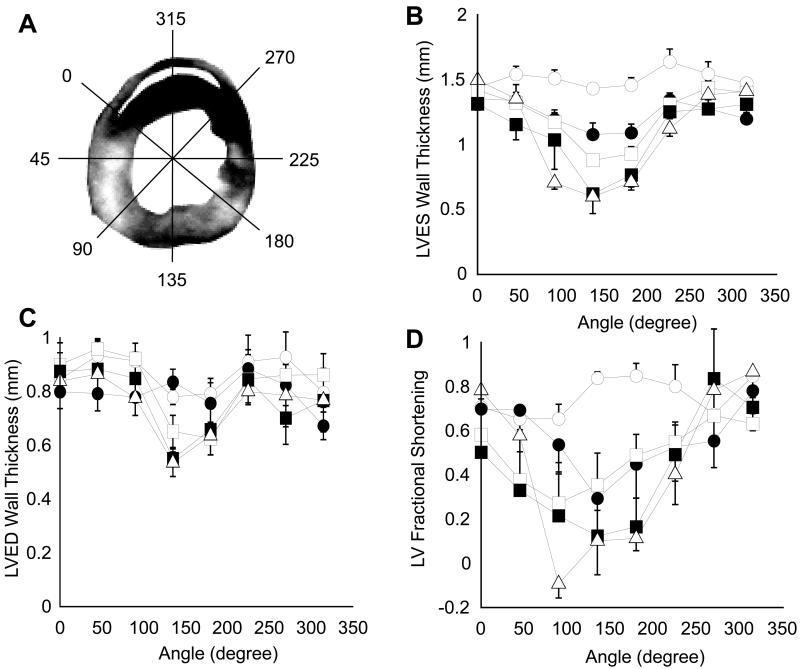
A slice from the mid-ventricular section of the heart 4.2 mm from apex was chosen for the analysis of segmental wall thickness to determine abnormalities in LV wall motion compared to control group. Typically, this slice had both infarcted and non-infarcted regions. Wall thickness analysis was conducted employing software developed in our lab using Matlab®. After contouring epicardial and endocardial borders in end systole and end diastole, LV wall thickness was calculated at each 2° angular distance from the center of LV. Papillary muscles were not included in the wall thickening analysis. Twenty two contiguous wall thickness measurements were averaged to segment the LV into 8 equiangular sectors of 45° each (Fig. 8A). Averaged wall thickness was indexed to right ventricular insertion point in the anterior wall and was plotted against the corresponding angle at each time point after IR injury. Fractional Shortening (FS) was calculated as:
Figure 8. Segmental LV wall thickening analysis before and after IR.
(A) LV wall was segmented into 8 equiangular 45° sectors using custom written software in Matlab. Wall thickness was calculated radially at 2° increments and was averaged for each sector. Thickness data was indexed to right ventricular insertion point in the anterior wall. (B) and (C), Segmental LV wall thickness at ES and ED, respectively. (D) FS of LV wall in one cardiac cycle. Baseline data is represented by open circles, 1d by filled circles, 3d by open squares, 7d by filled squares and 14d by open triangles (n=4 in each group).
Statistical analysis
Planimetry and the analysis of segmental LV wall thickness were performed by a trained investigator blinded to the study groups. All values are reported as mean ± SD. Paired and unpaired 2-tailed Student’s t-test were used where appropriate. One-way ANOVA followed by Tukey pair-wise comparisons test was used to compare parameters between different groups. A value of p<0.05 was considered statistically significant.
Results
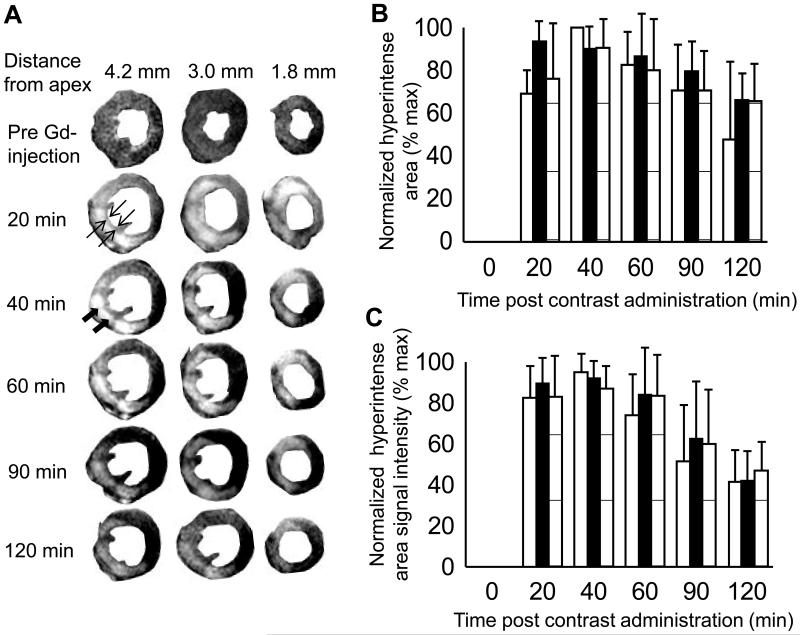
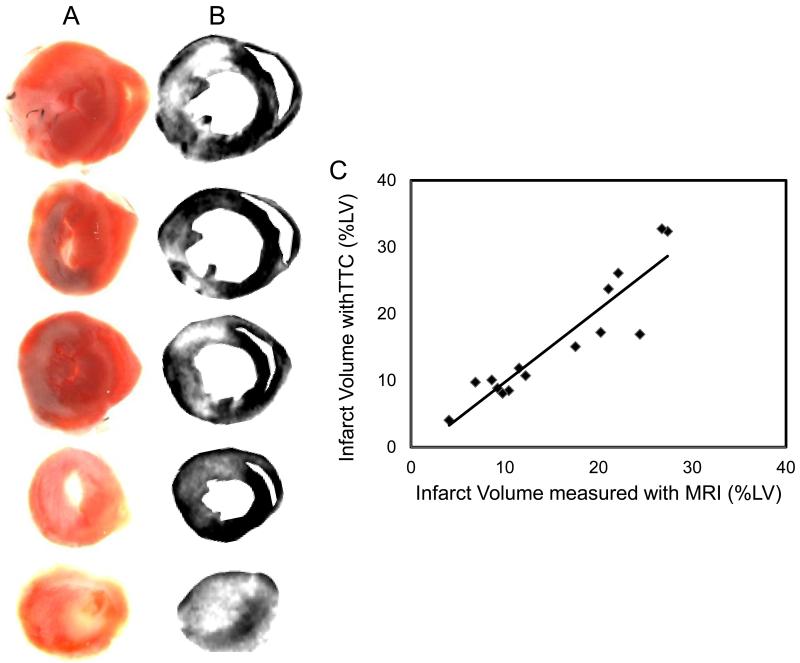
ECG recordings during surgery were helpful in objectively discriminating between successful and failed LAD occlusions (Fig. S1). All mice that developed myocardial infarction, as proven later by MRI and histology, exhibited a strikingly pathologic, infarct-typical ECG pattern during and after surgical procedure. The pathological ECG pattern was observed for the complete duration of the study. Early manifestations of infarction included reduced R wave amplitude, marked ST segment elevation and development of a large Q wave (Fig S1). The MRI protocol used in the current study involved intraperitoneal administration of a contrast agent outside the MR scanner. Time course of hyper enhancement of LV was followed to obtain a time window where MRI reflected true infarct size as later confirmed with TTC staining. Earliest contrast-enhanced images were obtained 20 min following contrast administration. A thin layer of viable tissue was observed between blood and a region of hyper intense myocardium, which allowed for easy delineation of infarct region (arrows in Fig 1A). In a mouse subjected to serial analysis over the first two hours after contrast injection, infarct size measured with MRI remained constant from 20-60 min post contrast injection (Fig 1B), thus providing a wide window of time for acquiring MR images. In some regions of the heart, hyper intensity was noted even up to 2h after contrast injection. Sections of the myocardial tissue were stained with TTC after MRI (Figs 2A&B). Infarct volumes calculated from MRI obtained 30-45 min after contrast administration and TTC were plotted against each other (Fig 2C). A tight correlation (r2 = 0.86, slope = 1.07 and intercept = −0.87) between measured MRI and TTC infarct volumes was noted. The correlation was especially strong in infarcts smaller than 20% of LV.
Figure 1. Time course of signal enhancement in heart after contrast agent administration.
Contrast agent Gd-DTPA-BMA was injected IP (0.6-0.9 mM/kg body weight) in a mouse 3 days after 60 minute transient LAD occlusion surgery. The mouse was then immediately placed into the MRI and data acquisition was started. Contrast enhanced images were acquired with an inversion recovery pulse sequence with TI 150-200 ms. (A)Time course of signal enhancement in three heart slices is shown with contrast enhanced regions indicating myocardial tissue damage. MR images were segmented with Photoshop for better display of left ventricle. Solid arrows indicate region of hyperintensity which was interpreted as infarct. Open arrows indicate a thin layer of viable tissue between the infarct region and LV lumen, which aided in infarct segmentation and planimetry. (B) Hyper intense area on each image remains constant from 40-60 minutes post contrast administration. MR slices in left column of A are represented by open bars, middle column by solid bars, and right column by striped bars. (C) Signal Intensity of hyper intense region was normalized to maximum level of each slice. Peak signal intensity was observed 40 minutes after contrast agent administration. Thus, all contrast enhanced images in this study were acquired 30-45 minutes after contrast agent administration.
Figure 2. Contrast-enhanced mouse heart MR images compared with corresponding tissue slices photographed post-mortem.
(A) MR images were obtained 3 days after 60 minute occlusion of LAD coronary artery and 40 minutes after injection of Gd-DTPA-BMA contrast agent. (B) Color images obtained by digital photography of corresponding tissue sections stained with TTC. (C) Good correlation (r2 = 0.85) was found between spatial location and extent of myocardial damage delineated by enhanced regions (white) in MR images and necrotic regions (white) not stained red by TTC. Best-fit linear trendline is drawn through the individual data points.
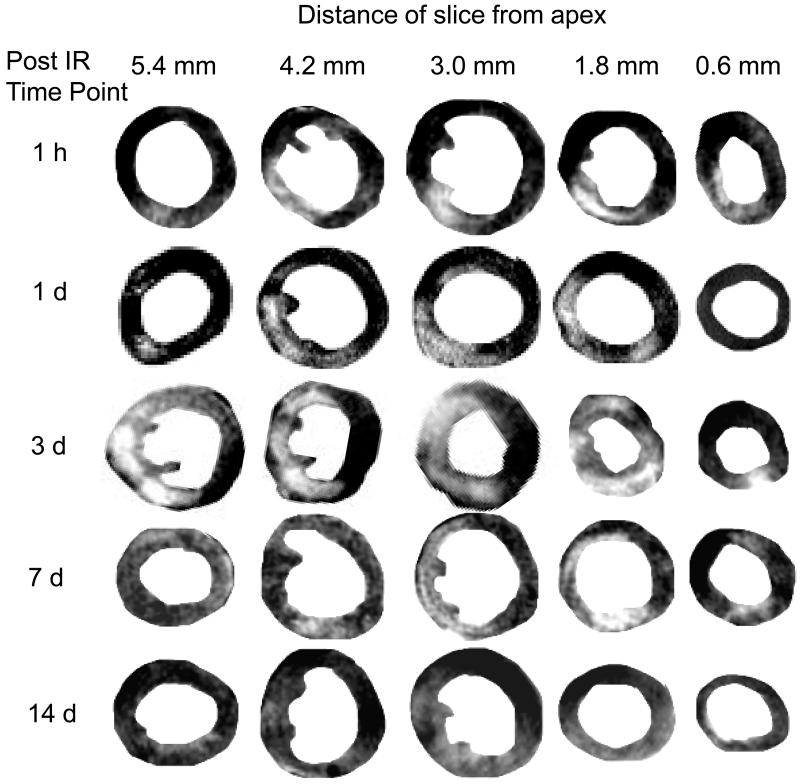
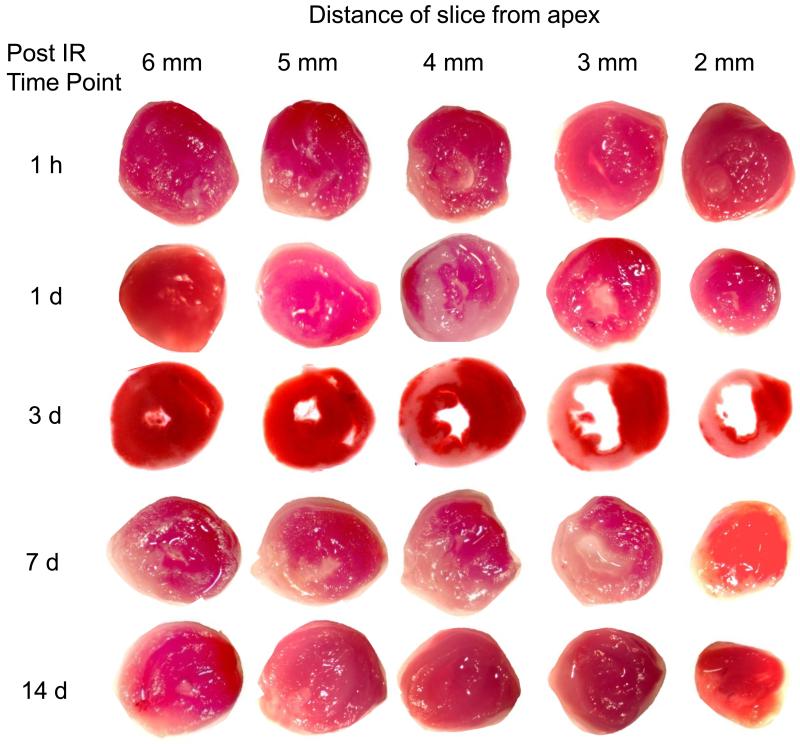
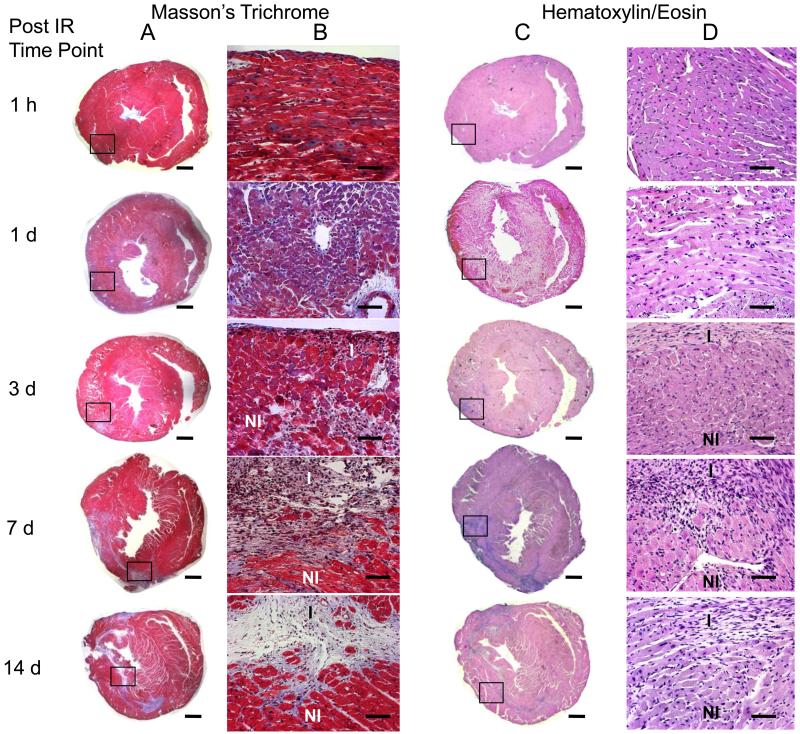
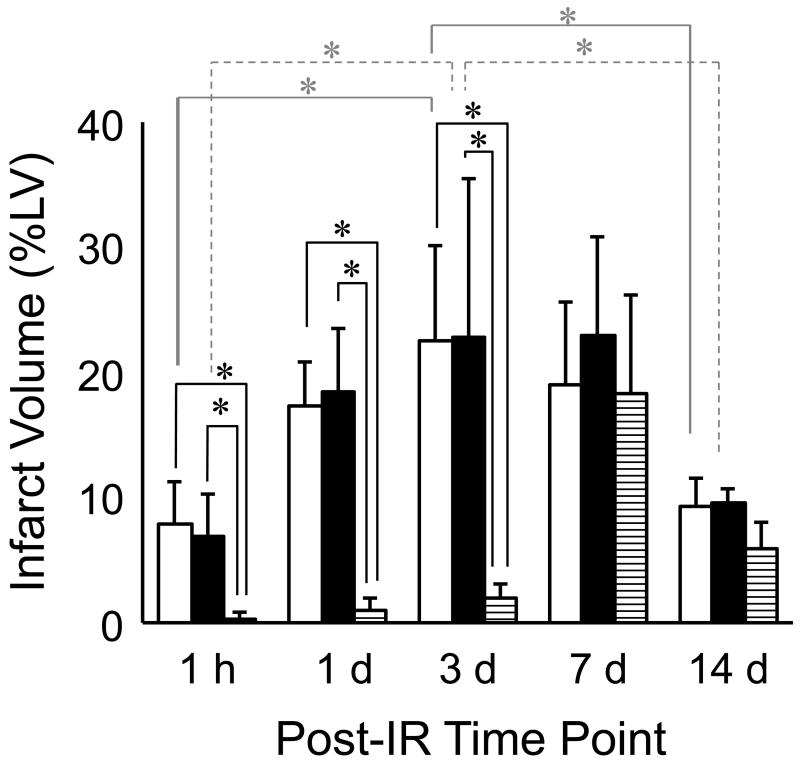
Time-dependent changes in IR induced myocardial infarction were examined in mice with MRI over 14 days after surgery (Fig 3). Separate groups of mice were imaged at five time-points after IR: 1h, 1d, 3d, 7d and 14d. Infarct volumes at each time point were calculated as described in Materials and Methods. Maximum infarct size was observed in the group assessed 3d after IR surgery, and infarct size in this group was significantly larger than that in the 1h group and the group assessed at 14d post IR. TTC staining on heart sections was performed immediately after MRI (Fig 4). Infarct sizes measured with TTC closely matched that measured with MRI. Both data sets consistently demonstrated infarction until 7d after IR. Of note, H&E staining of tissue revealed very little structural loss of myocytes at 1h (0.3% LV), 1d (1.03%) and 3d (2% LV) following IR. Infarct size measured by H&E staining on the same heart sections on which MRI and TTC staining were done increased to a maximum at day 7 following IR (Figs 5&6). Infarct volume over time measured with the three different techniques is plotted in Figure 6. An apparent disagreement among the techniques was observed at acute time points of 1h, 1d and 3d after IR injury.
Figure 3. MRI assessment of infarct size at different time-points post-IR.
Five groups of mice were imaged at 5 time points after 60 minute transient LAD occlusion and reperfusion. MRI protocol was as described in the text. Five sequential tissue slices from each animal are shown, where slice thickness is 1 mm and distance of center of slice from apex is given. Infarct volume was calculated with planimetry at each time point. Maximal infarct damage was observed 3 days after surgery (n=5 in 1h group, n=6 in 1d group, n=9 in 3d group, n=7 in 7d group and n=4 in 14d group).
Figure 4.
TTC assessment of infarct size at different time-points post IR. Myocardial TTC staining was performed on animals immediately after MRI experiment was completed on each of the five time points. 1 mm thick heart slices were incubated with 2% TTC for 20 minutes at 37°C and digitally photographed. Infarct volume was calculated from TTC images with manual delineation of necrotic region (white) using digital planimetry (n = 15).
Figure 5.
Histological assessment of infarct size at different time-points post IR. Tissue sections were obtained from formalin fixed heart slices that had been used for TTC staining. H/E and Masson’s trichrome staining was done on four representative sections obtained from each 1 mm tissue slice. Infarct on H/E stained sections was defined as regions without myocytes and rich with atypical nuclei. Collagen accumulation in the five groups of mice was assessed by the blue color on Masson’s trichrome staining. Infarct volume was calculated by manual delineation of infarct region on H/E stained sections using a digital camera mounted on a microscope. Images shown here represent heart sections from 4 mm above the apex. Images shown in column A and C were taken at 1.25× magnification (scale bar = 1 mm). Columns B and D show magnified view at 20× magnification of boxed region (scale bar = 50 μm). Maximum loss of myocytes and collagen accumulation were observed at 7 days after IR injury (n = 4 at each time point).
Figure 6.
Infarct volume as measured by 3 different techniques at different time-points post IR. Infarct volume was calculated using MRI (open bars), TTC (solid bars) and H&E histology (striped bars) using digital planimetry at 1 h, 1 d, 3 d, 7 d and 14 d after IR surgery. Infarct volume was calculated as a percentage of left ventricular myocardial volume. MRI and TTC data were closely associated with each other at all time points, but not with histologically defined infarct volume. A statistically significant change in TTC and MRI infarct volume was observed between time points 1h and 3d, and between 3d and 14d post IR (n=4 in each group at each time point).
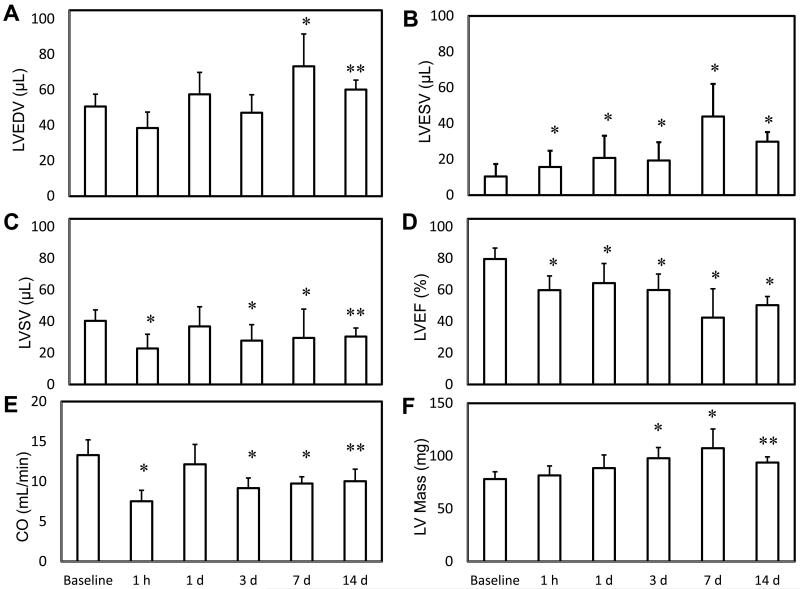
IR insult caused a statistically significant worsening of all global LV functional parameters (Fig 7). There was a significant increase in EDV between baseline and day 7, and a significant increase in ESV between baseline and day 1. This resulted in significant decreases in SV, CO and EF at every time point relative to baseline. The worst cardiac function was measured at day 7 where IR caused a 46% increase in EDV, 340% increase in ESV, 25% decrease in SV, 32% decrease in CO, 47% decrease in EF and 38% increase in LV mass. The analysis of regional wall thickening indicated a trend towards worsening wall motion in the groups assessed at later time points after IR (Fig 8). Statistically significant differences in LV wall thickness were observed across the infarct zone and adjacent regions at ES and ED, which led to severe differences in FS during the cardiac cycle. A small improvement in FS was observed in remote LV regions 180° away from the infarct zone. The differences in wall thickening that reached statistical significance are indicated in Table 1. LV ES thickness, ED thickness and FS were compared at the following five time points: baseline, 1d, 3d, 7d and 14d following IR. For each myocardial sector, these wall motion parameters were serially compared to a different group of mice assessed at the previous time point. Such analysis revealed significantly worsened wall motion post IR in several myocardial segments. This observation is consistent with the noted loss of cardiac function following IR over time.
Figure 7.
MRI analysis of cardiac function after IR injury. Global parameters of LV volume and function were measured with MRI in five groups at different time points post IR. IR caused a significant increase in LV End Diastolic Volume (A) and LV End Systolic Volume (B), while causing a significant decrease in LV Stoke Volume (C), Cardiac Output (D) and LV Ejection Fraction (E). A significant increase in LV myocardial mass was also observed after IR. * indicates p<0.01 and ** indicates p<0.05 compared to baseline values (n = 9 in baseline group, n=5 in 1h group, n=6 in 1d group, n=9 in 3d group, n=7 in 7d group and n=4 in 14d group).
Table 1. Statistical analysis of wall motion abnormalities.
| angle (degree) | ||||||||
|---|---|---|---|---|---|---|---|---|
|
|
||||||||
| ES | 0 | 45 | 90 | 135 | 180 | 225 | 270 | 315 |
| 1 d vs baseline | * | * | * | * | ||||
| 3 d vs 1 d | * | * | * | |||||
| 7 d vs 3 d | * | * | ||||||
| 14 d vs 7 d | * | * | ||||||
| ED | 0 | 45 | 90 | 135 | 180 | 225 | 270 | 315 |
| 1 d vs baseline | * | * | * | * | ||||
| 3 d vs 1 d | * | * | ||||||
| 7 d vs 3 d | * | |||||||
| 14 d vs 7 d | * | * | ||||||
| FS | 0 | 45 | 90 | 135 | 180 | 225 | 270 | 315 |
| 1 d vs baseline | * | * | * | * | ||||
| 3 d vs 1 d | * | * | ||||||
| 7 d vs 3 d | * | |||||||
| 14 d vs 7 d | * | * | ||||||
LV, ES thickness, ED thickness and FS were compared at five time points – baseline, 1d, 3d, 7d and 14d after IR. These wall motion parameters were compared serially to the previous time point using ANOVA for each myocardial sector. A progressive worsening of LV wall motion is observed after IR. n = 4 in each group, * indicates a significant decrease and # indicates a significant increase in each parameter at p < 0.05.
Discussion
Timely coronary reperfusion of the ischemic myocardium is aimed at reducing myocardial dysfunction and improving tissue survival. Reperfusion, however, also poses the threat of reperfusion injury. Reperfusion injury may be broadly viewed as having two major components: oxidant-induced myocardial tissue damage during the reperfusion process, and progressive tissue damage secondary to the initial insult (3, 32). Compared to the first component, the process of progressive tissue damage after reperfusion remains poorly understood. Acute myocardial infarction in humans is associated with the activation of myocyte death in the surviving peri-infarct portion of the heart (20). It has been proposed that the secondary progressive myocardial tissue damage is aimed at clearing non-salvageable cells (12). Others have proposed that excessive mechanical forces associated with increases in ventricular loading following IR causes the secondary progressive tissue damage (15). Yet others have implicated post-IR inflammation to cause the secondary progressive myocardial tissue damage (14, 31). In contrast, products of post-IR inflammation e.g TNFα have been shown to induce cytoprotective signals that prevent and/or delay the development of cardiac myocyte death secondary to acute ischemic injury (18). In this study, we employed MRI and histological approaches to characterize post-IR myocardial tissue damage both from functional as well as structural standpoints. High resolution imaging performed on the 11.7 T MRI scanner with large gradient strength and fast slew rate allowed superior signal-to-noise ratio and contrast between hyper intense and non ischemic regions. Voxel volumes of approximately 0.01 mm3 and temporal resolution of 6 ms were routinely obtained to generate cine loops which were utilized to analyze cardiac parameters. The use of a double inversion preparation pulse to null blood signal proved critical to enhance contrast to noise ratio in certain cases. Tight positive correlation was found between infarct volumes measured with MRI and TTC, consistent with previous studies (9, 10, 16, 22, 23). Previously it has been suggested that contrast-enhanced MRI overestimates the size of myocardial infarcts when images are acquired much less than 20 minutes after contrast injection (11, 21). We observed that infarct volume measured with MRI remains practically constant from 20-60 min after contrast administration, thus providing a wide window of time where MR images could be acquired.
TTC staining of tissue is coupled with the state of mitochondrial metabolism. Tissue with dysfunctional mitochondria does not stain with TTC resulting in a pale appearance (4). In this study, infarct volumes measured in separate groups of mice showed significant differences from 1h to 1d but no statistical difference in size from 1d to 7d post-IR. Assuming that infarct volumes were similar between groups, these data suggest a progressive increase in infarct volume between 1h and 1d post IR. Moreover, this observation must be tempered by the fact that no statistical difference in infarct size was found between the 1d results compared to 3d and 7d post IR. The significant decrease in infarct size observed between 3d and 14d post IR can be attributed to the wound contracture that accompanies scar maturation. Myocyte-deficient regions of the infarct site are known to be richly populated with fibroblasts that differentiate to myofibroblasts over time (17, 27, 29). Such myofibroblasts may account for the wound contraction noted between days 7 and 14 after IR. IR injury compromises LV function (8, 24, 35, 37). Concurrent with the changes in infarct volume observed using all three techniques after IR, a time-dependent change in LV function was also noted in this study. Increased LV, EDV and ESV, and reduced CO and EF were consistently observed till day 7 following IR. A marginal gain of LV function was observed on day 14, but it was still lower than baseline values suggesting a more permanent change in cardiac function because of the injury. Segmental LV wall motion analysis performed in the current study points to a time-dependent worsening of wall motion after IR. In the infarct region (20°-200° on most slices), IR caused a decrease in ES thickness coupled with small changes in ED thickness, leading to massive wall thickening abnormalities. This observation must be tempered by the fact that this was not a serial study. Furthermore, no attempt was made to distinguish between infarcted and non-infarcted sectors in the current study. Loss of wall thickening associated, albeit not significantly, with loss of cardiac function and increased infarct volume. In addition, compromised wall thickening was also observed in LV regions adjacent to infarct region consistent with previous findings (8, 24, 34). Interestingly, an improvement in FS was observed over baseline in remote (250°-360°) regions of LV. The recovery of cardiac contractility in remote regions at 14d after IR occurred simultaneously with morphological adaptations and was paralleled by a significant increase in ventricular weight. Part of this hypertrophic response may be attributed to normal physiological growth of the tissue. However, the enlargement of EDV and relative thickening of remote regions of LV suggest an eccentric hypertrophic response to IR injury. De Celle et al studied LV remodeling in mice till 8 weeks post IR and also reported a positive correlation between infarct size and ventricular weight (6). This long-term remodeling response can be explained as a compensatory mechanism for reduced cardiac contractility caused by time-dependent functional and structural damage caused by IR. Findings of the current study would be best interpreted in light of the practical limitations in execution. MRI was performed at two-three time points per group. All conclusions drawn regarding progressive changes in structure and function are based on the assumption that infarct size was similar between the five groups of mice. With respect to the segmental analysis of fractional shortening, it should be noted that any conclusions drawn regarding progressive changes in wall motion are based on the assumptions that both the size and spatial distribution of infarct were equivalent between the different groups of mice.
In summary, we present first evidence from tandem high resolution cardiac MRI and histological studies aimed at characterizing the temporal changes in LV function, infarct size and regional wall motion in mice after IR. A time-dependent loss of myocardial function was observed which associated with increased infarct volume from 1h to 1d post-IR and worsened regional wall motion. Histological determination of infarct size did not match with MRI and TTC at acute time points after IR, demonstrating the presence of a small number of structurally intact but functionally compromised myocytes at the infarct site after IR injury. This observation is consistent with the literature (1). With the progression of time, such affected myocytes were noted to structurally disappear resulting in consistent infarct sizes obtained from MRI, TTC as well as trichrome and H&E analyses on day 7 following IR. Specific molecular mechanisms implicated in such myocyte death in the peri-infarct region following IR remain to be characterized.
Supplementary Material
Figure S1 | Electrocardiograms show myocardial injury early post IR. Animals were lightly anesthetized and subdermal ECG was recorded in mice before and after IR at 5 time points as shown. The P waves, QRS and T waves were visible and annotated. Following infarct, there is acute ST segment elevation, followed by development of chronic negative Q waves.
Acknowledgment
Supported by NIH RO1 HL073087 to CKS.
References
- 1.Ambrosio G, Weisman HF, Mannisi JA, Becker LC. Progressive impairment of regional myocardial perfusion after initial restoration of postischemic blood flow. Circulation. 1989;80:1846–1861. doi: 10.1161/01.cir.80.6.1846. [DOI] [PubMed] [Google Scholar]
- 2.Ambrosio G, Zweier JL, Becker LC. Apoptosis is prevented by administration of superoxide dismutase in dogs with reperfused myocardial infarction. Basic Res Cardiol. 1998;93:94–96. doi: 10.1007/s003950050068. [DOI] [PubMed] [Google Scholar]
- 3.Bardales RH, Hailey LS, Xie SS, Schaefer RF, Hsu SM. In situ apoptosis assay for the detection of early acute myocardial infarction. Am J Pathol. 1996;149:821–829. [PMC free article] [PubMed] [Google Scholar]
- 4.Benedek A, Moricz K, Juranyi Z, Gigler G, Levay G, Harsing LG, Jr., Matyus P, Szenasi G, Albert M. Use of TTC staining for the evaluation of tissue injury in the early phases of reperfusion after focal cerebral ischemia in rats. Brain Res. 2006;1116:159–165. doi: 10.1016/j.brainres.2006.07.123. [DOI] [PubMed] [Google Scholar]
- 5.Chacko VP, Aresta F, Chacko SM, Weiss RG. MRI/MRS assessment of in vivo murine cardiac metabolism, morphology, and function at physiological heart rates. Am J Physiol Heart Circ Physiol. 2000;279:H2218–2224. doi: 10.1152/ajpheart.2000.279.5.H2218. [DOI] [PubMed] [Google Scholar]
- 6.De Celle T, Cleutjens JP, Blankesteijn WM, Debets JJ, Smits JF, Janssen BJ. Long-term structural and functional consequences of cardiac ischaemia-reperfusion injury in vivo in mice. Exp Physiol. 2004;89:605–615. doi: 10.1113/expphysiol.2004.027649. Epub 2004 Jul 2015. [DOI] [PubMed] [Google Scholar]
- 7.Epstein FH. MR in mouse models of cardiac disease. NMR Biomed. 2007;20:238–255. doi: 10.1002/nbm.1152. [DOI] [PubMed] [Google Scholar]
- 8.Epstein FH, Yang Z, Gilson WD, Berr SS, Kramer CM, French BA. MR tagging early after myocardial infarction in mice demonstrates contractile dysfunction in adjacent and remote regions. Magn Reson Med. 2002;48:399–403. doi: 10.1002/mrm.10210. [DOI] [PubMed] [Google Scholar]
- 9.Fieno DS, Hillenbrand HB, Rehwald WG, Harris KR, Decker RS, Parker MA, Klocke FJ, Kim RJ, Judd RM. Infarct resorption, compensatory hypertrophy, and differing patterns of ventricular remodeling following myocardial infarctions of varying size. J Am Coll Cardiol. 2004;43:2124–2131. doi: 10.1016/j.jacc.2004.01.043. [DOI] [PubMed] [Google Scholar]
- 10.Fieno DS, Kim RJ, Chen EL, Lomasney JW, Klocke FJ, Judd RM. Contrast-enhanced magnetic resonance imaging of myocardium at risk: distinction between reversible and irreversible injury throughout infarct healing. J Am Coll Cardiol. 2000;36:1985–1991. doi: 10.1016/s0735-1097(00)00958-x. [DOI] [PubMed] [Google Scholar]
- 11.Flacke S, Allen JS, Chia JM, Wible JH, Periasamy MP, Adams MD, Adzamli IK, Lorenz CH. Characterization of viable and nonviable myocardium at MR imaging: comparison of gadolinium-based extracellular and blood pool contrast materials versus manganese-based contrast materials in a rat myocardial infarction model. Radiology. 2003;226:731–738. doi: 10.1148/radiol.2263020151. Epub 2003 Jan 2024. [DOI] [PubMed] [Google Scholar]
- 12.Fliss H, Gattinger D. Apoptosis in ischemic and reperfused rat myocardium. Circ Res. 1996;79:949–956. doi: 10.1161/01.res.79.5.949. [DOI] [PubMed] [Google Scholar]
- 13.Franco F, Thomas GD, Giroir B, Bryant D, Bullock MC, Chwialkowski MC, Victor RG, Peshock RM. Magnetic resonance imaging and invasive evaluation of development of heart failure in transgenic mice with myocardial expression of tumor necrosis factor-alpha. Circulation. 1999;99:448–454. doi: 10.1161/01.cir.99.3.448. [DOI] [PubMed] [Google Scholar]
- 14.Jordan JE, Zhao ZQ, Vinten-Johansen J. The role of neutrophils in myocardial ischemia-reperfusion injury. Cardiovasc Res. 1999;43:860–878. doi: 10.1016/s0008-6363(99)00187-x. [DOI] [PubMed] [Google Scholar]
- 15.Kajstura J, Cheng W, Reiss K, Clark WA, Sonnenblick EH, Krajewski S, Reed JC, Olivetti G, Anversa P. Apoptotic and necrotic myocyte cell deaths are independent contributing variables of infarct size in rats. Lab Invest. 1996;74:86–107. [PubMed] [Google Scholar]
- 16.Kim RJ, Chen EL, Lima JA, Judd RM. Myocardial Gd-DTPA kinetics determine MRI contrast enhancement and reflect the extent and severity of myocardial injury after acute reperfused infarction. Circulation. 1996;94:3318–3326. doi: 10.1161/01.cir.94.12.3318. [DOI] [PubMed] [Google Scholar]
- 17.Kuhn DE, Roy S, Radtke J, Khanna S, Sen CK. Laser microdissection and capture of pure cardiomyocytes and fibroblasts from infarcted heart regions: perceived hyperoxia induces p21 in peri-infarct myocytes. Am J Physiol Heart Circ Physiol. 2007;292:H1245–1253. doi: 10.1152/ajpheart.01069.2006. Epub 2006 Dec 1248. [DOI] [PubMed] [Google Scholar]
- 18.Kurrelmeyer KM, Michael LH, Baumgarten G, Taffet GE, Peschon JJ, Sivasubramanian N, Entman ML, Mann DL. Endogenous tumor necrosis factor protects the adult cardiac myocyte against ischemic-induced apoptosis in a murine model of acute myocardial infarction. Proc Natl Acad Sci U S A. 2000;97:5456–5461. doi: 10.1073/pnas.070036297. [DOI] [PMC free article] [PubMed] [Google Scholar]
- 19.Naumova AV, Weiss RG, Chacko VP. Regulation of murine myocardial energy metabolism during adrenergic stress studied by in vivo 31P NMR spectroscopy. Am J Physiol Heart Circ Physiol. 2003;285:H1976–1979. doi: 10.1152/ajpheart.00474.2003. Epub 2003 Jul 1924. [DOI] [PubMed] [Google Scholar]
- 20.Olivetti G, Quaini F, Sala R, Lagrasta C, Corradi D, Bonacina E, Gambert SR, Cigola E, Anversa P. Acute myocardial infarction in humans is associated with activation of programmed myocyte cell death in the surviving portion of the heart. J Mol Cell Cardiol. 1996;28:2005–2016. doi: 10.1006/jmcc.1996.0193. [DOI] [PubMed] [Google Scholar]
- 21.Oshinski JN, Yang Z, Jones JR, Mata JF, French BA. Imaging time after Gd-DTPA injection is critical in using delayed enhancement to determine infarct size accurately with magnetic resonance imaging. Circulation. 2001;104:2838–2842. doi: 10.1161/hc4801.100351. [DOI] [PubMed] [Google Scholar]
- 22.Rochitte CE, Lima JA, Bluemke DA, Reeder SB, McVeigh ER, Furuta T, Becker LC, Melin JA. Magnitude and time course of microvascular obstruction and tissue injury after acute myocardial infarction. Circulation. 1998;98:1006–1014. doi: 10.1161/01.cir.98.10.1006. [DOI] [PubMed] [Google Scholar]
- 23.Rogers WJ, Jr., Kramer CM, Geskin G, Hu YL, Theobald TM, Vido DA, Petruolo S, Reichek N. Early contrast-enhanced MRI predicts late functional recovery after reperfused myocardial infarction. Circulation. 1999;99:744–750. doi: 10.1161/01.cir.99.6.744. [DOI] [PubMed] [Google Scholar]
- 24.Ross AJ, Yang Z, Berr SS, Gilson WD, Petersen WC, Oshinski JN, French BA. Serial MRI evaluation of cardiac structure and function in mice after reperfused myocardial infarction. Magn Reson Med. 2002;47:1158–1168. doi: 10.1002/mrm.10166. [DOI] [PubMed] [Google Scholar]
- 25.Roy S, Khanna S, Kuhn DE, Rink C, Williams WT, Zweier JL, Sen CK. Transcriptome analysis of the ischemia-reperfused remodeling myocardium: temporal changes in inflammation and extracellular matrix. Physiol Genomics. 2006;25:364–374. doi: 10.1152/physiolgenomics.00013.2006. Epub 2006 Mar 2022. [DOI] [PubMed] [Google Scholar]
- 26.Roy S, Khanna S, Sen CK. Perceived hyperoxia: oxygen-regulated signal transduction pathways in the heart. Methods Enzymol. 2004;381:133–139. doi: 10.1016/S0076-6879(04)81008-5. [DOI] [PubMed] [Google Scholar]
- 27.Roy S, Khanna S, Wallace WA, Lappalainen J, Rink C, Cardounel AJ, Zweier JL, Sen CK. Characterization of perceived hyperoxia in isolated primary cardiac fibroblasts and in the reoxygenated heart. J Biol Chem. 2003;278:47129–47135. doi: 10.1074/jbc.M308703200. Epub 42003 Sep 47122. [DOI] [PubMed] [Google Scholar]
- 28.Ruff J, Wiesmann F, Hiller KH, Voll S, von Kienlin M, Bauer WR, Rommel E, Neubauer S, Haase A. Magnetic resonance microimaging for noninvasive quantification of myocardial function and mass in the mouse. Magn Reson Med. 1998;40:43–48. doi: 10.1002/mrm.1910400106. [DOI] [PubMed] [Google Scholar]
- 29.Sen CK, Khanna S, Roy S. Perceived hyperoxia: oxygen-induced remodeling of the reoxygenated heart. Cardiovasc Res. 2006;71:280–288. doi: 10.1016/j.cardiores.2006.01.003. [DOI] [PubMed] [Google Scholar]
- 30.Simonetti OP, Kim RJ, Fieno DS, Hillenbrand HB, Wu E, Bundy JM, Finn JP, Judd RM. An improved MR imaging technique for the visualization of myocardial infarction. Radiology. 2001;218:215–223. doi: 10.1148/radiology.218.1.r01ja50215. [DOI] [PubMed] [Google Scholar]
- 31.Suzuki H, Wildhirt SM, Dudek RR, Narayan KS, Bailey AH, Bing RJ. Induction of apoptosis in myocardial infarction and its possible relationship to nitric oxide synthase in macrophages. Tissue Cell. 1996;28:89–97. doi: 10.1016/s0040-8166(96)80047-4. [DOI] [PubMed] [Google Scholar]
- 32.Taatjes DJ, Wadsworth MP, Zaman AK, Schneider DJ, Sobel BE. A novel dual staining method for identification of apoptotic cells reveals a modest apoptotic response in infarcted mouse myocardium. Histochem Cell Biol. 2007;128:275–283. doi: 10.1007/s00418-007-0323-5. Epub 2007 Aug 2008. [DOI] [PubMed] [Google Scholar]
- 33.Weiss RG, Chatham JC, Georgakopolous D, Charron MJ, Wallimann T, Kay L, Walzel B, Wang Y, Kass DA, Gerstenblith G, Chacko VP. An increase in the myocardial PCr/ATP ratio in GLUT4 null mice. Faseb J. 2002;16:613–615. doi: 10.1096/fj.01-0462fje. [DOI] [PubMed] [Google Scholar]
- 34.Yang Z, Berr SS, Gilson WD, Toufektsian MC, French BA. Simultaneous evaluation of infarct size and cardiac function in intact mice by contrast-enhanced cardiac magnetic resonance imaging reveals contractile dysfunction in noninfarcted regions early after myocardial infarction. Circulation. 2004;109:1161–1167. doi: 10.1161/01.CIR.0000118495.88442.32. Epub 2004 Feb 1116. [DOI] [PubMed] [Google Scholar]
- 35.Yang Z, Bove CM, French BA, Epstein FH, Berr SS, DiMaria JM, Gibson JJ, Carey RM, Kramer CM. Angiotensin II type 2 receptor overexpression preserves left ventricular function after myocardial infarction. Circulation. 2002;106:106–111. doi: 10.1161/01.cir.0000020014.14176.6d. [DOI] [PubMed] [Google Scholar]
- 36.Yang Z, Cerniway RJ, Byford AM, Berr SS, French BA, Matherne GP. Cardiac overexpression of A1-adenosine receptor protects intact mice against myocardial infarction. Am J Physiol Heart Circ Physiol. 2002;282:H949–955. doi: 10.1152/ajpheart.00741.2001. [DOI] [PubMed] [Google Scholar]
- 37.Yang Z, French BA, Gilson WD, Ross AJ, Oshinski JN, Berr SS. Cine magnetic resonance imaging of myocardial ischemia and reperfusion in mice. Circulation. 2001;103:E84. doi: 10.1161/01.cir.103.15.e84. [DOI] [PubMed] [Google Scholar]
- 38.Young AA, French BA, Yang Z, Cowan BR, Gilson WD, Berr SS, Kramer CM, Epstein FH. Reperfused myocardial infarction in mice: 3D mapping of late gadolinium enhancement and strain. J Cardiovasc Magn Reson. 2006;8:685–692. doi: 10.1080/10976640600721767. [DOI] [PubMed] [Google Scholar]
- 39.Zweier JL, Flaherty JT, Weisfeldt ML. Direct measurement of free radical generation following reperfusion of ischemic myocardium. Proc Natl Acad Sci U S A. 1987;84:1404–1407. doi: 10.1073/pnas.84.5.1404. [DOI] [PMC free article] [PubMed] [Google Scholar]
Associated Data
This section collects any data citations, data availability statements, or supplementary materials included in this article.
Supplementary Materials
Figure S1 | Electrocardiograms show myocardial injury early post IR. Animals were lightly anesthetized and subdermal ECG was recorded in mice before and after IR at 5 time points as shown. The P waves, QRS and T waves were visible and annotated. Following infarct, there is acute ST segment elevation, followed by development of chronic negative Q waves.


