

Abstract
Aims/Introduction
We compared clinical characteristics in patients with type 2 diabetes for whom different antihyperglycemic agents were prescribed as monotherapy or combination therapy by diabetes specialists in Japan.
Materials and Methods
Prescription data for 2005, 2008 and 2011 from diabetes specialists' patient registries identified variables related to prescription of different antihyperglycemic agents.
Results
A total of 33,251 prescriptions in 2005, 25,119 in 2008 and 20,631 in 2011 were analyzed. Prescribing insulin was related to younger age, long duration of diabetes and glycated hemoglobin (HbA1c) ≥8.0%, but was negatively associated with obesity. Prescribing sulfonylureas was related to older age and long duration of diabetes, but not to obesity. Use of biguanides was related to younger age, short duration of diabetes and obesity, but was negatively associated with HbA1c ≥8.0%. A short duration of diabetes and HbA1c ≥8.0% were associated with use of a DPP‐4 inhibitor, but not with obesity. Prescribing GLP‐1 receptor agonists was related to younger age, obesity and HbA1c ≥8.0%. Odds ratios for each antihyperglycemic combination therapy were determined based on the characteristics of each included antihyperglycemic agent.
Conclusions
These results could be expected to reflect in part the consensus of diabetes specialists, and might provide guidance regarding pharmacotherapy in the clinical setting.
Keywords: Antihyperglycemic prescription, Combination therapy, Diabetes specialists
Introduction
Eight different drug classes are currently approved for treatment of hyperglycemia in patients with type 2 diabetes in Japan, with several new drugs having been developed during the past decade1. The choice of medication should depend on individual patient factors while strictly adhering to clinical guidelines and recommendations1, 2. Needless to say, diabetes specialists are expected to choose antihyperglycemic medications in consideration of factors that influence the overall health of each patient. However, there has been little clarification of the relationship between patient factors and the antihyperglycemic agents that have been prescribed by diabetes specialists for patients with type 2 diabetes.
Although metformin is recommended as first‐line therapy for type 2 diabetes2, approximately 35% of patients initiating the use of an oral hypoglycemic drug did not receive the recommended initial therapy with metformin in the USA3. This suggests that physicians considered a wide range of other factors, such as patient characteristics and non‐clinical issues, in choosing antihyperglycemic medications for patients with type 2 diabetes4. Grant et al.4 reported that a survey of both diabetes specialists and generalists showed that many issues were considered when choosing an initial prescription of an antihyperglycemic medication, such as overall assessment of patients' health and comorbid conditions, glycemic control, adherence behavior and bodyweight in addition to the physician's usual practice. Furthermore, those choices were more affected by patient factors, such as glycemic control and bodyweight, than by experts' guidelines or hospital algorithms4. Therefore, investigating those relationships over a period of time using data from a large group of diabetes specialists could reveal why physicians do not choose metformin as the first‐line drug, and determine the common factors involved in prescription of antihyperglycemic drugs among diabetes specialists.
The Japan Diabetes Clinical Data Management Study Group (JDDM) is one of the largest Japanese diabetes cohorts consisting of more than 100 leading clinical diabetologists in 98 facilities, and has provided information on characteristics of patients with type 2 diabetes as well as antihyperglycemic prescription trends in Japan5, 6, 7, 8. In addition, the choices of antihyperglycemic medications have depended on physicians' considerations, as in Japan therapeutic guidelines have not specified the first‐line or combination of antihyperglycemic agents to be used. Asian, including Japanese, patients with type 2 diabetes tend to be characterized more by impaired insulin secretion than by increased insulin resistance compared with Caucasians1, 9, 10, 11. Furthermore, there has not been sufficient clinical data to determine the most appropriate first‐line or second‐line antihyperglycemic agent in Japan. Therefore, using JDDM data, we examined the clinical characteristics of type 2 diabetic patients among whom different antihyperglycemic agents were prescribed as monotherapy or combination therapy by specialists.
Methods
Data were extracted by software (CoDic; Novo Nordisk Pharm Ltd., Tokyo, Japan) from the JDDM on patients prescribed antihyperglycemic agents in 2005, 2008 and 2011. The details of the JDDM and CoDic were described elsewhere5, 6, 7, 8. We included as participants individuals who were aged 20 years or older who underwent medical treatment in outpatient clinics for type 2 diabetes. Prospective participants included 33,820 patients from 2005, 44,973 patients from 2008 and 55,881 patients from 2011. We excluded 13,189 patients from 2005, 19,854 patients from 2008 and 22,630 patients from 2011 because of incomplete data or not having been prescribed antidiabetic medicines. This left 20,631 patients from 2005, 25,119 patients from 2008 and 33,251 from 2011 for analysis. The present study was approved by the ethics committee of the JDDM, and informed consent was obtained from all patients at each participating institute in accordance with the Guidelines for Epidemiological Studies of the Ministry of Health, Labor and Welfare of Japan.
Baseline examinations
We analyzed data collected on study patients in January for each year; however, when data from January were not available for a patient, data from February or March were used. The types of therapy were divided into eight categories: insulin, sulfonylureas, biguanides, alpha‐glucosidase inhibitors (α‐GI), thiazolidinediones, dipeptidyl peptidase‐4 inhibitors (DPP‐4I), glinides and glucagon‐like peptide‐1 receptor agonists (GLP‐1). For the calculation of rates of prescription of each type of medication, we calculated the number of patients prescribed each specific antihyperglycemic medication divided by the total number of patients receiving antidiabetic therapy for each year. Glycated hemoglobin (HbA1c) was measured by high‐performance liquid chromatography using either the ADAMS A1c (Arkray, Kyoto, Japan) or HLC‐723 (Tosoh Corp., Tokyo, Japan). HbA1c was converted from the Japanese Diabetes Society values into National Glycohemoglobin Standardization Program equivalent values12. Hypertension was defined as systolic blood pressure ≥140 mmHg and/or diastolic blood pressure ≥90 mmHg or the current use of antihypertensive agents.
Statistical analysis
Categorical variables were expressed as numerals and percentages, and were compared using the Cochran–Armitage test. Continuous variables were expressed as mean ± standard deviation, and were compared using one‐way anova tests for comparisons of each group according to year. Logistic regression analyses were carried out to identify variables related to each antihyperglycemic prescribed for both monotherapy and combination therapy. Covariates included age (<50, 50–64 and ≥65 years), sex, duration of diabetes (<10 and ≥10 years), body mass index (BMI; <25.0 and ≥25.0 kg/m2), hypertension and HbA1c (<8.0 and ≥8.0% [64 mmol/mol]). All statistical analyses were carried out by spss (version 18.0; SPSS, Chicago, IL, USA), and statistical significance was considered for P < 0.05.
Results
Table 1 lists the participants' baseline characteristics according to the study year. Except for the prevalence of hypertension and use of insulin therapy, there were significant differences among the years. Tables 2 and S1–S3 show the characteristics of study participants receiving each antihyperglycemic medication as monotherapy or combination therapy. Participants who were prescribed insulin were on the whole younger, had a lower BMI, a longer duration of diabetes, and worse glycemic control while those who were given sulfonylurea were older, had a lower BMI and a longer duration of diabetes. Participants who were prescribed biguanides were younger, had a higher BMI and a shorter duration of diabetes, whereas those who were given thiazolidinediones had a higher BMI. Participants who were prescribed DPP‐4I had a lower BMI and a shorter duration of diabetes, and those who were prescribed GLP‐1 were younger, had a higher BMI and worse glycemic control. Those who were prescribed α‐GI or glinides were older, had a lower BMI and better glycemic control. Tables 3 and 4, and Tables S4 and S5 show the results of logistic regression analyses for each year studied. Figure 1 shows the schema of odds ratios for explanatory variables in logistic regression analysis for the selected antihyperglycemic medications as monotherapy in 2011. Prescribing insulin was related to younger age, long duration of diabetes and HbA1c ≥8.0% (64 mmol/mol), but was negatively associated with obesity. The use of sulfonylureas was associated with older age and long duration of diabetes, but was negatively associated with obesity. Prescribing biguanides was related to younger age, short duration of diabetes, obesity and hypertension, but was negatively associated with HbA1c ≥8.0% (64 mmol/mol). The use of DPP‐4I was related to a short duration of diabetes and HbA1c ≥8.0% (64 mmol/mol), but was negatively associated with obesity. Finally, prescribing GLP‐1 was related to younger age, obesity and HbA1c ≥8.0% (64 mmol/mol). Odds ratios for each antihyperglycemic combination therapy were determined based on the characteristics of each agent comprising the combination therapy.
Table 1.
Characteristics of study participants according to data acquired from 3 years
| Sample characteristic | 2011 | 2008 | 2005 | P‐value |
|---|---|---|---|---|
| No. patients (n) | 33,251 | 25,119 | 20,631 | |
| Age (years) | 62 ± 12 | 62 ± 12 | 61 ± 12 | <0.001 |
| Age <50 years (%) | 4,966 (15) | 3,733 (15) | 3,170 (15) | <0.219 |
| Age 50–64 years (%) | 13,251 (40) | 10,589 (42) | 9,138 (44) | <0.001 |
| Age ≥65 years (%) | 15,034 (45) | 10,797 (43) | 8,323 (40) | <0.001 |
| Male/female | 20,503/12,748 | 15,292/9,827 | 12,361/8,270 | <0.001 |
| BMI (kg/m2) | 24.7 ± 4.3 | 24.5 ± 4.2 | 24.1 ± 3.8 | <0.001 |
| Duration of diabetes (years) | 12.6 ± 9.1 | 11.8 ± 8.8 | 12.3 ± 11.3 | <0.001 |
| Hypertension, n (%) | 18,532 (56) | 13,685 (54) | 11,420 (55) | 0.212 |
| Systolic blood pressure (mmHg) | 128 ± 16 | 129 ± 18 | 131 ± 17 | <0.001 |
| Diastolic blood pressure (mmHg) | 73 ± 11 | 74 ± 11 | 76 ± 11 | <0.001 |
| HbA1c, % (NGSP) | 7.4 ± 1.2 | 7.5 ± 1.3 | 7.7 ± 1.4 | <0.001 |
| HbA1c, mmol/mol (IFCC) | 57 ± 13 | 58 ± 14 | 61 ± 15 | |
| Any insulin therapy | 10,804 (32) | 8,441 (34) | 6,845 (33) | 0.051 |
| Insulin monotherapy | 5,880 (18) | 5,448 (22) | 4,479 (22) | <0.001 |
| Insulin plus any OAD | 4,924 (15) | 2,933 (12) | 2,366 (11) | <0.001 |
| Any OAD therapy | 27,371 (82) | 19,671 (78) | 16,152 (78) | <0.001 |
| OAD monotherapy | 8,575 (26) | 7,580 (30) | 7,043 (34) | <0.001 |
| Sulfonylureas | 3,240 (9.7) | 4,141 (16) | 4,477 (23) | <0.001 |
| Biguanides | 2,357 (7.1) | 1,336 (5.3) | 802 (3.9) | <0.001 |
| Thiazolidinediones | 670 (2.0) | 617 (2.5) | 218 (1.1) | <0.001 |
| DPP‐4 inhibitors | 538 (1.6) | – | – | – |
| α‐Glucosidase inhibitors | 825 (2.5) | 687 (2.7) | 914 (4.4) | <0.001 |
| Glinides | 873 (2.6) | 799 (3.2) | 632 (3.1) | <0.001 |
| GLP‐1 analogs monotherapy | 52 (0.2) | – | – | – |
BMI, body mass index; DPP‐4, dipeptidyl peptidase‐4 inhibitors; GLP‐1, glucagon‐like peptide‐1 receptor agonists; HbA1c, glycated hemoglobin; IFCC, International Federation of Clinical Chemistry; OAD, oral antidiabetic drug; NGSP, National Glycohemoglobin Standardization Program.
Table 2.
Characteristics of study participants according to analysis of the use of antihyperglycemic medications in 2011
| Sample characteristic | INS | S | B | T | α‐GI | Glinides | D | GLP‐1 | S + B |
|---|---|---|---|---|---|---|---|---|---|
| n | 5,880 | 3,240 | 2,357 | 670 | 825 | 873 | 538 | 52 | 3,519 |
| Age (years) | 59 ± 15 | 67 ± 11 | 59 ± 12 | 63 ± 11 | 66 ± 11 | 67 ± 10 | 62 ± 12 | 56 ± 16 | 62 ± 11 |
| <50 years (%) | 1,574 (27) | 212 (7) | 473 (20) | 84 (13) | 69 (8) | 44 (5) | 89 (17) | 19 (37) | 446 (13) |
| 50–64 years (%) | 1,918 (33) | 1,162 (36) | 1,103 (47) | 275 (41) | 292 (35) | 292 (33) | 224 (42) | 14 (27) | 1,576 (45) |
| ≥65 years (%) | 2,388 (41) | 1,866 (58) | 781 (33) | 311 (46) | 464 (56) | 537 (62) | 225 (42) | 19 (37) | 1,497 (43) |
| Male/female | 3,284/2,596 | 2,092/1,148 | 1,470/887 | 459/211 | 511/314 | 524/349 | 331/207 | 25/27 | 2,258/1,261 |
| BMI (kg/m2) | 23.4 ± 3.6 | 23.4 ± 3.3 | 25.8 ± 4.7 | 26.2 ± 4.2 | 23.4 ± 3.8 | 22.5 ± 3.1 | 23.6 ± 3.7 | 29.3 ± 6.8 | 24.8 ± 3.7 |
| Duration of diabetes (years) | 15.3 ± 10.4 | 12.4 ± 9.2 | 7.4 ± 6.5 | 8.7 ± 6.5 | 9.6 ± 8.3 | 9.6 ± 8.2 | 8.5 ± 8.1 | 10.8 ± 7.6 | 11.7 ± 8.1 |
| Hypertension, n (%) | 2,952 (50) | 1,787 (55) | 1,304 (55) | 387 (58) | 457 (55) | 416 (48) | 255 (47) | 30 (58) | 1,991 (57) |
| Systolic blood pressure (mmHg) | 128 ± 17 | 130 ± 16 | 128 ± 15 | 128 ± 16 | 127 ± 16 | 127 ± 16 | 128 ± 17 | 132 ± 18 | 130 ± 15 |
| Diastolic blood pressure (mmHg) | 73 ± 11 | 73 ± 10 | 75 ± 11 | 74 ± 11 | 73 ± 11 | 72 ± 10 | 75 ± 13 | 78 ± 10 | 74 ± 10 |
| HbA1c, % (NGSP) | 7.7 ± 1.4 | 7.2 ± 1.1 | 6.9 ± 0.9 | 6.8 ± 0.8 | 6.6 ± 0.7 | 6.8 ± 0.7 | 7.5 ± 1.4 | 8.0 ± 1.7 | 7.5 ± 1.1 |
| HbA1c, mmol/mol (IFCC) | 61 ± 15 | 55 ± 12 | 52 ± 10 | 51 ± 9 | 49 ± 8 | 51 ± 8 | 58 ± 15 | 64 ± 19 | 58 ± 12 |
| Sample characteristic | S + T | S + D | B + T | B + D | T + D | S + α‐GI | S + GLP‐1 | B + α‐GI | B + glinides |
|---|---|---|---|---|---|---|---|---|---|
| n | 962 | 410 | 466 | 240 | 50 | 1,012 | 65 | 405 | 384 |
| Age (years) | 65 ± 11 | 65 ± 11 | 59 ± 11 | 58 ± 13 | 61 ± 10 | 69 ± 10 | 57 ± 13 | 60 ± 12 | 61 ± 11 |
| <50 years (%) | 75 (8) | 41 (10) | 88 (19) | 57 (24) | 6 (12) | 35 (3) | 18 (28) | 83 (20) | 59 (15) |
| 50–64 years (%) | 362 (38) | 153 (37) | 245 (53) | 101 (42) | 25 (50) | 301 (30) | 26 (40) | 178 (44) | 183 (48) |
| ≥65 years (%) | 525 (55) | 216 (53) | 133 (29) | 82 (34) | 19 (38) | 676 (67) | 21 (32) | 144 (36) | 142 (37) |
| Male/female | 632/330 | 237/173 | 334/132 | 123/117 | 27/23 | 671/341 | 35/30 | 264/141 | 248/136 |
| BMI (kg/m2) | 25.7 ± 4.8 | 23.4 ± 3.6 | 27.9 ± 4.9 | 26.2 ± 5.4 | 25.1 ± 4.9 | 22.9 ± 3.9 | 27.7 ± 4.6 | 25.2 ± 4.0 | 24.2 ± 3.7 |
| Duration of diabetes (years) | 12.9 ± 8.3 | 12.2 ± 9.6 | 9.0 ± 6.8 | 7.0 ± 6.1 | 9.8 ± 7.9 | 14.0 ± 9.4 | 13.1 ± 8.6 | 9.7 ± 8.7 | 8.8 ± 7.4 |
| Hypertension, n (%) | 605 (63) | 224 (55) | 258 (55) | 131 (55) | 20 (40) | 621 (61) | 46 (71) | 227 (56) | 167 (43) |
| Systolic blood pressure (mmHg) | 131 ± 17 | 128 ± 16 | 126 ± 14 | 129 ± 15 | 124 ± 15 | 129 ± 16 | 130 ± 13 | 125 ± 14 | 126 ± 15 |
| Diastolic blood pressure (mmHg) | 73 ± 11 | 73 ± 11 | 74 ± 11 | 75 ± 12 | 71 ± 11 | 73 ± 11 | 76 ± 11 | 74 ± 11 | 73 ± 11 |
| HbA1c, % (NGSP) | 7.3 ± 1.0 | 7.5 ± 1.1 | 6.9 ± 0.9 | 7.3 ± 1.1 | 7.4 ± 1.3 | 7.1 ± 0.9 | 8.9 ± 1.8 | 6.9 ± 1.0 | 6.9 ± 0.7 |
| HbA1c, mmol/mol (IFCC) | 56 ± 11 | 58 ± 12 | 52 ± 10 | 56 ± 12 | 57 ± 14 | 54 ± 10 | 74 ± 20 | 52 ± 11 | 52 ± 8 |
| Sample characteristic | T + α‐GI | S + B + T | S + B + D | S + T + D | B + T + D | S + B + α‐GI | S + T + α‐GI | B + T + α‐GI | B + T + glinides |
|---|---|---|---|---|---|---|---|---|---|
| n | 166 | 1,699 | 714 | 171 | 47 | 1,270 | 473 | 130 | 61 |
| Age (years) | 63 ± 11 | 61 ± 11 | 61 ± 11 | 64 ± 10 | 56 ± 11 | 64 ± 11 | 66 ± 10 | 58 ± 11 | 64 ± 10 |
| <50 years (%) | 19 (11) | 270 (16) | 102 (14) | 11 (6) | 14 (30) | 114 (9) | 19 (4) | 25 (19) | 7 (11) |
| 50–64 years (%) | 65 (39) | 785 (46) | 331 (46) | 85 (50) | 22 (47) | 551 (43) | 187 (40) | 66 (51) | 21 (34) |
| ≥65 years (%) | 82 (49) | 644 (38) | 281 (39) | 75 (44) | 11 (23) | 605 (48) | 267 (56) | 39 (30) | 33 (54) |
| Male/female | 105/61 | 1,129/570 | 407/307 | 118/53 | 26/21 | 807/463 | 333/140 | 87/43 | 36/25 |
| BMI (kg/m2) | 26.4 ± 5.2 | 27.2 ± 4.7 | 25.4 ± 4.6 | 26.2 ± 4.8 | 29.6 ± 5.9 | 24.1 ± 3.6 | 24.9 ± 4.0 | 27.8 ± 6.0 | 26.8 ± 4.2 |
| Duration of diabetes (years) | 9.2 ± 6.5 | 13.0 ± 8.0 | 12.3 ± 7.7 | 13.5 ± 9.1 | 8.1 ± 6.0 | 13.8 ± 8.6 | 13.7 ± 8.9 | 9.5 ± 6.1 | 10.6 ± 7.3 |
| Hypertension, n (%) | 104 (63) | 983 (58) | 400 (56) | 104 (61) | 26 (55) | 711 (56) | 288 (61) | 71 (55) | 31 (51) |
| Systolic blood pressure (mmHg) | 130 ± 16 | 130 ± 14 | 129 ± 15 | 128 ± 14 | 127 ± 13 | 127 ± 15 | 128 ± 15 | 124 ± 14 | 127 ± 18 |
| Diastolic blood pressure (mmHg) | 74 ± 12 | 74 ± 10 | 74 ± 10 | 72 ± 11 | 76 ± 11 | 73 ± 11 | 73 ± 10 | 72 ± 12 | 71 ± 13 |
| HbA1c, % (NGSP) | 6.7 ± 0.8 | 7.5 ± 1.1 | 7.7 ± 1.2 | 7.6 ± 1.1 | 7.3 ± 1.1 | 7.3 ± 0.9 | 7.2 ± 0.9 | 6.8 ± 1.0 | 6.8 ± 0.7 |
| HbA1c, mmol/mol (IFCC) | 50 ± 9 | 58 ± 12 | 61 ± 13 | 60 ± 12 | 56 ± 12 | 56 ± 10 | 55 ± 10 | 51 ± 11 | 51 ± 8 |
α‐GI, alpha‐glucosidase inhibitors; B, biguanides; BMI, body mass index; D, dipeptidyl peptidase‐4 inhibitors; GLP‐1, glucagon‐like peptide‐1 receptor agonists; HbA1c, glycated hemoglobin; hypertension, systolic blood pressure ≥140 and/or diastolic blood pressure ≥90 or treatment; IFCC, International Federation of Clinical Chemistry; INS, insulin; NGSP, National Glycohemoglobin Standardization Program; S, sulfonylureas; T, thiazolidinediones.
Table 3.
Odds ratios for explanatory variables in logistic regression for selected diabetes drug therapies in 2011
| S | B | T | α‐GI | Glinides | D | GLP‐1 | S + B | |
|---|---|---|---|---|---|---|---|---|
| n | 3,240 | 2,357 | 670 | 825 | 873 | 538 | 52 | 3,519 |
| Age 50–64 vs <50 years | 2.03 (1.75–2.37) | 0.89 (0.79–1.01) | 1.30 (1.01–1.67) | 1.43 (1.10–1.87) | 2.35 (1.71–3.25) | 1.05 (0.82–1.35) | 0.34 (0.17–0.70) | 1.40 (1.25–1.57) |
| Age ≥65 vs <50 years | 2.93 (2.52–3.41) | 0.61 (0.53–0.69) | 1.52 (1.18–1.97) | 2.03 (1.56–2.65) | 3.99 (2.91–5.48) | 1.03 (0.79–1.34) | 0.48 (0.24–0.98) | 1.20 (1.06–1.34) |
| Sex (male) | 1.22 (1.13–1.32) | 0.97 (0.89–1.06) | 1.40 (1.19–1.66) | 1.07 (0.93–1.24) | 1.01 (0.87–1.16) | 0.98 (0.82–1.17) | 0.55 (0.32–0.96) | 1.12 (1.04–1.21) |
| Duration of diabetes ≥10 years | 0.83 (0.77–0.89) | 0.30 (0.27–0.33) | 0.47 (0.40–0.56) | 0.45 (0.39–0.52) | 0.38 (0.33–0.44) | 0.46 (0.38–0.55) | 0.93 (0.52–1.64) | 0.89 (0.82–0.94) |
| BMI ≥25 (kg/m2) | 0.56 (0.52–0.61) | 1.37 (1.25–1.50) | 2.17 (1.85–2.54) | 0.58 (0.50–0.68) | 0.37 (0.31–0.44) | 0.66 (0.55–0.79) | 3.50 (1.83–6.71) | 1.08 (1.00–1.16) |
| Hypertension | 0.97 (0.90–1.04) | 1.13 (1.03–1.23) | 1.02 (0.87–1.19) | 1.06 (0.92–1.22) | 0.77 (0.67–0.88) | 0.81 (0.68–0.97) | 1.01 (0.57–1.80) | 1.03 (0.96–1.11) |
| HbA1c ≥8.0% (64 mmol/mol) | 0.76 (0.69–0.84) | 0.34 (0.29–0.39) | 0.26 (0.19–0.35) | 0.19 (0.14–0.27) | 0.24 (0.18–0.34) | 1.20 (0.98–1.48) | 2.25 (1.27–3.99) | 1.01 (0.93–1.10) |
| S + T | S + D | B + T | B + D | T + D | S + α–GI | S + GLP‐1 | B + α‐GI | |
|---|---|---|---|---|---|---|---|---|
| n | 962 | 410 | 466 | 240 | 50 | 1,012 | 65 | 405 |
| Age 50–64 vs <50 years | 1.81 (1.40–2.33) | 1.42 (1.00–2.02) | 1.15 (0.89–1.48) | 0.75 (0.54–1.05) | 1.73 (0.70–4.28) | 2.76 (1.94–3.94) | 0.62 (0.33–1.16) | 0.77 (0.59–1.00) |
| Age ≥65 vs <50 years | 2.43 (1.89–3.14) | 1.74 (1.23–2.48) | 0.66 (0.50–0.88) | 0.62 (0.43–0.89) | 1.22 (0.46–3.19) | 5.04 (3.56–7.14) | 0.51 (0.26–1.02) | 0.57 (0.43–0.76) |
| Sex (male) | 1.28 (1.18–1.47) | 0.88 (0.72–1.07) | 1.47 (1.20–1.80) | 0.61 (0.47–0.79) | 0.70 (0.40–1.23) | 1.35 (1.18–1.54) | 0.72 (0.44–1.18) | 1.10 (0.89–1.35) |
| Duration of diabetes ≥10 years | 1.12 (0.98–1.28) | 0.81 (0.66–0.99) | 0.53 (0.43–0.64) | 0.29 (0.22–0.40) | 0.71 (0.40–1.26) | 1.18 (1.03–1.34) | 1.56 (0.92–2.64) | 0.59 (0.47–0.72) |
| BMI ≥25 (kg/m2) | 1.78 (1.56–2.03) | 0.54 (0.42–0.67) | 3.40 (2.77–4.18) | 1.53 (1.17–1.99) | 0.84 (0.46–1.51) | 0.49 (0.42–0.57) | 1.88 (1.10–3.24) | 1.28 (1.05–1.57) |
| Hypertension | 1.14 (0.997–1.31) | 0.99 (0.81–1.21) | 0.94 (0.77–1.13) | 1.06 (0.82–1.39) | 0.56 (0.31–0.996) | 1.19 (1.04–1.36) | 1.82 (1.05–3.18) | 1.11 (0.90–1.36) |
| HbA1c ≥8.0% (64 mmol/mol) | 0.73 (0.62–0.88) | 1.39 (1.11–1.76) | 0.27 (0.20–0.38) | 0.81 (0.58–1.13) | 0.95 (0.47–1.94) | 0.67 (0.55–0.81) | 5.53 (3.24–9.44) | 0.30 (0.21–0.43) |
| B + glinides | T + α‐GI | S + B + T | S + B + D | S + T + D | B + T + D | S + B + α–GI | |
|---|---|---|---|---|---|---|---|
| n | 384 | 166 | 1,699 | 714 | 171 | 47 | 1,270 |
| Age 50–64 vs <50 years | 1.15 (0.85–1.55) | 1.26 (0.75–2.11) | 1.16 (1.00–1.34) | 1.32 (1.05–1.66) | 3.09 (1.64–5.84) | 0.66 (0.33–1.32) | 1.66 (1.35–2.04) |
| Age ≥65 vs <50 years | 0.85 (0.62–1.17) | 1.53 (0.91–2.58) | 0.91 (0.78–1.06) | 1.01 (0.79–1.29) | 2.63 (1.36–5.08) | 0.33 (0.14–0.78) | 1.47 (1.19–1.82) |
| Sex (male) | 1.10 (0.89–1.35) | 1.11 (0.80–1.53) | 1.22 (1.10–1.36) | 0.81 (0.69–0.94) | 1.42 (1.02–1.98) | 0.67 (0.38–1.20) | 1.08 (0.96–1.22) |
| Duration of diabetes ≥10 years | 0.41 (0.33–0.51) | 0.54 (0.39–0.74) | 1.43 (1.29–1.59) | 1.07 (0.92–1.25) | 1.26 (0.92–1.73) | 0.60 (0.32–1.13) | 1.46 (1.30–1.65) |
| BMI ≥25 (kg/m2) | 0.77 (0.62–0.95) | 2.05 (1.49–2.82) | 2.91 (2.62–3.24) | 1.21 (1.03–1.41) | 1.68 (1.12–2.30) | 4.10 (2.05–8.21) | 0.84 (0.75–0.95) |
| Hypertension | 0.71 (0.57–0.87) | 1.23 (0.89–1.71) | 0.92 (0.83–1.02) | 0.98 (0.84–1.14) | 1.06 (0.77–1.45) | 0.97 (0.54–1.76) | 0.97 (0.86–1.09) |
| HbA1c ≥8.0% (64 mmol/mol) | 0.21 (0.13–0.33) | 0.20 (0.10–0.40) | 0.97 (0.86–1.09) | 1.59 (1.35–1.88) | 1.35 (0.95–1.90) | 0.60 (0.29–1.27) | 0.71 (0.61–0.83) |
α‐GI, alpha‐glucosidase inhibitors; B, biguanides; BMI, body mass index; D, dipeptidyl peptidase‐4 inhibitors; GLP‐1, glucagon‐like peptide‐1 receptor agonists; HbA1c, glycated hemoglobin; hypertension, systolic blood pressure ≥140 and/or diastolic blood pressure ≥90 or treatment; S, sulfonylureas; T, thiazolidinediones.
Table 4.
Odds ratios for explanatory variables in logistic regressions for selected diabetes drug therapies in 2011
| INS | INS + S | INS + B | INS + T | INS + α‐GI | INS + glinides | INS + S + B | |
|---|---|---|---|---|---|---|---|
| n | 5,880 | 511 | 1,169 | 209 | 733 | 112 | 570 |
| Age 50–64 vs <50 years | 0.31 (0.29–0.34) | 1.50 (1.07–2.10) | 0.88 (0.75–1.04) | 0.97 (0.64–1.46) | 1.25 (0.94–1.65) | 0.78 (0.42–1.45) | 1.34 (1.03–1.73) |
| Age ≥65 vs <50 years | 0.30 (0.27–0.32) | 1.91 (1.37–2.67) | 0.61 (0.51–0.73) | 1.16 (0.76–1.76) | 1.95 (1.48–2.57) | 1.03 (0.56–1.87) | 1.06 (0.80–1.40) |
| Sex (male) | 0.70 (0.66–0.74) | 0.83 (0.69–0.99) | 0.71 (0.63–0.79) | 0.84 (0.64–1.11) | 0.80 (0.69–0.93) | 0.66 (0.45–0.96) | 0.90 (0.76–1.06) |
| Duration of diabetes ≥10 years | 1.94 (1.83–2.07) | 2.40 (1.95–2.97) | 1.81 (1.59–2.06) | 1.41 (1.05–1.88) | 1.47 (1.25–1.73) | 1.35 (0.91–2.00) | 2.20 (1.82–2.66) |
| BMI ≥25 (kg/m2) | 0.46 (0.43–0.49) | 0.80 (0.66–0.97) | 2.02 (1.78–2.29) | 2.55 (1.90–3.44) | 0.58 (0.50–0.69) | 0.42 (0.26–0.66) | 1.82 (1.53–2.17) |
| Hypertension | 0.91 (0.86–0.97) | 1.14 (0.95–1.37) | 1.26 (1.11–1.43) | 1.05 (0.79–1.41) | 1.13 (0.97–1.32) | 1.00 (0.68–1.47) | 1.17 (0.98–1.40) |
| HbA1c ≥8.0% (64 mmol/mol) | 1.65 (1.54–1.76) | 2.28 (1.89–2.75) | 2.43 (2.15–2.75) | 2.11 (1.58–2.81) | 1.50 (1.27–1.78) | 1.03 (0.64–1.65) | 2.61 (2.20–3.11) |
| INS + S + T | INS + S + α‐GI | INS + B + T | INS + B + α‐GI | INS + B + glinides | INS + T + α‐GI | INS + α‐GI + glinides | |
|---|---|---|---|---|---|---|---|
| n | 113 | 237 | 180 | 236 | 35 | 89 | 41 |
| Age 50–64 vs <50 years | 2.97 (1.40–6.31) | 2.29 (1.24–4.24) | 1.13 (0.76–1.68) | 1.11 (0.75–1.67) | 1.35 (0.44–4.18) | 1.03 (0.52–2.05) | 3.47 (0.44–27.1) |
| Age ≥65 vs <50 years | 2.95 (1.36–6.40) | 3.73 (2.03–6.85) | 0.68 (0.43–1.08) | 1.19 (0.79–1.80) | 1.38 (0.43–4.39) | 1.74 (0.89–3.43) | 6.91 (0.91–52.2) |
| Sex (male) | 1.06 (0.72–1.56) | 1.12 (0.86–1.46) | 0.69 (0.51–0.92) | 0.75 (0.58–0.97) | 0.68 (0.35–1.33) | 1.45 (0.93–2.29) | 1.06 (0.57–2.00) |
| Duration of diabetes ≥10 years | 1.75 (1.16–2.64) | 1.84 (1.37–2.47) | 1.79 (1.31–2.46) | 1.45 (1.10–1.92) | 1.44 (0.70–2.95) | 0.95 (0.62–1.47) | 1.24 (0.64–2.40) |
| BMI ≥25 (kg/m2) | 1.76 (1.20–2.59) | 0.57 (0.42–0.77) | 6.58 (4.41–9.83) | 1.43 (1.09–1.87) | 0.85 (0.42–1.71) | 1.69 (1.10–2.61) | 0.28 (0.12–0.67) |
| Hypertension | 0.72 (0.49–1.05) | 1.03 (0.79–1.35) | 0.81 (0.60–1.10) | 1.16 (0.89–1.53) | 1.27 (0.62–2.58) | 0.85 (0.55–1.31) | 1.18 (0.62–2.24) |
| HbA1c ≥8.0% (64 mmol/mol) | 2.70 (1.84–3.96) | 2.01 (1.51–2.66) | 2.07 (1.52–2.81) | 2.37 (1.81–3.10) | 2.46 (1.22–4.95) | 1.28 (0.78–2.09) | 1.02 (0.45–2.33) |
α‐GI, alpha‐glucosidase inhibitors; B, biguanides; BMI, body mass index; D, dipeptidyl peptidase‐4 inhibitors; GLP‐1, glucagon‐like peptide‐1 receptor agonists; HbA1c, glycated hemoglobin; hypertension, systolic blood pressure ≥140 and/or diastolic blood pressure ≥90 or treatment; S, sulfonylureas; T, thiazolidinediones.
Figure 1.
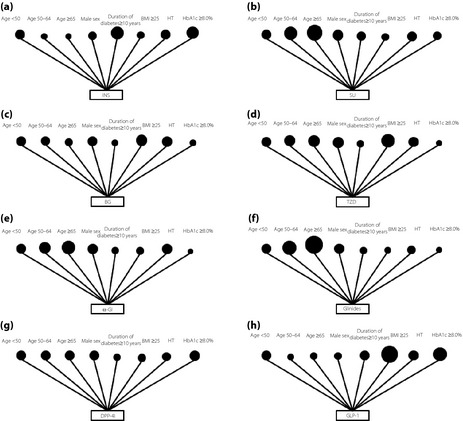
Schema of odds ratios for explanatory variables in logistic regression analysis for selected antihyperglicemic medications: (a) insulin, (b) sulfonylurea, (c) biguanides, (d) thiazolidinediones, (e) alpha‐glucosidase inhibitors (α‐GI), (f) glinides, (g) dipeptidyl peptidase‐4 inhibitors (DPP‐4I) and (h) glucagon‐like peptide‐1 receptor agonists (GLP‐1) as monotherapy in 2011. Each dot representing age <50 indicates an odds ratio of 1.00. The size of the dots reflects the odds ratio for each explanatory variable. BG, biguanides; BMI, body mass index; HbA1c, glycated hemoglobin; HT, hypertension; INS, insulin; SU, sulfonylurea; TDZ, thiazolidinediones.
Discussion
As far as we know, this is the first study to investigate the relationships between patient factors and antihyperglycemic prescriptions provided by diabetes specialists for patients with type 2 diabetes over a period of time in Japan. We found considerable differences in characteristics among patients who were prescribed various antihyperglycemic medications by diabetes specialists. These findings might partially reflect the consensus of specialists as to what agents would be most suitable for patients with particular characteristics. This information would be useful for developing algorithms for pharmacotherapy based on specialists' prescriptions for type 2 diabetes.
Japan is a developed country that has provided universal health coverage, which allows virtually all persons to have access to curative services, including those in specialty outpatient clinics, at an affordable cost13. Furthermore, this Japanese public insurance allows doctors to prescribe antihyperglycemic medications with comparative ease without worrying about insurance regulations, such as the forced use of generics13. Therefore, we believe that those differences in the characteristics of patients prescribed each antihyperglycemic medication by Japanese diabetes specialists reflect their opinions of the suitability of specific agents for specific patients.
Trends in prescriptions for antihyperglycemic agents were substantially examined in USA, UK and Japan8, 14, 15, 16. However, to the best of our knowledge, no study has investigated the relationships between the characteristics of patients and eight classes of antihyperglycemic agents that were prescribed by diabetes specialists over a period of time. Therefore, physicians have had few clues as to what diabetes specialists considered when prescribing antihyperglycemic medications. Grant et al.4 investigated the relationships among the choices of a patient's initial antihyperglycemic medication; the use of thiazolidinediones (glitazones), which are often considered second‐line agents; the initiation of insulin; and patient factors. However, those investigators did not adjust their results by detailed patient factors, such as the HbA1c level, BMI and duration of diabetes, which could affect which antihyperglycemic is prescribed. The present results showed the relationships between various patient characteristics and eight classes of antihyperglycemic agents prescribed by diabetes specialists over a period of time.
Physicians have a low to moderate rate of adherence to clinical recommendations for treating type 2 diabetes17, 18. Desai et al.3 showed that one‐third of patients initiating oral antihyperglycemic medications did not receive the recommended initial therapy with metformin. However, those results might have reflected consideration of patient factors and non‐clinical issues. In other words, physicians, especially diabetes specialists, recognized the importance of patient‐centered care, which was emphasized in the American Diabetes Association the European Association for the Study of Diabetes consensus recommendations regarding metformin3. Although physicians basically strongly adhere to consensus statements, they might choose other antihyperglycemic medications because of individual patient factors, such as age, duration of diabetes, contraindications or social issues. Our findings might reflect in part the consensus of specialists as to the suitability of specific agents for patients with specific characteristics, which is not specified in the current consensus recommendations2.
Prescribing insulin is associated with a long duration of diabetes and poor glycemic control, but not obesity. Compared with insulin resistance, impaired insulin secretion had a greater impact on the background of type 2 diabetes in a Japanese population9, 10, 11. The lack of association between older age and insulin prescription could be due to difficulty in accurately injecting insulin in among older adults; also dementia and insufficient social support might play a role. The characteristics of patients receiving sulfonylureas were similar to those prescribed insulin with the exception of age. Physicians might choose sulfonylureas rather than insulin, because sulfonylureas can be administered orally.
Prescribing biguanides was found to be related to a younger age, short duration of diabetes and obesity. Although biguanides are not defined as a first‐line antihyperglycemic agent in Japan, the present results are consistent with a previous study19, and also with the consensus statement of the American Diabetes Association and the European Association for the Study of Diabetes2. It is generally considered that chronic biguanides use is weight‐neutral20, and does not increase the risk of hypoglycemia21. Biguanides can cause lactic acidosis, and avoiding its use is advised in patients at risk for lactic acidosis, such as older patients and those with advanced renal insufficiency22. The present study results might support the opinion that Japanese diabetes specialists considered the wide range of indications for biguanides. The major therapeutic effect of thiazolidinediones for type 2 diabetes is improvement in insulin sensitivity23. In the present study, prescribing thiazolidinediones was related to obesity. However, a reverse association could not be ruled out, as it was previously shown that thiazolidinediones were associated with increased bodyweight24. Therefore, bodyweight in patients taking thiazolidinediones might have increased after administration.
The DPP‐4I prescription rate has dramatically increased in Japan8, 15. Furthermore, a recent meta‐analysis showed that DPP‐4I exhibited better glucose‐lowering efficacy in studies consisting of ≥50% Asians compared with studies having <50% Asians25. In the present study, prescribing DPP‐4I was related to a short duration of diabetes and poor glycemic control, but was negatively associated with obesity. The mechanism of DPP‐4I is to increase incretin levels, leading to increased insulin secretion26. The present results might indicate that Japanese diabetes specialists considered that particular mechanism of DPP‐4I in treating type 2 diabetes. A previous study showed that patients with type 2 diabetes who were prescribed sitagliptin regimens in clinical practice were older than patients receiving non‐sitagliptin regimens27. These discrepancies in the results on patients' background related to DPP‐4I prescription could result from statistical differences in the two studies. GLP‐1 was reported to reduce bodyweight and be effective in obese patients28. Our results were consistent with those previous studies28. We found that Japanese diabetes specialists chose GLP‐1 for younger obese patients with type 2 diabetes, suggesting concerns over weight loss and improvement in glycemic control in prescribing GLP‐1. We did not have data on combination therapy with GLP‐1 and other antihyperglycemic agents except for sulfonylureas, because combination therapy was not allowed in Japan in 2011.
Both glinides and α‐GI suppress rises in postprandial glucose. Glinides enhanced early insulin secretion29, whereas α‐GI delayed the digestion of ingested carbohydrates30. Postprandial hyperglycemia characterizes early stages of type 2 diabetes31, 32. The present results were compatible with the hypothesis that Japanese diabetes specialists might choose both glinides and α‐GI for early type 2 diabetes. The relationship between α‐GI prescription and long duration of diabetes compared with glinides might be as a result of continued use, whereas a physician could change glinides to another antihyperglycemic agent when glycemic control worsens or is not adequate. Further studies are required to clarify those differences.
Several limitations need be addressed regarding the present study. First, our analysis included both patients who had just started an antihyperglycemic agent and those who had received an antihyperglycemic agent for various periods of time. Furthermore, we did not analyze the combination therapies in any specific order of prescription. Further studies are required to assess the intention of specialists by analyzing separately patients newly prescribed an antihyperglycemic agent or only patients whose prescriptions had been changed in outpatient care. Second, the present study had numerous missing data. Also, we could not obtain information on the presence or absence of diabetes complications, dementia, renal failure, liver disease, cardiovascular disease and other comorbidities because of imperfect data in the CoDic database. Consensus recommendations emphasize considering patient factors, such as comorbidities, vascular complications and life expectancy2. Social support and patient adherence also influenced the choice of antihyperglycemic medication2, 19. Therefore, further studies are necessary to clarify the relationships between the prescription of each antihyperglycemic medication and characteristics of patients including those important factors and the detailed age groups. Third, the study was cross‐sectional and can never prove causality. For example, the relationship between BMI or glycemic control and an antihyperglycemic prescription should be interpreted cautiously because of possible reverse associations. Therefore, no definitive conclusions can be drawn from our results. Fourth, the prescription periods were too short to assess a relationship between the antihyperglycemic prescription and characteristics of participants with regard to DPP‐4I or GLP‐1. Confirmation of these results over long periods of time and with an adequate number of patients is required. Fifth, selection bias by physicians should be considered. However, the trends in prescribing DPP‐4I in the present JDDM cohort can be considered similar to results of another Japanese study15. In conclusion, as far as we know, this is the first study to investigate the relationships between patient factors and antihyperglycemic prescriptions provided by diabetes specialists for patients with type 2 diabetes over a period of time in Japan. Our results showed considerable differences in characteristics among patients who were prescribed various antihyperglycemic medications by diabetes specialists. These differences might partially reflect the consensus of specialists as to what agents would be most suitable for patients with particular characteristics. This information therefore could provide guidance regarding pharmacotherapy in the clinical setting.
Disclosure
H Sone is a recipient of a Grant‐in‐Aid for Scientific Research from the Japan Society for the Promotion of Science. H Yokoyama has received lecture fees from Sanofi, Takeda, Novo Nordisk, Kowa, Ono, Novartis, Kyowa Hakko Kirin and Daiichi Sankyo. H Yagyu has received lecture fees from AstraZeneca. H Shimano has received lecture fees from MSD and Kowa Souyaku. H Shimano has received donations for research from AstraZeneca and Daiichi Sankyo. A Kashiwagi has acted as a consultant for Astellas, and received lecture fees. K Kawai has received lecture fees from Astellas, Ono and Mitsubishi Tanabe. H Sone has received lecture fees from Takeda, Kowa Souyaku, MSD, Daiichi Sankyo, Astellas, Ono, Mitsubishi Tanabe, Sanwa Kagaku, Sanofi, Novartis, Boehringer Ingelheim and Novo Nordisk. H Sone has received donations for research from Astellas, Eli Lilly, Kyowa Hakko Kirin, MSD, Japan Blood Products Organization, Boehringer Ingelheim, Pfizer, Novartis, Sumitomo Dainippon, Otsuka, Sanofi, Mitsubishi Tanabe, Asahi Kasei, Meiji Seika, Eisai, Yakult, Takeda, Taishotoyama and Daiichi Sankyo.
Supporting information
Table S1 ¦ Characteristics of study participants according to analysis of the use of antihyperglycemic medications in 2008
Table S2 ¦ Characteristics of study participants according to analysis of the use of antihyperglycemic medications in 2005
Table S3 ¦ Characteristics of study participants according to analysis of the use of antihyperglycemic medications in 2011
Table S4 ¦ Odds ratios for explanatory variables in logistic regression analysis for selected diabetes drug therapies in 2008
Table S5 ¦ Odds ratios for explanatory variables in logistic regression analysis for selected diabetes drug therapies in 2005
Acknowledgments
This work is supported in part by the Ministry of Health, Labor and Welfare, Japan.
J Diabetes Investig 2016; 7: 260–269
References
- 1. Treatment Guide for Diabetes 2012–2013: Edited by the Japan Diabetes Society, Tokyo: Bunkodo, 2013. [Google Scholar]
- 2. Inzucchi SE, Bergenstal RM, Buse JB, et al Management of hyperglycemia in type 2 diabetes: a patient‐centered approach: position statement of the American Diabetes Association (ADA) and the European Association for the Study of Diabetes (EASD). Diabetes Care 2012; 35: 1364–1379. [DOI] [PMC free article] [PubMed] [Google Scholar]
- 3. Desai NR, Shrank WH, Fischer MA, et al Patterns of medication initiation in newly diagnosed diabetes mellitus: quality and cost implications. Am J Med 2012; 125: 302.e301–302.e307. [DOI] [PMC free article] [PubMed] [Google Scholar]
- 4. Grant RW, Wexler DJ, Watson AJ, et al How doctors choose medications to treat type 2 diabetes: a national survey of specialists and academic generalists. Diabetes Care 2007; 30: 1448–1453. [DOI] [PMC free article] [PubMed] [Google Scholar]
- 5. Kobayashi M, Yamazaki K, Hirao K, et al The status of diabetes control and antidiabetic drug therapy in Japan–a cross‐sectional survey of 17,000 patients with diabetes mellitus (JDDM 1). Diabetes Res Clin Pract 2006; 73: 198–204. [DOI] [PubMed] [Google Scholar]
- 6. Kanatsuka A, Kawai K, Hirao K, et al Research on antihyperglycemic therapies in patients with type 2 diabetes mellitus in Japan (II): the effectiveness on glycemic control. J Jpn Diabetes Soc 2006; 46: 919–927. [Google Scholar]
- 7. Kanatsuka A, Kawai K, Hirao K, et al Research on antihyperglycemic therapies in patients with type 2 diabetes mellitus in Japan (I): drug therapies and actual drug use. J Jpn Diabetes Soc 2006; 49: 409–415. [Google Scholar]
- 8. Oishi M, Yamazaki K, Okuguchi F, et al Changes in oral antidiabetic prescriptions and improved glycemic control during the years 2002–2011 in Japan (JDDM32). J Diabetes Investig 2013; 5: 581–587 [DOI] [PMC free article] [PubMed] [Google Scholar]
- 9. Tanaka Y, Atsumi Y, Asahina T, et al Usefulness of revised fasting plasma glucose criterion and characteristics of the insulin response to an oral glucose load in newly diagnosed Japanese diabetic subjects. Diabetes Care 1998; 21: 1133–1137. [DOI] [PubMed] [Google Scholar]
- 10. Fukushima M, Suzuki H, Seino Y. Insulin secretion capacity in the development from normal glucose tolerance to type 2 diabetes. Diabetes Res Clin Pract 2004; 66(Suppl 1): S37–S43. [DOI] [PubMed] [Google Scholar]
- 11. Morimoto A, Tatsumi Y, Deura K, et al Impact of impaired insulin secretion and insulin resistance on the incidence of type 2 diabetes mellitus in a Japanese population: the Saku study. Diabetologia 2013; 56: 1671–1679. [DOI] [PubMed] [Google Scholar]
- 12. Kashiwagi A, Kasuga M, Araki E, et al International clinical harmonization of glycated hemoglobin in Japan: From Japan Diabetes Society to National Glycohemoglobin Standardization Program values. Diabetol International 2012; 3: 8–10. [DOI] [PMC free article] [PubMed] [Google Scholar]
- 13. Ikegami N, Yoo BK, Hashimoto H, et al Japanese universal health coverage: evolution, achievements, and challenges. Lancet 2011; 378: 1106–1115. [DOI] [PubMed] [Google Scholar]
- 14. Hampp C, Borders‐Hemphill V, Moeny DG, et al Use of antidiabetic drugs in the U.S., 2003–2012. Diabetes Care 2014; 37: 1367–1374. [DOI] [PubMed] [Google Scholar]
- 15. Kohro T, Yamazaki T, Sato H, et al Trends in antidiabetic prescription patterns in Japan from 2005 to 2011. Int Heart J 2013; 54: 93–97. [DOI] [PubMed] [Google Scholar]
- 16. Filion KB, Joseph L, Boivin JF, et al Trends in the prescription of anti‐diabetic medications in the United Kingdom: a population‐based analysis. Pharmacoepidemiol Drug Saf 2009; 18: 973–976. [DOI] [PubMed] [Google Scholar]
- 17. Issam Diab M, Julienne Johnson B, Hudson S. Adherence to clinical guidelines in management of diabetes and prevention of cardiovascular disease in Qatar. Int J Clin Pharm 2013; 35: 101–112. [DOI] [PubMed] [Google Scholar]
- 18. Satman I, Imamoglu S, Yilmaz C. A patient‐based study on the adherence of physicians to guidelines for the management of type 2 diabetes in Turkey. Diabetes Res Clin Pract 2012; 98: 75–82. [DOI] [PubMed] [Google Scholar]
- 19. Cohen FJ, Neslusan CA, Conklin JE, et al Recent antihyperglycemic prescribing trends for US privately insured patients with type 2 diabetes. Diabetes Care 2003; 26: 1847–1851. [DOI] [PubMed] [Google Scholar]
- 20. Johansen K. Efficacy of metformin in the treatment of NIDDM. Meta‐analysis. Diabetes Care 1999; 22: 33–37. [DOI] [PubMed] [Google Scholar]
- 21. Bodmer M, Meier C, Krahenbuhl S, et al Metformin, sulfonylureas, or other antidiabetes drugs and the risk of lactic acidosis or hypoglycemia: a nested case‐control analysis. Diabetes Care 2008; 31: 2086–2091. [DOI] [PMC free article] [PubMed] [Google Scholar]
- 22. Almirall J, Briculle M, Gonzalez‐Clemente JM. Metformin‐associated lactic acidosis in type 2 diabetes mellitus: incidence and presentation in common clinical practice. Nephrol Dial Transplant 2008; 23: 2436–2438. [DOI] [PubMed] [Google Scholar]
- 23. Yki‐Jarvinen H. Thiazolidinediones. N Engl J Med 2004; 351: 1106–1118. [DOI] [PubMed] [Google Scholar]
- 24. Home PD, Pocock SJ, Beck‐Nielsen H, et al Rosiglitazone evaluated for cardiovascular outcomes in oral agent combination therapy for type 2 diabetes (RECORD): a multicentre, randomised, open‐label trial. Lancet 2009; 373: 2125–2135. [DOI] [PubMed] [Google Scholar]
- 25. Kim YG, Hahn S, Oh TJ, et al Differences in the glucose‐lowering efficacy of dipeptidyl peptidase‐4 inhibitors between Asians and non‐Asians: a systematic review and meta‐analysis. Diabetologia 2013; 56: 696–708. [DOI] [PubMed] [Google Scholar]
- 26. Kim W, Egan JM. The role of incretins in glucose homeostasis and diabetes treatment. Pharmacol Rev 2008; 60: 470–512. [DOI] [PMC free article] [PubMed] [Google Scholar]
- 27. Zhang Q, Rajagopalan S, Mavros P, et al Baseline characteristic differences between patients prescribed sitagliptin vs. other oral antihyperglycemic agents: analysis of a US electronic medical record database. Curr Med Res Opin 2010; 26: 1697–1703. [DOI] [PubMed] [Google Scholar]
- 28. Meier JJ. GLP‐1 receptor agonists for individualized treatment of type 2 diabetes mellitus. Nat Rev Endocrinol 2012; 8: 728–742. [DOI] [PubMed] [Google Scholar]
- 29. Scheen AJ. Drug‐drug and food‐drug pharmacokinetic interactions with new insulinotropic agents repaglinide and nateglinide. Clin Pharmacokinet 2007; 46: 93–108. [DOI] [PubMed] [Google Scholar]
- 30. Campbell LK, White JR, Campbell RK. Acarbose: its role in the treatment of diabetes mellitus. Ann Pharmacother 1996; 30: 1255–1262. [DOI] [PubMed] [Google Scholar]
- 31. Defronzo RA. Banting Lecture. From the triumvirate to the ominous octet: a new paradigm for the treatment of type 2 diabetes mellitus. Diabetes 2009; 58: 773–795. [DOI] [PMC free article] [PubMed] [Google Scholar]
- 32. Rhodes CJ. Type 2 diabetes‐a matter of beta‐cell life and death? Science 2005; 307: 380–384. [DOI] [PubMed] [Google Scholar]
Associated Data
This section collects any data citations, data availability statements, or supplementary materials included in this article.
Supplementary Materials
Table S1 ¦ Characteristics of study participants according to analysis of the use of antihyperglycemic medications in 2008
Table S2 ¦ Characteristics of study participants according to analysis of the use of antihyperglycemic medications in 2005
Table S3 ¦ Characteristics of study participants according to analysis of the use of antihyperglycemic medications in 2011
Table S4 ¦ Odds ratios for explanatory variables in logistic regression analysis for selected diabetes drug therapies in 2008
Table S5 ¦ Odds ratios for explanatory variables in logistic regression analysis for selected diabetes drug therapies in 2005