

Abstract
We propose a non-local model of DNA replication that takes into account the observed uncertainty on the position and time of replication initiation in eukaryote cell populations. By picturing replication initiation as a two-state system and considering all possible transition configurations, and by taking into account the chromatin’s fractal dimension, we derive an analytical expression for the rate of replication initiation. This model predicts with no free parameter the temporal profiles of initiation rate, replication fork density and fraction of replicated DNA, in quantitative agreement with corresponding experimental data from both S. cerevisiae and human cells and provides a quantitative estimate of initiation site redundancy. This study shows that, to a large extent, the program that regulates the dynamics of eukaryotic DNA replication is a collective phenomenon that emerges from the stochastic nature of replication origins initiation.
At the heart of genetic transmission, DNA duplication mechanisms are conserved among eukaryotes1. The core of the eukaryal replicative helicase, the MCM2-7 complex, is loaded around DNA in the form of an inactive head-to-head double hexamer (dh-MCM2-7) during the first phase (G1) of the proliferative cell cycle. During the following DNA synthetic (S) phase, a complex reaction, involving several replication factors, activates a fraction of dh-MCM2-7 to form a pair of divergent replication forks that unwind and replicate DNA until they meet with convergent forks assembled at adjacent initiation sites1,2,3,4. Initiation sites are called replication origins. Inactive dh-MCM2-7 at the start of S phase correspond to potential origins5,6,7,8,9. These may become activated later in S phase, or may be unloaded (inactivated) by progressing forks. The mechanisms that determine the location of potential and activated origins remain elusive10,11. While in S. cerevisiae, a unicellular eukaryote, origins are defined by a conserved DNA sequence motif 2, in metazoans no conserved sequence pattern is detected. However, in all eukaryotes the number of potential origins is higher than the number of fired ones5. The duration of S phase is finite and the DNA replication process must be completed within a reliable time. This constraint led to the assumption that origins firing is under the control of a deterministic program that regulates their rate and the spatio-temporal pattern of firing12,13. Recent experimental and theoretical works14,15,16,17 challenged this view and suggested that a stochastic firing of randomly distributed potential origins could also meet the temporal constraint imposed by the cell cycle as long as the rate of origin firing increases as S phase progresses5,16.
The majority of available mathematical and numerical models of DNA replication are founded on an analogy with a one-dimensional crystallization and growth process (KJMA model)18. This analogy allows to model replication dynamics by analyzing snapshots of the system to infer its evolution; this model describes the system’s changes of states but not its evolution16,17,18,19,20,21,22. Due to the atomistic and geometric nature of the KJMA model in its simplest form, the exact position of fired origins must be defined (localized) to describe the replication dynamics of surrounding regions and the effect of the origin firing propagates along the DNA via the emanating replication forks. Furthermore, in its simplest form, the KJMA model assumes the independence of firing among individual origins and in an arbitrary manner a temporal distribution of origin firing. Thus, these models of DNA replication are adequate to describe the replication process locally but cannot explain how it is influenced by the global compact conformation of the genome. In an effort to link the global conformation of the chromatin to the dynamic of replication, Gauthier & Bechhoefer23 developed a model that reproduces the temporal profile of the rate of origin firing by assuming (i) a sequence of three- and one-dimensional replication origin search process for a replication initiation trans-acting factor, and (ii) the independence of firing among individual origins. Along the same line, to reproduce the experimental profile of the rate of origin firing, Goldar et al.19 have assumed that this rate is regulated by the density of replication forks. The predictions of these models rely on the mechanistic ingredients used to describe the temporal changes of the rate of origin firing per time and per length of unreplicated DNA (I(t)).
In this paper, we explicitly introduce the unlocalized character of origin firing by picturing the firing process as a transition probability between two possible states (fired or not fired) for any potential origin. We describe the kinetics of replication by using a formal analogy between origin firing in a cell population and scattering process in inhomogeneous media24. This point of view does not require to know the exact position or distribution of replication origins along the genome and takes into account the effect of the compact conformation of the genome on the rate of origin firing. Our approach is thus complementary to existing ones: the KJMA model describes the state of a system, our non-local modeling describes the process that leads to the observed state. By considering the experimental observations that (i) dh-MCM2-7 act as potential origins (m0), (ii) a stochastic process governs their firing and (iii) by the end of S phase a finite number of potential origins (Ototal) have fired, we predict the temporal profile of the population-averaged number of fired origins as S phase progresses. The outcome of the developed model (i) is in good agreement with experimental observations of parameters describing the kinetics of DNA replication, (ii) confirms the adequacy of equilibrium globule picture to describe the budding yeast chromatin conformation and (iii) can be used to discriminate between two possible pictures to describe the chromatin conformation in human cells.
Results
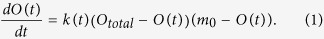
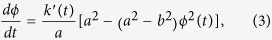
As biological observations are performed in a cell population, the genomic positions of potential or fired origins and their firing times are not univocally defined25. This leads us to assume that at the start of S phase, there exists a cloud of potential origins (m0 dh-MCM2-7 loaded on DNA during G1 phase) in each cell. Once the S phase starts, some of them transit from this inactive state to an active state (origin firing) until the end of the S phase where Ototal origins are supposed to have fired, leaving m0 − Ototal dh-MCM2-7 in inactive state. We call k(t) the rate of transition (per potential origin, per time unit and per cell) between the inactive and active state. For simplification, we do not distinguish between the loaded but inactive dh-MCM2-7 state and the unloaded state. Lygeros et al.26 have previously used the transition probability theory to model replication process in S. pombe. By distinguishing loaded but inactive potential origins and unloaded origins, these authors have defined 6 possible states for a potential origin. Here, we model the firing process distinguishing only between fired and non-fired origins. In this 2-state description, the rate of origin firing per cell is equal to the rate of transition, times the number of dh-MCM2-7 that are in inactive state, times the number of free locations in the active state as schematized in Fig. 1:
Figure 1. Non localized model of origin firing.
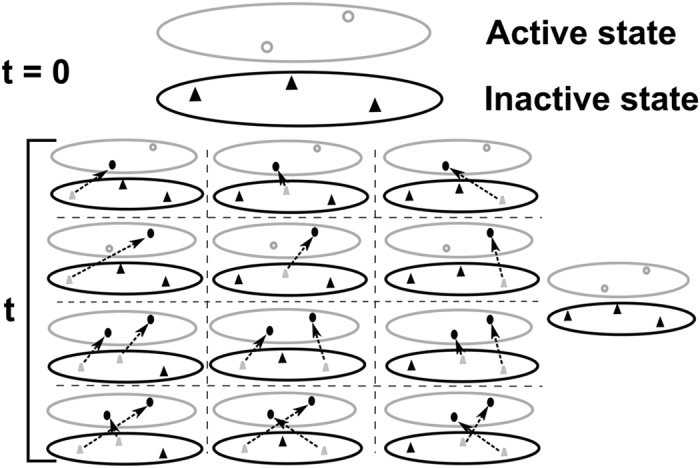
m0 dh-MCM2-7 complexes fill initially (t = 0) all positions of inactive state (filled black triangles). The active state is empty (Ototal open grey circles). At time t, these complexes can transit from inactive state to active state with individual probability rate ψ (dashed arrows). By the end of this process, one or several potential origins (filled grey triangles) have fired (filled black circles). However, as potential origins are indistinguishable and the position and the time of fired origins are variable from cell to cell, one cannot designate precisely which potential origin corresponds to which fired origin and one must consider all possible configurations.
 |
The non local picture of origin firing in a cell population depicted in Fig. 1 implies that each potential origin has the possibility to
explore all available configurations in the active state before filling one of them.
In other words, two observed fired origins at different times of S phase in a cell
population can originate from a common potential origin. Therefore, the calculation
of O(t) is formally similar to the determination of the scattering
amplitude in an inhomogeneous media (Supplementary material section 1), where the scattered intensity from two
distinct scatterers can originate from a common scatterer24. Using
this formal analogy and following Matsson’s treatment of the ligand
target interaction27, the proportion of origin firing per cell at
time t
 is represented as a Bethe-Salpeter like ladder graph
which after summation yields:
is represented as a Bethe-Salpeter like ladder graph
which after summation yields:
 |
where 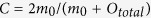 , and
, and  corresponds to
the transition probability of an isolated dh-MCM2-7 that is associated in this
picture with forward scattering amplitude (see Supplementary material for detailed derivation of Eq.
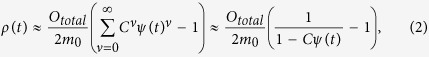
(2)). Note that while ψ(t) represents the
probability of origin firing of an isolated potential origin (low density behavior
of the system, meaning no interaction among fired origins),
ρ(t) corresponds to the probability of origin firing
considering the cellular context (high density behavior, meaning interaction among
fired origins). Direct insertion of Eq. (2) into Eq. (1) together with the change of variable
corresponds to
the transition probability of an isolated dh-MCM2-7 that is associated in this
picture with forward scattering amplitude (see Supplementary material for detailed derivation of Eq.
(2)). Note that while ψ(t) represents the
probability of origin firing of an isolated potential origin (low density behavior
of the system, meaning no interaction among fired origins),
ρ(t) corresponds to the probability of origin firing
considering the cellular context (high density behavior, meaning interaction among
fired origins). Direct insertion of Eq. (2) into Eq. (1) together with the change of variable  leads to the following compact evolution equation for the
observed dynamics of origin firing per cell (Supplementary material section 2):
leads to the following compact evolution equation for the
observed dynamics of origin firing per cell (Supplementary material section 2):
 |
where
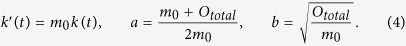 |
As ρ(t) is a probability, its values should be always positive, therefore only the forward solution of Eq. (3) has a physical meaning. Using the initial condition that at the start of S phase no origin has fired, we obtain the following general solution:
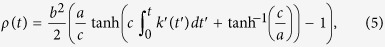 |
where  .
.
Rate of transition k(t)
k(t) represents the population-averaged transition rate between the
inactive and active states per potential origin. The firing of an origin
requires that trans-acting replication factors, that diffuse in the volume
defined by the compacted genome (chromatin), find and activate one of the
inactive dh-MCM2-7 complexes25 that are able to freely diffuse on
DNA28. Assuming that dh-MCM2-7 complexes are uniformly
distributed along the genome, the radius of the volume explored by a dh-MCM2-7
scales as  . Therefore, the probability
P0(t) to find at time t a dh-MCM2-7 complex
in the nuclear subspace filled by the chromatin is
. Therefore, the probability
P0(t) to find at time t a dh-MCM2-7 complex
in the nuclear subspace filled by the chromatin is 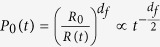 , where R0 is the characteristic size of the
dh-MCM2-7 and df is the chromatin’s fractal
dimension. The probability to find a trans-acting factor in the fractal
structure of chromatin29 at time t is proportional to
, where R0 is the characteristic size of the
dh-MCM2-7 and df is the chromatin’s fractal
dimension. The probability to find a trans-acting factor in the fractal
structure of chromatin29 at time t is proportional to
 , where dw is the
fractal dimension of the trans-acting replication factor’s random
walk30,31. Hence, the probability that in an elementary
volume at time t a trans-acting factor meets a dh-MCM2-7 is
, where dw is the
fractal dimension of the trans-acting replication factor’s random
walk30,31. Hence, the probability that in an elementary
volume at time t a trans-acting factor meets a dh-MCM2-7 is 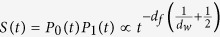 . Since the spatial distribution of both dh-MCM2-7 and
trans-acting factors are not homogeneous in the volume of the nucleus, the
transport process that leads to the encounter between these two actors cannot be
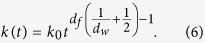
neglected. Thus, the rate of transition from inactive to active sites is no
longer a time constant k0 equal to the population averaged
probability of origin firing per potential origin and per cell, but it has to be
normalized by a fraction of the total number of dh-MCM2-7 and trans-acting
factor encounters during the time t:
. Since the spatial distribution of both dh-MCM2-7 and
trans-acting factors are not homogeneous in the volume of the nucleus, the
transport process that leads to the encounter between these two actors cannot be
neglected. Thus, the rate of transition from inactive to active sites is no
longer a time constant k0 equal to the population averaged
probability of origin firing per potential origin and per cell, but it has to be
normalized by a fraction of the total number of dh-MCM2-7 and trans-acting
factor encounters during the time t:  . This
leads to the following time dependence of the transition rate:
. This
leads to the following time dependence of the transition rate:
 |
Fraction of replicated DNA: f DNA (t)
To calculate fDNA(t), we use the analogy between
DNA replication and one-dimensional nucleation and growth phenomena18. In this analogy, the firing of a potential origin corresponds
to a nucleation event and the propagation of divergent replication forks at
constant velocity v to a growth event. Following Avrami32,
we consider the genome at an instant t, and assume that
O(t) origins have already fired. The probability that, at time
t, a particular locus of the genome is not covered by a particular
replicon is  , where
Lu(t) is the length of the unreplicated
genome. So the probability that it is not covered by any O(t)
replicons is
, where
Lu(t) is the length of the unreplicated
genome. So the probability that it is not covered by any O(t)
replicons is  . Assuming that
  , this probability becomes
  . Finally, the probability that a locus is covered at time t,
is just the fraction of replicated DNA:
. Finally, the probability that a locus is covered at time t,
is just the fraction of replicated DNA:
 |
where  . As firing of origins is an asynchronous
phenomenon, in reality
. As firing of origins is an asynchronous
phenomenon, in reality  , where i is an
index running over all fired origins. Each origin i fires and starts
growing at ti. We change the discrete sum on i
to a continuous integral over time (t) and considering that
, where i is an
index running over all fired origins. Each origin i fires and starts
growing at ti. We change the discrete sum on i
to a continuous integral over time (t) and considering that  , we get for
θext(t):
, we get for
θext(t):
 |
where L is the size of the genome.
Rate of origin firing per unreplicated length of DNA (I(t)) and fork density (N f (t))
I(t) is defined as the number of fired origins per unit of time and per unit of length of unreplicated DNA:
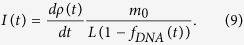 |
It is interesting to note the similarity between Eq. (9)
and the expression of I(t) derived by Gauthier and Bechhoefer
(Eq. (6) in ref. 23).
Both expressions of I(t) are obtained assuming that the
trans-acting replication factor diffuses in the volume defined by the chromatin.
However while here we consider the collective rate of origin firing  , in ref. 23, the authors
assume that the origins fire independently (see Supplementary material section 3, last
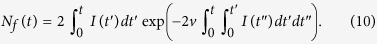
paragraph for more discussion). Following the expression of domain (replication
bubble) density calculated by Yang et al.33, the density
of replication forks is obtained under the following integral form:
, in ref. 23, the authors
assume that the origins fire independently (see Supplementary material section 3, last
paragraph for more discussion). Following the expression of domain (replication
bubble) density calculated by Yang et al.33, the density
of replication forks is obtained under the following integral form:
 |
Then by introducing Eqs (5) and (6) into Eqs (7, 8, 9, 10), we show that the dynamics of fDNA(t), I(t) and Nf(t) during the S phase can be completely characterized by the knowledge of 7 measurable parameters: m0, Ototal, df, dw, k0, v and L.
Recent technological developments have facilitated the access to the replication
dynamics of S. cerevisiae and H. sapiens and provide some reliable
quantitative estimates of our model parameters. S. cerevisiae has a
genome of length 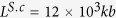 while the size of the haploid
human genome is ~280 times larger
while the size of the haploid
human genome is ~280 times larger 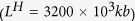 .
The number of dh-MCM2-7 complexes per cell has been estimated experimentally
both in S. cerevisiae
.
The number of dh-MCM2-7 complexes per cell has been estimated experimentally
both in S. cerevisiae
 34,35 and human HeLa cells
 36. In S. cerevisiae
on average
36. In S. cerevisiae
on average  origins are referenced to fire
systematically during a single S phase per cell37,38. In
contrast the number of systematically fired origins in a human cell population
is rather poorly known. Recent single-molecule15 and
genome-wide3,39 studies estimated that on average between
origins are referenced to fire
systematically during a single S phase per cell37,38. In
contrast the number of systematically fired origins in a human cell population
is rather poorly known. Recent single-molecule15 and
genome-wide3,39 studies estimated that on average between
 to
9.2 × 10⁴ origins fire
per cell cycle. The speed of fork progression was measured experimentally in
S. cerevisiae40 as
to
9.2 × 10⁴ origins fire
per cell cycle. The speed of fork progression was measured experimentally in
S. cerevisiae40 as  and
was deduced from single-molecule and genome-wide replication timing studies of
replicating HeLa cells15 to range between
vH = 0.8 and
3.5 kb.min−1. The geometrical
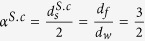
fractal dimension df and the dynamic fractal dimension
dw can be combined to define the spectral
dimension41
ds = 2df/dw.
The spectral dimension characterizes the power-law decay of the intra-chain
contact probability of a polymer as
and
was deduced from single-molecule and genome-wide replication timing studies of
replicating HeLa cells15 to range between
vH = 0.8 and
3.5 kb.min−1. The geometrical
fractal dimension df and the dynamic fractal dimension
dw can be combined to define the spectral
dimension41
ds = 2df/dw.
The spectral dimension characterizes the power-law decay of the intra-chain
contact probability of a polymer as  , where
s is the number of monomers along the chain41,42 and
, where
s is the number of monomers along the chain41,42 and
 . From the experimentally measured
distribution of the frequency of intra-chromosomal contact points, one can
extract ds. In the case of S. cerevisiae, it was
experimentally measured that43
. From the experimentally measured
distribution of the frequency of intra-chromosomal contact points, one can
extract ds. In the case of S. cerevisiae, it was
experimentally measured that43
 . As the conformation of the chromatin inside the
yeast nucleus can be reasonably considered to be an equilibrium globule44, hence
. As the conformation of the chromatin inside the
yeast nucleus can be reasonably considered to be an equilibrium globule44, hence  and so
  (normal diffusion). In HeLa, the observed the
intra-chromosome contact probability was observed to be inversely proportional
to the distance between the contact points45,
(normal diffusion). In HeLa, the observed the
intra-chromosome contact probability was observed to be inversely proportional
to the distance between the contact points45,  . In HeLa, two different models for chromatin
organization inside the nucleus were proposed. The first and historical
interpretation is to consider that the chromatin fiber is self-organized into a
long-lived, non-equilibrium unknotted conformation allowing easy opening and
closing of chromosomal regions over large distances in the nucleus45; this interpretation leads to model the chromatin as a
“crumple” or fractal globule44,45.
Following this model, as it is independently measured that in HeLa cells46,47
. In HeLa, two different models for chromatin
organization inside the nucleus were proposed. The first and historical
interpretation is to consider that the chromatin fiber is self-organized into a
long-lived, non-equilibrium unknotted conformation allowing easy opening and
closing of chromosomal regions over large distances in the nucleus45; this interpretation leads to model the chromatin as a
“crumple” or fractal globule44,45.
Following this model, as it is independently measured that in HeLa cells46,47
 (subdiffusion), we conclude that
  (see Dissussion). The second alternative
interpretation is based on the recent analysis of Hi-C data in different human
cell types by Boulos et al.48. By combining an integrative
analysis of epigenetic maps and Hi-C data, these authors have shown that the 3D
equilibrium globule model with
df = 3 and
dw = 2 provides a
comprehensive description of the Hi-C contact probability power-law exponent
(see Dissussion). The second alternative
interpretation is based on the recent analysis of Hi-C data in different human
cell types by Boulos et al.48. By combining an integrative
analysis of epigenetic maps and Hi-C data, these authors have shown that the 3D
equilibrium globule model with
df = 3 and
dw = 2 provides a
comprehensive description of the Hi-C contact probability power-law exponent
 observed in (i) embryonic stem cells as
the signature of an accessible and permissive genome structure possibly shaped
by pluripotency factors49, and (ii) somatic cells between gene
rich, early replicating euchromatin pairs of loci confirming that active
chromatin in differentiated cell lines is preferentially positioned in the
nuclear interior49,50. Importantly, Boulos et al.48 have further shown that Hi-C contact probability exponent
α ≤ 1 is indeed
observed in differentiated cells between gene poor, late replicating
heterochromatin pairs of loci as an indicator of the confining of this
lamina-associated heterochromatin to the nucleus periphery49,50,
consistent with the prediction of the 2D equilibrium globule model
df = 2,
dw ≥ 2
observed in (i) embryonic stem cells as
the signature of an accessible and permissive genome structure possibly shaped
by pluripotency factors49, and (ii) somatic cells between gene
rich, early replicating euchromatin pairs of loci confirming that active
chromatin in differentiated cell lines is preferentially positioned in the
nuclear interior49,50. Importantly, Boulos et al.48 have further shown that Hi-C contact probability exponent
α ≤ 1 is indeed
observed in differentiated cells between gene poor, late replicating
heterochromatin pairs of loci as an indicator of the confining of this
lamina-associated heterochromatin to the nucleus periphery49,50,
consistent with the prediction of the 2D equilibrium globule model
df = 2,
dw ≥ 2
 . Using this interpretation, we propose
that the observed replication signals result from the superposition of the
replication dynamics influenced by a 3-D and 2-D equilibrium globule
organization of the chromatin fibre. To find the proportion of each signals, we
follow the interpretation of Boulos et al.48 and assume
that the signal from 2-D equilibrium globule organization of the chromatin
represents only 38% of the total signal, representing the amount of chromatin
that interacts with the lamina in a constitutive manner51.
. Using this interpretation, we propose
that the observed replication signals result from the superposition of the
replication dynamics influenced by a 3-D and 2-D equilibrium globule
organization of the chromatin fibre. To find the proportion of each signals, we
follow the interpretation of Boulos et al.48 and assume
that the signal from 2-D equilibrium globule organization of the chromatin
represents only 38% of the total signal, representing the amount of chromatin
that interacts with the lamina in a constitutive manner51.
Now, using Eq. (5) and the boundary condition that by the
end of S phase (tend)  ,
we obtain
,
we obtain
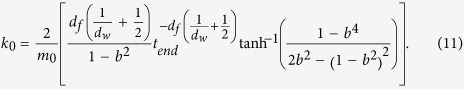 |
As during S phase, origins are fired in a continuous and irreversible manner52, and only once per cell cycle4, then 0 ≤ k0 ≤ +∞ and from Eq. (10), we find the following boundaries to ρ(tend):
 |
This inequality is verified for S. cerevisiae
 , indicating that
ρ(tend) almost saturates the
lower bound in Eq. (12). This observation turns out to be
also valid for HeLa cells where the comparison of our model predictions with the
replication dynamical data (see below) also selects an origin redundancy
, indicating that
ρ(tend) almost saturates the
lower bound in Eq. (12). This observation turns out to be
also valid for HeLa cells where the comparison of our model predictions with the
replication dynamical data (see below) also selects an origin redundancy
 with
with  ,
,
 and
and 
 . Knowing that
  53 and
  15, we get
 and
and  .
.
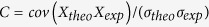
Our 7 model parameters being fixed, we use Eqs (5, 6, 7, 8, 9, 10) to numerically calculate fDNA(t), the flow cytometry (Facs) profiles, I(t) and Nf (t) for both S. cerevisiae and HeLa and compare the obtained theoretical profiles to recent experimental data reported in refs 15 and 53 respectively. As shown in Fig. 2, the agreement between theory and experiment is very good.
Figure 2. The open circles are experimental data and the solid lines are the calculated profiles.

3D equilibrium globule model of chromatin (black curve;
df = 3,
dw = 2) for S.
cerevisiae (data from Ma et al.53): (a)
Facs profile calculated from fDNA(t)53 (C = 0.94,
P < 10−10);
(b) I(t) (C = 0.87,
P < 10−10);
(c) Nf (t)
(C = 0.89,
P < 10−10).
Fractal globule model of chromatin (black curve;
df = 2.6,
dw = 2.6) for HeLa
(data from Guilbaud et al.15): (a’)
Facs profile (C = 0.94,
P < 10−10);
(b’) I(t)
(C = 0.94,
P = 5.5 × 10⁻¹²);
(c’) Nf (t),
(C = 0.96,
P = 3.5 × 10⁻²).
3D-2D equilibrium globule organization model of chromatin (red curve;
df = 3 (62%), 2 (38%),
dw = 2 see text) for
HeLa (data from Guilbaud et al.15):
(a’) Facs profile
(C = 0.97,
P < 10−10);
(b’) I(t)
(C = 0.96,
P = 1.5 × 10⁻²);
(c’) Nf (t),
(C = 0.93,
P = 6.3 × 10⁻²).
 is the Pearson linear correlation
coefficient.
is the Pearson linear correlation
coefficient.
Discussion
The success of this analysis sheds light particularly on two aspects of DNA
replication. First, we explicitly link the rate of origin firing to the global
conformation of chromatin and to the diffusion of replication factors inside the
nucleus. We find that for both considered organisms, the spectral dimension
ds ≥ 2,
suggesting that origin firing is only transiently regulated by the random encounter
of a transacting factor and a dh-MCM2-7 complex54. Furthermore, in
both cases the encounter probability S(t) decreases faster than
t−1, a behavior that is representative of non
compact exploration diffusion process (i.e. the number of sites explored by
the transacting factor is smaller than the number of sites present in the volume
defined by the chromatin)30. This is not surprising as only the
encounter of a transacting factor with an inactive dh-MCM2-7 that is still bounded
to a non replicated region of the genome can lead to the transition of the latter to
the active state. Second, the irreversibility of replication process involves that
the number of fired origins should at least represents half of the potential origins
per cell. Note that our model further suggests that if during the S phase less than
half of potential origins are used, the rate of transition k(t) would
have a dissipative component (k0 become a complex number) inducing
that by the end of S phase all the genome would not be replicated. The results
reported in Fig. 2(b,b’) provide a quantitative
estimate of origin redundancy8,9 in a single cell to  . We propose that the finite length of S phase applies an
evolutive pressure that fixes
. We propose that the finite length of S phase applies an
evolutive pressure that fixes  .
.
Profiles of I(t), Nf (t) and
fDNA(t) are sensitive to the origin usage,
but the shape of I(t) and Nf (t) are
particularly sensitive to df and
dw in both S. cerevisiae and Hela (Supplementary material section 4). Importantly,
our analysis confirms that the conformation of the chromatin in budding yeast can be
represented as an equilibrium globule44 in three dimensions
(df = 3,
dw = 2) (Fig. 3(a–d)), consistent with the observed power-law decay
of the intra-chromosome contact probability43 with exponent
 . The scarcity of experimental replication
data in Hela cells makes these data less selective for the estimate of
. The scarcity of experimental replication
data in Hela cells makes these data less selective for the estimate of  and
and  in human (Fig. 3(a’–d’)). This
explains that rather equal agreement of the replication data was obtained in Fig. 2(a’–c’) with both the
fractal globule model44,45 and the 3D-2D equilibrium globule
model48. The consistency in human somatic cells between
replication data and the compartmentalization of the genome into an early
replicating 3D equilibrium globule euchromatin organization in the nucleus interior
and a late replicating 2D equilibrium globule heterochromatin confined at the
nuclear envelop requires further investigation of new experimental data.
in human (Fig. 3(a’–d’)). This
explains that rather equal agreement of the replication data was obtained in Fig. 2(a’–c’) with both the
fractal globule model44,45 and the 3D-2D equilibrium globule
model48. The consistency in human somatic cells between
replication data and the compartmentalization of the genome into an early
replicating 3D equilibrium globule euchromatin organization in the nucleus interior
and a late replicating 2D equilibrium globule heterochromatin confined at the
nuclear envelop requires further investigation of new experimental data.
Figure 3. The open circles are experimental data and the solid lines are the calculated profiles.

S. cerevisiae (data from Ma et al.53): (a) I(t) and (b) Nf (t) for different values of the chromatin fractal dimension: df = 2 (red), 3 (black) and 2.5 (green). (c) I(t) and (d) Nf (t) for different values of the dynamics fractal dimension: dw = 1.5 (red), 2 (black) and 2.5 (green). HeLa (data from Guilbaud et al.15): (a) I(t) and (b) Nf (t) for different values of the chromatin fractal dimension: df = 2 (red), 2.6 (black) and 3 (green). (c) I(t) and (d) Nf (t) for different values of the dynamics fractal dimension: dw = 2 (red), 2.6 (black) and 3 (green).
To conclude, the existing models of DNA replication16,17,18,21,22 require an a priori knowledge of spatio-temporal map of origin firing, and the variability of the latter is treated as a small deviation from their population averaged values. Here, we explicitly consider the variability on the position and firing time distribution of origins in a cell population14,25 and use a non-local treatment to calculate their rate of firing. This allows us to develop an effective description of DNA replication dynamics using a physical analogy between origin firing and scattering phenomena in an inhomogeneous medium. One of the outcome of such a description is that this dynamics is self-referential. The self-reference arises because we consider the replication process in a cell population, demonstrating that the temporal pattern of DNA replication is emergent and not predefined as in the KJMA theory. Furthermore, the distributed nature of our analysis (Supplementary material, section 3), allows (i) linking the kinetics of observed proportion of fired origins (Eq. (5)) to the averaged rate of single origin firing by taking into account the global topology of the genome inside the cell nucleus through its spectral dimension and (ii) ties the individual probability of firing of an origin to their collective observed probability (Eq. (2)). Therefore this model is a macroscopic model that overpasses the detailed molecular mechanisms necessary to the firing of an origin and retains the minimal necessary steps of DNA replication that are conserved among eukaryotes.
Additional Information
How to cite this article: Goldar, A. et al. Deciphering DNA replication dynamics in eukaryotic cell populations in relation with their averaged chromatin conformations. Sci. Rep. 6, 22469; doi: 10.1038/srep22469 (2016).
Supplementary Material
Acknowledgments
This work was supported by ANR REFOPOL, ANR10 BLANC1615, ANR-10-LABX-54 MEMO LIFE ANR-11-IDEX-0001-02 PSL* Research University and EDFV4_104.Rev.
Footnotes
Author Contributions A.G. developed the model. A.G., A.A., B.A., F.A., A.R., G.G., N.P., M.K. and O.H. discussed the correctness and the biological relevance of the model and analyzed the data. A.G., A.A. and O.H. wrote the paper.
References
- DePamphilis M. L. & Bell S. D. Genome Duplication: concepts, mechanisms, evolution and disease (Garland Science, New York, 2011). [Google Scholar]
- Newlon C. S. & Theis J. F. The structure and function of yeast ARS elements. Curr. Opin. Genet. Dev. 3, 752–758 (1993). [DOI] [PubMed] [Google Scholar]
- Mesner L. D. et al. Bubble-seq analysis of the human genome reveals distinct chromatin-mediated mechanisms for regulating early- and late-firing origins. Genome Res. 23, 1774–1788 (2013). [DOI] [PMC free article] [PubMed] [Google Scholar]
- Siddiqui K., On K. F. & Diffley J. F. X. Regulating DNA replication in eukarya . Cold Spring Harb. Perspect. Biol. 5, a012930 (2013). [DOI] [PMC free article] [PubMed] [Google Scholar]
- Hyrien O., Marheineke K. & Goldar A. Paradoxes of eukaryotic DNA replication: MCM proteins and the random completion problem. Bioessays 25, 116–125 (2003). [DOI] [PubMed] [Google Scholar]
- Edwards M. C. et al. MCM2-7 complexes bind chromatin in a distributed pattern surrounding the origin recognition complex in xenopus egg extracts. J. Biol. Chem. 277, 33049–33057 (2002). [DOI] [PubMed] [Google Scholar]
- Harvey K. J. et al. CpG methylation of DNA restricts prereplication complex assembly in xenopus egg extracts. Mol. Cell. Biol. 23, 6769–6779 (2003). [DOI] [PMC free article] [PubMed] [Google Scholar]
- Lucas I., Chevrier-Miller M., Sogo J. M. & Hyrien O. Mechanisms ensuring rapid and complete DNA replication despite random initiation in xenopus early embryos. J. Mol. Biol. 296, 769–786 (2000). [DOI] [PubMed] [Google Scholar]
- Blow J. J. & Ge X. Q. A model for DNA replication showing how dormant origins safeguard against replication fork failure. EMBO Rep. 10, 406–412 (2009). [DOI] [PMC free article] [PubMed] [Google Scholar]
- Hyrien O. et al. From simple bacterial and archaeal replicons to replication N/U-domains. J. Mol. Biol. 425, 4673–4689 (2013). [DOI] [PubMed] [Google Scholar]
- Renard-Guillet C., Kanoh Y., Shirahige K. & Masai H. Temporal and spatial regulation of eukaryotic DNA replication: from regulated initiation to genome-scale timing program. Semin. Cell Dev. Biol. 30, 110–120 (2014). [DOI] [PubMed] [Google Scholar]
- Diffley J. F. Replication conrol: choreographing replication origins. Curr. Biol. 8, R771–R773 (1998). [DOI] [PubMed] [Google Scholar]
- Raghuraman M. K. et al. Replication dynamics of the yeast genome. Science a, 115–121 (2001). [DOI] [PubMed] [Google Scholar]
- Czajkowsky D. M., Liu J., Hamlin J. L. & Shao Z. DNA combing reveals intrinsic temporal disorder in the replication of yeast chromosome VI. J. Mol. Biol. 375, 12–19 (2008). [DOI] [PMC free article] [PubMed] [Google Scholar]
- Guilbaud G. et al. Evidence for sequential and increasing activation of replication origins along replication timing gradients in the human genome. PLoS Comput. Biol. 7, e1002322 (2011). [DOI] [PMC free article] [PubMed] [Google Scholar]
- Yang S. C.-H., Rhind N. & Bechhoefer J. Modeling genome-wide replication kinetics reveals a mechanism for regulation of replication timing. Mol. Syst. Biol. 6, 404 (2010). [DOI] [PMC free article] [PubMed] [Google Scholar]
- Retkute R., Nieduszynski C. A. & de Moura A. Dynamics of DNA replication in yeast. Phys. Rev. Lett. 107, 068103 (2011). [DOI] [PMC free article] [PubMed] [Google Scholar]
- Herrick J., Jun S., Bechhoefer J. & Bensimon A. Kinetic model of DNA replication in eukaryotic organisms. J. Mol. Biol. 320, 741–750 (2002). [DOI] [PubMed] [Google Scholar]
- Goldar A., Labit H., Marheineke K. & Hyrien O. A dynamic stochastic model for DNA replication initiation in early embryos. PLoS One 3, e2919 (2008). [DOI] [PMC free article] [PubMed] [Google Scholar]
- Goldar A., Marsolier-Kergoat M.-C. & Hyrien O. Universal temporal profile of replication origin activation in eukaryotes. PLoS One 4, e5899 (2009). [DOI] [PMC free article] [PubMed] [Google Scholar]
- de Moura A. P. S., Retkute R., Hawkins M. & Nieduszynski C. A. Mathematical modelling of whole chromosome replication. Nucleic Acids Res. 38, 5623–5633 (2010). [DOI] [PMC free article] [PubMed] [Google Scholar]
- Baker A., Audit B., Yang S. C.-H., Bechhoefer J. & Arneodo A. Inferring where and when replication initiates from genome-wide replication timing data. Phys. Rev. Lett. 108, 268101 (2012). [DOI] [PubMed] [Google Scholar]
- Gauthier M. G. & Bechhoefer J. Control of DNA replication by anomalous reaction-diffusion kinetics. Phys. Rev. Lett. 102, 158104 (2009). [DOI] [PubMed] [Google Scholar]
- Ishimaru A. Wave Propagation and Scattering in Random Media (Academic Press, New York, 1978). [Google Scholar]
- Aparicio O. M. Location, location, location: it’s all in the timing for replication origins. Genes Dev. 27, 117–128 (2013). [DOI] [PMC free article] [PubMed] [Google Scholar]
- Lygeros J. et al. Stochastic hybrid modeling of DNA replication across a complete genome. Proc. Natl. Acad. Sci. USA 105, 12295–12300 (2008). [DOI] [PMC free article] [PubMed] [Google Scholar]
- Matsson L. Response theory for non-stationary ligand-receptor interaction and a solution to the growth signal firing problem. J. Theor. Biol. 180, 93–104 (1996). [DOI] [PubMed] [Google Scholar]
- Remus D. et al. Concerted loading of MCM2-7 double hexamers around DNA during DNA replication origin licensing. Cell 139, 719–730 (2009). [DOI] [PMC free article] [PubMed] [Google Scholar]
- Arneodo A. et al. Multi-scale coding of genomic information: From DNA sequence to genome structure and function. Phys. Rep. 498, 45–188 (2011). [Google Scholar]
- De Gennes P. Kinetics of diffusion controlled processes in dense polymer systems. I. Nonentangled regimes. J. Chem. Phys. 76, 3316 (1982). [Google Scholar]
- Kopelman R. Rate processes on fractals: Theory, simulations, and experiments. J. Stat. Phys . 42, 185–200 (1986). [Google Scholar]
- Avrami M. Kinetics of phase change. I. General theory. J. Chem. Phys. 7, 1103–1112 (1939). [Google Scholar]
- Yang S. C.-H. & Bechhoefer J. How xenopus laevis embryos replicate reliably: investigating the random-completion problem. Phys. Rev. E. Stat. Nonlin. Soft Matter Phys. 78, 041917 (2008). [DOI] [PubMed] [Google Scholar]
- Wyrick J. J. et al. Genome-wide distribution of ORC and MCM proteins in S. cerevisiae: high-resolution mapping of replication origins. Science 294, 2357–2360 (2001). [DOI] [PubMed] [Google Scholar]
- Xu W., Aparicio J. G., Aparicio O. M. & Tavar S. Genome-wide mapping of ORC and MCM2p binding sites on tiling arrays and identification of essential ARS consensus sequences in S. cerevisiae. BMC Genomics 7, 276 (2006). [DOI] [PMC free article] [PubMed] [Google Scholar]
- Wong P. G. et al. CDC45 limits replicon usage from a low density of preRCS in mammalian cells. PLoS One 6, e17533 (2011). [DOI] [PMC free article] [PubMed] [Google Scholar]
- MacAlpine D. M. & Bell S. P. A genomic view of eukaryotic DNA replication. Chromosome Res. 13, 309–326 (2005). [DOI] [PubMed] [Google Scholar]
- Hawkins M. et al. High-resolution replication profiles define the stochastic nature of genome replication initiation and termination. Cell Rep. 5, 1132–1141 (2013). [DOI] [PMC free article] [PubMed] [Google Scholar]
- Picard F. et al. The spatiotemporal program of DNA replication is associated with specific combinations of chromatin marks in human cells. PLoS Genet. 10, e1004282 (2014). [DOI] [PMC free article] [PubMed] [Google Scholar]
- Sekedat M. D. et al. Gins motion reveals replication fork progression is remarkably uniform throughout the yeast genome. Mol. Syst. Biol. 6, 353 (2010). [DOI] [PMC free article] [PubMed] [Google Scholar]
- Rammal, G., R. & Toulouse. Random walks on fractal structures and percolation clusters. J. Phys. Lett. 44, L13–L22 (1983). [Google Scholar]
- Havlin S. & Ben-Avraham D. Diffusion in disordered media. Advances in Physics 36, 695–798 (1987). [Google Scholar]
- Duan Z. et al. A three-dimensional model of the yeast genome. Nature 465, 363–367 (2010). [DOI] [PMC free article] [PubMed] [Google Scholar]
- Mirny L. A. The fractal globule as a model of chromatin architecture in the cell. Chromosome Res. 19, 37–51 (2011). [DOI] [PMC free article] [PubMed] [Google Scholar]
- Lieberman-Aiden E. et al. Comprehensive mapping of long-range interactions reveals folding principles of the human genome. Science 326, 289–293 (2009). [DOI] [PMC free article] [PubMed] [Google Scholar]
- Weiss M., Elsner M., Kartberg F. & Nilsson T. Anomalous subdiffusion is a measure for cytoplasmic crowding in living cells. Biophys. J. 87, 3518–3524 (2004). [DOI] [PMC free article] [PubMed] [Google Scholar]
- Banks D. S. & Fradin C. Anomalous diffusion of proteins due to molecular crowding. Biophys. J. 89, 2960–2971 (2005). [DOI] [PMC free article] [PubMed] [Google Scholar]
- Boulos R. E., Drillon G., Argoul F., Arneodo A. & Audit B. Structural organization of human replication timing domains. FEBS Lett. 589, 2944–2957 (2015). [DOI] [PubMed] [Google Scholar]
- Julienne H., Audit B. & Arneodo A. Embryonic stem cell specific “master” replication origins at the heart of the loss of pluripotency. PLoS Comput. Biol. 11, e1003969 (2015). [DOI] [PMC free article] [PubMed] [Google Scholar]
- Julienne H., Zoufir A., Audit B. & Arneodo A. Human genome replication proceeds through four chromatin states. PLoS Comput. Biol. 9, e1003233 (2013). [DOI] [PMC free article] [PubMed] [Google Scholar]
- Meuleman W. et al. Constitutive nuclear lamina-genome interactions are highly conserved and associated with A/T-rich sequence. Genome Res. 23, 270–280 (2013). [DOI] [PMC free article] [PubMed] [Google Scholar]
- DePamphilis M. L. DNA Replication and Human Disease (Cold Spring Harbor Laboratory Press, 2006). [Google Scholar]
- Ma E., Hyrien O. & Goldar A. Do replication forks control late origin firing in saccharomyces cerevisiae? Nucleic Acids Res. 40, 2010–2019 (2012). [DOI] [PMC free article] [PubMed] [Google Scholar]
- Hwang S., Yun C.-K., Lee D.-S., Kahng B. & Kim D. Spectral dimensions of hierarchical scale-free networks with weighted shortcuts. Phys. Rev. E 82, 056110 (2010). [DOI] [PubMed] [Google Scholar]
Associated Data
This section collects any data citations, data availability statements, or supplementary materials included in this article.