

Abstract
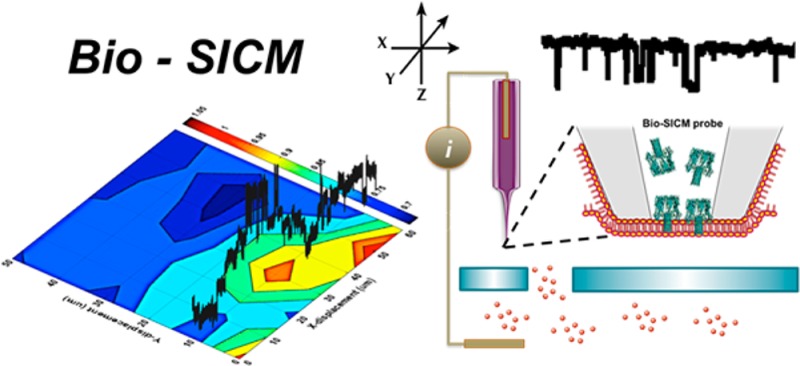
The utility of stochastic single-molecule detection using protein nanopores has found widespread application in bioanalytical sensing as a result of the inherent signal amplification of the resistive pulse method. Integration of protein nanopores with high-resolution scanning ion conductance microscopy (SICM) extends the utility of SICM by enabling selective chemical imaging of specific target molecules, while simultaneously providing topographical information about the net ion flux through a pore under a concentration gradient. In this study, we describe the development of a bioinspired scanning ion conductance microscopy (bio-SICM) approach that couples the imaging ability of SICM with the sensitivity and chemical selectivity of protein channels to perform simultaneous pore imaging and specific molecule mapping. To establish the framework of the bio-SICM platform, we utilize the well-studied protein channel α-hemolysin (αHL) to map the presence of β-cyclodextrin (βCD) at a substrate pore opening. We demonstrate concurrent pore and specific molecule imaging by raster scanning an αHL-based probe over a glass membrane containing a single 25-μm-diameter glass pore while recording the lateral positions of the probe and channel activity via ionic current. We use the average channel current to create a conductance image and the raw current–time traces to determine spatial localization of βCD. With further optimization, we believe that the bio-SICM platform will provide a powerful analytical methodology that is generalizable, and thus offers significant utility in a myriad of bioanalytical applications.
Introduction
Stochastic single-molecule nanopore sensing is a powerful analytical tool that measures the change in current generated by the reversible binding or translocation of a single molecule in a single nanopore.1−3 The technique offers an opportunity for developing extremely sensitive and selective biosensors.4−7 Stochastic nanopore sensing is a resistive-pulse,8 single-molecule detection technology that imparts advantages over existing sensor strategies, e.g., macro- or microscale biosensor,9−16 such as higher sensitivity, no loss of signal-to-noise at low analyte concentration, and better spatiotemporal resolution.2,8 The single-molecule sensitivity achievable and innate nanoscale pore size of biological nanopores (naturally occurring protein channels) show great promise for use in sensing and imaging devices. To date, protein channels have enabled sensitive detection of various analytes,6,17 ranging from small divalent metal ions18 to large single-stranded polynucleotides.19
As naturally occurring protein channels provide a means to creating reproducible nanometer-scaled pores, they can be integrated into scanned probe microscopy methods to enable quantitative chemical imaging with single-molecule sensitivity and selectivity. Specifically, protein channels can be incorporated into scanning ion conductance microscopy (SICM) to allow concomitant topography imaging as recently demonstrated by Zhou et al.20 Protein channels can also enable selective molecular flux mapping as shown here, which can elucidate important mechanistic and spatial information about, for example, specific cellular transport processes. Briefly, SICM is a surface-imaging technique that typically measures the current between two Ag/AgCl electrodes placed in an electrolyte-filled imaging probe and an external electrolytic bath.21,22 The potential bias applied between the two Ag/AgCl electrodes produces a steady-state current, which is influenced by the distance between the probe and the sample surface or changes in solution conductivity.23 The distance-dependent change in current creates a current-based feedback, which provides accurate positioning and control over the probe-substrate separation distance. The technique is thus able to provide measurement of localized ion transport across membranes and surface topography. SICM has been widely employed to study the morphology and physiology of biological samples,24−26 provide imaging of live cells,27 and study cell surface topography and cellular activities.27,28 Notably, a major advantage of the SICM technique is the ability to image the flux of inert ions moving in and out of a membrane, as well as noninvasively map their localization about a substrate surface.21,29 Coupling these positive attributes of SICM with the sensitive and specific detection abilities of protein channels augments the imaging capabilities of SICM by enabling high-resolution studies of specific molecular flux at surfaces.
In this report, we present a bioinspired scanning ion conductance microscopy (bio-SICM) approach capable of concurrent surface imaging and specific molecular flux mapping with sensitivity down to the single-molecule level. We achieve this by coupling stochastic nanopore sensing with SICM by building an imaging probe with embedded protein channels (Scheme 1). We demonstrate this technique using the well-studied protein channel α-hemolysin (αHL), which spontaneously self-assembles into a stable heptameric pore across a lipid bilayer.1,30 The lower part of the lumen comprises a β-barrel with two antiparallel strands3 constituting the transmembrane channel with an inner diameter of 1.4 nm at its narrowest point.30 Engineering of this β-barrel structure has led to the sensitive and selective detection of various analytes, such as divalent metal ions,18 organic molecules,3 explosive agents,31,32 enzyme complexes,33 cancer biomarker,34 nucleic acids,19,35 proteins,36 and neurotransmitters.37 Here, we employ this well-characterized α-hemolysin (αHL) channel as a representative protein nanopore to map the flux of β-cyclodextrin (βCD) molecules across a synthetic membrane as a proof-of-principle experiment. We demonstrate the feasibility of simultaneous pore imaging and molecular flux mapping with single-molecule sensitivity across a glass membrane containing a single micrometer-scale pore. While our current target molecule is βCD, the bio-SICM platform is generalizable and can be adapted in the detection of other target molecules by using any naturally occurring or engineered protein channel specific to a target of interest. We believe that this analytical methodology will find significant use in the areas of neuroscience and biology by providing spatial, chemical, and mechanistic information on important specific molecule transport processes.
Scheme 1. Bio-SICM Experimental Setup.
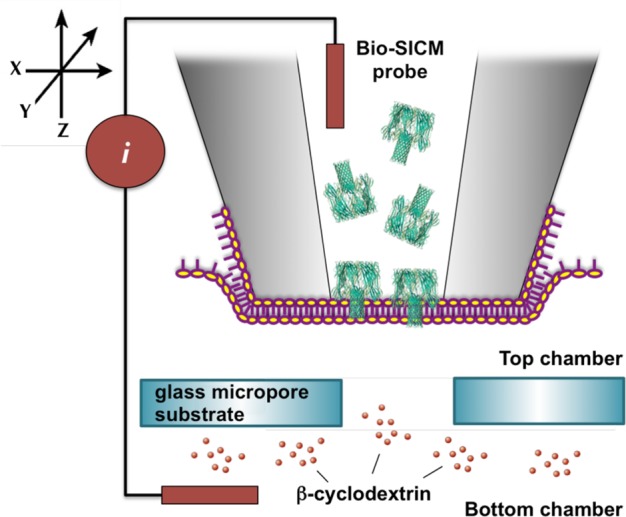
Setup comprises a Delrin top chamber filled with 1.0 M KCl–10.0 mM phosphate buffer (pH = 7.4) and a bottom chamber (a.k.a. glass micropore (d ∼ 25 μm) substrate) filled with 4.0 M KCl–10.0 mM phosphate buffer (pH = 7.4) solution. β-Cyclodextrin (βCD) or S7β-cyclodextrin (S7βCD) solution is added to the bottom chamber, while αHL in 1.0 M KCl–10.0 mM phosphate buffer (pH = 7.4) is added to the bio-SICM probe. In all experiments, potential is applied to the probe (WE) with respect to the electrolytic chamber (RE). Scheme is not drawn to scale.
Experimental Section
Chemicals and Materials
Potassium chloride (KCl), sodium phosphate dibasic dihydrate (Na2HPO4·2H2O), sodium phosphate monobasic dihydrate (NaH2PO4·2H2O), β-cyclodextrin (βCD), and heptakis(6-O-sulfo)-β-cyclodextrin heptasodium salt (S7βCD) were all purchased from Sigma (St. Louis, MO) and used as received. 10.0 mM phosphate buffer (pH = 7.4) was prepared by dissolving the appropriate amounts of the dibasic and monobasic phosphate salts in ultrapure water (Milli-Q ultrapure water purification system). 1,2-Diphytanoyl-sn-glycero-3-phosphocholine (DPhPC) was obtained from Avanti Polar Lipids (Alabaster, AL) and stored at −20 °C until use. α-Hemolysin lyophilized powder was purchased from Sigma and used as received without further purification.
Probe Fabrication
The bio-SICM probes were fabricated using a simple procedure that we have developed for pulling glass pipettes. Briefly, borosilicate glass capillaries (O.D. 1.5 mm; I.D. 0.86 mm) were heated while applying vacuum on both ends until the inner glass walls collapsed. The heated capillaries were then pulled using a Sutter P-87 flaming/brown micropipette puller (Novato, CA) to create pulled micropipettes with inner pore radii (ri) ranging 10.0–50.0 μm, outer pore radii (ro) ranging 200–250 μm, and pore length (Lp) of ∼1.0–2.0 mm (vide infra). The pulled micropipettes were characterized optically and via cyclic voltammetry using the current–voltage (I–V) response in a 1.0 M KCl solution. The probes were then cleaned by sequential rinses with ethanol and water and stored at room temperature. In some cases, the pulled probes were modified with 3-cyanopropyldimethylchlorosilane to facilitate stable and intact formation of the lipid bilayer.38 However, we find that the cyanosilane is not necessary for bio-SICM experiments.
Substrate Fabrication
A glass micropore substrate was created following a protocol by Zhang et al., with minor modifications.39 In brief, a 25 μm gold (Au) wire was sealed into a soda lime glass capillary (O.D. 1.65 mm; I.D. 1.10 mm), followed by polishing and characterization via cyclic voltammetry.40,41 Further etching and pulling of the Au wire out of the capillary created a single 25 μm pore at the bottom of the polished glass capillary (Figure S1, top panel, Supporting Information). The micropore substrate was characterized via cyclic voltammetry using the resistance generated through the pore in a 1.0 M KCl solution.38,42
Lipid Bilayer Membrane Formation
A lipid bilayer membrane was formed at the bottom of the bio-SICM probes using the tip-dip method described elsewhere.43,44 Briefly, the probe was first immersed into the aqueous electrolytic bath, followed by the addition of ∼0.5 μL DPhPC in n-decane (MD Biochemicals, LLC) near the probe tip at the air/water interface. The probe was then slowly pulled through the air/water interface to form a monolayer of lipid across the probe orifice. The probe was then reimmersed into the bath to form a highly resistive lipid bilayer membrane (Rb ∼ 100 GΩ). Successful bilayer formation was determined by continuously monitoring the ionic current during the tip-dip procedure, which drops to ∼0 A when a highly resistive bilayer successfully formed at the tip of the probe. To further test bilayer formation, a very high potential (±1 V) was routinely applied to induce electrical breakdown of the bilayer.7,38,45,46 After electrical breakdown, the bilayer was recreated at the probe tip and utilized for ion-channel recordings. All measurements reported herein were done at room temperature unless otherwise specified.
αHL Channel Formation and Single-Molecule Measurements
Insertion of αHL into a lipid bilayer membrane formed at the probe orifice was carried out by filling the probe with ∼100 nM αHL in 1.0 M KCl–10.0 mM phosphate buffer (pH = 7.4) and applying a positive pressure (∼27–30 mmHg) to facilitate faster rate of insertion into the lipid bilayer membrane.38 A potential bias was applied between the two Ag/AgCl electrodes placed inside the probe and the top chamber of the bio-SICM cell. An intact lipid bilayer does not permit current flow; thus, ionic current was monitored continuously throughout the experiment where successful αHL channel formation was indicated by a consistent quantized increase in the current signal. Single molecule measurements were performed after stable αHL channel formation, employing either βCD or the negatively charged, sulfonated derivative, S7βCD, in a 1.0 M KCl–10.0 mM phosphate buffer (pH = 7.4) solution. Continuous current–time data was collected and monitored for fluctuations (e.g., current blockades) to confirm detection of single βCD or S7βCD molecules by the αHL-based probe.
Concurrent Micropore Substrate and Specific Molecular Imaging
Imaging of the micropore was performed concurrently with mapping of cyclodextrin flux across the micropore substrate by utilizing both the average conductance and raw current–time traces showing spatial localization of βCD single binding events, respectively. Specifically, the bare and αHL-based probes were mounted into an in-house bio-SICM instrument comprising a Sutter MPC-385 3-axis Manipulator system (Novato, CA) and a Dagan Chem-Clamp low-noise potentiostat—both of which were interfaced to a PC via an in-house written LabVIEW program (National Instruments, Austin, TX). The probe was brought into proximity of the substrate after stable αHL channel formation and maintained at a constant distance from the surface to generate a nonmodulated DC ion current. The resulting ionic current was sensitive to the probe–substrate distance and, thus, acted as a feedback control to accurately direct the position of the probe. The distance-dependent current was used to generate negative-feedback approach curves. Following approach to the surface, the probe was raster-scanned over the single micropore substrate in the xy-plane while recording both the lateral position and the current–time response of the probe to simultaneously create a micropore image, as well as a map of βCD. All imaging scans were performed from the bottom left to top right. This was achieved by first scanning each pixel in the x direction in one line scan before returning to the starting x position and then stepping one pixel in the y direction and repeating.
Electrical Measurements
Probe characterization was performed using cyclic voltammetry in a 3 mL glass cell filled with 1 M KCl solution. A two-electrode setup (Ag/AgCl working and reference electrodes) was utilized on a CH Instruments 620D Electrochemical Workstation (CH Instruments, Austin, TX), scanned from −0.40 V to +0.40 V (vs Ag/AgCl) with a scan rate of 0.1 V/s. The reference electrodes were prepared via oxidation of Ag wires in a solution of sodium hypochlorite. One Ag/AgCl electrode was inserted into the bio-SICM probe while another into the ionic bath solution. Ion channel measurements were collected using a Dagan Chem-Clamp low-noise potentiostat (Minneapolis, MN) coupled to a PC using an in-house written LabVIEW program (National Instruments, Austin, TX). Current–time (i-t) recordings were collected at a constant applied potential. In all experiments reported, the probe acted as the working electrode (WE), while the reference electrode (RE) was placed on the external ionic bath. Hence, the potential was always applied to the Ag/AgCl electrode placed inside the probe in reference to the Ag/AgCl electrode positioned within the ionic chamber (Scheme 1).
Results and Discussion
In this study, we developed a bioinspired scanned probe microscopy platform (bio-SICM) (Scheme 1) that combines the single-molecule detection ability of αHL with the imaging ability of SICM. α-Hemolysin has become a good candidate for stochastic single-molecule detection5,17,47 and DNA sequencing4,19,35,47,48 owing to its reproducible and efficient pore-forming capability, robust structure, and ease of engineering its structure to allow detection of specific target molecules.7,36,37,49 For this reason, we chose αHL as our representative protein channel to establish the framework of the bio-SICM platform.
Pulled Pipettes Are Suitable for αHL Channel Reconstitution and Single-Molecule Measurements
Critical to the success of the bio-SICM measurements is the development of pipette probes that will have the ability to act as both a scanning probe for SICM measurements, as well as a microscale bilayer support for protein channel-based single-molecule measurements. As such, we developed a simple procedure for pulling pipettes using a micropipette puller. Using this procedure, resulting probes typically have an inner radius (ri) between 10 and 50 μm, outer radius (ro) between 200 and 250 μm, and pore length (Lp) between 1.0 and 2.0 mm. The pore radii were estimated using optical images (Figure 1, top) and I–V curves generated (Figure 1, bottom), where the pore resistance relates to the pore radius and length via the relationship (eq 1)
| 1 |
where Rp is the pore resistance (Ω) of a bare probe with no bilayer or protein channel embedded, Lp is the pore length (cm), κ is the conductivity of the solution (Ω–1cm–1), and ri is the inner pore radius (cm).50 Of note, the fabricated probes generally possessed thick inner glass walls (≤200 μm) to increase the mechanical stability of the probe (Figure 1, top, and Figure S1, second and third panels, Supporting Information). Consequently, this architecture permitted efficient lipid bilayer formation across the probe orifice without clogging, as well as prolonged protein-channel recordings during scanning without rupturing the membrane.
Figure 1.
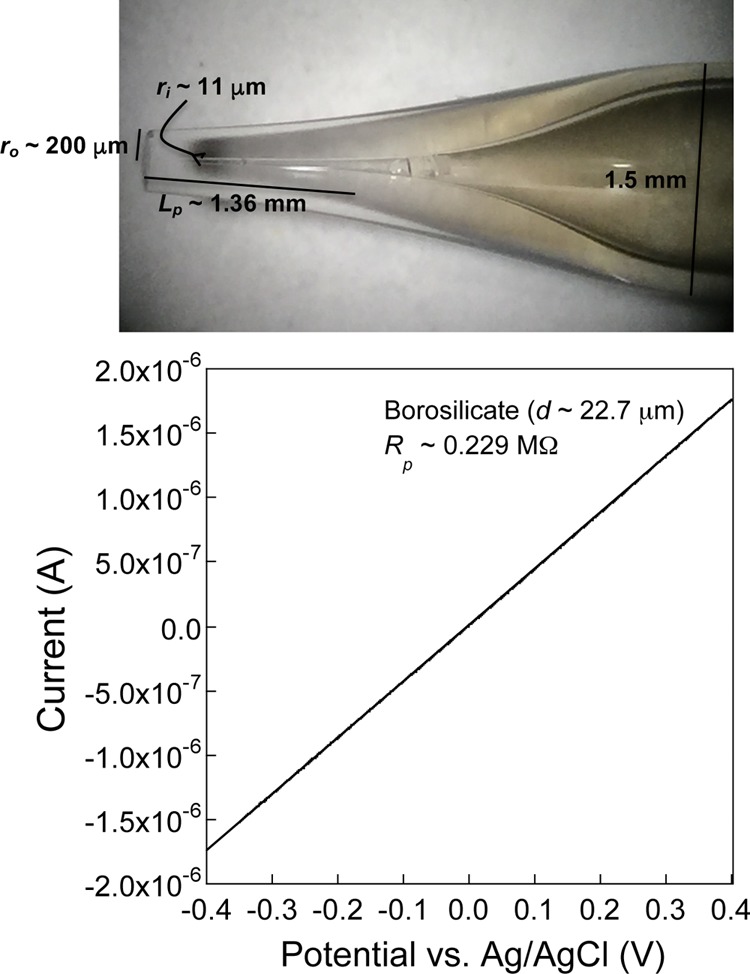
Bio-SICM technique utilizes pulled micropipettes as imaging probes. (Top) Optical image of a typical bio-SICM probe fabricated using a borosilicate glass capillary (O.D. 1.5 mm; I.D. 0.86 mm). The inner diameter (I.D.) of the pulled probe is optically estimated to be ∼22.7 μm, while the outer diameter (O.D.) is ∼400 μm. (Bottom) The ohmic current–voltage (I–V) response of the pulled micropipette probe, obtained using cyclic voltammetry in a 1.0 M KCl solution, suggests a pore size of about 20 μm.
To create a probe suitable for single-channel measurements, stable lipid bilayers were formed via the tip-dip method.43 In addition, the application of a small positive pressure (∼27–30 mmHg) on the back end of the probe facilitated a faster rate of protein insertion into the lipid bilayer membrane (Figure S2, top panel, Supporting Information).38 In the presence of an applied potential, an intact lipid bilayer is generally highly resistive (∼100 GΩ), exhibiting a current reading of ∼0 A. The insertion of αHL into the lipid bilayer membrane results in quantized increases in the current signal observed during the current–time trace (Figure 2). Literature indicates that αHL inserts into a lipid bilayer membrane via the trans side (the β-barrel stem).30 Because αHL was added inside the probe (100 nM in 1.0 M KCl–10.0 mM phosphate buffer, pH = 7.4), the αHL stem opening was exposed to the external bath (containing 1.0 M KCl–10.0 mM phosphate buffer, pH = 7.4), and so all reported potentials were applied on the cis side of the protein (vestibule) with respect to trans (stem). The αHL channel consistently exhibited non-ohmic behavior, or rectified channel conductance (Figure 2), when a positive potential was applied, as is consistent with literature reports.51 As a result, we observed a channel conductance (GαHL) of ∼0.7 nS, leading to a measured current of ∼53 pA (Vapp = +70 mV) and ∼43 pA (Vapp = +60 mV) for a single αHL channel. When multiple channels are present, the pore resistance (Rp) is a function of the number of αHL channels embedded in the lipid bilayer and is described by eq 2
| 2 |
where RαHL is the single channel resistance of αHL (Ω) and N is the total number of channels embedded in the lipid membrane. It should be noted that in some experimental instances, the pulled pipettes were silanized with a cyano-terminated silane prior to channel measurements to facilitate stable lipid bilayer formation as has been reported previously.38 Our experimental observations, however, demonstrate that both unsilanized (Figure 2) and silanized (Figure S2, bottom panel, Supporting Information) probes permit reconstitution of αHL into a lipid bilayer, and hence the imaging data reported herein was obtained using both silanized (Figure 5, top panel) and unsilanized probes (Figure 5, bottom panel).
Figure 2.
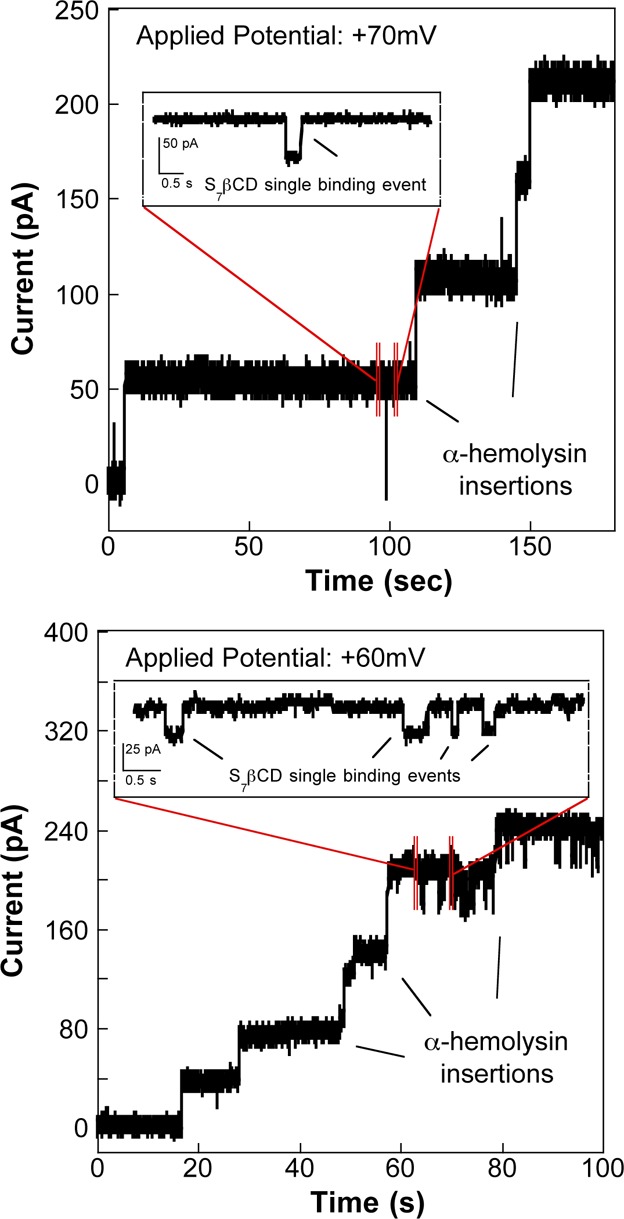
Insertion of αHL into a lipid membrane formed at the probe orifice using the tip-dip method shows an observed average conductance of ∼0.7 nS. (Top) The addition of 50 mM S7β-cyclodextrin (S7βCD) causes a characteristic blockade (∼80–90%) in the current signal (Vapp = +70 mV), which confirms the binding of a single S7βCD molecule to the αHL channel. (Bottom) Single-molecule measurements of 100 mM S7βCD with an applied potential of +60 mV show approximately 60–80% decrease in the current signal.
Figure 5.

Presence of βCD and S7βCD near and over a single 25 μm glass micropore substrate is mapped using bio-SICM with an αHL-based probe. (Top panel) 100 mM βCD is added to the bottom chamber with potential (+100 mV) applied to the probe with respect to the bottom chamber. Each pixel corresponds to a 10 μm step in both x- and y-directions (t = 30 s each pixel). (Bottom panel) 50 mM S7βCD is added to the bottom chamber with potential (+70 mV) applied to the probe with respect to the top chamber, where each pixel represents a 5 μm step in both x- and y-directions (t = 30 s each pixel). (Top and bottom panels, left) 2D contour plots of the micropore image using the average current (nA) yields ∼33% and ∼20% increase in the current signal, respectively, which denotes the location of the micropore. The black dashed lines represent line scans of the micropore location, where the raw current–time data for the selected areas are shown separately in the plots labeled A, B, C. (Top and bottom panels, plots A) Raw current–time traces of the selected area that is slightly away from the micropore. As expected, little to no cyclodextrin binding events are observed. (Top and bottom panels, plots B) Raw current–time traces taken right above the micropore (where βCD or S7βCD flux is strongest) show more binding of βCD or S7βCD to the αHL channel, as indicated by the higher frequency of current blockades. (Top and bottom panels, plots C) Raw current–time data collected after the probe has been moved away from the micropore. Little to no cyclodextrin binding events are recorded in this area of the substrate. These i-t curves demonstrate successful mapping of cyclodextrin flux across a single micropore substrate.
To demonstrate stochastic single-molecule detection, we employed either βCD or the negatively charged, sulfonated derivative, S7βCD, as representative target molecules. The cyclodextrins were added to the bottom chamber of the bio-SICM setup (Scheme 1). Cyclodextrins enter αHL through the trans side and reversibly bind to the lumen resulting in transient current blockades (∼60–80% for βCD;3 ∼80–90% for S7βCD38).3 As illustrated in the insets in Figure 2, the expanded current–time traces highlight single molecule binding events as indicated by current blockades (∼60–90%), demonstrating that single molecule detection with αHL is achievable using the pulled capillary probes.
Probe–Substrate Distance-Dependent Current Response Provides Feedback for bio-SICM Measurements
To demonstrate accurate control of the probe–sample distance, we monitored the distance-dependent ionic current through the probe using an in-house built bio-SICM instrument to generate negative-feedback approach curves (Figure 3). The total current (IT) measured in SICM is influenced by the total resistance (RT) (eq 3), which is a sum of the constant probe (Rp) and substrate membrane resistance (Rm), and the distance-dependent access resistance (Racc).23
| 3 |
Figure 3.
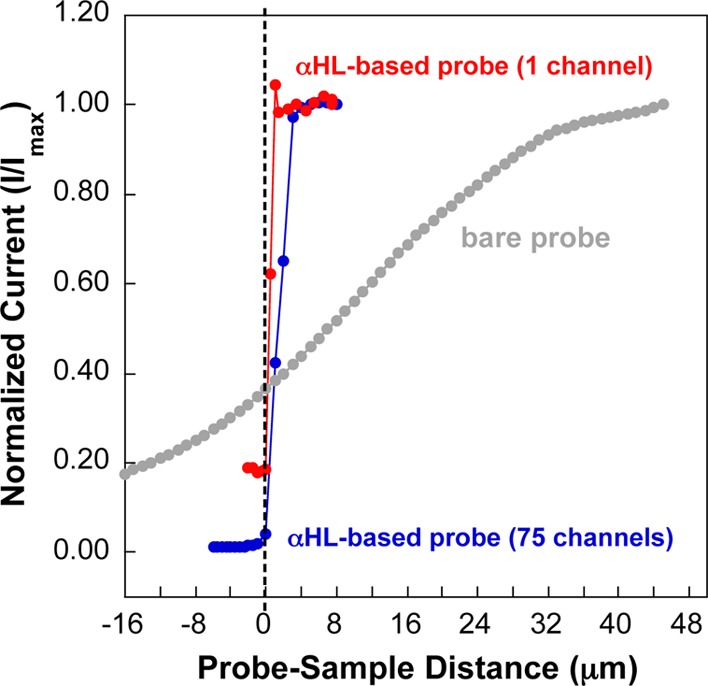
Shape of a negative feedback approach curve is a function of the number of αHL channels embedded in the lipid bilayer similar to a previous report.20 Approach curves generated using bare (without lipid bilayer and αHL) and αHL-based probes. The black dashed line indicates an approximated probe-sample distance of zero. Of note, as the probe approached the surface (as indicated by a decrease in current), we reduced the step size in order to slow down the approach.
The access resistance (Racc) is related to the probe outer and inner radii and probe–sample distance (d) and is estimated via the relationship (eq 4)
| 4 |
where ro is the outer probe radius (cm), ri is the inner probe radius (cm), κ is the conductivity of the solution (Ω–1 cm–1), and d is the probe–sample distance (cm).52 In the case of an αHL-based probe, the protein channel resistance (RαHL ∼ 1.4 GΩ for one channel)51 represents Rp, which is described by eq 2 and is determined by the number of αHL channels embedded in the lipid bilayer following a resistors-in-parallel model. Maximum current signals are obtained when the probes were positioned far away from the insulating substrate (> ∼7 μm). As the probes approached the insulating surface, ionic current was impeded causing an increase in Racc between the probes and the substrate, resulting in decreased ionic currents measured for the bare (Figure 3, gray curve) and αHL-based probes (Figure 3, blue and red curves). Consistent with a previous report by Baker and colleagues,20 we observed a much steeper approach for the αHL-based probes than the bare probe (without αHL and bilayer) as a result of the nonlinear relationship between the normalized current (at a given probe–sample distance, d) and the inner diameter of the probe (eq 4) presumed to be directly proportional to the number of αHL embedded in the bilayer. As such, smaller ri results in higher access resistance, which requires a larger change in resistivity to measure appreciable changes in current. For example, the probe with ∼75 channels (Figure 3, blue curve) exhibited a less steep approach than the probe with only 1 channel (Figure 3, red curve), indicating that a higher number of protein channels detected the insulating surface at a greater probe–sample distance, conforming to what was predicted previously.20 Of note, the step size needed to resolve an approach curve with a single channel falls below what is achievable with our present piezo positioners. Furthermore, the currents measured did not always reach zero when the probes approached the surface for both the bare probe and the αHL-based probes. This observation can be ascribed to the large outer diameter of the probe and leakage current occurring as a result of any tilt of the probe and/or substrate. The tilt of the probe (or substrate) prohibits a completely orthogonal approach and, thus, makes it difficult to determine the actual position that corresponds to d = 0. For the probes containing protein channels, the position d = 0 is set based on the minimal current response observed.20,23 The d = 0 point for the bare probe is arbitrarily set to the point at which the approach curve appears to deviate from what is expected for a negative feedback approach curve.23,50 While this point is not meant to be exact, what the reader should take away is the difference in the shape of the approach curves between bare probes and αHL-based probes as predicted by eqs 3 and 4.
The bio-SICM Approach Enables Simultaneous Imaging of a 25-μm-Diameter Pore and Mapping of Specific Molecules
We demonstrate the chemical imaging ability of the bio-SICM platform by performing a 2D raster scan (in the x,y-plane) over a glass membrane substrate containing a single 25-μm-diameter pore at a constant probe–substrate separation distance (z). We utilized αHL-based probes with different numbers of channels embedded in the lipid bilayer to image a single 25 μm pore substrate (Figure 4) while simultaneously mapping the presence of cyclodextrin molecules near, or at, the pore opening (Figure 5). Cyclodextrins (100 mM βCD or 50 mM S7βCD) were always added to the bottom chamber containing 4.0 M KCl–10.0 mM phosphate buffer, pH = 7.4 (Scheme 1), which created a cyclodextrin concentration gradient above the pore (Figure S3, bottom right, Supporting Information). Each pixel of the image, or step, in the raster scan corresponds to current–time data collected over a period of ∼30 s.
Figure 4.

Imaging of a single 25-μm-diameter pore in a glass membrane is accomplished using αHL-based probes. (Top left) Line scans obtained using the average current (nA) of an αHL-based probe with approximately 5 channels. Greater than 100% increase in the current (bold curve) signifies the location of the 25 μm pore, which suggests that the probe is very close to the substrate. (Top right) Contour plot displaying the image of the micropore substrate using the average current (nA) of an αHL-based probe with 5 channels. Each pixel corresponds to a 10 μm step in both x- and y-directions. (Bottom left) Line scans using the average current (nA) of an αHL-based probe with about 40 channels inserted into the lipid bilayer membrane. Approximately 20% increase in the current signal (bold curve) indicates that the probe is farther away from the substrate. (Bottom right) Contour plot showing an image of the 25 μm pore substrate using the average current (nA) of the αHL-based probe with 40 channels. Each line scan is matched to its corresponding y-pixel via the colored insets (showing symbols and colors matching the line scans) overlaid in the contour plot.
Imaging a single 25-μm-diameter pore substrate was accomplished using the average channel conductance of αHL-based probes. The substrate glass membrane containing the 25-μm-diameter pore separated asymmetric electrolyte solutions and was housed in an in-house designed Delrin chamber. Since the radius of the unmodified probe without bilayer and the radius of the pore substrate have comparable dimensions (which limits resolution),53 we employed asymmetric salt conditions for ease of locating the pore substrate prior to lipid bilayer formation and protein insertion. The resulting KCl concentration profile (Figure S3, bottom left, Supporting Information) resulting from the net flux of KCl from the bottom chamber23,54 leads to an increase in solution conductivity (κ) at the pore opening. Ultimately, this increase in conductivity leads to larger transmembrane ionic currents,29 which provides feedback to detect and image the location of the 25 μm pore. During the bio-SICM measurements, we observed higher ionic currents near or above the pore with respect to the bulk solution as a consequence of both decreased solution resistance and decreased access resistance resulting from the protein channels being in position above the pore substrate (the pore substrate is ∼1000-fold larger in diameter than the protein channels). To estimate the separation distance between the probe and the substrate, we can assume that the probe current is dominated by the resistance of the protein channels when the probe is over the pore and any contribution from access resistance is eliminated. We can then compare the current observed over the pore to that observed far away from the pore and substrate (again no access resistance). For example, in Figure 4 top, we observe a maximum current of ∼700 pA when the probe is directly over the pore, which is a ∼3-fold increase over what is observed when the probe is far from the substrate and pore (∼220 pA corresponding to 5 αHL channels). In this experiment, we were working with asymmetric salt conditions, and thus, the concentration of KCl should be greater at or above the pore opening. Again, protein channel conductance is the only contributor to the measured current when the probe is over the pore and this conductance is related to ion concentration. We can now predict the KCl concentration profile above the pore and estimate when we would expect a 3-fold increase in concentration as previously reported23,54 (see Figure S3 bottom left, Supporting Information). Given that our lower compartment contained 4 M KCl and the top chamber contained 1 M KCl, we estimate that the concentration of KCl will be 3 M at a distance of 5 μm from the substrate surface. For a point of comparison, we would expect only ∼8–10% change in current based on changes in solution conductivity alone at a distance of 500 nm from the substrate. We obtained line scans and pore images (Figure 4, top and bottom right panels) by using the average current generated for each pixel (10 μm step), where the standard deviations represent the variability in the current measurements for a time period of 30 s. Imaging is achievable using αHL-based probes with different numbers of protein channels embedded in the bilayer. For example, probes with 5 channels (Figure 4, top) and 40 channels (Figure 4, bottom) are both able to resolve the pore. In addition to the channel-based imaging experiments, we also performed 2D imaging of the pore using a bare probe (without a bilayer) that exhibited ∼10% increase in the ionic current near the pore presumably from the increase in solution conductivity arising from the increased KCl concentration (Figure S4, Supporting Information).
Critical to the success of each of the experiments described above is that the number of proteins embedded in the lipid bilayer remains constant throughout the entire imaging scan. While we exhibited some control over protein insertion via the application of a transmembrane pressure (Figure S2 top panel, Supporting Information), we cannot eliminate the possibility of more channels inserting. The insertion of channels during imaging experiments should affect the image resolution, as each channel insertion increases ri of the imaging probe, thus reducing the sensitivity of the measured current to the probe–substrate separation distance. Conversely, the increase in the number of proteins embedded in the lipid bilayer while recording channel activity will potentially have minimal detrimental effect on the specific molecule imaging ability. A report by Ervin et al.55 suggests that the increase in the number of proteins embedded in a lipid bilayer increases the rate of single molecule binding events and, thus, increases the sensitivity of the measurement without significantly increasing the signal complexity. The latter point is a result of the unlikely probability of multiple channels being occupied by a single molecule simultaneously particularly after ∼4 channels. While it is ideal that the number of channels embedded in the lipid bilayer remains constant during imaging, changes in the number of channels can be accounted for.
The resolution of each image is a convolution of the probe–substrate separation distance, the geometry of the imaging probe, and the number of channels embedded at the end of the probe. For example, the αHL-based probe with 5 channels (Figure 4, top left) was constructed using a borosilicate glass with O.D. = 1.0 mm, I.D. = 0.3 mm, and had a longer taper when it was pulled (Lp ∼ 1.5 mm), resulting in a smaller outer probe diameter (ro ∼ 120 μm) (Figure S1, bottom right, Supporting Information). The probe with 40 channels (Figure 4, bottom left), on the other hand, was fabricated using a borosilicate glass with O.D. = 1.5 mm, I.D. = 0.86 mm, and had a shorter taper when pulled (Lp ∼ 1.0 mm), producing a bigger outer probe diameter (ro ∼ 270 μm) (Figure S1, bottom left, Supporting Information). Image resolution as a function of the number of protein channels represents a compromise between experimental ease and spatial resolution. Specifically, image resolution is anticipated to worsen with increasing number of channels inserted. As the number of channels increases, so does ri, which leads to a decrease in the sensitivity of access resistance (Racc) on separation distance (d) (eq 4). An increase in the number of protein channels embedded in the lipid bilayer, however, leads to an increase in the overall measured current and signal-to-noise ratios facilitating bio-SICM measurements. We are currently investigating the quantitative relationship between the number of channels and image resolution. Another confounding factor affecting image resolution is the motion of the imaging probe. In all the images obtained, we observe an asymmetric conductivity profile in the x direction (the main rastering direction of the probe). Because the pore substrate opening is circular (Figure S1 top panel, Supporting Information), we believe that the smearing of the image is a result of the probe motion.
The bio-SICM is capable of imaging βCD and S7βCD flux across a glass membrane containing a 25 μm micropore with single-molecule resolution. We demonstrate this ability by mapping the presence of cyclodextrin molecules near and above a single 25 μm orifice simultaneously with conductance-based pore imaging as described above. We employed two representative target molecules, βCD and S7βCD, both of which were expected to enter αHL from the trans side and bind reversibly to the lumen of the channel. When the cyclodextrin enters the lumen, it produces transient current blockades. The frequency of the transient blockades is proportional to the concentration of cyclodextrin detected at the imaging probe.2,3
We conducted our molecular mapping experiments at two pixel resolutions, the first one at 10 μm steps with 100 mM βCD and the second one at 5 μm steps using 50 mM S7βCD as target. In the former case, an αHL-based probe was raster scanned over a single 25-μm pore (Figure 5, top panel) as indicated by a ∼33% increase in the ionic current (Figure S5, top panel, Supporting Information). The latter setup (Figure 5, bottom panel), on the other hand, exhibited a ∼20% increase in the measured current (Figure S5, bottom panel, Supporting Information), suggesting that the probe was farther away from the substrate surface. In both cases, the 2D pore images (Figure 5, top and bottom panels, left) were generated using the average probe current over 30 s, which was further analyzed for evidence of single βCD or S7βCD binding events by looking at the individual raw current–time trace for each selected pixel (A, B, C) at the indicated location (black dashed lines). In particular, pixels A and C represent areas of the substrate when the probe was away from the estimated location of the pore, while pixel B denotes a probe position above the substrate pore opening. At the beginning of the scan, the probe was far from the pore in the x,y-plane; hence, little to no cyclodextrin binding events were detected (Figure 5, top and bottom panels, plots A). When the probe was moved closer to the pore substrate where cyclodextrin flux is higher, the current–time trace displayed transient current blockades (∼60–90%), signifying binding of single βCD or S7βCD molecules to the αHL channel (Figure 5, top and bottom panels, plots B). As the probe was moved farther away from the pore, the binding events were no longer observed as expected (Figure 5, top and bottom panels, plots C). Notice, however, that we observed fewer binding events in the latter set of scanning data as opposed to the former (Figure 5, top and bottom panels, Plots B). This is a result of a larger probe–sample distance as indicated by the lower percent current change near the pore (∼20% vs ∼33%), as well as a lower concentration of cyclodextrin that was added to the bottom chamber—both of which result in lower cyclodextrin concentration in the region of the probe. Consequently, less binding of S7βCD molecules to the αHL channel was observed. Nonetheless, these results illustrate successful mapping of the cyclodextrin flux across a single micropore substrate, showing spatial localization of the cyclodextrin targets with single-molecule sensitivity.
Despite the fact that imaging was performed at lower resolutions (10 μm and 5 μm steps) than what is achievable by state-of-the-art SICM measurements,56,57 our preliminary work presents the first demonstration of concurrent topography imaging and specific molecular flux mapping across a membrane using a protein channel-based SICM approach. This opens up a number of research opportunities in the realm of SICM imaging. When further optimized, we believe that the bio-SICM platform will provide a robust analytical methodology that is generalizable, and can easily be adapted in the detection and mapping of a wide range of biologically relevant target molecules by using protein channels specific to the target. It is important to note, however, that we only showed qualitative mapping of the cyclodextrin flux for the purpose of demonstration. We are actively pursuing quantification of specific molecular flux across synthetic membranes enabled by the bio-SICM platform, as well as improving the method by imaging at higher spatial resolutions over microporous membranes to mimic more realistic applications, such as cell-to-cell communication and signal transduction processes.
Conclusion
In this report, we introduced a bioinspired scanning ion conductance microscopy (bio-SICM) method by combining the positive attributes of SICM with the chemical selectivity and sensitivity afforded by the nanoscale geometries of biological nanopores or protein channels. We demonstrated the feasibility of simultaneous conductance-based imaging and specific molecular mapping with the sensitivity and spatial resolution needed to detect the flux of specific molecules across synthetic membranes. We demonstrated the suitability of protein channels to serve as bio-SICM probes with chemical selectivity and sensitivity down to the single-molecule level that adds to the growing analytical toolbox enabled by biological nanopore-based sensors. A clear advantage of the bio-SICM platform is that using protein channel activity allows the technique to provide more than just surface topography or inert ion flux information via probe conductance. In particular, the technique extends its imaging capabilities to include selective chemical information, such as the presence of specific molecules, in combination with the spatial resolution it typically provides by using channel activity. We believe that the bio-SICM approach will provide a universal analytical methodology that will enable selective, chemical imaging of a wealth of previously unattainable target molecules and, thus, can lead to significant improvements in the field of SICM imaging.
Acknowledgments
Research reported in this publication was supported by the UMBC Startup and the National Institute of Mental Health of the National Institutes of Health under award number R21MH101692. In addition, work was supported through NIH/NIGMS T32GM066706 CBI grant (K. Radtke; F. C. Macazo) at the University of Maryland Baltimore County (UMBC).
Supporting Information Available
The Supporting Information is available free of charge on the ACS Publications website at DOI: 10.1021/jacs.5b13252.
Optical Images, theoretical calculations, raw current–time traces and line scans (Figures S1–S5) as noted in the text (PDF)
The authors declare no competing financial interest.
Supplementary Material
References
- Bayley H.; Braha O.; Gu L. Q. Adv. Mater. 2000, 12, 139.. [DOI] [Google Scholar]
- Bayley H.; Cremer P. S. Nature 2001, 413, 226. 10.1038/35093038. [DOI] [PubMed] [Google Scholar]
- Gu L.-Q.; Braha O.; Conlan S.; Cheley S.; Bayley H. Nature 1999, 398, 686. 10.1038/19491. [DOI] [PubMed] [Google Scholar]
- Branton D.; Deamer D. W.; Marziali A.; Bayley H.; Benner S. A.; Butler T.; Di Ventra M.; Garaj S.; Hibbs A.; Huang X.; et al. Nat. Biotechnol. 2008, 26, 1146. 10.1038/nbt.1495. [DOI] [PMC free article] [PubMed] [Google Scholar]
- Liu A.; Zhao Q.; Guan X. Anal. Chim. Acta 2010, 675, 106. 10.1016/j.aca.2010.07.001. [DOI] [PubMed] [Google Scholar]
- Majd S.; Yusko E. C.; Billeh Y. N.; Macrae M. X.; Yang J.; Mayer M. Curr. Opin. Biotechnol. 2010, 21, 439. 10.1016/j.copbio.2010.05.002. [DOI] [PMC free article] [PubMed] [Google Scholar]
- Macazo F. C.; White R. J. Anal. Chem. 2014, 86, 5519. 10.1021/ac500832a. [DOI] [PMC free article] [PubMed] [Google Scholar]
- Bayley H.; Martin C. R. Chem. Rev. 2000, 100, 2575. 10.1021/cr980099g. [DOI] [PubMed] [Google Scholar]
- Robinson D. L.; Hermans A.; Seipel A. T.; Wightman R. M. Chem. Rev. 2008, 108, 2554. 10.1021/cr068081q. [DOI] [PMC free article] [PubMed] [Google Scholar]
- Xiao N.; Venton B. J. Anal. Chem. 2012, 84, 7816. 10.1021/ac301445w. [DOI] [PMC free article] [PubMed] [Google Scholar]
- Dale N.; Frenguelli B. G. Purinergic Signalling 2012, 8, 27. 10.1007/s11302-011-9273-4. [DOI] [PMC free article] [PubMed] [Google Scholar]
- Frenguelli B.; Llaudet E.; Dale N. J. Neurochem. 2003, 86, 1506. 10.1046/j.1471-4159.2003.01957.x. [DOI] [PubMed] [Google Scholar]
- Llaudet E.; Hatz S.; Droniou M.; Dale N. Anal. Chem. 2005, 77, 3267. 10.1021/ac048106q. [DOI] [PubMed] [Google Scholar]
- Tian F.; Gourine A. V.; Huckstepp R. T.; Dale N. Anal. Chim. Acta 2009, 645, 86. 10.1016/j.aca.2009.04.048. [DOI] [PubMed] [Google Scholar]
- Macazo F. C.; Karpel R. L.; White R. J. Langmuir 2015, 31, 868. 10.1021/la504083c. [DOI] [PMC free article] [PubMed] [Google Scholar]
- Liu J.; Morris M. D.; Macazo F. C.; Schoukroun-Barnes L. R.; White R. J. J. Electrochem. Soc. 2014, 161, H301. 10.1149/2.026405jes. [DOI] [Google Scholar]
- Haque F.; Li J.; Wu H.-C.; Liang X.-J.; Guo P. Nano Today 2013, 8, 56. 10.1016/j.nantod.2012.12.008. [DOI] [PMC free article] [PubMed] [Google Scholar]
- Braha O.; Walker B.; Cheley S.; Kasianowicz J. J.; Song L.; Gouaux J. E.; Bayley H. Chem. Biol. 1997, 4, 497. 10.1016/S1074-5521(97)90321-5. [DOI] [PubMed] [Google Scholar]
- Kasianowicz J. J.; Brandin E.; Branton D.; Deamer D. W. Proc. Natl. Acad. Sci. U. S. A. 1996, 93, 13770. 10.1073/pnas.93.24.13770. [DOI] [PMC free article] [PubMed] [Google Scholar]
- Zhou Y.; Bright L. K.; Shi W.; Aspinwall C. A.; Baker L. A. Langmuir 2014, 30, 15351. 10.1021/la504097f. [DOI] [PMC free article] [PubMed] [Google Scholar]
- Chen C.-C.; Zhou Y.; Baker L. A. Annu. Rev. Anal. Chem. 2012, 5, 207. 10.1146/annurev-anchem-062011-143203. [DOI] [PubMed] [Google Scholar]
- Hansma P.; Drake B.; Marti O.; Gould S.; Prater C. Science 1989, 243, 641. 10.1126/science.2464851. [DOI] [PubMed] [Google Scholar]
- Chen C.-C.; Baker L. A. Analyst 2011, 136, 90. 10.1039/C0AN00604A. [DOI] [PubMed] [Google Scholar]
- Shevchuk A. I.; Hobson P.; Lab M. J.; Klenerman D.; Krauzewicz N.; Korchev Y. E. Biophys. J. 2008, 94, 4089. 10.1529/biophysj.107.112524. [DOI] [PMC free article] [PubMed] [Google Scholar]
- Shevchuk A. I.; Hobson P.; Klenerman D.; Krauzewicz N.; Korchev Y. E. Pfluegers Arch. 2008, 456, 227. 10.1007/s00424-007-0410-4. [DOI] [PMC free article] [PubMed] [Google Scholar]
- Happel P.; Thatenhorst D.; Dietzel I. D. Sensors 2012, 12, 14983. 10.3390/s121114983. [DOI] [PMC free article] [PubMed] [Google Scholar]
- Korchev Y.; Milovanovic M.; Bashford C.; Bennett D.; Sviderskaya E.; Vodyanoy I.; Lab M. J. Microsc. 1997, 188, 17. 10.1046/j.1365-2818.1997.2430801.x. [DOI] [PubMed] [Google Scholar]
- Takahashi Y.; Murakami Y.; Nagamine K.; Shiku H.; Aoyagi S.; Yasukawa T.; Kanzaki M.; Matsue T. Phys. Chem. Chem. Phys. 2010, 12, 10012. 10.1039/c002607g. [DOI] [PubMed] [Google Scholar]
- Chen C.-C.; Derylo M. A.; Baker L. A. Anal. Chem. 2009, 81, 4742. 10.1021/ac900065p. [DOI] [PubMed] [Google Scholar]
- Song L.; Hobaugh M. R.; Shustak C.; Cheley S.; Bayley H.; Gouaux J. E. Science 1996, 274, 1859. 10.1126/science.274.5294.1859. [DOI] [PubMed] [Google Scholar]
- Guan X.; Gu L. Q.; Cheley S.; Braha O.; Bayley H. ChemBioChem 2005, 6, 1875. 10.1002/cbic.200500064. [DOI] [PubMed] [Google Scholar]
- Jayawardhana D. A.; Crank J. A.; Zhao Q.; Armstrong D. W.; Guan X. Anal. Chem. 2009, 81, 460. 10.1021/ac801877g. [DOI] [PubMed] [Google Scholar]
- Benner S.; Chen R. J.; Wilson N. A.; Abu-Shumays R.; Hurt N.; Lieberman K. R.; Deamer D. W.; Dunbar W. B.; Akeson M. Nat. Nanotechnol. 2007, 2, 718. 10.1038/nnano.2007.344. [DOI] [PMC free article] [PubMed] [Google Scholar]
- Wang Y.; Zheng D.; Tan Q.; Wang M. X.; Gu L.-Q. Nat. Nanotechnol. 2011, 6, 668. 10.1038/nnano.2011.147. [DOI] [PMC free article] [PubMed] [Google Scholar]
- Akeson M.; Branton D.; Kasianowicz J. J.; Brandin E.; Deamer D. W. Biophys. J. 1999, 77, 3227. 10.1016/S0006-3495(99)77153-5. [DOI] [PMC free article] [PubMed] [Google Scholar]
- Rotem D.; Jayasinghe L.; Salichou M.; Bayley H. J. Am. Chem. Soc. 2012, 134, 2781. 10.1021/ja2105653. [DOI] [PMC free article] [PubMed] [Google Scholar]
- Boersma A. J.; Brain K. L.; Bayley H. ACS Nano 2012, 6, 5304. 10.1021/nn301125y. [DOI] [PubMed] [Google Scholar]
- White R. J.; Ervin E. N.; Yang T.; Chen X.; Daniel S.; Cremer P. S.; White H. S. J. Am. Chem. Soc. 2007, 129, 11766. 10.1021/ja073174q. [DOI] [PubMed] [Google Scholar]
- Zhang B.; Galusha J.; Shiozawa P. G.; Wang G.; Bergren A. J.; Jones R. M.; White R. J.; Ervin E. N.; Cauley C. C.; White H. S. Anal. Chem. 2007, 79, 4778. 10.1021/ac070609j. [DOI] [PubMed] [Google Scholar]
- Zhang B.; Zhang Y.; White H. S. Anal. Chem. 2004, 76, 6229. 10.1021/ac049288r. [DOI] [PubMed] [Google Scholar]
- Zhang B.; Zhang Y.; White H. S. Anal. Chem. 2006, 78, 477. 10.1021/ac051330a. [DOI] [PubMed] [Google Scholar]
- White R. J.; Zhang B.; Daniel S.; Tang J. M.; Ervin E. N.; Cremer P. S.; White H. S. Langmuir 2006, 22, 10777. 10.1021/la061457a. [DOI] [PubMed] [Google Scholar]
- Coronado R.; Latorre R. Biophys. J. 1983, 43, 231. 10.1016/S0006-3495(83)84343-4. [DOI] [PMC free article] [PubMed] [Google Scholar]
- Alvarez O. In Ion Channel Reconstitution; Plenum Press: New York, 1986; p 115. [Google Scholar]
- Benz R.; Beckers F.; Zimmermann U. J. Membr. Biol. 1979, 48, 181. 10.1007/BF01872858. [DOI] [PubMed] [Google Scholar]
- Glaser R. W.; Leikin S. L.; Chernomordik L. V.; Pastushenko V. F.; Sokirko A. I. Biochim. Biophys. Acta, Biomembr. 1988, 940, 275. 10.1016/0005-2736(88)90202-7. [DOI] [PubMed] [Google Scholar]
- Venkatesan B. M.; Bashir R. Nat. Nanotechnol. 2011, 6, 615. 10.1038/nnano.2011.129. [DOI] [PubMed] [Google Scholar]
- Clarke J.; Wu H.-C.; Jayasinghe L.; Patel A.; Reid S.; Bayley H. Nat. Nanotechnol. 2009, 4, 265. 10.1038/nnano.2009.12. [DOI] [PubMed] [Google Scholar]
- Boersma A. J.; Bayley H. Angew. Chem. 2012, 124, 9744. 10.1002/ange.201205687. [DOI] [PubMed] [Google Scholar]
- Bard A. J.; Faulkner L. R. In Electrochemical Methods: Fundamentals and Applications, 2nd ed.; Wiley and Sons: New York, 2001. [Google Scholar]
- Bhattacharya S.; Muzard J.; Payet L.; Mathé J.; Bockelmann U.; Aksimentiev A.; Viasnoff V. J. Phys. Chem. C 2011, 115, 4255. 10.1021/jp111441p. [DOI] [PMC free article] [PubMed] [Google Scholar]
- Nitz H.; Kamp J.; Fuchs H. Probe Microsc. 1998, 1, 187. [Google Scholar]
- Edwards M. A.; Williams C. G.; Whitworth A. L.; Unwin P. R. Anal. Chem. 2009, 81, 4482. 10.1021/ac900376w. [DOI] [PubMed] [Google Scholar]
- Scott E. R.; White H. S.; Phipps J. B. Anal. Chem. 1993, 65, 1537. 10.1021/ac00059a010. [DOI] [PubMed] [Google Scholar]
- Ervin E. N.; White R. J.; White H. S. Anal. Chem. 2009, 81, 533. 10.1021/ac801104v. [DOI] [PubMed] [Google Scholar]
- Shevchuk A. I.; Frolenkov G. I.; Sánchez D.; James P. S.; Freedman N.; Lab M. J.; Jones R.; Klenerman D.; Korchev Y. E. Angew. Chem. 2006, 118, 2270. 10.1002/ange.200503915. [DOI] [PubMed] [Google Scholar]
- Ying L.; Bruckbauer A.; Zhou D.; Gorelik J.; Shevchuk A.; Korchev Y.; Klenerman D. Phys. Chem. Chem. Phys. 2005, 7, 2859. 10.1039/b506743j. [DOI] [PubMed] [Google Scholar]
Associated Data
This section collects any data citations, data availability statements, or supplementary materials included in this article.