

Abstract
Mass-spectrometry-based proteomic analysis underestimates proteomic variation due to the absence of variant peptides and posttranslational modifications (PTMs) from standard protein databases. Each individual carries thousands of missense mutations that lead to single amino acid variants, but these are missed because they are absent from generic proteomic search databases. Myriad types of protein PTMs play essential roles in biological processes but remain undetected because of increased false discovery rates in variable modification searches. We address these two fundamental shortcomings of bottom-up proteomics with two recently developed software tools. The first consists of workflows in Galaxy that mine RNA sequencing data to generate sample-specific databases containing variant peptides and products of alternative splicing events. The second tool applies a new strategy that alters the variable modification approach to consider only curated PTMs at specific positions, thereby avoiding the combinatorial explosion that traditionally leads to high false discovery rates. Using RNA-sequencing-derived databases with this Global Post-Translational Modification (G-PTM) search strategy revealed hundreds of single amino acid variant peptides, tens of novel splice junction peptides, and several hundred posttranslationally modified peptides in each of ten human cell lines.
Keywords: bottom-up proteomics, proteomic database search, cancer cell lines, RNA-Seq, proteogenomics, single amino acid variant (SAV), novel splice junction (NSJ), PTM, G-PTM
Introduction
Variations in the primary amino acid sequence of a protein or the posttranslational modification (PTM) of amino acid side-chains can have a significant impact on the structure, function, and localization of proteins in a cell. Classic examples include the various PTMs of histones that regulate chromatin folding and gene expression1 and the phosphorylation of the tumor suppressor protein p53 in response to DNA damage, which modulates DNA binding properties and proteasomal degradation signaling.2 Similarly, amino acid substitutions can dramatically impact the structure of proteins, particularly the substitution of chemically distinct amino acids, such as the glutamic acid to valine mutation in hemoglobin that causes sickle cell anemia. While these variants have important biological consequences, they remain undetected in standard bottom-up proteomics analysis. We combined two approaches: sample-specific proteomic databases generated using RNA-Seq and the global posttranslational modification (G-PTM) search strategy to reveal primary sequence variation and PTMs in shotgun proteomics data.
In a typical bottom-up mass spectrometry-based proteomics experiment, proteins are first cleaved at specific residues using a protease, commonly trypsin, which cleaves proteins at lysine (K) and arginine (R) residues. After digestion, peptides are chromatographically separated and analyzed by the mass spectrometer. The database search strategy3 determines which peptides were measured in the mass spectra of a shotgun proteomics run by first performing an in silico tryptic digestion of amino acid sequences in a search database and then matching each experimental spectrum to theoretical spectra for tryptic peptide sequences from the database within a small mass range from the measured peptide mass. The highest-scoring match is called the peptide spectral match (PSM). Traditionally, the search database contains only sequences for known proteins (i.e., FASTA format) without PTM information. Therefore, because the database search strategy is generally limited to the search database, special approaches are required to detect amino acid variant peptides and PTM peptides.
RNA-Seq proteogenomics is a growing field4,5 that seeks to uncover protein sequence variants that are invisible to standard mass spectrometry (MS) proteomic database searches by using sample-specific proteomic databases derived from RNA-Seq data. A number of studies have tackled this problem by mining RNA-Seq data to include single amino acid variant (SAV) peptides6−8 or novel splice junction (NSJ) peptides6,8−11 in the custom protein sequence database to allow them to be detected. Studies have also focused on other RNA features, such as RNA-editing8 or active translation by ribosomes using ribosome profiling data.12 We have developed two workflows to construct sample-specific proteomic databases containing SAV6,7 and NSJ6,9 peptides from RNA-Seq data. These differ from other studies8,13 that use databases such as CanVarPro14 (human cancer proteome variation) or TCGA15 (The Cancer Genome Atlas) to construct databases. Working directly from RNA-Seq data provides the flexibility of working with samples that have not been characterized in large consortium efforts like TCGA. In the present study, we utilized publicly available MS/MS and RNA-Seq data for 10 human cell lines to evaluate various criteria in using RNA-Seq data for constructing proteomic databases. We then recommend parameters for filtering sequence variants to reduce the false discovery rates (FDRs) for SAV and NSJ peptides.
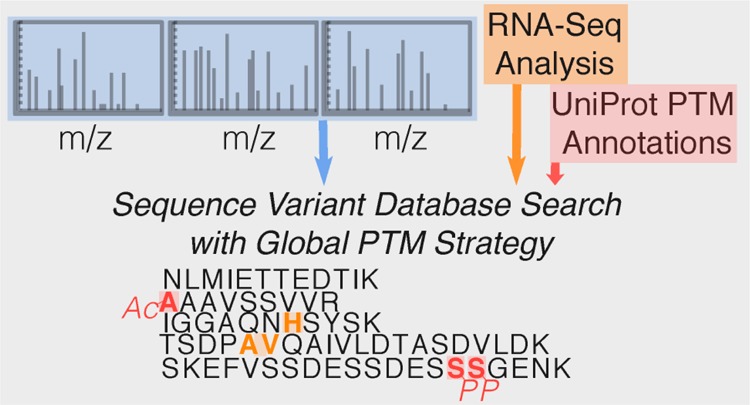
New search strategies and databases are also meeting the need for detecting a broad spectrum of PTMs from a single sample. Traditionally, PTM-enrichment protocols and variable modification searches are used to discover new PTM sites.16 These searches typically have high FDRs due to the exceptionally large search space4,17 resulting from the combinatorial explosion of all possible PTM sites. The approaches used to address this large FDR and limited scope of PTM detections include open search mode18 and site-specific PTM annotated databases.19 In open search mode, all theoretical peptides are matched against an experimental spectrum, allowing the identification of PTM peptides by high-scoring matches with masses that vary from that of a theoretical peptide by a precise, assignable amount, for example, +79.97 Da for phosphorylation. This approach has the advantage that it can detect new PTMs of many types while still limiting the database size.20 The other approach, searching site-specific PTM annotated databases, involves an adapted variable modification search that includes only PTMs annotated at specific residues for each sequence.19 Similar to open search mode, this dramatically limits the combinatorial explosion that leads to a high FDR for modified peptides, allows the detection of many types of PTMs at known sites, improves the accuracy of spectral matching, and identifies high-quality PTM peptide spectral matches that are missed during sequence-only searches. We developed this Global PTM (G-PTM) search strategy using the proteomic search software Morpheus21 along with PTM information available in UniProt to identify candidate PTM peptides in a single-pass search that can then be further validated.19 While G-PTM does not detect unannotated PTMs, it does reveal many more PTM peptides and types of PTMs than a traditional variable modification search. In the current work, we searched RNA-Seq proteogenomic databases with the G-PTM search strategy to reveal hundreds of SAV peptides, tens of NSJ peptides, and several hundred PTM peptides in each of 10 human cell lines (Figure 1).
Figure 1.
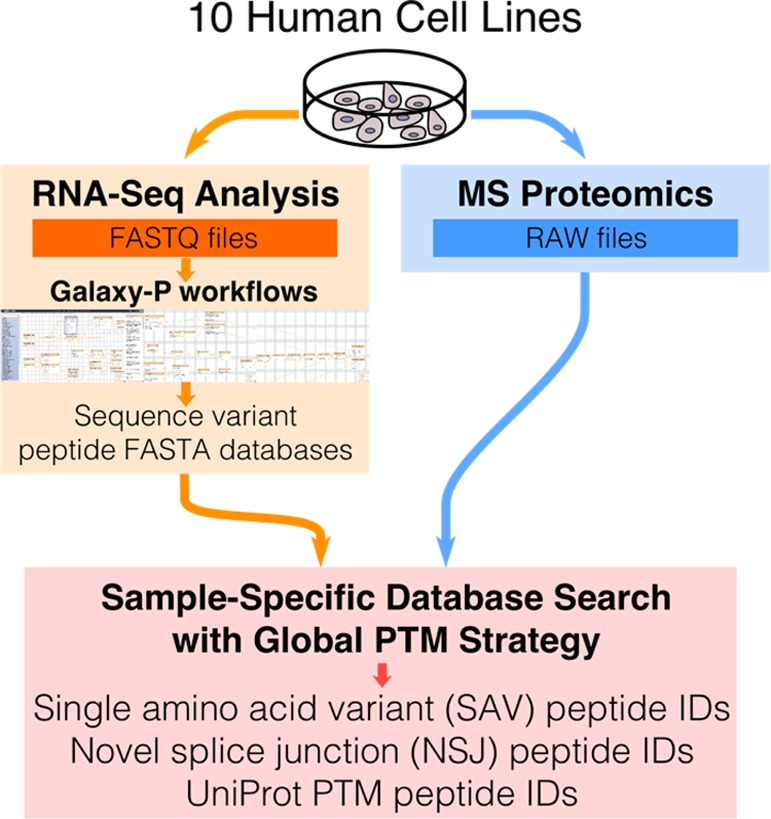
Using the G-PTM search strategy with a RNA-Seq proteogenomic workflow allows the identification of many sequence variant and PTM-containing peptides. RNA-Seq data is used to identify sequence variants and construct sequence variant peptide databases for each of 10 human cell lines using the Galaxy-P computational interface. MS proteomic data for the same cell lines are searched using the G-PTM strategy with a sample-specific database that includes single amino acid variant (SAV) peptides, novel splice junction (NSJ) peptides, and UniProt protein sequences annotated with curated site-specific PTMs.
Experimental Section
RNA-Sequencing Data
RNA-Seq data (Table 1) for each of the 10 different cell lines were obtained from multiple repositories (Table S-1) and used in the construction of sample-specific proteomic databases. These data were collected from a variety of experiments.
Table 1. Information about the Publicly Available RNA-Seq Datasets Used to Construct Sample-Specific Proteomic Databases for Each Cell Linea.
| cell line | RNA library preparation | paired/single-end | read length | read count | total nucleotides sequenced |
|---|---|---|---|---|---|
| A549 | poly(A)+ | paired | 76 | 2.13 × 10⁸ | 3.24 × 10¹⁰ |
| HEK293 | rRNA-D | paired | 50 | 1.75 × 10⁸ | 1.75 × 10¹⁰ |
| HeLa | rRNA-D | paired | 50 | 3.01 × 10⁸ | 3.01 × 10¹⁰ |
| HepG2 | poly(A)+ | paired | 76 | 2.45 × 10⁸ | 3.73 × 10¹⁰ |
| Jurkat | poly(A)+ | paired | 101 | 1.13 × 10⁸ | 2.29 × 10¹⁰ |
| K562 | poly(A)+ | paired | 76 | 2.33 × 10⁸ | 3.54 × 10¹⁰ |
| LNCaP | poly(A)+; poly(A)+; HiC24 | single | 36; 35; 50 | 2.62 × 10⁸ | 1.09 × 10¹⁰ |
| MCF-7 | poly(A)+ | paired | 76 | 2.60 × 10⁸ | 3.95 × 10¹⁰ |
| RKO | poly(A)+; unspecified | single | 36; 76 | 1.04 × 10⁸ | 6.74 × 10⁹ |
| U2OS | unspecified; PAR-CLIP-Seq25 | single | 101; 45 | 8.06 × 10⁷ | 4.77 × 10⁹ |
Multiple data sets were combined for LNCaP, RKO, and U2OS. Repository information is listed in Table S-1. Abbreviations: poly(A)+, polyadenylated tail selection; rRNA-d, rRNA depletion; HiC, all-versus-all chromosome conformation capture; PAR-CLIP-seq, photoactivatable-ribonucleoside-enhanced cross-linking and immunoprecipitation.
The first step of RNA sequencing after extracting RNA from the sample of interest is library preparation, in which RNA is prepared for sequencing in part by reverse transcription to complementary DNA (cDNA). The two most popular RNA-Seq library preparation procedures involve isolating mRNA sequences having polyadenylated tails (poly(A)+) or depleting repetitive rRNA sequences that account for the majority of RNA in most samples (rRNA-d). After library preparation, short fragments of the full sequences are sequenced by Illumina sequencing. Either one or both ends of each cDNA fragment are sequenced, termed single- and paired-end sequencing, respectively. The number of molecules sequenced (read count) and the length of each sequence (read length) vary across the RNA-Seq data sets used in this study. To compare the extent of RNA sequencing for each cell line, we used the number of nucleotides sequenced because this metric is neutral to the read count and length.
Mass Spectrometry Data
Extensive tandem mass spectrometry (MS/MS) data from the analysis of protein expression in 11 cell lines was provided by the Mann group, and the methods for collecting these spectra are described in their study.22 This data set has consistent and deep proteomic coverage for each cell line (Table S-2) with 18 raw MS/MS files from 3 technical replicates for each of 6 different isolated fractions per cell line. The consistency of this data set allows us to compare the proteomic search results obtained with sample-specific databases constructed using different RNA-Seq library preparation techniques, read lengths, and read types (single- or paired-end). In addition, the depth of the data set allows us to explore the full potential of using the G-PTM search strategy with RNA-Seq proteogenomic databases. Note that the MS/MS data for one of the 11 cell lines (GAMG glioblastoma) was not used in this study because the corresponding RNA-Seq data was not publicly available at the time of analysis.
Sample-Specific SAV and NSJ Database Construction
Galaxy-P, short for Galaxy for Proteomics, is a computational interface that allows users to tie independent programs, such as tools for sequence alignment, variant calling, and MS spectral matching, together in workflows.6,23−25 The ease of maintaining the same versions and settings of individual software makes bioinformatic analysis more user-friendly and reproducible. The Galaxy-P workflows used to produce SAV and NSJ peptide FASTA databases were described by Sheynkman et al.6,7,9 Each database employed in the present work is the union of three databases: the sample-specific SAV database, the sample-specific NSJ database, and the Homo sapiens (Human) UniProt reference proteome containing protein sequences with site-specific PTM annotations. The UniProt database format that includes these PTM annotations is called the UniProt extended markup language (UniProt-XML). The SAV and NSJ databases were produced and appended to the reference proteome in UniProt XML format to create a sample-specific database for each cell line. For the present work, we adapted and combined scripts from the works by Sheynkman et al.6,7,9 to develop software named SampleSpecificDBGenerator used to perform this process. This program and source code can be obtained at https://sourceforge.net/projects/samplespecificdbgenerator/.
The Galaxy-P workflows for constructing SAV and NSJ peptide databases both employ RNA-Seq data analysis to detect nucleotide variants that lead to amino acid variation. The first step of both workflows is the alignment of RNA-Seq reads to the GRCh37 reference genome using the program Tophat;26 the alignment settings used for single- and paired-end SAV and NSJ workflows can be found in Table S-3. Tophat attempts to align whole RNA-Seq reads to the genome, and then it splits each unaligned read into two sequences and aligns them within a certain number of nucleotides from each other to allow alignment of reads across splice junctions. Both workflows use the Ensembl gene model (GRCh 37, version 73), which contains all known and predicted splicing patterns of exons within genes, to direct the alignment of reads across known splice junctions. In the SAV workflow, the RNA-Seq read alignments are used to call missense SNVs and other nucleotide variants that differ from the reference genome using a program called SnpEff.27 The missense SNV calls are then used to modify protein sequences from the GRCh 37.73 reference proteome, and up to 33 amino acids on both sides of the variant amino acid are entered into a SAV peptide database.
In the search results, SAV peptides are required to contain the variant amino acid, and only fully tryptic fragments with one or two missed cleavages are counted. Tryptic peptides that do not contain the variant amino acid are counted as standard PSMs. Peptides containing a variation between leucine and isoleucine, which cannot be distinguished by standard methods of tandem mass spectrometry, are also counted as standard PSMs.
The NSJ workflow uses two other Tophat alignments. The first is similar to the alignment in the SAV workflow in that the goal is to search for known splice junctions annotated in the gene model, differing in the absence of a “coverage search” that provides added sensitivity for nsSNV detection and in the presence of an indel search (see Table S-3). The second one searches for novel splice junctions in addition to the known splice junctions. The splice junctions crossed by RNA-Seq reads are recorded in Browser Extensible Data (BED) files, which contain the genomic coordinates of the two exons flanking each splice junction and the number of reads crossing it. The known splice junctions from the first alignment are subtracted from the second BED file containing both known and novel splice junctions, and then a special tool called Translate BED Sequences9 translates each nucleotide sequence of the two concatenated exons into an amino acid sequence that is entered into the NSJ peptide database. We modified the original Translate BED Sequences program to include only tryptic peptides containing the NSJs and to include the gene names in each NSJ peptide entry name if an exon is located within a gene region annotated in the gene model. This simplifies the analysis of NSJ PSMs and reduces NSJ peptide FDRs (Figure S-2) over the previous strategy of entering the peptide sequence translated from stop codon to stop codon into the NSJ peptide database.
The read depth across missense SNVs and NSJs is recorded in the SnpEff output and splice junction BED files. Requiring that variants have more than a certain number of reads crossing the feature often led to an improvement in the SAV or NSJ peptide FDR, so the read depth across the variant feature was used as a criterion to filter variants before entering them into the sequence variant proteomic databases. Other filtering criteria were explored, but they did not lead to significant reductions in the sequence variant peptide FDRs. Information about these experiments can be found in Figures S-1 and S-2.
The UniProt-XML reference proteome was downloaded on January 5, 2015, and the protein accession numbers can be found in Table S-4. All GRCh 37.73 reference files were obtained from Ensembl. This specific version was used to maintain consistency with previous studies on these workflows.7,9
Spectral Matching
The software program Morpheus (version 142) was used for all database searching and spectral matching by the G-PTM strategy.19 It can be obtained at http://morpheus-ms.sourceforge.net/. The G-PTM strategy first requires a UniProt-XML database be specified in Morpheus. Then, all curated modifications are extracted from the database, and the details of each modification (name, mass shift, and target amino acid) are read from a local copy of a text file containing the modifications that may exist in the database. (The current version of this file may be obtained from http://www.uniprot.org/docs/ptmlist. Version 11_2014 was used in this work.) All valid modifications are added to the variable modifications box in the Morpheus graphical user interface with the prefix “UniProt” and are selected by default.
The G-PTM search strategy differs from a standard variable modification approach by considering only site-specific modifications annotated in UniProt-XML database entries instead of all possible sites at which these modifications could occur. Limiting the possible PTMs to reported sites on the protein sequences in the database dramatically reduces the number of combinatorial PTM peptide isoforms. Morpheus takes each base peptide sequence in the database and generates all possible isoform combinations given the annotated PTM sites and the variable modifications selected, up to a user-defined limit (1024 by default).
Proteomics searches were performed on several computers with 8, 16, or 32 GB of RAM using 4 to 8 processing units. The following settings were used in all searches: Protease = trypsin (no proline rule); Maximum Missed Cleavages = 2; Initiator Methionine Behavior = variable; Fixed Modifications = carbamidomethylation of C; Variable Modifications = oxidation of M; Maximum Variable Modification Isoforms Per Peptide = 1024; Precursor Mass Tolerance = ±10 ppm (monoisotopic) unless otherwise noted; Precursor Monoisotopic Peak Correction = disabled; Product Mass Tolerance = ±0.01 Da (monoisotopic); Maximum False Discovery Rate = 1%.
Search Results
The search results for each of the final 13 searches can be found in the Supporting Information, with a summary presented in Table S-5. All identified peptides are summarized in Table S-6, and more specific information on unique SAV peptides and unique NSJ peptides are summarized separately in Tables S-7 and S-8. The corresponding protein and sequence variant peptide identifications are provided in Table S-9.
To count each sequence variation only once, we counted unique SAV and NSJ peptides differently than PTM and unmodified peptides. We allowed up to two missed tryptic cleavages in the database searches to detect peptides containing lysine and arginine residues that were not cleaved by trypsin. The uniqueness of SAV or NSJ peptides in this work arises from a single site of variation, and so missed cleavage products were counted as a single unique SAV or NSJ peptide to avoid double- or triple-counting the unique sequence variant. The information on SAV and NSJ peptide identifications in Tables S-7 and S-8 is grouped in this way, and so they can be used to generate these unique SAV or NSJ peptide counts.
Missed cleavage products of PTM peptides differ from SAV and NSJ peptides in that they may be adorned with unique arrangements of PTMs, including modified lysine or arginine residues that were missed by trypsin. Therefore, each missed cleavage product of a PTM peptide was counted as a unique peptide. The identified peptides listed in Table S-6 are separated by missed cleavage, and so they can be used to generate these unique PTM and unmodified peptide counts.
Global False Discovery Rates
The Morpheus proteomic search software uses a simple scoring algorithm21 for PSMs based on peptide fragmentation spectra. The Morpheus score is a combination of two values related to peptide fragmentation. The primary score is simply the number of matching peptide fragments. The secondary score is the fraction of theoretical b- and y-ion abundances that are matched in the experimental fragmentation spectrum. The composite Morpheus score is the sum of the primary and secondary scores, and it is used to sort the list of all PSMs (unmodified, SAV, NSJ, PTM) from highest to lowest confidence after searching a sample-specific database.
The global FDR for each database search is estimated using this sorted PSM list and the target-decoy approach.28 Decoy peptide sequences are generated from the reverse of all modified and unmodified target sequences, and they compete with target peptide sequences for matches to experimental spectra. Decoy PSMs represent false-positive matches and generally cluster at low scores, allowing a cutoff decision for high-scoring target PSMs based on an estimation of the false-positive rate. The global FDR is calculated by dividing the number of decoy PSMs by the number of target PSMs above any score in the sorted PSM list. We allowed a 1% global FDR throughout this work for reporting PSMs.
Variant and Modified Peptide FDRs
The FDR for each type of peptide identification (SAV, NSJ, PTM) is calculated by dividing the number of decoy PSMs by target PSMs meeting a global 1% FDR cutoff.17,29 We use the variant peptide FDRs to compare our methods for constructing sample-specific databases, with the goal of choosing a minimum read depth across missense SNVs or NSJs that reduces the FDR of SAV or NSJ peptides and thus improves the quality of sequence variant identifications.
Results
Constructing sample-specific databases from RNA-Seq data involves important considerations related to the data set employed. We first show the impact of the RNA-Seq data set size on the number and quality of sequence variant database entries. Next, we filter missense SNVs and NSJs using the RNA-Seq read depth across the variant features to improve the quality of sequence variant peptide identifications. Lastly, we show that searching MS/MS data with the resulting sample-specific databases for each of the 10 human cell lines allowed the identification of hundreds of SAV peptides, tens of NSJ peptides, and several hundred diverse PTM peptides.
Impact of RNA Sequencing Depth
Generating more RNA-Seq reads for a sample generally increases the detection of nucleotide-sequence variants present in low-abundance transcripts. We investigated whether this effect also leads to more protein-sequence variant identifications upon searching a database constructed from larger RNA-Seq data sets. Subsets of the MCF-7 RNA-Seq data set were chosen at random and used to construct sequence variant peptide databases using all missense SNVs and NSJs. Combined with the UniProt-XML reference proteome, these peptide databases were then searched against the MCF-7 MS/MS data set. More SAV peptides are identified from databases constructed using larger RNA-Seq data sets, but the size increase in the RNA-Seq data set yields diminishing returns for SAV peptides (Figure 2A,B). At 1010 nucleotides of sequencing depth, the number of additional SAV PSMs, unique SAV peptides, and SAV database entries begins to plateau, indicating 1010 nucleotides of raw RNA-Seq data is adequate for this type of proteogenomic experiment. The quality of these SAV peptide identifications is quite good, as exhibited by the FDR of <1% (Figure 2C), less than the global FDR for all peptide identifications.
Figure 2.

Increasing the depth of RNA-Seq data yields diminishing returns for the number of (A) SAV peptide database entries and (B) SAV PSMs (dark) and unique peptide identifications (light), while having little impact on (C) the SAV peptide FDR. The impact of RNA-Seq depth on NSJ peptides is strikingly different, leading to (D) an exponential increase in the number of NSJ peptide database entries and (E) a continuous linear increase in the number of NSJ PSMs (dark) and unique peptide identifications (light). Additional NSJ peptide identifications are obtained beyond 1 × 10¹⁰ nucleotides, while no increase is observed in the NSJ peptide FDR seen in panel F, indicating that deep RNA sequencing is advantageous for detecting NSJ peptides. The number of sequenced nucleotides was chosen as a metric for experimenting with the read depth because it is neutral to read length and type: paired- or single-end, which varied for the 10 data sets used.
In contrast with the SAV peptide results, the number of NSJ PSMs, unique NSJ peptides, and NSJ peptide database entries continues to grow linearly with additional sequencing depth (Figure 2D,E). The number of NSJ PSMs increases from 127 to 247 between 1 × 10¹⁰ and 2 × 10¹⁰ nucleotides of sequencing depth, while the NSJ peptide FDR decreases slightly (Figure 2F). Overall, deep RNA sequencing appears to be beneficial for detecting NSJ peptides. Therefore, we utilized the full RNA-Seq data sets for constructing sample-specific databases in the remainder of this work.
Impact of RNA-Seq Read Type
Either a single end or both ends of cDNA sequence fragments can be sequenced in RNA-Seq These methods are termed single-end (SE) and paired-end (PE) sequencing. PE data should provide an advantage over SE data for detecting NSJs because splice junctions can be inferred from a pair of reads that align farther apart than the length of the insert between them.30 To determine if this intuitive advantage leads to improved identification of NSJ peptides, we searched sample-specific databases constructed for SE and PE RNA-Seq data using NSJ read depth cutoffs of 0, 0.01, and 0.02 reads per million (Figure 3), which are calculated by dividing the required read depths by the total read counts in millions of reads.
Figure 3.

Paired-end (PE) sequencing aids the detection of NSJ peptides. PE sequencing, shown as darker points, yields more NSJ peptide PSMs than single-end (SE) reads, shown as lighter points in panel A (p values of 0.010, 0.012, and 0.027 using Welch’s t test for the 0, 0.01, and 0.02 reads per million NSJ depth cutoffs). The number of unique NSJ peptides (panel B) was also better for PE reads at zero cutoffs than SE reads (p value of 0.010 using Welch’s t test). There was no significant difference between the NSJ peptide FDRs (panel C) for PE and SE reads (p value of 0.381 using Welch’s t test).
We found a moderate-to-strong difference between the numbers of NSJ PSMs, with PE data leading to more matches (p values of 0.010, 0.012, and 0.027 using Welch’s t test, respectively). The number of unique NSJ peptides was also significantly higher for PE experiments without RNA-Seq read depth cutoffs (p value of 0.010 using Welch’s t test). With cutoffs above zero reads per million, the elimination of many NSJ database entries led to a reduction in NSJ peptide identifications, including many potential true positives, and the number of unique NSJ peptides in PE experiments fell from a mean of 41 to 15 unique peptides nearly to the low values of the SE experiments, which had means ranging from 7 to 11 unique peptides. We found no significant difference between the NSJ peptide FDRs for SE and PE experiments (p values of 0.381, 0.839, and 0.392, respectively). We recommend the use of paired-end data whenever possible for improved identification of NSJ peptides.
Improving SAV and NSJ Peptide FDRs by Filtering Variants on Read Depth
RNA-Seq proteogenomic methods for detecting protein sequence variation typically involve aligning many short sequencing reads to a reference genome. Single nucleotide variants can be observed in sequence reads at loci where missense mutations may have occurred. The number of reads that cross a variant, and thus the number of observations, leads to higher confidence that the variant exists. Similarly, splice alignment programs (e.g., Tophat) can be used to discover novel splice junctions when reads cross an unannotated junction, so more reads spanning such a junction build confidence in the NSJ. Therefore, we investigated the effect of filtering nucleotide variants on the RNA-Seq read depths across missense SNVs and NSJs. We constructed sample-specific databases for each of the 10 cell lines using a range of depth filters for either missense SNV or NSJ reads and then searched them against the MS/MS spectra for the cell line. The results for more stringent depth filters are similar to those previously obtained for constructing sample-specific databases with smaller RNA-Seq data sets. As the required read depth increases, fewer sequence variants are identified in the RNA-Seq data, leading to fewer SAV and NSJ peptide database entries (Figure 4A,D) and fewer PSMs (Figure 4B,E). The FDRs for both SAV and NSJ peptides also generally decrease with more stringent read depth filters (Figure 4C,F). This makes read depth filters useful for constructing sample-specific databases that produce more accurate sequence variant peptide identifications. The results for the Jurkat cell represent an exception to this trend in Figure 4F, showing an increase in FDRs at higher read depths. These results are likely anomalous due to the small number of NSJ PSMs available to calculate the NSJ peptide FDR at stringent cutoffs.
Figure 4.

Filtering missense SNVs using the read depth of the variant nucleotide led to fewer SAV peptide database entries (A) and SAV PSMs (B), but the quality of these identifications improved, as evidenced by reduced SAV peptide FDRs (C). Filtering NSJs on the read depth across each splice junction led to many fewer NSJ peptide database entries (D) and NSJ PSMs (E), again with higher quality, as shown by reduced NSJ peptide FDRs (F). The reduction in FDRs for SAV and NSJ peptides demonstrates that filtering variants using the RNA-Seq read depth is useful for constructing sample-specific databases that produce more accurate sequence variant peptide identifications. The read depth cutoffs are normalized to the total RNA-Seq read count for each cell line to provide an accurate comparison of the stringency of each filter across the different data sets.
Identification of Variant Peptides
SAV and NSJ depth cutoffs were selected with a general strategy for each cell line using the data shown in Figure 4. First, applying no read depth cutoff to missense SNVs led to higher SAV peptide FDRs than the global FDR for three of the sample-specific databases. Then, increasing the read depth cutoff from zero led to drop-offs in these sequence variant FDRs, indicating higher quality database entries. These improvements were observed in 7 of the 10 cell lines for NSJ peptide FDRs; however, they were accompanied by decreased numbers of SAV PSMs and a steep decrease in NSJ peptide PSMs, and so we developed a preliminary strategy for choosing a cutoff that balanced this trade-off. To construct a final sample-specific database, we chose the least stringent depth cutoffs that yielded a significant drop in the SAV and NSJ FDRs while being accompanied by a similar drop in the respective peptide identifications. For example, 100 NSJ PSMs at 20% FDR would ideally drop to 90 PSMs with a 10% FDR for NSJ peptides by eliminating ∼10 false-positive PSMs; however, if a decrease to 10% FDR was accompanied by a drop to 20 PSMs, then the cutoff eliminated ∼60 potential true positive PSMs and was deemed too strict for a meaningful experiment with the RNA-Seq data set. While this strategy illustrates the advantage and generalizability of filtering on the read depth with certain variants, it requires multiple proteomics searches. Thus, future analysis of the root causes of high SAV and NSJ FDRs may yield a more universal strategy for choosing the best cutoffs.
The selected read depth cutoffs recorded in Table S-5 were used to construct sample-specific databases in the UniProt-XML format for each cell line. The results of the searches for these 10 cell lines were compiled into a master list of variant peptides. Across the 10 cell lines, 1605 unique SAV peptides and 309 unique NSJ peptides were identified. Of these variant peptides, the numbers unique to a particular human cell line were 1242 SAV peptides (77.4%) and all NSJ peptides. For comparison, only 35.0% of the unique unmodified peptides from the UniProt reference database (i.e., lacking a SAV, NSJ, or PTM) were unique to a cell line. The uniqueness and potential biological importance of these observed variant peptides make them particularly interesting for proteomics investigations seeking to reveal new factors contributing to particular phenotypes.
Identification of PTM Peptides
Across the 10 cell lines, 2212 unique PTM peptides were identified and 1015 PTM peptides (45.9%) were unique to a particular human cell line. This potentially valuable new information is enriched by the diversity of PTM peptides revealed by these searches. In each cell line, 31 ± 4 different types of modifications were identified, as illustrated in Figure 5 and Table S-10. In all, 42 unique types of modifications were revealed in these data. (Note that some distinct PTM types, such as asymmetric and symmetric isomers of dimethyllysine, cannot be distinguished by parent masses of the modified peptides in the G-PTM approach; they are noted as distinct PTM types because they are annotated as such in the UniProt database.) These PTM results illustrate the power of leveraging UniProt PTM annotations in database searches. They provide an alternative to traditional variable modification searches, which reveal only a single type of PTM peptide with substantially higher FDRs than the 0.6 to 1.4% FDRs for the G-PTM results in this work.
Figure 5.

Many types of PTMs were revealed by the G-PTM search strategy. In each of the 10 cell lines, 31 ± 4 types of modifications were identified. The relative abundances of these modifications, shown here as the percent of PSMs containing each modification, varied across the cell lines.
Conclusions
We report a combined approach of searching custom databases constructed by RNA-Seq proteogenomics with the G-PTM search strategy that allows the identification of a diverse array of protein variants. We report a single-pass MS/MS proteomic search that allows the detection of sample-specific amino acid variants and many types of candidate PTM peptides. This may allow the proteomics community to draw new connections between the expression of these protein sequence variants and PTMs, potentially informing biochemical mechanistic investigations.
The selection of RNA-Seq data types and filtering parameters for sequence variants identified from the data is important for confident identification of these diverse protein variants. We determined that deep paired-end RNA sequencing with, for example, 2 ×10¹⁰ nucleotides of sequencing depth, leads to improved detection of NSJ peptides. By controlling the quality of sequence variants identified in RNA-Seq data using the read depth covering the variant, this workflow also allows identification of protein sequence variants with 1.1 ± 0.5% FDR for SAV peptides and 14.3 ± 6.0% FDR for NSJ peptides.
In each of 10 human cell lines, hundreds of SAV peptides, tens of NSJ peptides, and several hundred PTM peptides were identified. Many types of PTMs adorn these PTM peptides, with 31 ± 4 types of modifications identified in each cell line. In all, 42 different types of modifications were identified in these data with the G-PTM search strategy. Amino acid variants, including SAV and NSJ peptides, are invisible to the proteomic database search strategy without RNA-Seq proteogenomic databases, and PTM peptides are identified by the G-PTM search strategy at a much lower FDR than those from variable modification searches. This opens the door for proteomic analyses to consider these diverse and important variations that play roles in cell regulation and human health.
Acknowledgments
This work was supported by NIH grants 1P50HG004952 and R01GM103315. We thank Timothy J. Griffin for providing access Galaxy-P, which is maintained by the Minnesota Supercomputing Center at the University of Minnesota, and James E. Johnson for helping troubleshoot the Galaxy-P workflows. We thank the Mann group for providing the deep-coverage MS/MS data used in this study. A.J.C. was supported by the Computation and Informatics in Biology and Medicine Training Program 5T15LM007359. G.M.S. was supported by the NIH Genomic Sciences Training Program 5T32HG002760.
Glossary
Abbreviations
- SAV
single amino acid variant
- NSJ
novel splice junction
- PTM
posttranslational modification
- G-PTM
global posttranslational modification search strategy
- RNA-Seq
RNA sequencing
- cDNA
complementary DNA
- poly(A)+
polyadenylated tail selection
- rRNA-d
rRNA depletion
- HiC
all-versus-all chromosome conformation capture
- PAR-CLIP-seq
photoactivatable-ribonucleoside-enhanced cross-linking and immunoprecipitation
- PSM
peptide spectral match
- FDR
false discovery rate
- SE
single-end sequencing
- PE
paired-end sequencing
- UniProt-XML
UniProt extended markup language
- 5-glutamyl GPEA
5-glutamyl glycerylphosphoethanolamine
Supporting Information Available
The Supporting Information is available free of charge on the ACS Publications website at DOI: 10.1021/acs.jproteome.5b00817.
The supporting information includes a summary of the supporting tables and Figures S-1 and S-2, which display comparisons of various methods used for constructing and filtering SAV and NSJ peptides. (PDF)
The supporting tables, Tables S-1 through S-10, contain information on the RNA-Seq and MS/MS data sets used in this project, Tophat aligner settings, accessions of proteins found in the UniProt-XML reference proteome, and peptide identification summaries. (XLSX)
The authors declare no competing financial interest.
Supplementary Material
References
- Huang H.; Sabari B. R.; Garcia B. A.; Allis C. D.; Zhao Y. SnapShot: histone modifications. Cell 2014, 159, 458–458.e1. 10.1016/j.cell.2014.09.037. [DOI] [PMC free article] [PubMed] [Google Scholar]
- Meek D. W.; Anderson C. W. Posttranslational modification of p53: cooperative integrators of function. Cold Spring Harbor Perspect. Biol. 2009, 1, 1–16. 10.1101/cshperspect.a000950. [DOI] [PMC free article] [PubMed] [Google Scholar]
- Eng J. K.; Mccormack A. L.; Yates J. R. An Approach to Correlate Tandem Mass Spectral Data of Peptides with Amino Acid Sequences in a Protein Database. J. Am. Soc. Mass Spectrom. 1994, 5, 976–989. 10.1016/1044-0305(94)80016-2. [DOI] [PubMed] [Google Scholar]
- Nesvizhskii A. I. Proteogenomics: concepts, applications and computational strategies. Nat. Methods 2014, 11, 1114–1125. 10.1038/nmeth.3144. [DOI] [PMC free article] [PubMed] [Google Scholar]
- Wang X.; Liu Q.; Zhang B. Leveraging the complementary nature of RNA-Seq and shotgun proteomics data. Proteomics 2014, 14, 2676–2687. 10.1002/pmic.201400184. [DOI] [PMC free article] [PubMed] [Google Scholar]
- Sheynkman G. M.; Johnson J. E.; Jagtap P. D.; Shortreed M. R.; Onsongo G.; Frey B. L.; Griffin T. J.; Smith L. M. Using Galaxy-P to leverage RNA-Seq for the discovery of novel protein variations. BMC Genomics 2014, 15, 703. 10.1186/1471-2164-15-703. [DOI] [PMC free article] [PubMed] [Google Scholar]
- Sheynkman G. M.; Shortreed M. R.; Frey B. L.; Scalf M.; Smith L. M. Large-scale mass spectrometric detection of variant peptides resulting from nonsynonymous nucleotide differences. J. Proteome Res. 2014, 13, 228–240. 10.1021/pr4009207. [DOI] [PMC free article] [PubMed] [Google Scholar]
- Low T. Y.; van Heesch S.; van den Toorn H.; Giansanti P.; Cristobal A.; Toonen P.; Schafer S.; Hubner N.; van Breukelen B.; Mohammed S.; Cuppen E.; Heck A. J.; Guryev V. Quantitative and qualitative proteome characteristics extracted from in-depth integrated genomics and proteomics analysis. Cell Rep. 2013, 5, 1469–1478. 10.1016/j.celrep.2013.10.041. [DOI] [PubMed] [Google Scholar]
- Sheynkman G. M.; Shortreed M. R.; Frey B. L.; Smith L. M. Discovery and mass spectrometric analysis of novel splice-junction peptides using RNA-Seq. Mol. Cell. Proteomics 2013, 12, 2341–2353. 10.1074/mcp.O113.028142. [DOI] [PMC free article] [PubMed] [Google Scholar]
- Ning K.; Nesvizhskii A. I. The utility of mass spectrometry-based proteomic data for validation of novel alternative splice forms reconstructed from RNA-Seq data: a preliminary assessment. BMC Bioinf. 2010, 11 (Suppl 11), S14. 10.1186/1471-2105-11-S11-S14. [DOI] [PMC free article] [PubMed] [Google Scholar]
- Evans V. C.; Barker G.; Heesom K. J.; Fan J.; Bessant C.; Matthews D. A. De novo derivation of proteomes from transcriptomes for transcript and protein identification. Nat. Methods 2012, 9, 1207–1211. 10.1038/nmeth.2227. [DOI] [PMC free article] [PubMed] [Google Scholar]
- Crappe J.; Ndah E.; Koch A.; Steyaert S.; Gawron D.; De Keulenaer S.; De Meester E.; De Meyer T.; Van Criekinge W.; Van Damme P.; Menschaert G. PROTEOFORMER: deep proteome coverage through ribosome profiling and MS integration. Nucleic Acids Res. 2015, 43, e29. 10.1093/nar/gku1283. [DOI] [PMC free article] [PubMed] [Google Scholar]
- Li J.; Su Z.; Ma Z. Q.; Slebos R. J.; Halvey P.; Tabb D. L.; Liebler D. C.; Pao W.; Zhang B. A bioinformatics workflow for variant peptide detection in shotgun proteomics. Mol. Cell. Proteomics 2011, 10, M110 006536. 10.1074/mcp.M110.006536. [DOI] [PMC free article] [PubMed] [Google Scholar]
- Li J.; Duncan D. T.; Zhang B. CanProVar: a human cancer proteome variation database. Hum. Mutat. 2010, 31, 219–228. 10.1002/humu.21176. [DOI] [PMC free article] [PubMed] [Google Scholar]
- Akbani R.; Ng P. K.; Werner H. M.; Shahmoradgoli M.; Zhang F.; Ju Z.; Liu W.; Yang J. Y.; Yoshihara K.; Li J.; Ling S.; Seviour E. G.; Ram P. T.; Minna J. D.; Diao L.; Tong P.; Heymach J. V.; Hill S. M.; Dondelinger F.; Stadler N.; Byers L. A.; Meric-Bernstam F.; Weinstein J. N.; Broom B. M.; Verhaak R. G.; Liang H.; Mukherjee S.; Lu Y.; Mills G. B. A pan-cancer proteomic perspective on The Cancer Genome Atlas. Nat. Commun. 2014, 5, 3887. 10.1038/ncomms4887. [DOI] [PMC free article] [PubMed] [Google Scholar]
- Zhao Y.; Jensen O. N. Modification-specific proteomics: strategies for characterization of post-translational modifications using enrichment techniques. Proteomics 2009, 9, 4632–4641. 10.1002/pmic.200900398. [DOI] [PMC free article] [PubMed] [Google Scholar]
- Jeong K.; Kim S.; Bandeira N. False discovery rates in spectral identification. BMC Bioinf. 2012, 13 (Suppl 16), S2. 10.1186/1471-2105-13-S16-S2. [DOI] [PMC free article] [PubMed] [Google Scholar]
- Ye D.; Fu Y.; Sun R. X.; Wang H. P.; Yuan Z. F.; Chi H.; He S. M. Open MS/MS spectral library search to identify unanticipated post-translational modifications and increase spectral identification rate. Bioinformatics 2010, 26, i399–406. 10.1093/bioinformatics/btq185. [DOI] [PMC free article] [PubMed] [Google Scholar]
- Shortreed M. R.; Wenger C. D.; Frey B. L.; Sheynkman G. M.; Scalf M.; Keller M. P.; Attie A. D.; Smith L. M. Global Identification of Protein Post-translational Modifications in a Single-Pass Database Search. J. Proteome Res. 2015, 14, 4714–4720. 10.1021/acs.jproteome.5b00599. [DOI] [PMC free article] [PubMed] [Google Scholar]
- Chick J. M.; Kolippakkam D.; Nusinow D. P.; Zhai B.; Rad R.; Huttlin E. L.; Gygi S. P. A mass-tolerant database search identifies a large proportion of unassigned spectra in shotgun proteomics as modified peptides. Nat. Biotechnol. 2015, 33, 743–749. 10.1038/nbt.3267. [DOI] [PMC free article] [PubMed] [Google Scholar]
- Wenger C. D.; Coon J. J. A proteomics search algorithm specifically designed for high-resolution tandem mass spectra. J. Proteome Res. 2013, 12, 1377–1386. 10.1021/pr301024c. [DOI] [PMC free article] [PubMed] [Google Scholar]
- Geiger T.; Wehner A.; Schaab C.; Cox J.; Mann M. Comparative proteomic analysis of eleven common cell lines reveals ubiquitous but varying expression of most proteins. Mol. Cell. Proteomics 2012, 11, M111 014050. 10.1074/mcp.M111.014050. [DOI] [PMC free article] [PubMed] [Google Scholar]
- Blankenberg D.; Von Kuster G.; Coraor N.; Ananda G.; Lazarus R.; Mangan M.; Nekrutenko A.; Taylor J. Galaxy: a web-based genome analysis tool for experimentalists. Curr. Protoc Mol. Biol. 2010, 11–21. 10.1002/0471142727.mb1910s89. [DOI] [PMC free article] [PubMed] [Google Scholar]
- Giardine B.; Riemer C.; Hardison R. C.; Burhans R.; Elnitski L.; Shah P.; Zhang Y.; Blankenberg D.; Albert I.; Taylor J.; Miller W.; Kent W. J.; Nekrutenko A. Galaxy: A platform for interactive large-scale genome analysis. Genome Res. 2005, 15, 1451–1455. 10.1002/0471250953.bi1004s9. [DOI] [PMC free article] [PubMed] [Google Scholar]
- Goecks J.; Nekrutenko A.; Taylor J.; Galaxy: a comprehensive approach for supporting accessible, reproducible, and transparent computational research in the life sciences. Genome Biol. 2010, 11, R86. 10.1186/gb-2010-11-8-r86. [DOI] [PMC free article] [PubMed] [Google Scholar]
- Trapnell C.; Pachter L.; Salzberg S. L. TopHat: discovering splice junctions with RNA-Seq. Bioinformatics 2009, 25, 1105–1111. 10.1093/bioinformatics/btp120. [DOI] [PMC free article] [PubMed] [Google Scholar]
- Cingolani P.; Platts A.; Wang L.; Coon M.; Nguyen T.; Wang L.; Land S. J.; Lu X.; Ruden D. M. A program for annotating and predicting the effects of single nucleotide polymorphisms, SnpEff: SNPs in the genome of Drosophila melanogaster strain w1118; iso-2; iso-3. Fly 2012, 6, 80–92. 10.4161/fly.19695. [DOI] [PMC free article] [PubMed] [Google Scholar]
- Elias J. E.; Gygi S. P. Target-decoy search strategy for increased confidence in large-scale protein identifications by mass spectrometry. Nat. Methods 2007, 4, 207–214. 10.1038/nmeth1019. [DOI] [PubMed] [Google Scholar]
- Käll L.; Storey J. D.; MacCoss M. J.; Noble W. S. Posterior Error Probabilities and False Discovery Rates Two Sides of the Same Coin. J. Proteome Res. 2008, 7, 40–44. 10.1021/pr700739d. [DOI] [PubMed] [Google Scholar]
- Salzman J.; Jiang H.; Wong W. H. Statistical Modeling of RNA-Seq Data. Stat Sci. 2011, 26, 62–83. 10.1214/10-STS343. [DOI] [PMC free article] [PubMed] [Google Scholar]
Associated Data
This section collects any data citations, data availability statements, or supplementary materials included in this article.