Summary
The RAS/MAPK-signalling pathway is frequently deregulated in non-small cell lung cancer (NSCLC), often through KRAS activating mutations1-3. A single endogenous mutant Kras allele is sufficient to promote lung tumour formation in mice but malignant progression requires additional genetic alterations4-7. We recently showed that advanced lung tumours from KrasG12D/+;p53-null mice frequently exhibit KrasG12D allelic enrichment (KrasG12D/Kraswild-type>1)7, implying that mutant Kras copy gains are positively selected during progression. Through a comprehensive analysis of mutant Kras homozygous and heterozygous MEFs and lung cancer cells we now show that these genotypes are phenotypically distinct. In particular, KrasG12D/G12D cells exhibit a glycolytic switch coupled to increased channelling of glucose-derived metabolites into the TCA cycle and glutathione biosynthesis, resulting in enhanced glutathione-mediated detoxification. This metabolic rewiring is recapitulated in mutant KRAS homozygous NSCLC cells and in vivo, in spontaneous advanced murine lung tumours (which display a high frequency of KrasG12D copy gain), but not in the corresponding early tumours (KrasG12D heterozygous). Finally, we demonstrate that mutant Kras copy gain creates unique metabolic dependences that can be exploited to selectively target these aggressive mutant Kras tumours. Our data demonstrate that mutant Kras lung tumours are not a single disease but rather a heterogeneous group comprised of two classes of tumours with distinct metabolic profiles, prognosis and therapeutic susceptibility, which can be discriminated based on their relative mutant allelic content. We also provide the first in vivo evidence of metabolic rewiring during lung cancer malignant progression.
The Ras pathway8 is frequently upregulated during the malignant progression of mutant Kras tumours5,9, indicating that this transition requires further increased Ras activity. But how this activity may contribute to malignant progression remains unclear. We recently identified mutant Kras (Krasmut) copy gains in high-grade murine lung tumours7 and mutant-specific gains have also been reported in NSCLC2,10. We thus hypothesized that the gain of a second Krasmut copy affords additional oncogenic phenotypes to Kras heterozygous cells. To identify such potential gain-of-function phenotypes, we compared the acute impact of KrasG12D-endogenous allele11 activation in heterozygous and homozygous KrasG12D mouse embryonic fibroblasts (MEFs). MEFs were generated on a p53-null background12 (Extended Data Fig. 1a) to recapitulate the tumour genotype where KrasG12D copy gains were identified7 but for simplicity, hereafter they will be termed Kraswild-type/wild-type (WT/WT), KrasG12D/WT and KrasG12D/G12D.
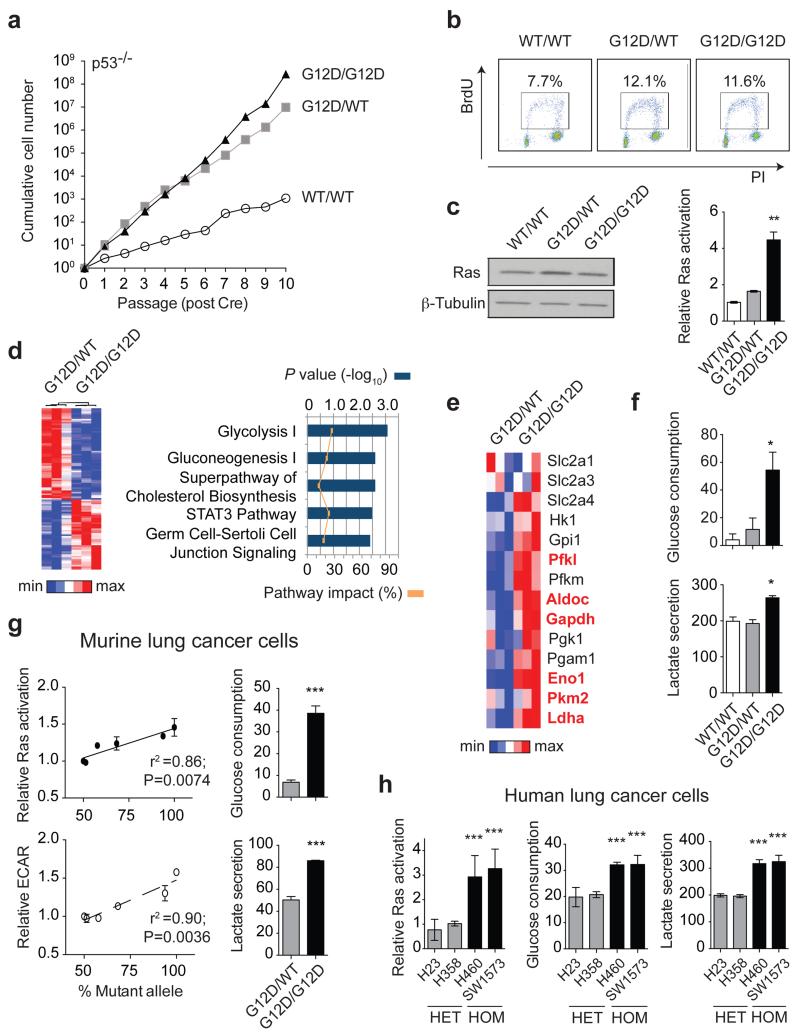
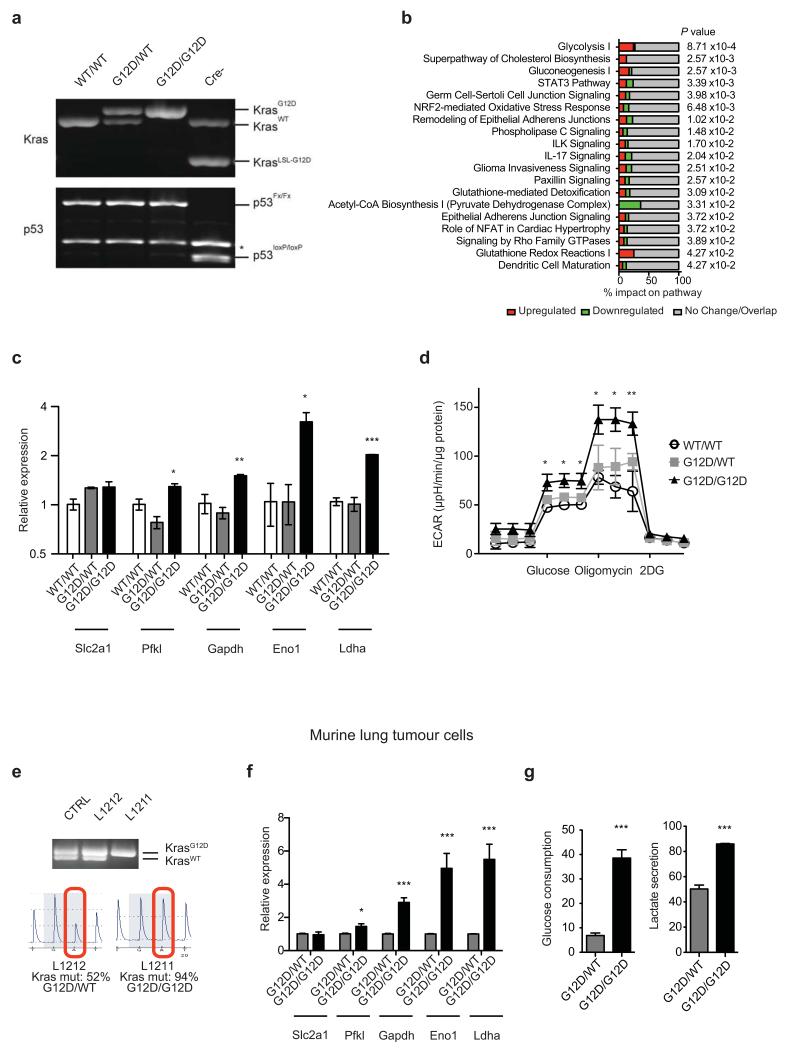
As reported11, KrasG12D/WT cells showed a proliferative advantage relative to KrasWT/WT MEFs. Surprisingly, KrasG12D/WT and KrasG12D/G12D cells grew similarly at early passages (P1-P5) (Fig. 1a,b), indicating that proliferation is not directly affected by Krasmut copy gain. A growth advantage of KrasG12D/G12D cells was nevertheless observed after P6. To identify both immediate and proliferation-independent KrasG12D copy gain-dependent effects subsequent analyses were restricted to early passages. While KRAS amplifications are typically associated with increased expression2,10, KrasG12D/WT and KrasG12D/G12D Ras protein levels were comparable and only slightly increased relative to KrasWT/WT MEFs. Nevertheless, KrasG12D/G12D MEFs exhibited a ~2-fold increase in activated Ras relative to KrasG12D/WT cells (Fig. 1c), indicating that mutant copy gain may have functional implications. In agreement, microarray analysis identified 1666 genes differentially regulated (>1.3 fold) between KrasG12D/G12D and KrasG12D/WT MEFs, with glycolysis being the most significantly altered pathway (Fig. 1d and Extended Data Fig.1b).
Figure 1. Mutant Kras copy gain upregulates glycolysis in MEFs and lung tumour cells.
a, Proliferative rate of KrasWT/WT (WT/WT), KrasG12D/WT (G12D/WT) and KrasG12D/G12D (G12D/G12D);p53Fx/Fx MEFs. b, FACS analysis denoting BrdU+ MEFs. c, MEF Ras levels (immunoblotting) and activation (Raf-GST pull-down, normalised to WT/WT). d, Heatmap illustrating differential gene expression between G12D/WT and G12D/G12D MEFs (n=3/genotype, microarray); top canonical pathways altered shown (IPA). e, Glycolytic gene expression (MEF microarray-based heatmap). Genes significantly upregulated in G12D/G12D cells highlighted (Bold red, t-test). f, MEF glucose consumption and lactate secretion. g, Left: KrasG12D/KrasTotal allelic frequency (pyrosequencing) versus Ras activation or glycolysis (ECAR) in KrasG12D/WT;p53-deficient murine lung tumour cells (n=6) (Pearson’s correlation). Right: Glucose consumption and lactate secretion in G12D/WT and G12D/G12D cell line pair (t-test). h, Ras activation (normalised to H358), glucose consumption and lactate secretion in KRASmut heterozygous (HET: H23, H358) or homozygous (HOM: H460, SW1573) NSCLC cell lines. c,f,h, one-way ANOVA. a-c, Representative data of three independent MEFs/genotype; d-f, n=3/genotype. g,h, (histograms) Representative data (n=3 independent experiments). All graphs depict triplicate mean ±s.d (error bars). ***P<0.001, **P<0.01, *P<0.05.
Mutant Kras activity enhances glucose uptake and rewires glucose metabolism into the hexosamine biosynthesis and pentose phosphate pathways in pancreatic ductal adenocarcinoma13. However, its metabolic impact on other cancer types and more importantly, that of Krasmut copy gain is unclear. KrasG12D/WT and KrasWT/WT MEFs showed similar glycolytic gene expression profiles with the exception of Slc2a1 (Glut1) and Slc2a3 (Glut3, data not shown). In contrast, in KrasG12D/G12D MEFs glycolytic gene expression was significantly upregulated and mirrored by increased glucose uptake, lactate secretion and glycolytic capacity (Fig. 1e,f and Extended Data Fig. 1c,d). Thus, we show that KrasG12D copy gain induces a glycolytic switch while a Kras mutation per se is not sufficient to upregulate glycolysis. Notably, analysis of murine lung tumour cell lines with distinct Kras G12D/WT allelic content revealed a direct correlation between increased KrasG12D copy number (KrasG12D/total Kras) and enhanced GTPase activity and glycolysis (ECAR), consistent with a “Krasmut-dosage” effect. Glycolytic gene expression, glucose uptake and lactate secretion were also significantly enhanced in KrasG12D/G12D relative to heterozygous tumour cells (Fig. 1g and Extended Data Fig. 1e-g). Importantly, Krasmut homozygosity is highly prevalent (48.6%) within mutant KRAS NSCLC cell lines (COSMIC), underscoring its relevance and enabling the validation of our findings in a clinically relevant NSCLC model. Reassuringly, the distinct glycolytic phenotypes of KRASmut heterozygous and homozygous cells were confirmed in NSCLC cells (Fig. 1h and Extended Data Table 1), demonstrating that glycolysis upregulation is a Krasmut copy gain-associated gain-of-function.
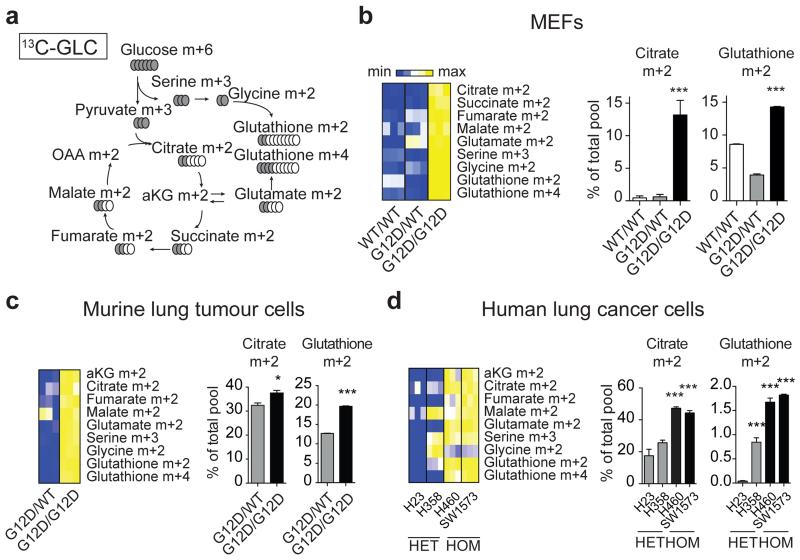
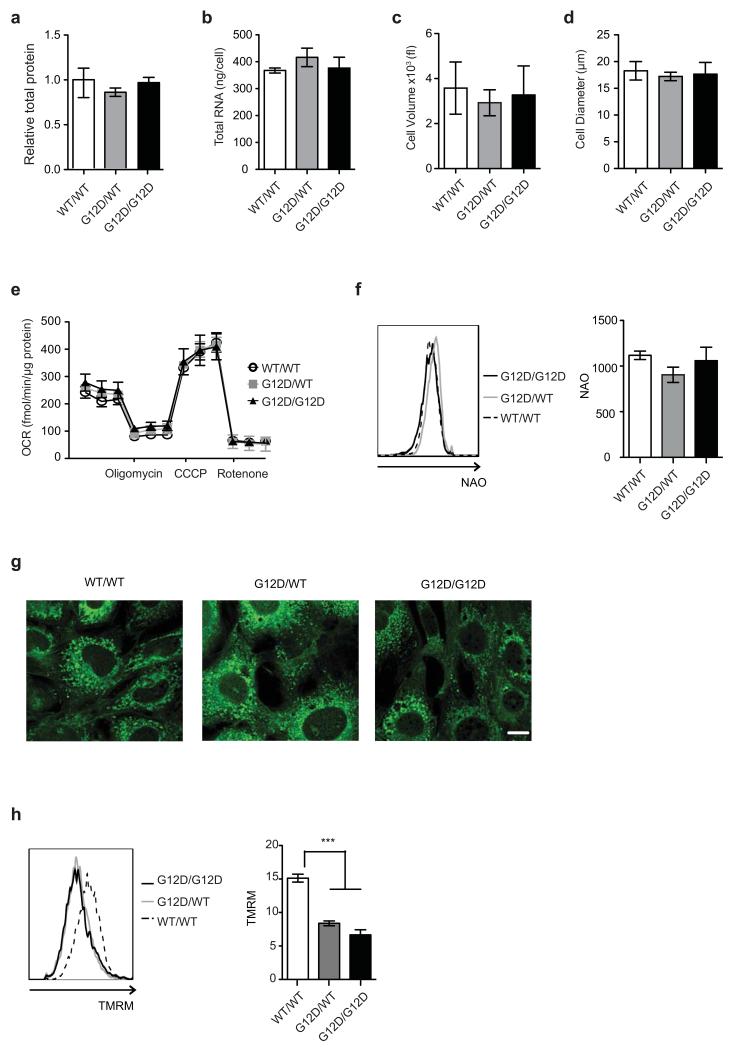
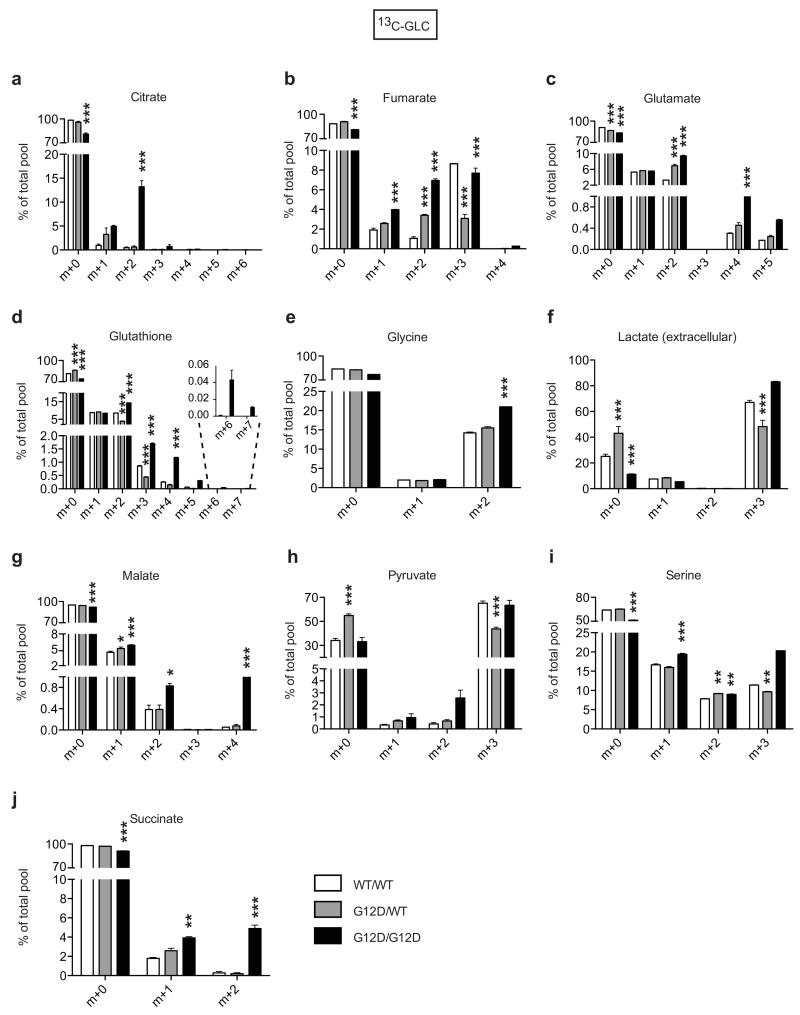
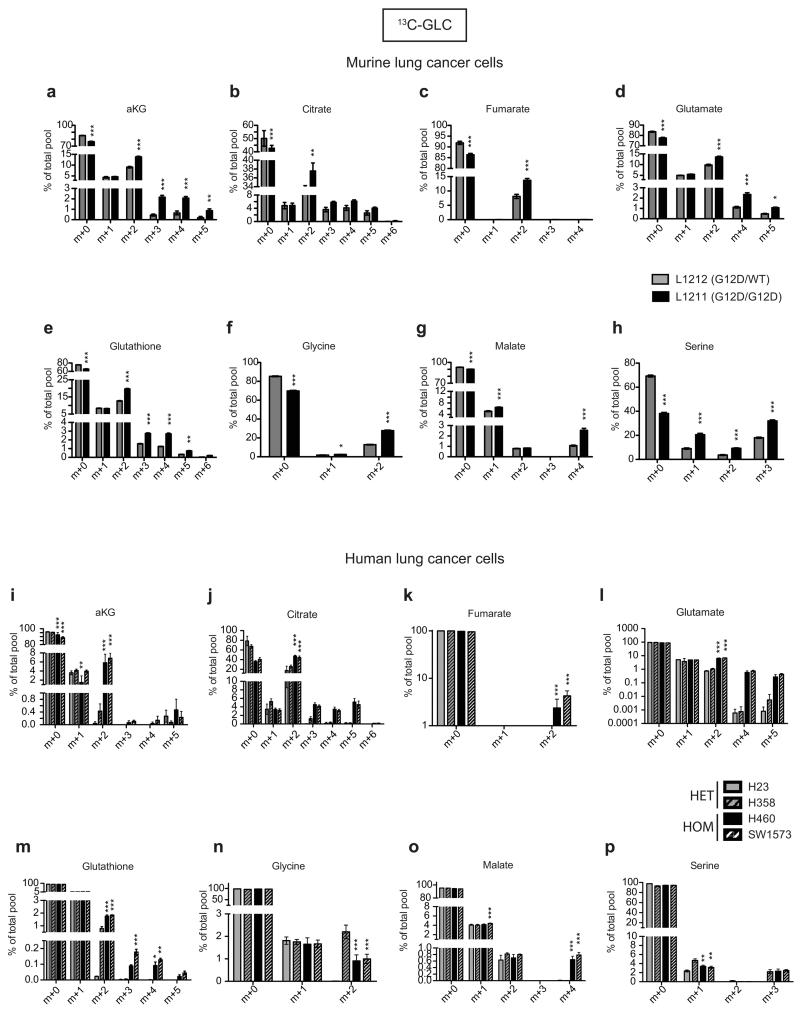
Enhanced glycolysis is a well-recognised cancer phenotype typically associated with increased growth demands, and/or compensatory adaptation to mitochondrial defects14,15. Yet, early passage KrasG12D/G12D MEFs displayed a glycolytic switch relative to KrasG12D/WT cells despite exhibiting comparable proliferative rates, cell volume, diameter, protein and RNA content (Fig. 1a,b and Extended Data Fig. 2a-d). Furthermore, mitochondrial morphology and function were similar across genotypes (Extended Data Fig. 2e-h), despite a KrasG12D-associated decrease in membrane potential, as reported under overexpression conditions15,16. We then hypothesised that this glycolytic switch reflected alternative glucose utilization by KrasG12D/G12D cells. Metabolomics analysis confirmed the enhanced glycolytic phenotype of KrasG12D/G12D cells and unexpectedly, uncovered a significant increase in glucose-derived TCA cycle metabolites in Krasmut homozygous MEFs and (murine and human) lung tumour cells (Fig. 2 and Extended Data Fig. 3,4), confirming their intact mitochondrial function. More importantly, these data identified a Krasmut copy gain-specific metabolic rewiring and uncovered a (TCA-coupled) glucose metabolism signature not previously associated with mutant Kras activity.
Figure 2. Mutant Kras copy gain drives glycolysis and directs glucose metabolism towards TCA cycle and glutathione synthesis.
Glucose metabolism flux analysis. a, Carbon flux (grey) from uniformly labelled 13C-glucose (13C-GLC) illustrated. Glucose metabolism profiles of indicated MEFs (b), murine (c) and human lung cancer cells (d) following LC-MS analysis. b-d, Representative data depict abundance of selected labelled metabolites. Triplicates (heatmaps) and triplicate mean ±s.d (graphs) shown. MEFs and human cell lines: one-way ANOVA; murine cell lines: t-test. ***P<0.001, *P<0.05.
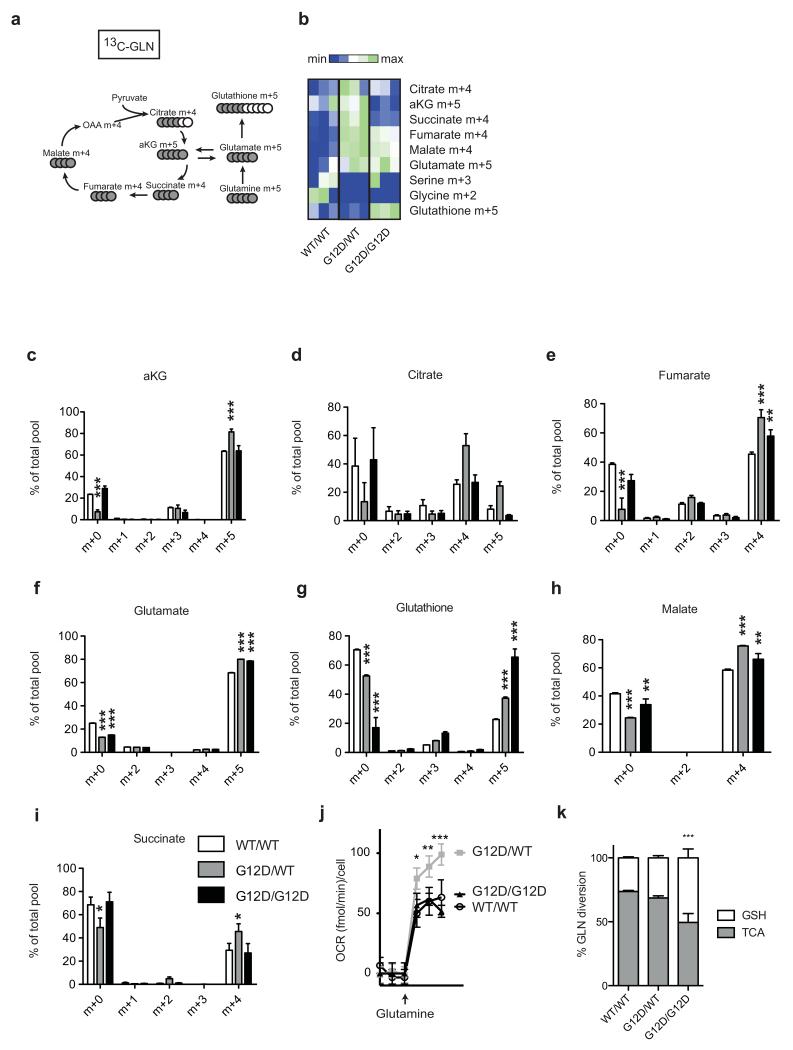
Despite their differential glucose utilisation, KrasG12D/WT and KrasG12D/G12D MEFs had similar oxidative phosphorylation levels (Extended Data Fig.2e), hinting to additional TCA cycle differences. Since Krasmut cells were reported to preferentially utilise glutamine, rather than glucose, to fuel the TCA cycle17,18 glutamine metabolism was assessed. Glutamine-derived TCA cycle metabolites were increased in KrasG12D/WT cells and glutamine-derived oxygen consumption was also enhanced in KrasG12D/WT, but not KrasG12D/G12D, relative to KrasWT/WT MEFs (Extended Data Fig.5a-j). However, unlike the genotype-specific glucose metabolism signatures, differential glutamine utilisation could not be consistently recapitulated in tumour cells (data not shown), possibly reflecting their proliferative and oxygen consumption rate (OCR) heterogeneity. Thus, KrasG12D/WT-specific glutamine metabolism rewiring is either MEF-specific or masked by other mutations in cancer cells.
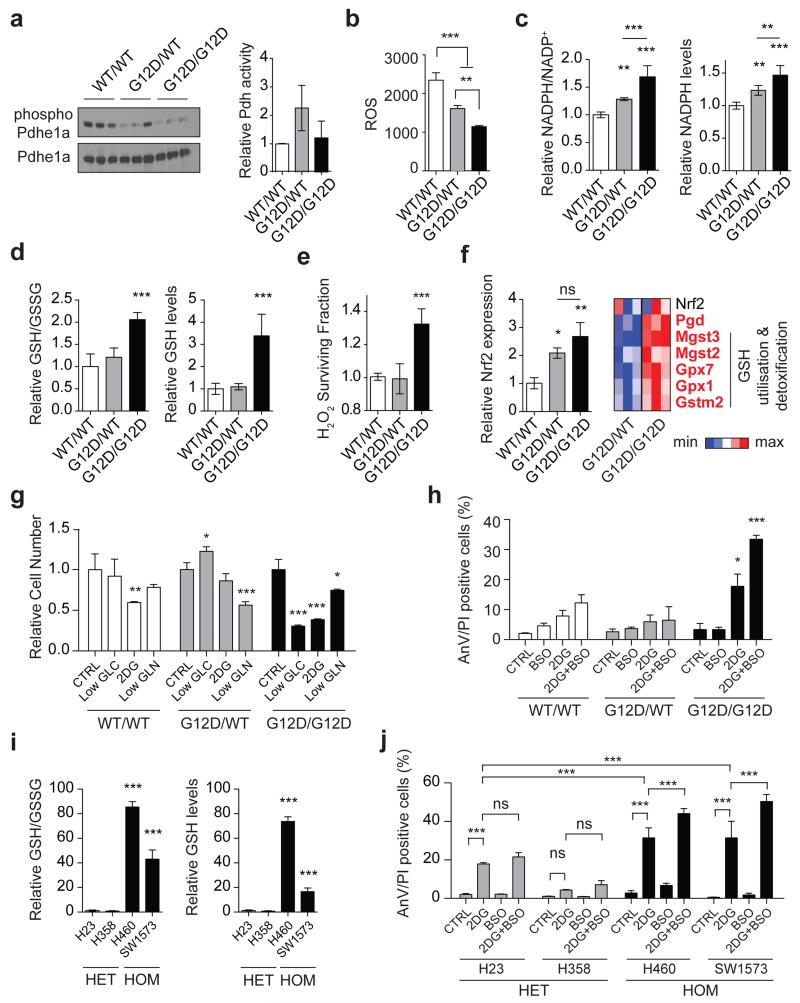
Enhanced pyruvate dehydrogenase (Pdh) activity19 could explain the glucose metabolism reprogramming exhibited by homozygous cells. But since KrasG12D/G12D and KrasG12D/WT MEFs showed comparable Pdhe1a expression and Pdh activity (Fig. 3a) we speculated that instead, genotype-specific metabolic requirements drive this metabolic switch. Surprisingly, our metabolomics data showed that glutathione (GSH) and its precursors serine, glycine and glutamate were strikingly enriched with glucose-derived carbons in Krasmut homozygous cells (Figure 2 and Extended Data Fig. 3c-e,i,4d-f,h,l,m), implying that Krasmut copy gain rewired glucose metabolism towards glutathione biosynthesis. Even glutamine was more efficiently metabolised towards GSH biosynthesis in KrasG12D/G12D MEFs (Extended Data Fig. 5g,k). We therefore assessed the impact of KrasG12D-gain on redox management. Consistent with previous reports18,20, KrasG12D/WT MEFs showed decreased ROS levels and increased NADPH/NADP+ ratio relative to KrasWT/WT. Nevertheless, KrasG12D/G12D MEFs exhibited a more striking antioxidant signature, marked by significantly increased NADPH and GSH synthesis, NADPH/NADP+ and GSH/GSSG ratios and conversely, lower ROS levels and increased resistance to ROS-inducing agents (H2O2) (Fig. 3b-e and Extended Fig. 6a). Mutant Kras was previously associated with enhanced expression and activity of the antioxidant programme regulator Nrf221 in KrasG12D/WT;p53+/+ MEFs20, potentially explaining the increased redox potential of our KrasG12D/G12D;p53−/− MEFs. Despite exhibiting comparable Nrf2 expression to heterozygous (Fig. 3f), KrasG12D/G12D MEFs showed upregulation of Nrf2-regulated GSH utilisation genes21, indicating that increased Nrf2-mediated detoxification may contribute to their metabolic rewiring.
Figure 3. Mutant Kras copy-number dictates redox state, metabolic dependencies and therapeutic susceptibilities.
a, Total and phosphorylated Pdhe1a levels and Pdh activity in MEFs. b, Cellular ROS (CellRox); c, NADPH/NADP+ ratio and NADPH levels; d, GSH/GSSG ratio and GSH levels in MEFs. e, MEF survival upon 24 hrs H2O2 treatment. f, Nrf2 and Nrf2-target gene expression in MEFs (left: qPCR; right: microarray). Nrf2-targets significantly upregulated in homozygous MEFs highlighted (bold red, t-test). g, MEF viability after 72 hrs culture in low glucose (Low GLC), 2DG or low glutamine (Low GLN), relative to normal media (CTRL). h, Percentage of AnnexinV+/PI+ (AnV/PI positive, FACS) MEFs upon 48 hrs BSO, 2DG, or combined (2DG+BSO) treatment. i, GSH/GSSG ratio and GSH levels in KRASmut NSCLC cells. j, NSCLC cells treated as in (h). Triplicate mean ±s.d. shown for three independent MEFs/genotype (a,c,d,f) or for representative data (3 independent runs) (b,e,g,h,i,j). Data normalised to WT/WT (a,c-f) or HET mean (i). One-way (a-f,i) or two-way ANOVA (g,h,j). ***P<0.001, **P<0.01, *P<0.05, ns= not significant.
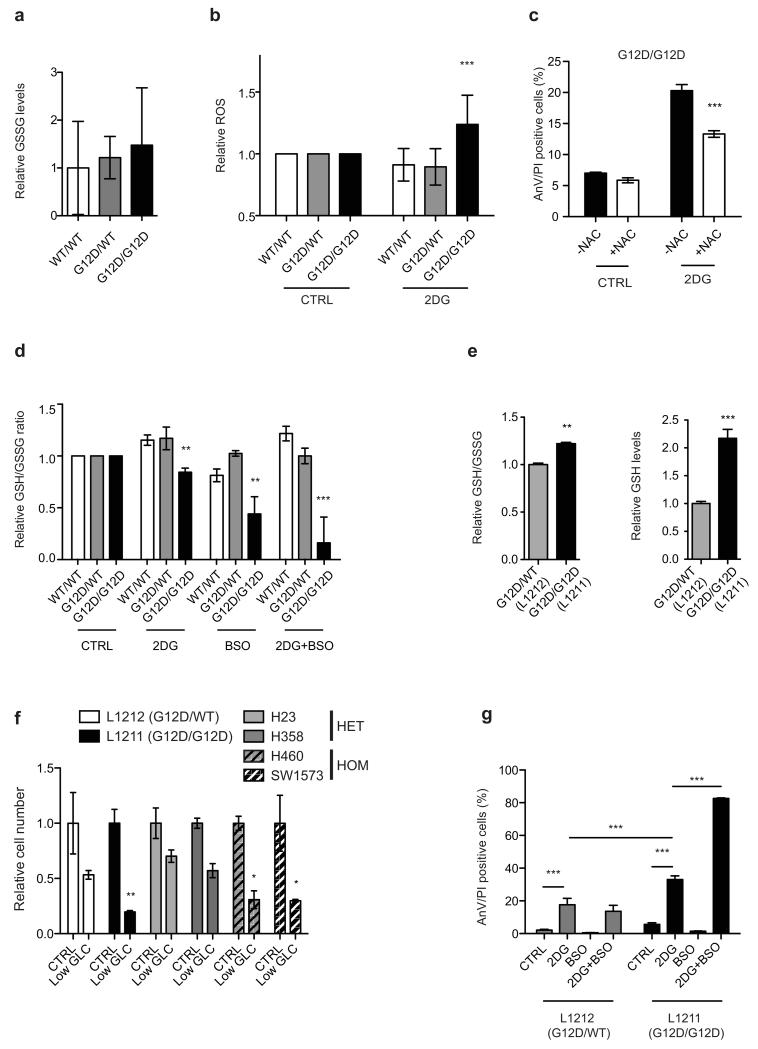
The metabolic heterogeneity of Krasmut cells can potentially limit the efficacy of generalised targeting approaches22, prompting us to explore potential Krasmut copy number-dependent susceptibilities. Unlike heterozygotes, KrasG12D/G12D MEFs were very sensitive to low glucose levels and the glucose analogue 2-Deoxy-D-glucose (2DG), which induced a dramatic apoptotic response (Fig. 3g,h). In turn, KrasG12D/WT MEFs showed higher sensitivity to low glutamine. Confirming a reliance on glucose for efficient ROS management, KrasG12D/G12D cells (but not KrasWT/WT or KrasG12D/WT) showed increased ROS levels upon 2DG treatment, while N-acetyl-L-cysteine (NAC, GSH precursor) partially rescued their 2DG-induced apoptosis (Extended Data Fig. 6b,c). Moreover, combined 2DG and L-buthionine-S,R-sulfoximine (BSO, GSH biosynthesis inhibitor23) treatment induced drastic, KrasG12D/G12D-specific apoptosis and reduction in GSH/GSSG ratio (Fig. 3h and Extended Data Fig. 6d). Likewise, murine and human Krasmut homozygous lung cancer cells exhibited increased GSH levels, GSH/GSSG ratio and enhanced sensitivity to low glucose, 2DG and 2DG/BSO, relative to heterozygotes (Fig. 3i,j and Extended Data Fig. 6e-g), revealing a mutant Kras copy gain-specific susceptibility to glucose and glutathione depletion in lung cancer cells.
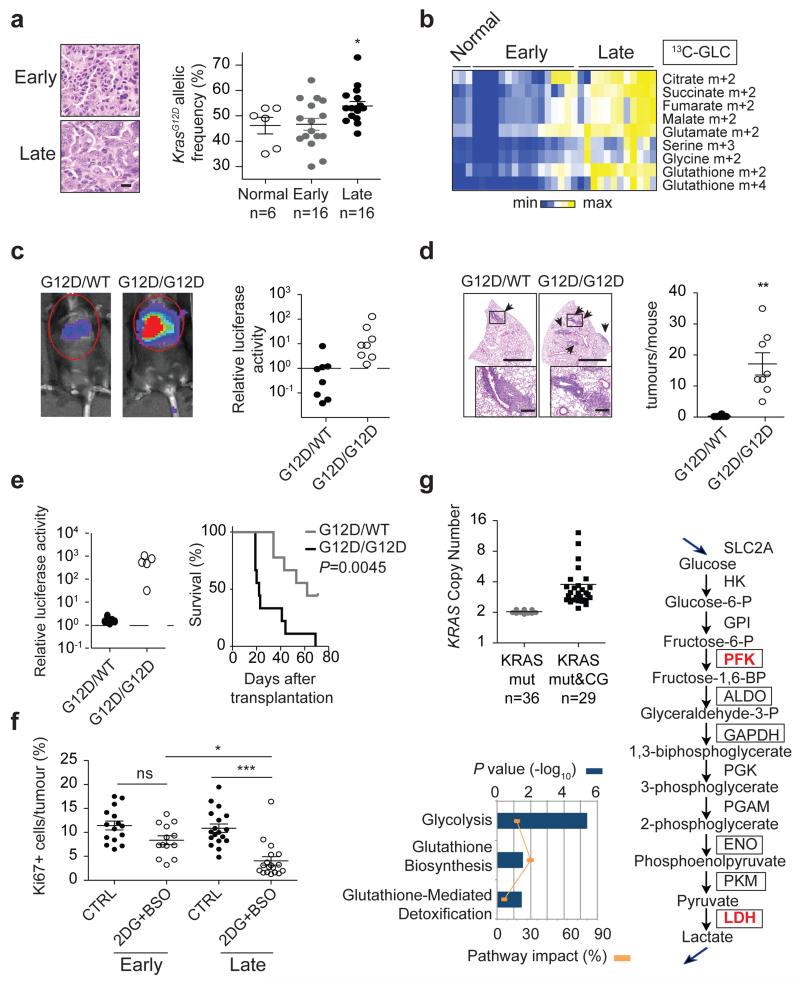
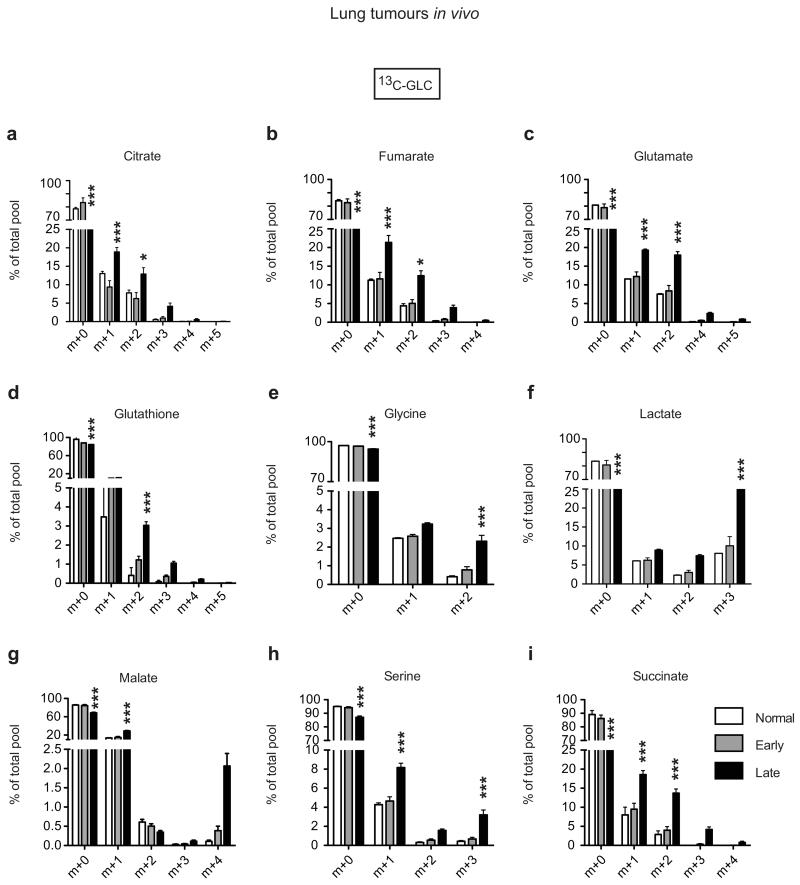
Finally, we defined the metabolic impact of KrasG12D copy gain in vivo using the spontaneous KrasG12D/+;p53−/− lung tumours where these gains were originally reported7. These tumours progress over time from low- to high-grade, with KrasG12D gains being associated with the latter, prompting us to compare glucose flux in early (mostly low-grade) and late (typically advanced) tumours. Control or tumour-bearing mice were infused with 13C-glucose and normal lung or individual tumours isolated for LC-MS analysis and biopsied for Kras locus assessment. Early tumours and control lung showed similar KrasG12D allelic content (mean 46.7 and 46.2% respectively; Fig. 4a), demonstrating that early lesions are predominantly heterozygous. In contrast, late tumours showed increased KrasG12D allelic prevalence (mean >50%), confirming mutant enrichment in advanced disease7. Importantly, and consistent with our in vitro data, late tumours exhibited an increase in glucose-derived TCA cycle metabolites, as well as serine, glycine and GSH (Fig. 4b and Extended Data Fig. 7). Notably, by showing that early and late tumours have distinct metabolic profiles we provide, to our knowledge, the first evidence of in vivo metabolic reprogramming during lung cancer malignant progression.
Figure 4. Mutant Kras copy gain results in increased malignancy and metabolic rewiring in vivo.
a, Representative H&E sections (scale bar: 20 μm) and KrasG12D allelic frequency (pyrosequencing) in independent KrasG12D/+;p53Fx/Fx early and late lung tumours (n=4 mice/cohort) and normal lung (“Early”, “Late”, “Normal”; respectively). b, Relative abundance of selected 13C-glucose-derived metabolites (LC-MS) in samples from (a) (n=3 Normal, n=16 Early, n=12 Late). c, Representative imaging and luciferase activity/mouse 3 weeks after MEF transplantation (n=8/genotype). d, Representative H&E and quantification of lung tumours in MEF recipients (t-test). Arrows: lung tumours, scale bars: 2 mm (large), 250 μm (small). e, Left: luciferase imaging of lung cancer cell recipients (L1212, L1211), 3 weeks after transplantation (n=5/genotype, left). Right: recipient survival (Kaplan-Meier, n=9/genotype). f, Ki67+ quantification of Early and Late tumours treated for 48 hrs with 2DG+BSO or vehicle (CTRL) (n=3 mice/cohort). g, KRASmut TCGA lung adenocarcinoma1 analysis following tumour segregation into “KRASmut” (mutation) and “KRASmut&CG” (mutation+copy gain) cohorts. KRAS copy number/tumour shown (upper left). Differential expression of glycolysis and glutathione pathway genes illustrated (RNAseq, IPA; bottom left). Glycolytic genes significantly upregulated in KRASmut&CG tumours (bold red, RNAseq) or G12D/G12D MEFs (boxes, microarray) relative to heterozygous illustrated (right). Mean ±s.e.m (a,f,) or ±s.d. (d) shown. a,e, One-way Anova. ***P<0.001, **P<0.01, *P<0.05, ns= not significant.
KrasG12D copy gain also drove increased malignancy in MEFs and lung cancer cells (Fig. 4c-e). Accordingly, KrasG12D/G12D MEFs showed a highly penetrant colonisation phenotype inducing lung tumours in 8/8 recipient mice following intravenous (i.v.) transplantation. In contrast, none of the KrasWT/WT (n=5, data not shown) and only 1/8 KrasG12D/WT recipients developed a lung lesion. Similarly, KrasG12D/G12D lung cancer cells exhibited a significantly increased metastatic potential relative to heterozygous cells, establishing a direct link between Krasmut gains and lung cancer malignancy.
Lastly, we defined the therapeutic impact of glucose metabolism rewiring in vivo by treating early and late lung tumours with 2DG+BSO. Similarly to MEFs and lung cancer cells, late tumours (where KrasG12D allele prevalence is increased (Fig. 4a)), were significantly more sensitive than early tumours to 2DG+BSO treatment (Fig. 4f). Thus, despite the presence of a KrasG12D allele (and p53 inactivation) in both groups and their comparable proliferation (Fig. 4f, CTRL), low and high-grade lung tumours have distinct and mutant Kras copy number-dependent therapeutic susceptibilities.
Kras allelic imbalance7 and mutant Kras upregulation9 were shown to select for p53 inactivation and correlate with tumour progression but the oncogenic effects of enhanced mutant Kras signalling remained unclear. Here we show that even in the absence of p53, KrasG12D/WT and KrasG12D/G12D cells are phenotypically distinct, with mutant Kras copy gain driving gain-of-functions that include upregulation and reprogramming of glucose metabolism, enhanced ROS management and increased metastatic potential. It is possible that loss of the KrasWT allele contributes to the phenotypes observed in KrasG12D/G12D cells24,25. However, since the majority of advanced murine lung tumours retain the wild-type allele (Fig. 4a) we argue that mutant Kras gains are the more likely target of positive selection during lung cancer progression. In agreement, KRASWT-loss is uncommon while mutant and wild-type KRAS gains are frequent features of mutant KRAS human lung adenocarcinoma2,10,26.
Importantly and consistent with our findings, TCGA copy number variation (CNV) and RNAseq data analysis of 65 mutant KRAS lung adenocarcinomas1 revealed that, despite likely allelic gain heterogeneity10, combined KRAS mutation and copy gain correlate with glycolysis and glutathione metabolism pathway upregulation (KRASmut&CG, Fig. 4g and Extended Data Table 2). These data confirm that mutant KRAS lung tumours are not a single metabolic entity and that, similarly to murine tumours, they may comprise (at least) two disease subgroups with distinct genetic and metabolic signatures and unique therapeutic susceptibilities. We argue that this heterogeneity may have contributed to the poor treatment responses of KRAS mutant tumours and hence, that combined quantitative and qualitative KRAS locus assessment may have both prognostic and therapeutic utility.
Methods
Mice, adenoviral infection and treatments
Animals were maintained under SPF conditions and in compliance with UK Home Office regulations. KrasLSL-G12D (6) mice were crossbred to p53Fx (12) to obtain mixed background (C57Bl/6/129/Sv) KrasLSL-G12D/+;p53Fx/Fx (for spontaneous tumours and MEF generation) or Kras+/+,p53+/+ (transplantation recipients) mice. Endogenous lung tumours were generated through intranasal administration of 8-10 week-old KrasLSL-G12D/+;p53Fx/Fx mice (termed KrasG12D/WT;p53null) with Cre-expressing adenovirus (5 × 10⁷ plaque-forming units per mouse, University of Iowa Vector Core, USA), as previously described7. For therapeutic studies tumour bearing mice were treated 12 (early group) or 16 weeks (late group) after Cre administration with a combination of 1000 mg/kg 2DG and 10 mmol/kg BSO or vehicle (saline) once a day for 2 days (i.p.). Lungs were collected 24 hrs after the last treatment and formalin fixed (of note: 2DG+BSO treatment was sometimes associated with a temporary decrease in motility in both control and tumour bearing mice).
For transplantation studies 8-12 week-old syngeneic wild-type mice were sub-lethally irradiated (4Gy, Cesium source) 6 hrs prior to tail vein injection with 1×10⁵ cells in 100 μl PBS. Baseline luminescence values were collected 24 hrs after transplantation and tumour growth monitored weekly by bioluminescence imaging following i.p. injection with D-luciferin (150 mg/kg) using an IVIS Spectrum Xenogen machine (Caliper Life Sciences). Relative luciferase activity corresponds to change from baseline at indicated timepoint, normalised to blank control (luciferase-negative animal). For tumour load analysis lungs were collected 3 weeks after transplantation while tumour survival represents the onset of moderate signs of disease. Two independent MEFs per genotype were used in transplantation studies (four recipients/MEF line). Lung cancer cell lines (L1211 and L1212) were each transplanted onto five (tumour load study) or nine recipient mice (survival). All studies involved animals of both sexes and no animals were excluded from the analysis. Cohort sizes were calculated based on published data7 and pilot studies and animals randomised based on gender and age. Tumour analysis was carried out blindly. No tumour exceeded the maximum size approved by the animal welfare committee/regulations.
Generation and culture of MEFs and tumour cell lines
For MEF generation, KrasLSL-G12D/+ ;p53Fx/Fx animals were interbred and embryos collected at day E12.5, to overcome KrasLSL-G12D/G12D embryonic lethality27, and Cre-mediated recombination performed immediately after MEF generation. In short, cells were cultured in DMEM supplemented with 10% FBS, 2 mM L-Glutamine for one passage and then infected with adenovirus-Cre (5 × 10⁷ plaque-forming units/1 × 106 cells). Cre-mediated recombination was confirmed by PCR. MEF data were typically obtained using 3 independent MEFs/genotype and a minimum of 2 independent MEFs/genotype was used in all cases. All (short-term) assays were performed in low-passage MEFs (P1-4 post-Cre). For assessment of proliferative capacity MEFs were cultured under standard 3T3 protocol. Briefly, at every passage 3 × 10⁵ cells were plated in triplicate on 6 cm plates and counted 3 days later. Cumulative cell number was calculated as Log(Nf/Ni)/Log2, where Ni and Nf correspond to number of cells plated and final counts/passage, respectively. Murine lung tumour cell lines were generated from independent, spontaneous “late” lung tumours from three KrasLSL-G12D/+;p53R270H/ER (6,29) mice. Tumour cells were dissociated by collagenase/dispase (Roche) treatment and cultured in DMEM/F12 media supplemented with 10% FBS, 2 mM L-Glutamine. Human NSCLC cell lines were recently purchased from ATCC (authenticated) and cultured in RPMI media supplemented with 10% FBS, 2 mM L-Glutamine.
AnnexinV/PI FACS analysis was performed as described28. For BrdU/PI FACS cells were labelled with 10 mM BrdU (Sigma) for 2 hrs. After harvest, cells were fixed and stained with FITC-conjugated Anti-BrdU monoclonal antibody (Becton Dickinson), according to manufacturer’s protocol and resuspended in PBS containing 20 μg/ml of propidium iodide (PI). FACS was performed using a LSRII (BD, UK) flow cytometer and analysed with FlowJo software (Treestar, USA). Cell viability following nutrient deprivation and H2O2 administration was determined by trypan blue exclusion (0.4%, Gibco,) or Crystal Violet (0.2%, Sigma), respectively. For in vivo luciferase imaging MEFs and tumour cells were transduced with a MSCV-luciferase-hygromycin retrovirus and selected (350μg/ml hygromycin b) prior to i.v. transplantation. All cells used in this study tested negative for mycoplasma contamination. In vitro assays were carried out in triplicate and run at least three independent times.
Ras and Pdh expression and activity
Ras activation was determined by Raf-GST pull-down based ELISA using 100 μg protein/sample (whole cell lysates) (Merck Millipore, Ras activation Elisa kit, #17-497). Pdh activity was determined with a Pdh enzyme activity assay kit (#ab109902, Abcam), according to manufacturers instructions. Immunoblotting (40 μg protein/sample) was performed with anti-Ras (Cell Signalling, #3339), anti-phospho-Pdhe1a (Ser 293; AP1062; Calbiochem), total Pdhe1a (9H9AF5; #459400; Life Technologies) or anti-β-Tubulin (Cell Signalling #2146, loading control) antibodies.
Gene expression profiling, IPA analysis and qPCR validation
Microarray analysis was performed on three independent MEFs/genotype using Illumina MouseWG-6 v2.0 Expression BeadChip (Department of Pathology, Cambridge University). Normalised Log2 values were determined and average Log Fold Change (LogFC) calculated for each comparison. Pathway analysis of genes differentially expressed (>1.3 fold) between genotypes was performed using Ingenuity IPA analysis software (ingenuity.com) and statistical significance (P<0.05) of canonical pathways determined by Benjamini-Hochberg multiple testing correction. Relative gene expression was depicted by heatmaps generated using GENE-E software and statistical significance (P<0.05) determined by t-test. Gene expression changes were validated by qPCR using ROCHE Universal Probe Library System or Life Technologies probes and all data normalised to 18S expression.
Immunohistochemistry (IHC)
H&E and Ki67 (Bethyl labs, IHC-00375) IHC was performed on formalin-fixed, 5 μm paraffin-embedded tissue sections. For transplantation studies the total number of tumours in a single representative H&E section/animal (minimum of 4 lung lobes/section) is shown. For endogenous tumours the percentage of proliferating cells was determined as Ki67+/DAPI+ nuclei/tumour from a single representative section/animal (minimum of 4 lung lobes/section)). All cells or a minimum of 4000 (and >50% coverage) DAPI+ nuclei/tumour were counted from an average of 5.25 tumours/mouse.
Extracellular flux profiling
OCR and ECAR levels were determined using a Seahorse XFe24 analyser. 2×10⁴ MEFs or 4×10⁴ tumour cells were plated in Seahorse XFe24 assay plates. Immediately prior to analysis, media was replaced by bicarbonate free DMEM Sigma supplemented with 143 mM NaCl, 2% FBS, and where appropriate, 25 mM Glucose, 4 mM L-Glutamine, pH 7.4 and cells incubated at 37° C for 30 min in a CO2 free incubator. Each cycle of measurement involved 3 min mixing, 3 min waiting and 3 min measuring. After baseline measurements, testing agent prepared in assay medium was injected and followed by subsequent measuring cycles. Glycolysis Stress Test: measurement 1-3: basal (no glucose), 4-6: glucose (10 mM), 7-9: complex V inhibitor oligomycin (1 μM) and 10-12: 2-Deoxyglucose (2DG, 100 mM). Mitochondrial Stress Test: measurement 1-3: normal (basal + 25 mM glucose), 4-6: Oligomycin (1 μM) 7-9: carbonyl cyanide m-chlorophenylhydrazone (CCCP, 500 nM) and 10-12: Rotenone (1 μM). Protein content (BCA assay, Thermo Fisher, UK) at endpoint or cell number was used for data normalization.
Metabolomics analysis
In vitro sample preparation: 5×10⁵ MEFs or tumour cells were supplemented with media containing uniformly labelled 13C- glucose (25 mM) or glutamine (4 mM) for 4 hrs before sampling. Metabolites were extracted from media (extracellular) and cell pellet (intracellular) in 50% MeOH: 30% AcetoNitrile: 20% H2O + 100 ng/mL HEPES buffer (1 ml/106 cells). Samples were incubated at 4° C for 15 min at 700 rpm, before centrifugation at 13,000 rpm. Supernatant was transferred to vials for mass spectrometry analysis. In vivo sample preparation: KrasG12D/WT;p53Fx/Fx were anaesthetized (isofluorane inhalation) and administered a bolus of 0.4 mg/g body weight 13C- glucose by tail vein i.v. before continuous infusion of 0.012 mg/g/min at 150 μl/hrs for 3 hrs. Normal lungs and independent lung tumours were collected and snap frozen. Samples were transferred to Precellys24 tubes, metabolite extraction buffer (as above) added (250 μl/10 mg), samples homogenized, centrifuged at 13,000 rpm and supernatant used for mass spectrometry analysis. Prior to analysis tissues were biopsied for Kras allelic assessment (pyrosequencing). LC-MS metabolomics: Sequant Zic-pHilic (150 mm × 2.1 mm i.d. 5 μm) column and guard column (20 mm × 2.1 mm i.d. 5 μm) from HiChrom, Reading, UK were used for LC separation. Mobile phase A: 20 mM ammonium carbonate plus 0.1% ammonia hydroxide in water. Mobile phase B: acetonitrile. Flow rate was maintained at 180 μL/minute and gradient was as follows: 0-1 min 70% of B, 16 min 38% of B, 16.5 min 70% of B, 25 min 70% of B. Mass spectrometer (Thermo QExactive Orbitrap) was operated in full MS and polarity switching mode. Samples were randomised in order to avoid machine drifts and run in triplicate. Spectra were analysed using XCalibur Qual Browser and XCalibur Quan Browser softwares (Thermo Scientific) by referencing to an internal library of compounds. Relative metabolite abundance was calculated as percentage of total metabolite pool, and depicted graphically or as heatmap using GENE-E software. Samples were run and processed blindly.
Glucose consumption and lactate measurements
For glucose consumption analysis 1×10⁵ MEF or tumour cells were incubated for 1 hr with fluorescent 6-NBDG (N-23106, Life Technologies, UK) and analysed by FACS (% NBDG positive cells). Lactate production was assessed 48 hrs after plating using Lactate Reagent (Trinity Biotech, Ireland), according to manufacturer’s instructions. Total lactate was normalized to cell number.
TCGA dataset analysis
Lung adenocarcinoma patient TCGA data1 (no restrictions) was downloaded from c-Bioportal and KRAS mutation and copy number assessed. Tumours with a KRAS mutation and KRAS GISTIC score of 0+ were taken forward for analysis (n=65). Samples were divided into two cohorts based on GISTIC classification: KRASmut (mutation only, GISTIC=0, n=36) or KRASmut&CG (mutation and copy gain, GISTIC=1&2, n=29). KRAS copy number was calculated (2CNV×2) from SNP6 data. Pathway analysis was carried out based on RNAseq1 metabolic gene expression data (1430 genes) using IPA software, as described above.
Reagents
Metabolic probes: 6-NBDG (30 μM), Mitotracker Green (50 nM), TMRM (50 nM), NAO (200 nM) and Cell Rox deep red (5 μM) were obtained from Life Technologies (UK). Cellular ROS was determined using CellRox deep red probe (Life Technologies, UK, C10422) and FACS analysis. GSH/GSSG and NADPH/NADP levels and ratios were calculated according to manufacturers instructions (Promega, V6611 and G9081, respectively). Normal and low GLC and GLN (Sigma) correspond to 25 mM and 5 mM, and 4 mM and 0.5 mM respectively. Cells were treated with the following agents, either alone or in combination as indicated: 100 μM H2O2, 10 mM 2DG and 2 mM (tumour cells) or 5 mM BSO (MEFs). Total protein content was assessed using Sulforhodamine B (Sigma, 0.057% w/v), and total RNA content extracted with TRIzol (Life Technologies). NAC (4 mM, Sigma) was added to cells daily.
Pyrosequencing Analysis
Genomic DNA (from MEFs, tumour cells and tumours) was isolated and Kras WT/mutant allelic ratio determined by pyrosequencing (PyromarkQ24, Qiagen) according to the manufacturer's instructions. Pyrograms were analysed (PyroMarkQ24 software) and WT and mutant Kras allelic frequency determined based on standards (WT:mutant ratios 2:0, 1:1, 0:2) and shown as percentage of total Kras content.
Primers and probes
Genotyping: KrasLSL-G12D (6) and p53Fx (12) alleles were genotyped as reported. Microarray validation primers and probes: (UPL library, Roche): Gapdh: F 5′ gggttcctataaatacggactgc 3′, R 5′ ccattttgtctacgggacga 3′, Probe #52; Slc2a1: F 5′ ggatcccagcagcaagaag 3′, R 5′ ccagtgttatagccgaactgc 3′, Probe #76; Pfkl: F 5′ gggtcatgtacagcgagga 3′, R 5′ ggcctccatacccatcttg 3′, Probe #41; Eno1: F 5′ gaggacactttcatcgcagac 3′, R 5′ ccagctcttcctcaattctga 3′, Probe #77. Nrf2: Mm00477784_m1, Ldha: Mm01612132_m1 (Life Technologies), 18S: 4352930E (Thermo Fisher). Pyrosequencing: (Qiagen Q24 pyrosequencing assay) mKrasG12DF: 5′ gtaaggcctgctgaaaatgactga 3′; mKrasG12DR: 5′ [Btn]tatcgtcaaggcgctcttgc 3′, mKrasG12DS (sequencing primer) 5′ tgaaaatgactgagtataaa 3′.
Statistical Analysis
Data was visualised and statistical analyses performed using Prism 5.0 software (Graph Pad) or R statistical package. P<0.05 was considered statistically significant. In all cases, experimental groups showed comparable variance. P values for unpaired comparisons between two groups with comparable variance were calculated by two-tailed Student’s t-test. One-way ANOVA (all groups against wild-type (WT) group) was used for analysis between three or more groups with comparable variance, followed by Bonferroni post-test for individual comparisons. Ordinary two-way ANOVA (treatment groups against individual genotype control group with comparable variance) was used for analysis that involved two variables, followed by Bonferroni post-test for individual comparisons. Kaplan Meier comparison was used for analysis of survival cohorts. Pearson’s correlation analysis was used to compare relationship between variables in groups with similar distribution. TCGA gene expression data was analysed using negative binomial generalised linear model (DESeq2). *P<0.05, **P<0.01, ***P<0.001. Error bars indicate mean ±s.d. or s.e.m., as indicated.
Extended Data
Extended Data Fig. 1. Enhanced glycolysis in homozygous KrasG12D cells.
a, Representative data (n=3) of PCR analysis of the Kras and p53 loci in KrasWT/WT (WT/WT), KrasG12D/WT (G12D/WT) and KrasG12D/G12D (G12D/G12D); p53Fx/Fx MEFs after Cre-mediated recombination; and of unrecombined KrasLSL-G12D/WT;p53loxP/loxP control (Cre-) (*: background band). b, IPA analysis of canonical pathways significantly altered in KrasG12D/G12D relative to KrasG12D/WT MEF transcriptomes (n=3/genotype). c, Representative qPCR data (n=3) of glycolytic gene expression in MEFs. Fold change relative to WT/WT shown as triplicate mean ±s.d. (one-way ANOVA). d, Extracellular acidification rate (ECAR) in MEFs following exposure to glucose, oligomycin and 2DG. Representative data from three independent MEFs/genotype show mean value between triplicates ±s.d. (two-way ANOVA). e, Kras locus analysis of two lung cancer cell lines (L1212 and L1211) generated from spontaneous tumours from KrasG12D/WT;p53-deficient mice. PCR (top) and pyrosequencing (lower panel) analysis shown (L1212: Kras heterozygous - G12D/WT; L1211: G12D homozygous - G12D/G12D). Recombined heterozygous MEFs shown as PCR control (CTRL). f, Representative qPCR data (n=3) of glycolytic gene expression in L1211 and L1212 lung tumour cells. Fold change relative to heterozygous cells shown (mean of triplicates ±s.d., ***P=<0.001, *P<0.05, t-test). g, Left: basal glucose consumption in murine lung tumour cells determined by FACS analysis of 6-NBDG uptake (%). *P=0.02, t-test. Right: extracellular lactate concentration (ng/dl/cell) in murine lung tumour cells. Data are triplicate mean ±s.d. *P=0.0139, t-test.
Extended Data Fig. 2. KrasG12D/WT and KrasG12D/G12D MEFs have similar biomass and mitochondrial functionality.
a, Total protein content in indicated MEFs relative to WT/WT. b, Total RNA per cell for each of the indicated genotypes. c, d, WT/WT, G12D/WT and G12D/G12D MEFs were profiled by CASY counter (Roche) and cell volume (c) and diameter (d) measured. a-d, Mean value of three independent MEF triplicates/genotype ±s.d. shown. e, Oxygen consumption rate (OCR) of MEFs in response to oligomycin, CCCP and rotenone (two-way ANOVA). f, NAO staining was used to determine mitochondrial mass in KrasWT/WT (WT/WT), KrasG12D/WT (G12D/WT) and KrasG12D/G12D (G12D/G12D) MEFs. Geometric mean of NAO fluorescence in cells was determined by FACS. Representative overlay (left panel) and geometric mean (right panel) displayed. g, Mitochondrial architecture was examined after Mitotracker green staining in WT/WT, G12D/WT and G12D/G12D MEFs (scale= 10μm). h, TMRM staining was used to determine mitochondrial membrane potential in MEFs of indicated genotypes. Geometric mean of TMRM fluorescence in cells was determined by FACS. Representative overlay (left panel) and geometric mean (right panel) displayed. e-h, Representative data of 3 independent MEFs/genotype show mean of triplicates ±s.d., ***P<0.001, one-way ANOVA.
Extended Data Fig. 3. Glucose metabolism reprogramming in KrasG12D/G12D MEFs.
a-j, Measurement of 13C-glucose-derived metabolites, calculated as a percentage (%) of the total metabolite pool following LC-MS analysis of WT/WT, G12D/WT and G12D/G12D MEFs after 4 hrs culture with 13C-glucose supplemented media. Representative data (of 2 independent MEFs/genotype) showing mean of triplicates ±s.d., ***P<0.001, **P<0.01, *P<0.05 (two-way ANOVA). Undetected isotopologues not shown.
Extended Data Fig. 4. Glucose metabolism reprogramming in lung tumour cells with mutant Kras copy gain.
Measurement of 13C-glucose-derived metabolites, calculated as a percentage (%) of the total metabolite pool following LC-MS analysis of murine (L1211 and L1212, a-h) and human (H23, H358, H460, SW1573, i-p) mutant Kras heterozygous and homozygous lung tumour cells. Cells were cultured for 4 hrs with 13C-glucose supplemented media prior to analysis. Data show mean of triplicates ±s.d., ***P<0.001, **P<0.01, *P<0.05 (two-way ANOVA, relative to Krasmut heterozygous cells; i-p, homozygous samples significantly different from both heterozygous cell lines indicated). Undetected isotopologues not shown.
Extended Data Fig. 5. KrasG12D/WT and KrasG12D/G12D MEFs have distinct glutamine metabolism profiles.
Glutamine metabolism analysis in WT/WT, G12D/WT and G12D/G12D MEFs. a, Representation of carbon flux (grey circles) from uniformly labelled 13C-labelled glutamine (13C-GLN). b, Heatmap illustrates abundance of selected labelled metabolites across triplicates of representative MEFs (two independent MEFs/genotype analysed) based on metabolomics analysis. c-i, Measurement of 13C-glutamine-derived metabolites, calculated as a percentage of the total metabolite pool following LC-MS analysis of WT/WT, G12D/WT and G12D/G12D MEFs after 4 hrs culture with 13C-glutamine supplemented media. Representative data (2 independent MEFs/genotype) show mean of triplicates ±s.d., (two-way ANOVA). j, Oxygen consumption rate (OCR) of WT/WT, G12D/WT and G12D/G12D MEFs upon glutamine (4 mM) addition. Representative data of 3 independent MEFs/genotype showing mean of triplicates ±s.d. k, Relative diversion (%) of glutamine to TCA (aKG m+5) or GSH (GSH m+5) in MEFs of indicated genotypes based on metabolomics data. Representative MEF data (n=2 MEFs/genotype) shows triplicate mean ±s.d. (one-way ANOVA). ***P<0.001, **P<0.01, *P<0.05.
Extended Data Fig. 6. KrasG12D homozygous cells depend on glucose metabolism reprogramming for ROS management.
a, GSSG levels in G12D/WT and G12D/G12D MEFs relative to WT/WT. Mean data (n=3 MEFs/genotype) ±s.d. shown. b, ROS levels in MEFs following 48 hrs of 2DG treatment. Data were normalised to vehicle treatment (CTRL). c, Percentage of AnnexinV/PI (AnV/PI) double positive G12D/G12D MEFs following 48 hrs of 2DG treatment in the presence (+) or absence (−) of NAC. d, Ratio of reduced to oxidised glutathione (GSH/GSSG) determined for WT/WT, G12D/WT and G12D/G12D MEFs after incubation with 2DG, BSO or both (2DG+BSO) for 48 hrs, normalised to vehicle (CTRL). b-d, Representative data from 3 independent MEFs/genotype presented. Mean data for triplicates ±s.d. shown (two-way ANOVA). e, Representative data of GSH/GSSG ratio and GSH levels in murine G12D/G12D tumour cells relative to G12D/WT (t-test). f, Differential sensitivity of lung tumour cells to nutrient depletion. Lung tumour cells were cultured in normal media (CTRL) and low glucose (Low GLC) conditions for 72 hrs and viable cells counted and normalised to CTRL (two-way ANOVA). g, Percentage of AnnexinV/PI double positive murine tumour cells following 48 hrs treatment with BSO, 2DG, or both (2DG+BSO). e-g, Representative data (n=3 independent experiments) depicts triplicate mean ±s.d. (***P<0.001, two-way ANOVA). ***P<0.001, **P<0.01, *P<0.05.
Extended Data Fig. 7. Increased mutant Kras allelic content leads to glucose metabolism reprogramming in lung tumours in vivo.
a-i, Control (no Cre) and tumour bearing KrasG12D/+;p53Fx/Fx mice were infused with 13C-glucose 12 (early group) or 16 weeks (late group) after adenoviral-Cre treatment and individual lung tumours (Early, n=16 and Late, n=12) or control lung (Normal, n=3) collected for LC-MS analysis (3 technical replicates/sample). Selected 13C-glucose-derived metabolites shown, calculated as a percentage of the total metabolite pool. Mean abundance per cohort ±s.e.m. shown. ***P<0.001, *P<0.05 (two-way ANOVA).
Extended Data Table 1. Mutant heterozygous and homozygous KRAS NSCLC cell lines.
KRAS mutation and zygosity of 4 NSCLC cell lines according to COSMIC Cell Lines project database (version 73). Genotypes were confirmed by Sanger Sequencing (data not shown).
| KRAS Heterozygous | KRAS Homozygous | ||
|---|---|---|---|
| Cell line | KRAS Mutation | Cell line | KRAS Mutation |
| NCI-H23 | p.G12C | NCI-H460 | p.Q61H |
| NCI-H358 | p.G12C | SW1573 | p.G12C |
Extended Data Table 2. KRAS status in panel of human lung adenocarcinomas.
KRAS mutation, GISTIC score and copy number variation (CNV) in TCGA lung adenocarcinoma dataset1. KRAS mutation (status and nucleotide substitution), KRAS putative copy number calls from GISTIC 2.0 analysis (GISTIC score) and KRAS Log2 copy number values (from Affymetrix SNP6) were downloaded from cBioportal. Mutant KRAS tumours with a GISTIC score of 0+ (n=65) were divided into two cohorts: KRAS mutant (KRASmut, GISTIC= 0, n=36) and KRAS mutant & copy gain (KRASmut&CG, GISTIC= 1&2, n=29), as displayed.
| KRASmut | |||
|---|---|---|---|
| ID | KRAS mutation | KRAS GISTIC | KRAS CNV |
| TCGA-78-7539-01 | G12C | 0 | −0.065 |
| TCGA-78-7160-01 | G12D | 0 | −0.032 |
| TCGA-49-6761-01 | G12D | 0 | −0.032 |
| TCGA-50-5933-01 | G12C | 0 | −0.027 |
| TCGA-05-4403-01 | G12C | 0 | −0.008 |
| TCGA-35-3615-01 | G12C | 0 | −0.008 |
| TCGA-55-6970-01 | G12V | 0 | −0.008 |
| TCGA-75-7030-01 | G12D | 0 | −0.005 |
| TCGA-55-6983-01 | G12C | 0 | 0 |
| TCGA-55-7725-01 | G12V | 0 | 0 |
| TCGA-44-6146-01 | G12V | 0 | 0 |
| TCGA-78-7540-01 | G12V | 0 | 0.001 |
| TCGA-67-3773-01 | G12V | 0 | 0.002 |
| TCGA-97-7941-01 | G12A | 0 | 0.004 |
| TCGA-49-4505-01 | G12C | 0 | 0.004 |
| TCGA-78-7166-01 | G12C | 0 | 0.004 |
| TCGA-44-7659-01 | G12C | 0 | 0.004 |
| TCGA-44-6776-01 | G12D | 0 | 0.004 |
| TCGA-50-7109-01 | G12C | 0 | 0.005 |
| TCGA-50-5932-01 | G12C | 0 | 0.011 |
| TCGA-55-7281-01 | G12C | 0 | 0.012 |
| TCGA-80-5608-01 | G12A | 0 | 0.019 |
| TCGA-05-4249-01 | G12C | 0 | 0.024 |
| TCGA-53-7813-01 | G12A | 0 | 0.032 |
| TCGA-64-5774-01 | G12C | 0 | 0.034 |
| TCGA-93-7347-01 | G12C | 0 | 0.036 |
| TCGA-38-4626-01 | G12V | 0 | 0.044 |
| TCGA-44-6777-01 | G12C | 0 | 0.045 |
| TCGA-64-1677-01 | G12C | 0 | 0.051 |
| TCGA-05-4430-01 | G12C | 0 | 0.056 |
| TCGA-49-6744-01 | G12C | 0 | 0.058 |
| TCGA-73-4659-01 | G12V | 0 | 0.069 |
| TCGA-50-5936-01 | G12C | 0 | 0.088 |
| TCGA-78-7167-01 | G12F | 0 | 0.093 |
| TCGA-55-6642-01 | G12V | 0 | 0.099 |
| TCGA-44-6145-01 | G12V | 0 | 0.099 |
| TCGA-95-7567-01 | G12V | 1 | 0.135 |
| TCGA-78-7148-01 | G12C | 1 | 0.255 |
| TCGA-55-7726-01 | G12C | 1 | 0.34 |
| TCGA-55-7911-01 | G12V,K88* | 1 | 0.358 |
| TCGA-05-4415-01 | G12C | 1 | 0.38 |
| TCGA-75-5126-01 | G12C | 1 | 0.399 |
| TCGA-05-4390-01 | G12V | 1 | 0.4 |
| TCGA-05-4418-01 | G12C | 1 | 0.404 |
| TCGA-73-4662-01 | G12C | 1 | 0.411 |
| TCGA-49-4510-01 | G12D | 1 | 0.413 |
| TCGA-78-7161-01 | G12V | 1 | 0.481 |
| TCGA-78-7145-01 | G12Y | 1 | 0.523 |
| TCGA-86-7713-01 | G12C | 1 | 0.547 |
| TCGA-05-4417-01 | G12C | 1 | 0.585 |
| TCGA-91-6828-01 | G12V | 1 | 0.632 |
| TCGA-69-7980-01 | G12A | 1 | 0.647 |
| TCGA-55-7907-01 | G12C | 1 | 0.746 |
| TCGA-55-7728-01 | G12V | 1 | 0.797 |
| TCGA-75-7027-01 | G12V | 1 | 0.812 |
| TCGA-50-5941-01 | G12A | 1 | 1.458 |
| TCGA-64-5775-01 | Q61L | 1 | 1.752 |
| TCGA-05-4395-01 | G12V | 1 | 2.25 |
| TCGA-55-7815-01 | G12V | 2 | 0.491 |
| TCGA-55-7283-01 | G12S | 2 | 0.64 |
| TCGA-97-7554-01 | G12V | 2 | 0.836 |
| TCGA-55-7576-01 | G12S | 2 | 0.875 |
| TCGA-05-4433-01 | G12V | 2 | 1.082 |
| TCGA-67-3774-01 | G12F | 2 | 1.095 |
| TCGA-44-7672-01 | G12A | 2 | 2.604 |
Supplementary Material
Acknowledgments
We thank T. Jacks (KrasLSL-G12D), A. Berns (p53Fx) and the NIH Mouse repository for mice. We also thank Sam Kleeman and Patricia Ogger for assistance with redox cell profiling and cell viability assays, respectively. We are very thankful to CRUK CI BRU staff for support with in vivo work and all the members of the Martins lab for critical comments and advice. This work was supported by the Medical Research Council.
Footnotes
Microarray data were deposited under GEO accession number GSE75871.
The authors declare no competing financial interests.
References
- 1.Cancer Genome Atlas Research, N Comprehensive molecular profiling of lung adenocarcinoma. Nature. 2014;511:543–550. doi: 10.1038/nature13385. [DOI] [PMC free article] [PubMed] [Google Scholar]
- 2.Ding L, et al. Somatic mutations affect key pathways in lung adenocarcinoma. Nature. 2008;455:1069–1075. doi: 10.1038/nature07423. [DOI] [PMC free article] [PubMed] [Google Scholar]
- 3.Vicent S, et al. ERK1/2 is activated in non-small-cell lung cancer and associated with advanced tumours. Br J Cancer. 2004;90:1047–1052. doi: 10.1038/sj.bjc.6601644. [DOI] [PMC free article] [PubMed] [Google Scholar]
- 4.Guerra C, et al. Tumor induction by an endogenous K-ras oncogene is highly dependent on cellular context. Cancer Cell. 2003;4:111–120. doi: 10.1016/s1535-6108(03)00191-0. [DOI] [PubMed] [Google Scholar]
- 5.Jackson EL, et al. The differential effects of mutant p53 alleles on advanced murine lung cancer. Cancer research. 2005;65:10280–10288. doi: 10.1158/0008-5472.CAN-05-2193. [DOI] [PubMed] [Google Scholar]
- 6.Jackson EL, et al. Analysis of lung tumor initiation and progression using conditional expression of oncogenic K-ras. Genes & development. 2001;15:3243–3248. doi: 10.1101/gad.943001. [DOI] [PMC free article] [PubMed] [Google Scholar]
- 7.Junttila MR, et al. Selective activation of p53-mediated tumour suppression in high-grade tumours. Nature. 2010;468:567–571. doi: 10.1038/nature09526. [DOI] [PMC free article] [PubMed] [Google Scholar]
- 8.Pylayeva-Gupta Y, Grabocka E, Bar-Sagi D. RAS oncogenes: weaving a tumorigenic web. Nature reviews. Cancer. 2011;11:761–774. doi: 10.1038/nrc3106. [DOI] [PMC free article] [PubMed] [Google Scholar]
- 9.Sarkisian CJ, et al. Dose-dependent oncogene-induced senescence in vivo and its evasion during mammary tumorigenesis. Nature cell biology. 2007;9:493–505. doi: 10.1038/ncb1567. [DOI] [PubMed] [Google Scholar]
- 10.Modrek B, et al. Oncogenic activating mutations are associated with local copy gain. Molecular cancer research : MCR. 2009;7:1244–1252. doi: 10.1158/1541-7786.MCR-08-0532. [DOI] [PubMed] [Google Scholar]
- 11.Tuveson DA, et al. Endogenous oncogenic K-ras(G12D) stimulates proliferation and widespread neoplastic and developmental defects. Cancer Cell. 2004;5:375–387. doi: 10.1016/s1535-6108(04)00085-6. [DOI] [PubMed] [Google Scholar]
- 12.Jonkers J, et al. Synergistic tumor suppressor activity of BRCA2 and p53 in a conditional mouse model for breast cancer. Nature genetics. 2001;29:418–425. doi: 10.1038/ng747. [DOI] [PubMed] [Google Scholar]
- 13.Ying H, et al. Oncogenic Kras maintains pancreatic tumors through regulation of anabolic glucose metabolism. Cell. 2012;149:656–670. doi: 10.1016/j.cell.2012.01.058. [DOI] [PMC free article] [PubMed] [Google Scholar]
- 14.Vander Heiden MG, Cantley LC, Thompson CB. Understanding the Warburg effect: the metabolic requirements of cell proliferation. Science. 2009;324:1029–1033. doi: 10.1126/science.1160809. [DOI] [PMC free article] [PubMed] [Google Scholar]
- 15.Hu Y, et al. K-ras(G12V) transformation leads to mitochondrial dysfunction and a metabolic switch from oxidative phosphorylation to glycolysis. Cell research. 2012;22:399–412. doi: 10.1038/cr.2011.145. [DOI] [PMC free article] [PubMed] [Google Scholar]
- 16.Baracca A, et al. Mitochondrial Complex I decrease is responsible for bioenergetic dysfunction in K-ras transformed cells. Biochim Biophys Acta. 2010;1797:314–323. doi: 10.1016/j.bbabio.2009.11.006. [DOI] [PubMed] [Google Scholar]
- 17.Gaglio D, et al. Oncogenic K-Ras decouples glucose and glutamine metabolism to support cancer cell growth. Molecular systems biology. 2011;7:523. doi: 10.1038/msb.2011.56. [DOI] [PMC free article] [PubMed] [Google Scholar]
- 18.Son J, et al. Glutamine supports pancreatic cancer growth through a KRAS-regulated metabolic pathway. Nature. 2013;496:101–105. doi: 10.1038/nature12040. [DOI] [PMC free article] [PubMed] [Google Scholar]
- 19.Kaplon J, et al. A key role for mitochondrial gatekeeper pyruvate dehydrogenase in oncogene-induced senescence. Nature. 2013;498:109–112. doi: 10.1038/nature12154. [DOI] [PubMed] [Google Scholar]
- 20.DeNicola GM, et al. Oncogene-induced Nrf2 transcription promotes ROS detoxification and tumorigenesis. Nature. 2011;475:106–109. doi: 10.1038/nature10189. [DOI] [PMC free article] [PubMed] [Google Scholar]
- 21.Gorrini C, Harris IS, Mak TW. Modulation of oxidative stress as an anticancer strategy. Nature reviews. Drug discovery. 2013;12:931–947. doi: 10.1038/nrd4002. [DOI] [PubMed] [Google Scholar]
- 22.Bryant KL, Mancias JD, Kimmelman AC, Der CJ. KRAS: feeding pancreatic cancer proliferation. Trends in biochemical sciences. 2014;39:91–100. doi: 10.1016/j.tibs.2013.12.004. [DOI] [PMC free article] [PubMed] [Google Scholar]
- 23.Griffith OW. Mechanism of action, metabolism, and toxicity of buthionine sulfoximine and its higher homologs, potent inhibitors of glutathione synthesis. J Biol Chem. 1982;257:13704–13712. [PubMed] [Google Scholar]
- 24.To MD, Rosario RD, Westcott PM, Banta KL, Balmain A. Interactions between wild-type and mutant Ras genes in lung and skin carcinogenesis. Oncogene. 2013;32:4028–4033. doi: 10.1038/onc.2012.404. [DOI] [PMC free article] [PubMed] [Google Scholar]
- 25.Zhang Z, et al. Wildtype Kras2 can inhibit lung carcinogenesis in mice. Nature genetics. 2001;29:25–33. doi: 10.1038/ng721. [DOI] [PubMed] [Google Scholar]
- 26.Wagner PL, et al. Frequency and clinicopathologic correlates of KRAS amplification in non-small cell lung carcinoma. Lung cancer. 2011;74:118–123. doi: 10.1016/j.lungcan.2011.01.029. [DOI] [PubMed] [Google Scholar]
- 27.Johnson L, et al. K-ras is an essential gene in the mouse with partial functional overlap with N-ras. Genes & development. 1997;11:2468–2481. doi: 10.1101/gad.11.19.2468. [DOI] [PMC free article] [PubMed] [Google Scholar]
- 28.Martins CP, Brown-Swigart L, Evan GI. Modeling the therapeutic efficacy of p53 restoration in tumors. Cell. 2006;127:1323–1334. doi: 10.1016/j.cell.2006.12.007. [DOI] [PubMed] [Google Scholar]
- 29.Christophorou MA, et al. Temporal dissection of p53 function in vitro and in vivo. Nature genetics. 2005;37:718–726. doi: 10.1038/ng1572. [DOI] [PubMed] [Google Scholar]
Associated Data
This section collects any data citations, data availability statements, or supplementary materials included in this article.


