

Abstract
Research on bladder neoplasms in pediatric and teen patients (BNPTP) has described 21 genes, which are variously involved in this disease and are mostly responsible for deregulated cell proliferation. However, due to the limited number of publications on this subject, it is still unclear what type of relationships there are among these genes and which are the chances that, while having different molecular functions, they i) act as downstream effector genes of well-known pro- or anti- proliferative stimuli and/or interplay with biochemical pathways having oncological relevance or ii) are specific and, possibly, early biomarkers of these pathologies. A Gene Ontology (GO)-based analysis showed that these 21 genes are involved in biological processes, which can be split into two main classes: cell regulation-based and differentiation/development-based. In order to understand the involvement/overlapping with main cancer-related pathways, we performed a meta-analysis dependent on the 189 oncogenic signatures of the Molecular Signatures Database (OSMSD) curated by the Broad Institute. We generated a binary matrix with 53 gene signatures having at least one hit; this analysis i) suggests that some genes of the original list show inconsistencies and might need to be experimentally re- assessed or evaluated as biomarkers (in particular, ACTA2) and ii) allows hypothesizing that important (proto)oncogenes (E2F3, ERBB2/HER2, CCND1, WNT1, and YAP1) and (putative) tumor suppressors (BRCA1, RBBP8/CTIP, and RB1-RBL2/p130) may participate in the onset of this disease or worsen the observed phenotype, thus expanding the list of possible molecular targets for the treatment of BNPTP.
Keywords: Bioinformatics, biomedical modeling, gene set, neoplastic transformation, PubMed query.
1. INTRODUCTION
According to the US National Cancer Institute (NCI) website [1] bladder cancer (BC) is classified, in adults, among the most common cancers in the USA, where almost 75,000 new BC cases and more than 15,000 BC-related deaths have been estimated for the year 2014. In particular, these statistics show that in 2013 about 55,000 men and 18,000 women were diagnosed with bladder cancer, with a ratio of approximately 3:1; consequently, BC is reported by NCI as the sixth cause of new cancer cases, and the eighth cause of death among common malignancies [1]. However, this website classifies BC among ‘unusual cancers of childhood’; indeed, collecting statistical data about pediatric/teenage BC using on-line resources is challenging, due the limited number of reported cases. As a matter of fact, the reported incidence of BC in the population, in the age range 15-19 years, is 1·10-6, and even lower in younger patients [2]. In agreement with the data coming from the UnitedStates, the total number of BC cases described in the literature in the age range 0-19 is limited to a few thousand patients, all-time and worldwide (Table 1). An extensive analysis of all known cases of pediatric/teen malignant bladder masses [2] revealed that at least ten different types/subtypes of BC may be found for them, although with a rare or very rare incidence, in some cases (Table 1).
Table 1.
Reported pediatric and teenage patients with malignant bladder masses.
| Bladder Cancer Type/subtype | Number of Cases Retrieved from the Literature | Incidence On Total Bladder Cancers in Pediatric and Teenage Patients | References |
|---|---|---|---|
| rhabdomyosarcoma | some thousands | 20% of all rhabdomyosarcomas, which are 4-8% of all malignant pediatric tumors | [3,4] |
| transitional cell carcinoma | ca. 150 | 0.4% | [5-7] |
| leiomyosarcoma | a few tens | 0.1% | [8] |
| urachal adenocarcinoma | a few tens | 0.17%-0.34% | [4,9] |
| adenocarcinoma of the exstrophied bladder | less than 100 | < 1/50,000 newborn with exstrophied bladder | [10] |
| inflammatory myofibroblastic tumor | 36 | < 0.1% | [11] |
| mesonephric and clear cell adenocarcinoma | 19 | < 0.03% | [12] |
| perivascular epithelioid cell neoplasm | 1 | extremely rare | [13] |
| paraganglioma/ pheochromocitoma | 10 | 2/106cases per year | [14] |
| pure malignant rhabdoid tumor | 8 | extremely rare | [15] |
Column 1: bladder cancer type/subtype;
column 2: number of cases described in the literature;
column 3: incidence on total pediatric/teen bladder cases;
column 4: references. Data were retrieved from [2] and integrated with the most recent bibliography available. Listed references refer to the primary or most relevant sources used for generating this table.
BC in children and teenagers resembles, for a few characteristics, the same behavior of adult tumors. The first symptom usually is a painless macroscopic hematuria; similarly to adults, males are more affected than females, and in some cases a genetic background and a relationship with specific chemicals and pollutants has been identified. However, many features of pediatric/teen BC are specific of this age range and suggest that this pathology is quite different from its adult counterpart. In particular, pediatric/teen BC is usually unifocal, while most adults have multifocal masses; most cases in this age range are of lower grade and stage (despite their delayed diagnosis, which is often due to being unexpected) and have an indolent behavior, thus granting these young patients a far more favorable prognosis and a recurrence rate much lower than in adults [16]. Genetic and genomic alterations frequently seen in older adults are extremely rare in young patients and, despite the constantly higher incidence in males, the male/female ratio is age-dependent, being greater at younger ages [2, 16, 17]. This led some Authors [17] to hypothesize the presence of an age-dependent threshold, set approximately at 19-20 years, which determines different properties in youngsters vs. adults. Along the same line of thought, other Authors suggest that the management and treatment of young BC patients should be modified as well with respect to their adult counterparts; in particular, special attention should be used in preserving both the structural and functional physiology of patients (e.g. sexual functions in females, potency in males, fertility and urinary continence in both genders) [16].
As a consequence of the low number of reported cases, the genetic analyses of pediatric and teen BC patients are even rarer. This is not a trivial problem since, as noted above, the phenotypic patterns of these malignancies are typically different from adults; thus, it is likely that also their overall genetic background is different. In this perspective, it would not be a surprise to find out that different sets of genes are involved in the same tumor, according to patient’s age, regardless of similar histological types, or even that some genes expressed in adult cancers are not involved in their pediatric/teen counterparts, and vice versa. Trying to find answers to these questions, we analyzed what is known about the BC genetics during childhood and adolescence; the 21 genes examined in this article were clearly and univocally identified in patients with bladder neoplasms whose age was ≤ 19 years old. In this way, we were able to link the following genes to BNPTP (note: p53, NF1 e SMARCB1 are repeated twice below, because they were identified using two different methods): i) CK20, p16/lnk4, SMARCB1, ALK, ACTA2, CD34, CD56, MUC1, p53, WT1, VIM and MYOG by immunohistochemistry; ii) H-RAS and NF1 by genetics, being the patient also affected by other known genetic diseases, namely Costello syndrome and neurofibromatosis, respectively; iii) K-RAS, N-RAS, NF1, p53, PTPN11 and SMARCB1 by gene sequencing; iv) Gli1, Gli3, Myf5, MyoD1, Ptch1 by mRNA quantification (microarray analysis).
Gene Ontology (GO) ‘is a community-based bioinformatics resource that supplies information about gene product function using ontologies to represent biological knowledge’ [18]. GO-based computational tools, in particular, are used for performing analyses that allow determining which biological processes (BP), cellular components (CC) and molecular functions (MF) are most involved in a pathology, experimental condition, cellular response to stimuli, etc. [19, 20]. We found that 75 GO-BP terms reach the statistical significance for our list of genes; this number drops to 26 using a semantic similarity algorithm for redundancy reduction. The 26 GO-BP categories that are left after this filtering involve: i) regulative processes (cell signaling, metabolism, matrix adhesion, intracellular transport, etc.) and ii) differentiation and development. Looking at the GO results from a different standpoint we were also able to distinguish GO terms that suggest similarities between adults and children/teenagers (e.g. ‘positive regulation of nucleobase-containing compound metabolism’ ‘regulation of intracellular transport’, ‘actin filament-based process’, and ‘cytoskeleton organization’) and others that seem to be peculiar of BNPTP (‘gland development’, ‘metanephros development’, ‘striated muscle cell differentiation’, ‘regionalization’, ‘pattern specification process’, and ‘embryonic morphogenesis’).
An assessment of possible biological events happening upstream of these 21 effector genes and of mechanisms capable to interfere with them with different modalities was performed i) evaluating which genes in this list are downstream of the 189 oncogenic signatures of the Molecular Signatures Database (OSMSD) and ii) checking if the nature of the perturbation of possible upstream genes that were found was compatible with the genomic perturbations described in BNPTP. A standard and powerful use of these 189 gene signatures is accomplished inside the Gene Set Enrichment Analysis (GSEA) framework [21] or using other gene set-based tools [22-24]. Many publications based on GSEA and similar methods have proven that it is possible to use evidence derived by a broad spectrum of experiments (e.g. on human and murine models) and apply it to the analysis of two different groups of samples/patients [25-27]. This is an intrinsically noisy process that GSEA manages relying on the robustness of sets of genes, rather than single genes. Since we do not have, instead, any high-throughput data to start from and our only input is a list of deregulated/altered genes, we decided to rely on the strength of the inter-experimental biological compatibility above described and accept a higher rate of false discoveries for each relevant case found in the hit matrix, which has 53 rows (gene sets), 21 columns (BNPTP genes) and 60 hits (matches between a gene set and a BNPTP gene). A number of possibly important upstream events were defined using this method, allowing connecting the 21 genes that are altered in BNPTP with the regulation of (proto)oncogenes and (putative) tumor suppressors, such as BRCA1, CCND1, RBBP8/CTIP, E2F3, ERBB2/HER2, WNT1, YAP1 and RB1-RBL2/p130 combined (see the Results section). Despite the fact that TP53 (a.k.a. tumor protein p53) is the most frequently mutated gene in BC specimens from adults [28], its status is not well-defined in the only (teenage) patient reported with TP53 alterations [17] and our gene set-based analyses were not able to determine if and how much TP53 is important in pediatric and teenage BC cases. Notably, our results advocate for a role played by CTIP and WNT1, which instead do not seem to be involved as pivotal genes in BC of adults, as part of the oncogenic signaling pathways of BNPTP.
2. MATERIALS AND METHODS
2.1. Literature-based Gene Selection
The literature used for identifying BNPTP genes was selected using quite stringent criteria, since the analyses described in this article are sensitive to the presence/absence of single genes in the final list. MEDLINE was accessed multiple times, up to February 2015, and searched through the PubMed search engine using the strings “bladder cancer genetics pediatric” (which retrieved 61 results), “bladder cancer gene pediatric” (54 results), “bladder cancer genetics child” (116 results), “bladder cancer gene children” (84 results), “bladder cancer gene child” (69 results) and “bladder cancer genetics children” (131 results). We chose the standard PubMed search and decided not to use MeSH terms and Boolean operators, in order to maximize the number of hits. The results were merged into one list and compared/integrated with the references available from Vallasciani and coworkers [2]. To expand the potentially suitable literature, also references cited in the manuscripts selected so far, but absent from our initially merged list, were checked, and the neoplastic alterations identified (such as “rhabdomyosarcoma”, “transitional cell carcinoma” and others similar) were used for further PubMed searches together with the keywords “bladder cancer” and either one of the following: “child”, “children” or “pediatric”. Any additional hit coming from this new search and not present in the former list was checked for its content. Then, all references were quality-checked, and only those simultaneously fulfilling the following three requirements were considered: (1) the gene had to be undoubtedly and univocally identified in the cancer specimen, either by (a) gene sequencing, (b) mRNA level quantification by microarray, (c) protein expression by immunohistochemistry (provided the absence of cross-reactions) either using immunoblotting, or kinase assay, or indirect immunofluorescence on sample slides, or tissue microarray, or (d) analysis of chromosome rearrangements by FISH. For example, an article from Scott and collaborators [29] identified the over-expression of high molecular weight cytokeratins using monoclonal antibodies. However, an accurate check of the same manuscript [29] and of the web site of the Company that sells this antibody [30] revealed that it recognizes at least four different cytokeratins, and for this reason this report was not used for our gene list. (2) Patient’s age had to be clearly indicated and not to be higher than 19 years, or because stated for the patient(s), one by one, or because the age range reported was lower than 19 years old for all patients examined and unequivocally identified. Therefore, reports in which the age range was within our upper limit, even if single patients’ ages were not specified, met our selection criteria [31, 32]. (3) The primary tumor had to be localized in the bladder. This requirement prevented us from using several contributions about the rhabdomyosarcoma (RMS) genetics, since in many cases of pediatric/teen reports the primary localization of this tumor is not described (RMS specimens are usually merged, irrespective of their explantation origin). For example, we were not able to find any paper describing the involvement - in bladder RMS - of the PAX-FOXO1 fusion gene, which is one of the most common genetic alterations found in RMS occurring in other locations [33]. The final list of references that was used for the present report included 16 manuscripts published between 1989 and 2014 (Table 2; references inside), allowing the identification of 21 genes.
Table 2.
Cases of pediatric/teen BC retrieved through PubMed.
| Gene (a) | Gene Name in Molecular Signatures Database | Molecular Function | Cellular Function | Neoplasm | Alteration | Additional Information | Age (b) | Sex | Ref. | OMIM ID |
|---|---|---|---|---|---|---|---|---|---|---|
| p53 | TP53 | transcription factor | oncosuppressor | pTa low grade (c) | mut/over | CAA->TAA stop codon at position 136 (exon 5); overexpression evaluated by immunohistochemistry | 18 | male | 17 | 191170 |
| p16/lnk4 | CDKN2A | cdk inhibitor | oncosuppressor | pTa low grade | del | FISH (UroVysion) | 14 | male | 17 | 600160 |
| p16/lnk4 | CDKN2A | cdk inhibitor | oncosuppressor | pTa low grade | del | FISH (UroVysion) | 10 | male | 17 | 600160 |
| p16/lnk4 | CDKN2A | cdk inhibitor | oncosuppressor | pTa high grade | del | FISH (UroVysion) | 17 | male | 17 | 600160 |
| p16/lnk4 | CDKN2A | cdk inhibitor | oncosuppressor | PUNLMP | del | FISH (UroVysion); presence of aneuploidy for portions of chromosome 8 | 18 | male | 17 | 600160 |
| CK20 | KRT20 | intermediate filament | cytoskeleton | pTa low grade (c) | over | immunohystochemistry | 18 | male | 17 | 608218 |
| CK20 | KRT20 | intermediate filament | cytoskeleton | pTa low grade | over | immunohystochemistry | 18 | male | 17 | 608218 |
| Ptch1 | PTCH1 | receptor of shh | embryo development, oncosuppressor | RMS | over | Affymetrix gene expression profile | n/a | n/a | 31,32 | 601309 |
| Gli1 | GLI1 | transcription factor | differentiation | RMS | over | Affymetrix gene expression profile | n/a | n/a | 31,32 | 165220 |
| Gli3 | GLI3 | transcription factor | embryo development | RMS | over | Affymetrix gene expression profile | n/a | n/a | 31,32 | 165240 |
| Myf5 | MYF5 | transcription factor | muscle differentiation | RMS | over | Affymetrix gene expression profile | n/a | n/a | 31,32 | 159990 |
| MyoD1 | MYOD1 | transcription factor | muscle differentiation | RMS | under | Affymetrix gene expression profile | n/a | n/a | 31,32 | 159970 |
| NF1 | NF1 | negative regulator of ras | oncosuppressor | RMS | del | large deletion of the whole gene on one chromosome, evaluated by microsatellite markers; other allele apparently normal (no nucleotide sequencing available) | 1 | male | 34 | 613113 |
| NF1 | NF1 | negative regulator of ras | oncosuppressor | RMS | und | neurofibromatosis | 1 | male | 35 | 613113 |
| ALK | ALK | receptor tyrosine kinase | CNS development | IMT | arr | immunohistochemistry | 14 | male | 36 | 105590 |
| Gene (a) | Gene Name in Molecular Signatures Database | Molecular Function | Cellular Function | Neoplasm | Alteration | Additional Information | Age (b) | Sex | Ref. | OMIM ID |
| ALK | ALK | receptor tyrosine kinase | CNS development | IMT | arr | immunohistochemistry | 5 | female | 36 | 105590 |
| H-RAS | HRAS | GTPase | oncogene | carcinoma | und | Costello syndrome patient | 12 | male | 37 | 190020 |
| K-RAS | KRAS | GTPase | oncogene | RMS | mut | K13Asp | 4 | female | 38 | 190070 |
| H-RAS | HRAS | GTPase | oncogene | transitional cell carcinoma | und | n/a, gene inferred by the patient being affected by Costello syndrome | 13 | female | 39 | 190020 |
| N-RAS | NRAS | GTPase | oncogene | RMS | mut | CAA->AAA in exon 2 causing Q61K | n/a | n/a | 40 | 164790 |
| N-RAS | NRAS | GTPase | oncogene | RMS | mut | CAA->? in exon 2 causing Q61 change (unspecified) | n/a | n/a | 40 | 164790 |
| PTPN11 | PTPN11 | tyrosine-phosphatase | mitogenic activation | RMS | mut | GAG->AAG in exon 3 causing E69K | n/a | n/a | 40 | 176876 |
| K-RAS | KRAS | GTPase | oncogene | urachal adenocarcinoma | mut | G12S | 18 | n/a | 41 | 190070 |
| SMARCB1/INI1 | SMARCB1 | chromatin structure regulator | gene activation | malignant rhabdoid tumor | del | immunohystochemistry; confirmed by multipllex ligation probe amplification; large deletion of the locus | 3 | male | 42 | 601607 |
| SMARCB1/INI1 | SMARCB1 | chromatin structure regulator | gene activation | malignant rhabdoid tumor | mut | 750insC on one allele; Del exon6 on the other allele | 6 m | n/a | 43 | 601607 |
| SMARCB1/INI1 | SMARCB1 | chromatin structure regulator | gene activation | malignant rhabdoid tumor | mut | homozygous deletion of exon 6 | 0 m | n/a | 43 | 601607 |
| SMARCB1/INI1 | SMARCB1 | chromatin structure regulator | gene activation | malignant rhabdoid tumor | micro-del | c.20_43delinsT in one allele; deletion of the other allele | 5 m | female | 44 | 601607 |
| SMARCB1/INI1 | SMARCB1 | chromatin structure regulator | gene activation | pure rhabdoid tumor | lack of immunohistochemical staining | immunohistochemistry | 17 (d) | female | 15 | 601607 |
| CD34 | CD34 | cell-cell adhesion factor | cell proliferation | pure rhabdoid tumor | over | immunohistochemistry | 17 (d) | female | 15 | 142230 |
| CD56 | NCAM1 | cell-cell adhesion factor | currently unclear | pure rhabdoid tumor | over | immunohistochemistry | 17 (d) | female | 15 | 116930 |
| WT1 | WT1 | transcription factor | development of the urogenital system | pure rhabdoid tumor | over | immunohistochemistry | 17 (d) | female | 15 | 607102 |
| Gene (a) | Gene Name in Molecular Signatures Database | Molecular Function | Cellular Function | Neoplasm | Alteration | Additional Information | Age (b) | Sex | Ref. | OMIM ID |
| VIM | VIM | intermediate filament | cytoskeleton | pure rhabdoid tumor | over | immunohistochemistry | 4 (e) | female | 45 | 193060 |
| ACTA2 | ACTA2 | actin | cytokinesis, cell movement | pure rhabdoid tumor | over | immunohistochemistry | 4 (e) | female | 45 | 102620 |
| MUC1 | MUC1 | mucin | cell signaling and protection | pure rhabdoid tumor | over | immunohistochemistry | 4 (e) | female | 45 | 158340 |
Column 1: gene names as reported in the manuscripts, which are listed in column 10;
column 2: gene names according to the Molecular Signatures Database, which was used for performing the gene set-based analyses;
column 3: main molecular function of the protein encoded by that gene;
column 4: most relevant cellular function of this protein;
column 5: neoplasm affecting the patient(s);
column 6: molecular alteration, which is reported by or deduced from the bibliographic reference(s);
column 7: in case of gene sequencing, the mutation is reported; in case of protein function analysis or mRNA quantification, the method used is reported;
column 8: patient age; unspecified cases are patients that are surely under 19 years old, but whose exact age is unknown;
column 9: patient sex; n/a means that this information is not available;
column 10: reference(s);
column 11: gene identification number inside the OMIM database (URL: www.ncbi.nlm.nih.gov/omim). Abbreviations: FISH – Fluorescent In Situ Hybridization; PUNLMP – Papillary Urothelial Neoplasm of Low Malignant Potential; CNS – Central Nervous System; RMS – rhabdomyosarcoma; IMT – inflammatory miofobroblastic tumor; mut – mutation, point mutation; over – overexpression; under – underexpression; del – deletion; arr – rearrangement; und – undefined mutation. Notes: (a) duplicate lines indicate different patients with mutations in the same gene; (b) age is expressed in years, unless where differently specified with an “m” next to the number, indicating “months”; (c) the same patient has both mutations; (d) all alterations belong to the same patient; (e) all alterations are referred to the same patient.
2.2. Gene Ontology (GO) Analysis
The 21 genes identified in the above screening were combined and a GO analysis was performed on them. Indeed, while, as reported in Table 2, the nature of the alteration and the gene status found for each are very different and involve mRNA level, protein level or protein activity, both in terms of up- or down-regulation and detectable presence/absence, they all share the status of BNPTP biomarkers. Additionally, we assumed that the histological heterogeneity of tumors described was partially representative of the heterogeneity in the population and considered their aggregation as a balanced methodological choice, especially in the light of recent trends in medicine. As a matter of fact, our approach i) can be seen as more restrictive of the philosophy that inspires basket trials (for patients sharing some features, independently of their tumor histology) [46, 47], since we maintained the sharp boundaries of including only pediatric and teen BC and ii) is focused on sifting out the shared biological themes of malignancies that affect the bladder in pre-adults and not on defining biological processes that are specific of the single tumor entries of Tables 1 and 2. This GO analysis relies on the Expression Analysis Systematic Explorer (EASE) score (a p-value obtained through an adjusted Fisher’s exact test) [48] and was performed using DAVID Bioinformatics Resources [49]; the selected background was ‘Homo sapiens’. Each GO category was considered for further analyses only when fulfilling these three criteria: 1) is referred to biological processes (BP); 2) has two or more gene members inside the BNPTP gene list (Table S1 (169KB, pdf) ); 3) has a p-value lower than 0.01 (Table 3). This third choice was made in order to collect GO-BP categories that account for at least 75% of the genes belonging to the original BNPTP gene list and to keep, among the statistically significant GO terms, > 33% of the GO categories that fulfil 1) and 2). REVIGO [50] and Cytoscape [51] were respectively used for summarizing (reduction of the semantic redundancy of the GO terms) and visualizing the GO-BP results that comply with the three aforementioned criteria. The level of ‘allowed similarity’ was 0.5 (classified by the REVIGO developers as ‘small’), the selected species was ‘Homo sapiens’ and the chosen semantic similarity measure for assessing the distance between two GO terms was SimRel. SimRel is calculated from the directed acyclic graph (DAG) of the GO terms and, for each couple of GO categories, accounts for: i) the information content (IC) of their most informative common ancestors (MICA) in the graph; ii) the IC of the two categories that are compared; iii) the MICA probability of annotation [52]. The REVIGO algorithm agglomerates GO terms and defines their level of dispensability through a procedure that is conceptually similar to a hierarchical clustering where, after calculating all the pairwise SimRel distances, GO terms are selected for the summarizing graph or dropped according to 1) their biological specificity, based on how many proteins they tag in the GO database (see below), 2) their p-values (previously calculated by DAVID), 3) the existing parent-child relationships in the GO-DAG [50]. Table S2 (169KB, pdf) shows how much the GO-BP terms found using DAVID Bioinformatics Resources are dispensable in a scale from 0 (100% indispensable) to 1 (100% dispensable). One of the output files generated by REVIGO was used as the input for creating a Cytoscape graph [51]; in this computational step, the European Molecular Biology Laboratory (EMBL) - European Bioinformatics Institute (EBI) GO Annotation (GOA) database is used for ultimately tagging the summarizing GOs of the Cytoscape network [53, 54]. Using two different GO databases, one for assigning the p-values and one for selecting the most representative GO terms, slightly improves the consistency of this process. Notably, while DAVID measures how relevant is the contribution of the 21 BNPTP genes in each GO category, REVIGO defines topological relationships among the selected categories (in our case, 26) as a whole, i.e., without accounting for how many of the original BNPTP genes belong to them. In this way, our approach considers the role played by a GO category as a working hypothesis and displays its semantic similarity network as if that GO category was fully involved in the BPs of these malignant neoplasms.
Table 3.
GO-BP terms selected by DAVID and having a p-value < 0.01.
| GO-Term | Count | p-value |
|---|---|---|
| GO:0007569~cell aging | 5 | 1.38E-07 |
| GO:0008542~visual learning | 4 | 7.90E-06 |
| GO:0043523~regulation of neuron apoptosis | 5 | 8.18E-06 |
| GO:0042127~regulation of cell proliferation | 9 | 8.52E-06 |
| GO:0007632~visual behavior | 4 | 1.21E-05 |
| GO:0035022~positive regulation of Rac protein signal transduction | 3 | 1.24E-05 |
| GO:0007568~aging | 5 | 1.81E-05 |
| GO:0045935~positive regulation of nucleobase, nucleoside, nucleotide and nucleic acid metabolic process | 8 | 1.97E-05 |
| GO:0051173~positive regulation of nitrogen compound metabolic process | 8 | 2.41E-05 |
| GO:0010557~positive regulation of macromolecule biosynthetic process | 8 | 2.67E-05 |
| GO:0031328~positive regulation of cellular biosynthetic process | 8 | 3.59E-05 |
| GO:0009891~positive regulation of biosynthetic process | 8 | 3.95E-05 |
| GO:0009416~response to light stimulus | 5 | 4.42E-05 |
| GO:0046822~regulation of nucleocytoplasmic transport | 4 | 8.10E-05 |
| GO:0007612~learning | 4 | 8.96E-05 |
| GO:0045941~positive regulation of transcription | 7 | 1.20E-04 |
| GO:0035020~regulation of Rac protein signal transduction | 3 | 1.36E-04 |
| GO:0010628~positive regulation of gene expression | 7 | 1.41E-04 |
| GO:0032386~regulation of intracellular transport | 4 | 1.48E-04 |
| GO:0010604~positive regulation of macromolecule metabolic process | 8 | 1.49E-04 |
| GO:0009628~response to abiotic stimulus | 6 | 1.60E-04 |
| GO:0045944~positive regulation of transcription from RNA polymerase II promoter | 6 | 1.67E-04 |
| GO:0009314~response to radiation | 5 | 1.87E-04 |
| GO:0046579~positive regulation of Ras protein signal transduction | 3 | 2.46E-04 |
| GO:0051057~positive regulation of small GTPase mediated signal transduction | 3 | 2.79E-04 |
| GO:0032228~regulation of synaptic transmission, GABAergic | 3 | 2.79E-04 |
| GO:0051146~striated muscle cell differentiation | 4 | 2.80E-04 |
| GO:0007224~smoothened signaling pathway | 3 | 3.50E-04 |
| GO:0060341~regulation of cellular localization | 5 | 4.24E-04 |
| GO:0048169~regulation of long-term neuronal synaptic plasticity | 3 | 4.29E-04 |
| GO:0007265~Ras protein signal transduction | 4 | 4.71E-04 |
| GO:0045893~positive regulation of transcription, DNA-dependent | 6 | 5.33E-04 |
| GO:0007611~learning or memory | 4 | 5.54E-04 |
| GO:0051254~positive regulation of RNA metabolic process | 6 | 5.54E-04 |
| GO:0051223~regulation of protein transport | 4 | 5.98E-04 |
| GO:0070201~regulation of establishment of protein localization | 4 | 7.12E-04 |
| GO-Term | Count | p-value |
| GO:0042692~muscle cell differentiation | 4 | 7.12E-04 |
| GO:0001952~regulation of cell-matrix adhesion | 3 | 7.13E-04 |
| GO:0009967~positive regulation of signal transduction | 5 | 8.15E-04 |
| GO:0042981~regulation of apoptosis | 7 | 8.16E-04 |
| GO:0043067~regulation of programmed cell death | 7 | 8.60E-04 |
| GO:0010941~regulation of cell death | 7 | 8.76E-04 |
| GO:0048598~embryonic morphogenesis | 5 | 9.45E-04 |
| GO:0048732~gland development | 4 | 9.78E-04 |
| GO:0032880~regulation of protein localization | 4 | 0.001042703 |
| GO:0010647~positive regulation of cell communication | 5 | 0.001222605 |
| GO:0048168~regulation of neuronal synaptic plasticity | 3 | 0.001269391 |
| GO:0044093~positive regulation of molecular function | 6 | 0.001351732 |
| GO:0040008~regulation of growth | 5 | 0.001395832 |
| GO:0006915~apoptosis | 6 | 0.001524138 |
| GO:0012501~programmed cell death | 6 | 0.001628036 |
| GO:0008285~negative regulation of cell proliferation | 5 | 0.001721827 |
| GO:0001656~metanephros development | 3 | 0.001892643 |
| GO:0010810~regulation of cell-substrate adhesion | 3 | 0.002067039 |
| GO:0043524~negative regulation of neuron apoptosis | 3 | 0.002535107 |
| GO:0033157~regulation of intracellular protein transport | 3 | 0.002735058 |
| GO:0003002~regionalization | 4 | 0.002888256 |
| GO:0008219~cell death | 6 | 0.003325104 |
| GO:0007010~cytoskeleton organization | 5 | 0.003420399 |
| GO:0016265~death | 6 | 0.003426397 |
| GO:0046578~regulation of Ras protein signal transduction | 4 | 0.003459311 |
| GO:0006357~regulation of transcription from RNA polymerase II promoter | 6 | 0.003488245 |
| GO:0009953~dorsal/ventral pattern formation | 3 | 0.003491407 |
| GO:0006275~regulation of DNA replication | 3 | 0.003723492 |
| GO:0048167~regulation of synaptic plasticity | 3 | 0.003962608 |
| GO:0030036~actin cytoskeleton organization | 4 | 0.004251627 |
| GO:0030029~actin filament-based process | 4 | 0.005087539 |
| GO:0051056~regulation of small GTPase mediated signal transduction | 4 | 0.005759671 |
| GO:0043085~positive regulation of catalytic activity | 5 | 0.006401214 |
| GO:0007389~pattern specification process | 4 | 0.006759105 |
| GO:0000075~cell cycle checkpoint | 3 | 0.007859257 |
| GO:0001822~kidney development | 3 | 0.00871315 |
| GO-Term | Count | p-value |
| GO:0007406~negative regulation of neuroblast proliferation | 2 | 0.008839397 |
| GO:0007264~small GTPase mediated signal transduction | 4 | 0.009734957 |
| GO:0051090~regulation of transcription factor activity | 3 | 0.009975498 |
Column 1: 75 GO-Terms (GO code and GO category name);
column 2: number of genes of BNPTP that are found inside that GO category;
column 3: p-value.
2.3. Identification of Possible Upstream Inducers and Additive/synergistic Effects Using Oncogenic Signatures
The 189 gene sets (oncogenic signatures) that were used for these analyses were obtained from the Molecular Signatures Database of the Broad Institute. One of their main uses has been comparing two groups of samples and determining if the expression values of the genes that belong to each gene set suggest that in either group those genes have significantly higher expression values (this is called ‘enrichment’), using a Kolmogorov-Smirnov-like statistic [21]. In our analysis, instead, the occurrences of the 21 BNPTP genes in the OSMSD are calculated running an in-house developed MATLAB [55] script, thus obtaining a binary matrix M (mi,j = 1 when the gene j is found in the gene set i (this is called a ‘hit’) and 0 otherwise). For the sake of brevity, M is named hit matrix and when in the text we comment the existence of a match between a gene set and a gene, we use phrases such as “the gene X is hit by the gene set Y”, “the gene set Y is hit by the gene X”, etc. Also for short we use phrases such as “pro-growth”, “anti-growth”, “pro-proliferative”, “anti-proliferative”, and similar expressions, for the gene sets, which are far from fully depicting the complexity of the experiments performed for defining them, but are supposed to help the [56] Reader to quickly determine the biological background and/or polarity of what is shown.
Remarkably, the 21 genes altered in BNPTP have different cell functions: beside oncogenes and tumor suppressors, there are cytoskeleton components, cell-cell adhesion factors, and so on (Table 2). Therefore, looking for matches in the hit matrix can be seen as a convenient strategy of backtracking, which allows shifting the analysis focus from the identified BNPTP genes to potential (and not yet identified) inducers/co-regulators that mostly belong to the families of oncogenes and tumor suppressors. We want to specify that from here to the end of this article the words oncogenes, tumor suppressors and similar may be loosely used, for short. Indeed, for the sake of our evaluations, a gene officially classified as an oncogene or a gene able to promote cell cycle progression, cell growth, and comparable/related biological processes, merge into the same experimental gene group; similarly for tumor suppressors vs. anti-proliferative, pro-apoptotic or likewise defined genes. However, this descriptive style is applied only to groups of genes; instead, when a statement is made about a specific gene, it is defined and referenced as accurately as we deemed necessary. After finding all the gene hits, a spreadsheet was generated, aiming at summarizing and displaying in a user-friendly way the available data. The matrix columns were annotated with information about the 21 genes, using the following fields: 1) gene alteration, 2) description of the experimental evidence, 3) number of patients on which those data are based (that we also relate to the degree of reliability of that gene), and 4) putative activity type (Table 4). Additionally, each gene set was annotated with information found in the on-line OSMSD resources, using the following five fields: 1) brief description (it summarizes the experiment performed), 2) full description or abstract (it explains more in detail the experiment or has an excerpt from the article’s abstract), 3) source publication (it displays the reference article or the Authors), 4) exact source (it describes the experimental comparison and the level of stringency used), and 5) organism (it shows if the cell line used was human or murine) (Table S3 (169KB, pdf) ). We are aware that the style and content of these five fields would need improvement, and we have also noticed mistakes in this annotation. Nevertheless, since the incomplete or wrong annotation of OSMSD did not interfere with our analyses and we have amended and edited what was needed in the main text, we have left, for consistency, the information of Table 3 as it can be found in the Molecular Signatures Database. There are two data features that increase the reliability of this type of analysis: a) all the OSMSD have a number of members ≤ 481 (NFE2L2.V2) and, in the case of the 53 gene sets used for this analysis, ≤ 294 (STK33_NOMO_UP) (Table S4 (169KB, pdf) ). This stringent selection of candidates, based on gene sets having relatively small sizes, reduces the risk that hits within a gene set happen by pure chance; b) all found matches are shown in Table 4, so that Readers can formulate hypotheses on their own about the meaning of these hits. However, in order to further increase the reliability of the assessments made in the Results, we decided to disregard those gene sets that do not comply with each of these three criteria: (i) the experimental procedures, reported in the manuscript that was used for defining the gene set (Table S3 (169KB, pdf) , column 4), allow estimating/determining the type and effect of the experimental stimulus; (ii) there is a good degree of biological consistency between BNPTP and the biological system or the cells (either transformed or normal) used in the gene set experimental procedure. Alternatively, the cell lines can be regarded, in our judgement or according to the literature, as recipient/model cells of general biological relevance where specific biochemical events are induced and/or tested. A third case is that the gene targeted by the gene set experiment is tested in what seems to be a cell line-specific background, but there is enough evidence that the same gene is important for a spectrum of cancer types or biological phenomena that goes beyond the disease typically modeled by that cell line. When this last case is applied, we explain in the text the biological implications of this inclusion (this is what we did for some gene sets identified using leukemia cell lines); (iii) it is possible to determine a specific or non-specific gene/protein targeted by the methods used to induce/inhibit cell growth, using both the Authors’ description and the OSMSD annotation; for example, in some experiments cells were treated with growth factors, but the identification of the proteins, which are up- or down- regulated, was not performed or was not clearly enough explained (similarly for cells that are slowed down). The gene sets marked with an X in Table S3 (169KB, pdf) , column 7, include either those obtained through the downregulation of a (putative) tumor suppressor, or those generated through the upregulation/downregulation of a (proto)oncogene. The downregulation was achieved in knock-out mice (RB_P130_DN.V1_UP) or by RNA-interference (ATM_DN.V1_DN, BMI1_DN.V1_UP, BRC A1_DN.V1_UP, CTIP_DN.V1_UP, HOXA9_DN.V1_UP, P53_DN.V2_DN, P53_DN.V2_UP, PTEN_DN.V1_DN, STK33_NOMO_UP, STK33_SKM_UP, TBK1.DF_DN, TBK1.DN.48HRS_UP); since these techniques are reported to have a high efficiency, we confidently assumed that the target gene/protein has a residual activity close to zero. The upregulation was mostly obtained by overexpressing a transgene using a suitable vector (such as a virus); other techniques include adding a chemical compound targeting a specific protein (ERB2_UP.V1_UP, NOTCH_DN.V1_UP, WNT_UP.V1_DN, WNT_UP.V1_UP) or achieving gene amplification (YAP1_UP). In most cases, the exact amount of upregulation is not quantified (either in terms of cell proliferation or in terms of concentration/activity of the intracellular protein), but we conventionally considered these gene sets as reliable as those based on knock-out mice and RNA-interference, since the described techniques and reagents are largely used in the field and show consistent and reproducible results [57].
Table 4.
mmary of the annotation of the 21 BNPTP genes and “hit matrix” based on the OSMSD.
 |
Gene sets that do not fulfil the above criteria (26 out of 53) were candidates for exclusion (CFE) from the Results. Overall, gene sets were CFE because: i) we deemed the tissue of origin of these cells not informative enough for making inferences on pediatric/teenage BC and this feature was not balanced by the cell line being considered a model of general relevance (ATF2_S_UP.V1_DN derived from myometrium; CAHOY_ASTROGLIAL derived from astroglia cells; ESC_J1_UP_LATE.V1_DN, ESC_V6.5_UP_ EARLY.V1_UP and ESC_V6.5_UP_LATE.V1_DN based on embryoid bodies; PIGF_UP.V1_DN and VEGF_A_UP. V1_UP based on human umbilical cord vein endothelial cells, JAK2_DN.V1_UP of erythroleukemia cells), ii) the target gene alteration was not sufficiently described, either as a mutation of DNA or of the protein sequence or for the effects induced on the protein function (P53_DN.V1_DN and P53_DN.V1_UP), iii) the effect of gene silencing/ upregulation is not sufficiently clear in tumorigenesis or has not been exhaustively stated in the relevant manuscript (PRC2_EDD_UP.V1_UP was discarded because the role of the EED gene (a transcriptional repressor, member of the Polycomb group) in oncogenesis is currently unclear and the only mutation in man described so far [58] causes a Weaver-like syndrome, characterized by overgrowth but not cancer; RPS14_DN.V1_UP was discarded because RPS14 encodes a ribosomal protein part of the 40S subunit of the ribosome: its impairment has a general role on protein biosynthesis, but not a “specific” role in carcinogenesis), iv) the cells were forced to differentiate (LEF1_UP.V1_DN and LEF1_ UP.V1_UP, where an epithelial to mesenchymal transition (EMT) is induced), v) the cells were treated with growth enhancers or inhibitors having a generic effect on cell proliferation without describing the main genetic targets related to tumorigenesis (CSR_LATE_UP.V1_DN, DCA_UP.V1_DN, GCNP_SHH_UP_LATE.V1_UP, IL15_UP.V1_UP, IL2_ UP.V1_DN, IL2_UP.V1_UP, IL21_UP.V1_UP, PDGF_ UP.V1_DN, PDGF_UP.V1_UP, RAPA_EARLY_UP.V1_ DN and TGFB_UP.V1_DN), vi) the definition of the gene set in the OSMSD is ambiguous and, most likely, the induced effect is not specific enough (LTE2_UP.V1_UP).
Finally, we decided to partially overrule the aforementioned selection criteria by including in the final analyses the two gene sets concerning TP53 that were excluded so far (i.e., P53_DN.V1_DN and P53_DN.V1_UP) because of the importance of this tumor suppressor and of some general evaluations about how these two gene sets were generated. Specifically, the NCI-60 panel of cell lines was screened and two cell line groups were created for TP53: a) 17 carrying a normal p53; b) 33 with a mutant p53 [21]. Generally speaking, it is true that i) each different mutant of p53 behaves differently, ii) some of them exhibit gain of function (enhanced tumorigenicity and resistance to therapy) and others do not [59, 60], and iii) it is challenging to interpret results of a direct comparison between these two groups, since they were created by combining all the mutants. However, it is also true that these two gene sets are based on the presence of mutant p53, so on conditions that, more or less effectively, promote cell proliferation. The “rescue” of these two cases brings the final count of gene sets for this article to 29 used and 24 discarded from the analysis.
2.4. Standardized Criteria for Commenting the Matrix Hits
Each hit of this matrix has been evaluated in the following sequential way. Step 1: assuming that the background of BNPTP is constantly pro-growth (all being cancer patients), the background of the experiment that generated each gene set is assessed, thus allowing splitting the 29 gene sets that successfully went through the steps above into “generated in pro-growth conditions” and “generated in anti-growth conditions”. Step 2: it is checked if the polarity of the gene set (containing genes upregulated or downregulated) matches the polarity of the activity type of the BNPTP genes (also upregulated or downregulated). BNPTP genes that are conflicting or undefined are sometimes commented in the Results, but we do not consider them as part of our core assessments. Step 3: combining background and polarity, it is possible to generate standard comments, which are based on the assumption that 16 cases are overall possible. Indeed, in a very simplified perspective, the experimental input can determine activation or repression of an oncogene or a tumor suppressor (total: four cases possible). Additionally, the gene set typology is UP or DOWN and the same happens for each BNPTP (UP or DOWN) (total: four cases possible). The combination of the former and latter four cases defines the 16 (= 4 x 4) instances mentioned before. Notably, these variables allow also splitting the 16 cases into two groups with 8 instances each, due to the fact that in half of the cases the biological background produced for the gene set is pro-growth and in the other half is anti-growth; this means that in 50% of the cases there is compatibility between BNPTP and gene set biological background and in the other 50% there is, instead, incompatibility. Of course, these cases are a priori defined and have nothing to do with how many actual matches we found for each of these 16 cases. In fact, there is an evident bias in the sort of experiments performed for determining the gene sets (mostly pro-growth) as well as in the type of activity found for each BNPTP gene (mostly UP). Finally, when these analyses allow identifying a possible gene pathway of BNPTP, rather than a single upstream gene, up- and down- stream genes are connected, in the text, using a →; instead, the up- and down- regulation symbols are, respectively, ↑ and ↓.
2.5. Gene Identification
Considering that multiple gene names are used in the literature for the same DNA sequence, all genes analyzed in the Results are uniquely identified through the Online Mendelian Inheritance in Man (OMIM; http://www.omim.org) database identification (ID) number. This ID is reported in Table 2, column 11 (for the genes altered in BNPTP) and in the main text (for the genes that were targeted by the experiments that allowed defining the gene sets collected in the Molecular Signatures Database).
3. RESULTS
3.1. Gene Ontology
We analyzed the 21 genes that have been found altered in BNPTP using methods based on gene ontology (GO), which is largely applied to genomics data [20, 61, 62]. We chose an exploratory point of view [63], trying to understand the collective properties of these genes as much as possible, while deemphasizing the importance of the p-values obtained for each GO term, since these measures might be affected by the small number of genes available. In particular, we i) only looked for the most relevant GO terms of biological processes (BP), thus excluding GO terms related either to cellular component (CC) or molecular function (MF), ii) took into account, for our assessments, that some BPs are found because of the original bias of starting from a gene list, which contains cancer-related genes, iii) tried to determine if statistically significant BPs that are apparently unrelated to BNPTP suggested the involvement of relevant, but elusive mechanisms, iv) used the evidence provided by the GO analyses for connecting the identified BPs and important mechanisms and molecules that have been described in BC, and v) minimized the number of GO-BP categories to be discussed using a measure of semantic similarity within an agglomerative process, which is conceptually similar to a hierarchical clustering applied to GO terms [50, 52]; this makes possible selecting redundant and non-redundant GO terms and allows reducing the complexity of the GO-BP graph.
The GO-BP summarizing graph (Fig. 1) shows two main subgraphs (left, with 9 nodes and right, with 11 nodes), two nodes linked to the node ‘small GTPase mediated signal transduction’, which belongs to the right subgraph, and 4 isolated nodes, which we positioned at the bottom, on the left side of this graph. The left subgraph has stronger semantic connections (displayed as thicker edges, on average) among its nodes, when compared to the right subgraph. The right subgraph mainly contains terms related to regulatory mechanisms, cellular organization and replication; three isolated nodes (i.e., ‘regulation of growth’, ‘cell cycle checkpoint’ and ‘death’) are fully or partially related to cell replication as well. Some prominent GO terms of the right subgraph that are expected to be deregulated in cancer cells are: ‘regulation of DNA replication’, ‘regulation of cell proliferation’ and ‘smoothened signaling pathway’. From a complementary perspective, four nodes on the right are related to cell-cell communication (‘regulation of cell-matrix adhesion’) and signal transduction (‘small GTPase mediated signal transduction’, ‘positive regulation of Rac protein signal transduction’ and ‘positive regulation of nucleobase-containing compound metabolism’). The GO term ‘small GTPase mediated signal transduction’ contains the protein NF1 and the three main members of the Ras subfamily (HRAS, KRAS and NRAS) (Tables 3 and S1), which are mutated and/or deregulated in BNPTP. Overall, up to almost 30% of all human tumors screened - independently of tissue origin - present some mutation in any of the RAS genes, especially KRAS [64]. Approximately 13% of the BC specimens has a mutation in one of the RAS proteins [65] and this is particularly true for the non-muscle invasive BC in adults [66]. Due to the chemical nature of GTPases, which hydrolyze guanosine triphosphate (GTP), it is very interesting finding the category ‘positive regulation of nucleobase-containing compound metabolism’. Indeed, beyond the direct role of GTP, also nucleotide-derived cyclic compounds seem to play a central role in the urogenital cancer development [67] and our GO analysis allows highlighting the importance of these biological processes in BNPTP. Notably, at least some inhibitors of phosphodiesterases (PDEs) - which are critical components in the cyclic AMP/protein kinase A (PKA) and cyclic GMP/phosphokinase G (PKG) signaling pathways - are able to induce apoptosis and inhibit cell growth in rodent models of bladder cancer; additionally, one bladder cancer cell line (HT1376) derived from a woman [68] shows the overexpression of PDE5, similarly to human squamous and transitional cell carcinomas, when compared with normal urothelium [69]. Therefore, this last GO-BP term suggests that these biochemical events may be involved not only in adult BC but also in BNPTP.
Fig. (1).
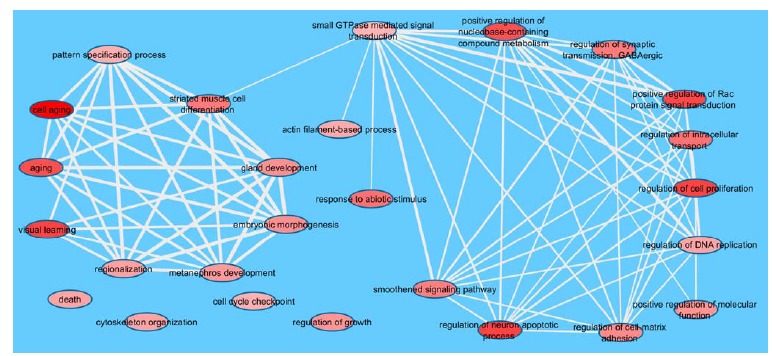
Main GO categories selected by REVIGO. The DAVID-derived p-values are used for determining the red color shading of the ovals (the darker the red, the more statistically significant the GO (see Table 3)). The edge thickness is proportional to the level of semantic similarity; ovals without connections are semantically dissimilar from the others with respect to the similarity threshold used for this analysis.
It is crucial for a cell to segregate DNA and cytoplasm to the daughter cells, functionally using its molecular mechanisms of cell division. Indeed, genes impairing the normal progression of cytokinesis are either down- or up- regulated in human cancers, according to their cellular role; additionally, some of them have been mapped to chromosomal regions that are either deleted or amplified in tumors or tumor-derived cell lines [70-73]. GO terms such as ‘regulation of intracellular transport’ (inside the right subgraph), ‘actin filament-based process’ and ‘cytoskeleton organization’ (outside the right subgraph) fit quite well in these processes. Human genes causing cytokinesis failure have been involved in cancer pathogenesis [74, 75], inducing the formation of polyploid cells with an abnormal growth. In particular, this is true for bladder cancer [76]. Aneuploidy may be a consequence, among other possibilities, of the centrosome function impairment. Indeed, it has been demonstrated that, in some BC specimens, mitotic kinases, such as Aurora A, are significantly overexpressed or amplified [77], and may induce defective centrosome behavior as well as polyploidy [78, 79]. Similarly concerning the intracellular movement, but also cell-cell communication processes, there is the ‘regulation of synaptic transmission GABAergic’, despite its role is usually related to the normal function of the nervous system (which here relies also on the GO term ‘regulation of neuron apoptotic process’). Notwithstanding the absence of a direct link between bladder cancer and vesicle movement in the literature, a hypothetical link may be defined. The correct course of cytokinesis involves the addition of membrane to the cleavage site, to allow furrow ingression and cytodieresis. These phenomena occur through the movement of lipidic vesicles originating from the endoplasmic reticulum and modified in the Golgi stacks; failure of this intracellular transport causes cytokinesis impairment in animal models [80]. The parallel between this vesicle movement inside the cell and that of synaptic vesicles is quite straightforward, thus it is tempting to hypothesize that at least some molecular mechanisms are in common between these two biological phenomena. Altogether, nodes described so far (both inside the right subgraph and isolated) create a coherent picture of a general deregulation at the cellular level, as it is expected from specimens of cancer patients.
The left subgraph is somehow less expected, though; its nine nodes have thicker lines than the nodes in the other subgraph (Fig. 1), suggesting that their semantic connections are more intimate. If we consider the whole group of nodes, a relationship emerges between most of the GO terms identified and various processes of embryogenesis and/or development. Six of these nodes are indeed involved in organogenesis (‘gland development’, ‘metanephros development’), tissue differentiation (‘striated muscle cell differentiation’) or body patterning (‘regionalization’, ‘pattern specification process’, ‘embryonic morphogenesis’). Two nodes of the left subgraph (‘aging’ and ‘cell aging’) are not apparently related to these processes, although it is fascinating to note that they may be considered as opposing the natural, embryonic related cellular rejuvenation [81, 82].
The only apparently off-topic nodes of (Fig. 1) seem to be ‘visual learning’ (inside the left subgraph) and ‘response to abiotic stimulus’ (linked only to the node ‘small GTPase mediated signal transduction’). The definition of the former is “any process in an organism in which a change in behavior of an individual occurs in response to repeated exposure to a visual cue”; the definition of the latter is “any process that results in a change in state or activity of a cell or an organism (in terms of movement, secretion, enzyme production, gene expression, etc.) as a result of an abiotic (non-living) stimulus” [83]. Consequently, these two GO terms do share logical connections, being light an abiotic stimulus and a visual cue. As a matter of fact, the link between cyclic rhythms (which depend on the alternation of light and darkness) and human diseases (including cancer) or health issues is not a novelty and has been investigated by chronobiology [84, 85]. Even the young age of the patients that are the focus of our analyses does not seem to be a limitation, except possibly for the youngest cases (see, for instance, Table 2, row 27), since the emergence of important biological rhythms has been shown within 18 weeks from birth [86]. One of the genes involved in circadian cycles is TP53 [85, 87, 88], which is present in the list of genes that are altered in BNPTP, although without a well-defined status (Table 2). This gene belongs to GO:0009416, ‘response to light stimulus’ (Tables S1 and S2), which is one of the five GO terms (out of the 75 identified using EASE) that depend on ‘visual learning’. Additionally, melatonin ‘is a chemical signal of darkness’ [89] that has also been used for treating cancer patients [90, 91]; melatonin receptors MT1 and MT2 are G-protein coupled receptors that are expressed in various parts of the body, including the bladder [92]. The physiological changes induced by melatonin [92], the role of melatonin levels in aging [93] and apoptosis [94] and, more specifically, the direct effect of night work on bladder cancer formation in adults [95] as well as the bladder role in the excretion of melatonin metabolites at night [94] suggest that the relationships between the genes that belong to the ‘visual learning’ GO category and melatonin might play some role in BNPTP. Finally, if we refer to generic stimuli, any non-endogenous chemical might be involved in the category ‘response to abiotic stimulus’. Indeed, it is generally accepted that some chemicals influence the health of the inner bladder walls, since this tissue comes into contact with any hydrosoluble compound waiting to be excreted in the urine. As a matter of fact, some substances – mostly pollutants – are directly or indirectly linked to bladder cancer formation in adults [65]. However, the contact between compounds and bladder walls usually requires many years to induce the neoplastic transformation [96], thus this situation is not easily applicable to pediatric/teen patients, even conceding that such substances might enter into contact with the fetus of a pregnant mother. For example, in adults the risk of BC is directly proportional to the number of years spent smoking and the exposure to occupational chemicals may cause BC after several decades. Also, hairdressers who performed their jobs for more than 10 years have a five-fold increase of their risk of being diagnosed with BC, while the hazard increases by 3.3 times for people who use permanent hair dyes at least once a month for 15 and more years [96]. Overall, in adults the BC incidence increases with age, being most commonly diagnosed in the seventh decade of life [97]. Altogether, data suggest that environmental factors per se (without a genetic predisposition) are not compatible with BC formation in infants and are weakly correlated with BC in teenagers; however, it is evident that the time between first exposure and BC diagnosis is highly variable, probably depending on the stimulus (quality, quantity) and on the individual susceptibility. This quantitative topic deserves, in our opinion, to be investigated further.
3.2. Gene Set Analysis and Identification of Possible Upstream Genomic Events
There is an urgent need to formulate hypotheses that, even if partially destined to not be confirmed experimentally, may help us understanding what happens, at a molecular level, when genes are altered (at the level of DNA, mRNA or protein) in BNPTP. In order to increase the chances to find relevant upstream events, either in etiological terms or as parallel biochemical events that target these effector genes, we limited our analysis to gene sets having an oncological relevance, which were described in biological contexts generally compatible with BNPTP (thus raising the conditional probability of finding successful matches). It is important to highlight that, since the average size (i.e., number of member genes) of the 189 oncological gene sets that were used is 165.71 (Table S4 (169KB, pdf) ), the average probability for a gene to be in a gene set by pure chance, looking at each gene set individually, is in the order of 1%. While a match between gene names in the BNPTP gene list and among the gene sets of oncological relevance is defined by a binary answer (namely, “yes, it belongs to” or “no, it is not found in”), the same is not true in terms of biological compatibility between a) experimental input and model system used for defining the gene set and b) nature of the alteration(s) found in the BNPTP genes. For this reason, while we have found 60 hits in the 53 x 21 matching matrix, the cases actually discussed below are only 34; indeed, our comments are limited to the most straightforward matches found and the other gene sets are left to the interpretation of the Readers. The gene descriptions provided below, at the beginning of each gene paragraph, are intended as i) helpful information to be used by the Reader when checking the hits of Table 4 and the supplementary data of individual gene sets contained in Table S3 (169KB, pdf) and ii) part of the contextualization approach followed throughout the entire article, since we highlight gene features and molecular mechanisms that are mostly related with cell cycle progression and oncogenesis. The second half of each gene paragraph, instead, is part of the Results section in the most usual way and conceptually depends on the last three paragraphs of the Materials and Methods section. Since the analyses reported below are intended for the tumor samples in which these gene alterations were found in BNPTP, we suggest reading this section on a gene by gene basis and using all the information reported in Table 2.
3.2.1. ACTA2
Alpha-actin-2 (ACTA2) is one of six different actin isoforms which have been identified in vertebrates; in particular, this actin is present in the human aortic smooth muscle. In the aorta, ACTA2 interacts with the beta-myosin heavy chain MYH11 [98]. Recently, some links between ACTA2 and cancer have been found: ACTA2 regulates c-MET and FAK expression in lung adenocarcinoma cells, which positively and selectively influence the metastatic potential [99]. Moreover, the acquisition of ACTA2 expression in the sarcomatous component suggests that an EMT had occurred in the progression to metaplastic breast carcinoma [100]. Interestingly, human malignant melanoma cells release a platelet-derived growth factor-like substance that inhibits the expression of this gene in normal cells [101].
The existing match between this gene and the gene set BMI1_DN.V1_UP [102], based on the silencing of the oncogene BMI1 (OMIM ID: 164831), establishes a link between the anti-growth condition of this gene set and the tumor status of the patient who had an over-expression of the ACTA2 protein (detected by immunohistochemistry). Since the gene set is UP and the gene type is UP too, this match happens in conflicting experimental/clinical conditions. An analogous case happens for the gene set HOXA9_DN.V1_ UP [103], generated by silencing HOXA9 (OMIM ID: 142956), which might be relevant for its function in sustaining the cell proliferation rate [104], again with an UP/UP polarity for the gene set and this BNPTP gene in the presence of a discordant biological background. The experiment that defined this gene set was performed in acute myeloid leukemia (AML) cells, but since HOXA9 is important in many cancers [105], we decided to comment this hit as a viable one. This gene is also hit by STK33_SKM_UP [106], which was defined upon silencing of STK33 (OMIM ID: 607670) in mutant-KRAS cells. The precise molecular functions and role of STK33 in these cells is debated [106-109]; however, as far as it is relevant for our analyses, since this gene set was derived in pro-apoptotic conditions and there is an UP/UP polarity for the couple gene set STK33_SKM_UP/gene ACTA2, this is another clear case of two conflicting biological conditions where this gene is upregulated. Finally, ACTA2 belongs to the gene set P53_DN.V1_DN (mutant p53, pro-proliferative conditions) [21], a gene set that collects genes that are down-regulated in the presence of a mutated p53 (OMIM ID: 191170). In this last case, we have compatibility between the experimental conditions, but a conflict at the level of gene response (DOWN for the gene set and UP for ACTA2). Altogether, these results suggest that the actual upregulation of the ACTA2 protein should be reevaluated, also considering that this evidence is limited to one patient, in order to assess the possibility to correct its “polarity” (i.e., from UP to DOWN) or, possibly, to understand if these conflicts between gene sets and status in BNPTP depend on tissue-specificity and/or the peculiar role played by ACTA2 in these malignancies. Notably, with a change of the ACTA2 “polarity” the first three gene sets aforementioned would suggest that ACTA2 is a critical gene for BNPTP, whose levels go down or up in pro- or anti- proliferative conditions, respectively.
3.2.2. ALK
The anaplastic lymphoma kinase (ALK) is a receptor tyrosine kinase having a putative transmembrane domain and both an extracellular (N-terminal) and an intracellular (C-terminal) domain; the kinase activity of ALK resides completely in the intracellular portion of the protein [110]. Its misexpression, consequent to an amplified, mutated, truncated or rearranged protein, may lead to malignant transformation; mutations causing ALK kinase function hyperactivation, or putting the catalytic region under the control of another genetic promoter (as in chromosome translocations) deregulate the enzyme that, in turn, phosphorylates its targets in aberrant times and/or tissues [110]. One of the manuscripts listed in Table 2 reports two pediatric/teen BC involving ALK rearrangements [36]. The Authors took advantage of two DNA probes (orange and green) encompassing the ALK locus, so that they are next to each other in normal cells; since in these two patients the green and orange staining were separated on two different chromosomes in cancer cells, they postulated an ALK rearrangement. Although the fusion partner is not described in this manuscript, in consideration of the nature of the sample (a cancer specimen) and of ALK behavior in known fusion proteins in inflammatory myofibroblastic tumors ([36] and references therein), we assumed that also in these patients there was an upregulation of the activity of the ALK kinase fragment.
ALK belongs to the gene set RB_P130_DN.V1_UP [111] and its activity is UP in BNPTP. Since this gene set contains genes that are upregulated in the presence of a double knock-out for RB1 (OMIM ID: 614041) [112] and RBL2 (a.k.a. p130) (OMIM ID: 180203) [113, 114], any mechanism that interferes with the function of these two (putative) tumor suppressors, whose cellular roles are partially overlapped [115], has the potential to worsen this phenotype. ALK is also hit by CYCLIN_D1_KE_.V1_DN [116], a gene set based on the overexpression of the putative oncogene CCND1 (a.k.a. cyclin D1) (OMIM ID: 168461). While there is compatibility between gene set and gene biological context (i.e., they are both based on pro-proliferative conditions), the fact that ALK mRNA is downregulated in the gene set and the ALK protein activity is instead upregulated in BNPTP does not provide a direct link between these two molecular events.
3.2.3. CD34
The hematopoietic progenitor cell antigen, cluster of differentiation 34 (CD34) is a cell surface glycoprotein that functions as a cell-cell adhesion factor. It is a transmembrane sialomucin protein expressed on early hematopoietic and vascular-associated tissue [117]. Although its function is still elusive, data collected suggest that it may be involved in cell morphogenesis and migration, enhanced proliferation, and block of cell differentiation [117]. Interestingly, the up-regulation of the closely-related podocalyxin (member of the CD34 family of proteins) has been related to several malignancies, including breast cancer, prostate cancer, embryonic carcinomas, leukemia and pancreatic cancer [117].
For CD34 we have one of the most interesting cases of Table 4. Indeed, the gene set BRCA1_DN.V1_UP [118] hits this gene and this happens in pro-growth conditions for the experiment defining this gene set (silencing of BRCA1 (OMIM ID: 113705)). Therefore there are good chances or that CD34 is downstream of BRCA1 and the deregulation of this tumor suppressor is critical for the onset of BC in young patients or that the status of BRCA1 may be critical for the progression of this type of cancer, being able to further sustain the upregulation of this protein. Notably, a similar relationship can be established about the gene set CTIP_DN.V1_UP [118], which is based on the silencing of the tumor suppressor CtIP (a.k.a. RBBP8 or CTIP) (OMIM ID: 604124), whose association and interaction with BRCA1 has been described [119]. Overall, this analysis shows that there are two tumor suppressors, i.e., BRCA1 and CtIP, whose silencing induces the transcription of the CD34 gene and in pediatric/teen BC this protein is indeed up-regulated. These experimental evidences deserve further research, looking for cause-effect relationships between BRCA1/CTIP deregulation and upregulation of CD34 in BNPTP. Additionally, CD34 belongs to KRAS.AMP.LUNG_UP.V1_DN [120], a gene set based on the comparison between the hyper-expression of KRAS (a proto-oncogene; OMIM ID: 190070) that carries the G13V activating mutation and cells without this construct, i.e., in favorable conditions for cell proliferation. Since in the BC patient in which this alteration was found there was, as explained above, a protein up-regulation (Table 2), this might be a case where two different mechanisms are involved in BNPTP and in other model systems; alternatively, this information could be relevant for defining how the levels of the CD34 protein are finely tuned, once defined the status of KRAS.
3.2.4. CDKN2A
Cyclin-dependent kinase inhibitor 2A (CDKN2A) is an oncosuppressor having at least three isoforms [121]. It is an inhibitor of cell cycle progression and acts at the G1/S transition by suppressing the action of crucial cyclin-dependent kinases, such as CDK4 and CDK6 [122]. This gene also contains another open reading frame coding for the ARF protein, which acts as an oncosuppressor as well [123]. The deletion or mutation of CDKN2A is frequently associated with neoplastic transformation in several tissues and organs, including the bladder [124], while it has been shown that ARF degradation is inhibited in cancer cells [125], suggesting that p16 and p19/ARF may act in complementary, inversely related cell cycle control pathways.
Since oncogenic KRAS-driven cancers require TBK1, and TBK1 silencing induces KRAS-dependent apoptosis (OMIM ID: 604834) the hit of CDKN2A in the gene set TBK1.DN.48HRS_UP [120] suggests that the negative interference with this oncogenic pathway might positively induce CDKN2A, while the tumor promoting conditions found in BNPTP are able to down-regulate it. Therefore, CDKN2A shows potential to be a gene that switches its levels (UP or DOWN) in response to specific anti- or pro- tumor stimuli, respectively. CDKN2A is also found in the gene set SNF5_DN.V1_DN [126], since the knockout of the tumor suppressor SNF5 (OMIM ID: 601607) lowers its mRNA levels, in pro-proliferative conditions. Therefore, the dysregulation of SNF5 might be a worsening factor for the down-regulation of this protein in BNPTP (instead, we rule out the case that there is any causal relationship since the downregulation of CDKN2A is at the level of gene deletion (confirmed in 4 patients) and not of mRNA or protein). Considering that SNF5 and SMARCB1 are synonymous, this analysis can be combined with that of SMARCB1 (see below). Additionally, also CYCLIN_D1_KE_.V1_UP hits this gene [116]; this gene set is based on the overexpression of the putative oncogene CCND1 and therefore there is biological compatibility between what observed for the gene set at the mRNA level and these four patients at the protein level. This could be invoked as a control mechanism for the downregulation of CDKN2A, but the fact that using this target gene (i.e., CCND1) would require inducing a cyclin makes this information hardly applicable, in our opinion. Finally, this gene belongs to P53_DN.V1_UP [21]; this means that, in the pro-proliferative conditions that characterize this gene set, the CDKN2A mRNA is upregulated, while the CDKN2A gene is DOWN (being deleted) in BNPTP. These two events are clearly not correlated and do not need to be commented further.
3.2.5. Gli1 and Gli3
The GLI (glyoma associated oncogene) proteins are transcription factors. They are effectors of the Hedgehog (Hh) signaling pathway and have a role in cell fate determination, proliferation and patterning in many cell types and most organs during embryo development [127]. Their amplification causes neoplastic transformation in the central nervous system, and Northern blot analysis showed that GLI mRNAs are expressed in embryonal carcinoma cells but not in most adult tissues [128]. Gli1 is a recognized oncogene [129] and its over-expression in mice causes the formation of basal cell carcinoma (BCC) [130]. Instead, Gli3 is not related to glyoma, BCC or other forms of neoplasia, but is essential for Gli1 expression in the somites during the muscle formation [131]. Its mutations are associated with several other diseases, such as Greig cephalopolysyndactyly syndrome, Pallister-Hall syndrome, preaxial polydactyly type IV, and postaxial polydactyly types A1 and B [132]. Gli3 may both act as an activator or repressor of transcription [133].
GLI1 is one of the genes of the gene set WNT_ UP.V1_UP [134]: this is a typical case of a hyper-expressed oncogene (WNT1 (a.k.a. Wnt-1) (OMIM ID: 164820)) that induces the expression of a set of genes. Since in this gene set there are only genes up-regulated and GLI1 is up-regulated too in BNPTP, it is possible or that WNT1 is directly upstream of GLI1 or that its activation is capable to worsen the phenotype observed in the presence of elevated levels of GLI1. Another interesting case is present for the second hit of GLI1: the gene set CYCLIN_D1_KE_.V1_UP [116] is based on the overexpression of CCND1 and there is compatibility both at the level of biological context (pro-proliferative) and type of change (upregulation) between this gene set and this gene; additionally, the molecule involved (i.e., mRNA) is the same. This makes a relatively strong case for CCND1 being upstream and directly inducing the levels of GLI1 found in BNPTP, or, alternatively, this perturbation of cyclin D1 might worsen the phenotype of these patients. Finally, considering that the upregulation of WNT1 upregulates CCND1 (this has been described as an early biological event) [135], it is possible to hypothesize that the pathway WNT1 ↑ CCND1 ↑ GLI1 ↑ is involved in BNPTP. Instead, only one gene set (CSR_LATE_UP.V1_DN) hits GLI3, but it is one of the 24 gene sets that we consider less usable for making this type of inferences. So, we cannot conclude anything relevant about possible upstream events for GLI3, based on the available oncological signatures.
3.2.6. HRAS, NRAS and KRAS
The small GTPase class of proteins called RAS (from the phrase “rat sarcoma”) includes three main members, i.e., HRAS, NRAS and KRAS. They are ubiquitously expressed in all human organs and their role is the intracellular signal transmission; they perform such a task by conformational changes induced by the hydrolysis of GTP into GDP. These changes are usually a response to an extracellular stimulus, passed through by specific receptors. RAS proteins transmit the signal by activating many biochemical cascades (such as Mitogen-activated protein kinases (MAPK)) and in this way control crucial cellular activities, such as cell proliferation, differentiation, and apoptosis [136, 137]. Mutations causing permanent activation of RAS polypeptides are oncogenic [138] and play a central role in bladder cancer formation [65]. Martinelli and collaborators showed that somatic missense mutations in RAS genes represent a recurrent event in pediatric/teenage embryonal RMS, accounting for approximately one fourth of the cases [40].
HRAS is involved in a wide number of normal cellular processes, and its upregulation may be sometimes physiological, as during rat liver regeneration [139]. Mutations in HRAS are also responsible of Costello syndrome, a multiple congenital anomaly and mental retardation syndrome [140]. KRAS has two isoforms called KRASA and KRASB, derived by an alternative splicing, differing in the C-terminal regions, which are important for post-translational modifications causing alternative trafficking pathways and protein localization [141]. Also deregulated KRAS is frequently involved in neoplastic transformation; in fact, 17 to 25% of all human tumors harbor an activating KRAS mutation [142]. Finally, also NRAS plays a central role in cell proliferation and its uncontrolled activation may lead to neoplastic transformation. Mutations in position 17 (in all RAS members) produce dominant-inhibitory proteins with higher affinities for exchange factors than normal RAS, impairing their functions [143]. NRAS mutations were identified in Noonan syndrome-6 [144] and in patients with congenital melanocytic nevus syndrome [145].
HRAS is hit by LTE2_UP.V1_UP [146], but this gene set has been discarded based on pre-defined algorithm steps that we used for gene set selection (see Materials and Methods); for this reason, this analysis is unable to provide more biological insight and the main information available is that this gene was found mutated in two BNPTP (Table 2). NRAS belongs to the STK33_NOMO_UP gene set [106]; as mentioned in the ACTA2 paragraph, while the precise role of STK33 downstream of mutant KRAS is not fully clear [107-109], and while some caution should be used in making inferences based on AML cell lines, we consider reliable the information of Scholl et al. [106] about the fact that silencing STK33 has a strong anti-proliferative effect. This creates a biological conflict, since the UP/UP status for this gene set and NRAS (protein activity) is associated with anti- and pro- proliferative conditions in these two cellular environments, respectively; ultimately, also considering that the upregulation of the NRAS mRNA is dependent on two events (mutation of KRAS and STK33 knocked down) we consider this outcome inconclusive for NRAS. Instead, the situation of match between NRAS and the gene set YAP1_UP [147] is quite interesting: the over-expression of the YAP1 (OMIM ID: 606608) oncogene [148] induces NRAS, and this makes YAP1 a protein potentially capable to amplify NRAS mRNA levels and worsen the phenotype of these patients. Finally, no gene set hits KRAS, while it is upregulated in BNPTP. This outcome raises the odds that the mutation of this proto-oncogene is an early event of this cancer’s onset; therefore, the most important biochemical events concerning this gene are rather found downstream.
3.2.7. KRT20
Cytokeratin 20 is a type I cytokeratin encoded by the KRT20 gene. It is an integral intermediate filament component and a major cytoskeletal keratin of the intestinal epithelium. Its principal localization is in the intestinal and gastric mucosa, and in several other epithelia; indeed, it is also present in superficial (and, occasionally, intermediate) cells of the bladder urothelium (urothelial umbrella cells). As such, it can be used to identify a range of adenocarcinomas arising from epithelia, and by immunohistochemistry it is frequently found in colorectal cancer, transitional cell carcinomas and Merkel cell carcinoma [149]. In combination with CK7, it is a useful marker of bladder cancer [150].
We found a hit for this gene: in fact, a KRAS mutation downregulates KRT20 (gene set KRAS.600.LUNG. BREAST_UP.V1_DN [151]), whose activity is UP in our collection of clinical reports. The examined KRAS mutation is found in breast and lung malignancies, and, overall, these data point towards a tissue-specific KRT20 status.
3.2.8. MUC1
Mucin 1, cell surface associated (MUC1) is a transmembrane mucin (high molecular weight, heavily glycosylated protein) with the function of tissue protection from pathogen-mediated infections, but is also involved in signal transduction [152]; it is an oncoprotein. Being an epithelial protein, its expression is usually associated with carcinomas (of colon, breast, ovary, lung and pancreas), but it has also been found in mesenchymal tumors (such as synovial sarcoma and ovarian granulosa cell tumors) [153]. Some Authors hypothesize that its upregulation gives an advantage to cancer cells against the anti-tumor immune response [154]. Moreover, it has also been shown that the cytoplasmic portion of MUC1 may interact with p53, promoting the anti-apoptotic properties of the latter [155]. Apoptosis may also be impaired by the MUC1-mediated phosphorilation of Akt, causing the up-regulation of Bcl-2 and Bcl-xl that in turn prevent the release of the cytochrome c from the mitochondria [156]. Finally, the over-expression of MUC1 promotes the stabilization of beta-catenin, resulting in the initiation of EMT, which promotes invasiveness [157].
This gene belongs to a very interesting gene set, ERB2_UP.V1_UP [158], produced by collecting the genes that become upregulated after inducing the oncogene ERBB2 (OMIM ID: 164870); since the protein MUC1 is upregulated too, ERBB2 should be considered or as a possible upstream gene for MUC1 or potentially involved in a pathway that impacts the same gene in pro-proliferative conditions.
3.2.9. MYF5 and MyoD1
Myogenic factor 5 (MYF5) is a key protein in the regulation of muscle differentiation; MYF5 and MyoD1 (myogenic differentiation 1) are transcription factors belonging to the family of proteins known as myogenic regulatory factors (MRFs). Without the contemporary presence of Myf5 and MyoD, myogenic cells fail to progress normally during the determination stage of myogenesis [159]. MYF5 and MyoD1, and particularly the latter, are able to bind hundreds of muscular gene promoters and drive the myoblast proliferation; MyoD1 cooperates with the Retinoblastoma protein (Rb) to transcribe later markers of differentiation [160] and in inducing cell cycle arrest in terminally differentiated myoblasts, through the regulation of Cyclin D1 [161].
NOTCH_DN.V1_UP is a gene set created investigating the cell cycle deregulation induced by NOTCH [162], a gene having a rather elusive nature, which is context-dependent [163] and MYF5 belongs to it. Since it has been described that in BC NOTCH acts as a tumor suppressor [164] and our evaluations are referred, as much as possible, to the biological background of BNPTP, the following analysis is based on NOTCH intended as oncosuppressor. MYF5 is up-regulated both in the conditions tested for the definition of this gene set and in BNPTP, in the presence of what we assume would be a pro-growth stimulus on the side of the gene set and of a tumor background in BNPTP. Technically speaking, this might be a case where NOTCH signals upstream of MYF5, directly or indirectly. However, the considerable difference among these two biological models (indeed, this gene set was defined in T-cell acute lymphoblastic leukemia cell lines) and the contradictory nature of NOTCH highlighted above suggest caution about establishing this biochemical link. Instead, no inducer gene or mechanism can be hypothesized for explaining the downregulation of MyoD1, since no hit was found for it, which brings up the hypothesis that MyoD1 acts as a specific biomarker of pediatric/teen BC.
3.2.10. NCAM1
Neural cell adhesion molecule 1 (NCAM1) is a glycoprotein expressed on the surface of neurons, glia, skeletal muscle and natural killer cells. It has a role in cell-cell and cell-matrix adhesion [165], neurite outgrowth, synaptic plasticity, learning and memory [166]. NCAM shares many features with immunoglobulins and indeed is considered a member of the immunoglobulin superfamily [167]. Some reports link its expression to cancer, especially to neuroblastoma, malignant lymphomas of T-NK cell origin, multiple myeloma, melanoma, some cancers of epithelial origin [168], small cell lung cancer, neuroblastoma, rhabdomyosarcoma, brain tumors, acute myeloid leukemia [169] and, occasionally, large B-cell lymphoma [170, 171].
The NCAM1 protein is found up-regulated in one patient, but is downregulated in AKT_UP.V1_DN [172]. Since this gene set derives from the hyper-expression of Akt1, an oncogene (OMIM ID: 164730), we are in the presence of an antagonistic way to be upstream of NCAM1, a fairly good example of a gene which may play different roles in different tissues or contexts [173]. Additionally, the gene set KRAS.600.LUNG.BREAST_UP.V1_UP [151] is also hit by this gene; this suggests that oncogenic KRAS might be signaling towards NCAM1 or that it has the potential to worsen the observed phenotype. This result, while important, does not add new key genes to the BNPTP gene list, since KRAS is already among those of primary relevance for these patients. This gene also belongs to MTOR_UP.V1_DN [172], which means that with a pro-proliferative cell background (upregulation of MTOR; OMIM ID: 601231) NCAM1 is downregulated, while, in the pro-growth conditions of BNPTP, the same gene is upregulated. This outcome suggests, among other possibilities, that pediatric/teen BC possibly is an MTOR-independent tumor [174].
3.2.11. NF1
Neurofibromin 1 (NF1) is the gene responsible for neurofibromatosis type I (named NF1 as well), a tumor disorder affecting the nervous system. NF1 is a cytoplasmic protein predominantly expressed in neurons, Schwann cells, oligodendrocytes, and leukocytes. It plays an important role in cell proliferation pathways, such as the RAS-cyclic AMP pathway and the ERK/MAP kinase cascade, in adenylyl cyclase activation, and in cytoskeletal assembly; mutations are usually discovered in the heterozygous state [175]. In particular, its action on HRAS is inducing hydrolyzation of GTP, thus inactivating it; consequently, NF1 acts as a tumor suppressor [176]. Moreover, mutations in this gene have been identified in other clinical conditions, such as juvenile myelomonocytic leukemia [176], Watson syndrome [177], desmoplastic neurotropic melanoma (DNM) [178], glioblastoma [179], and breast cancer [180].
Notably, while the nature of NF1 can be hardly defined looking at the literature about BNPTP (Table 2), the hit matrix based on OSMSD points in the direction of an upregulation: we suggest to investigate this topic further. Indeed, we found that: i) it belongs to P53_DN.V2_UP [181], which is a gene set where the tumor suppressor TP53 is silenced, thus bringing to the upregulation of a number of genes, among which there is NF1. For consistency with this result, the odds that the NF1 mRNA is upregulated are higher than for the opposite hypothesis; ii) TBK1.DF_DN [120] is also hit by NF1; for this gene set, the gene TBK1, upon which the proto-oncogene KRAS relies for cancer induction, is silenced, thus making the cell condition less favorable for growth. This would better match the case that NF1 is upregulated, which, in turn, would raise its chances to be a very sensitive gene, which reacts to pro- or anti- growth stimuli moving its levels in opposite directions. Instead, if this conflict was resolved assuming that NF1 is downregulated in BNPTP, this would be the case of a gene that is DOWN independently of the growth condition, and rather depending on the biological context; iii) NF1 belongs to WNT_UP.V1_UP [134]: therefore, a pro-proliferative experimental stimulus (due to the upregulation of WNT1) induces NF1 mRNA. If NF1 is actually upregulated, this means that WNT1 might be an upstream inducer or, at least, a worsening factor for BNPTP.
3.2.12. PTCH1
Patched 1 is a tumor suppressor, transmembrane protein and a receptor for the secreted molecule ‘sonic hedgehog’ that plays a role in the formation of embryonic structures and in tumorigenesis. PTCH1 acts as an inhibitor of the ‘smoothened’ protein, a G protein-coupled receptor [182]; when ‘sonic hedgehog’ binds PTCH1, smoothened is released and signals cell proliferation [183]. Interestingly, Gli1 regulates PTCH expression in a cell type-specific manner [184]. Mutations in PTCH1 cause Gorlin syndrome, basal cell carcinomas (BCC), nevoid basal cell carcinoma syndrome (NBCCS), medulloblastoma and rhabdomyosarcoma [185].
E2F3_UP.V1_UP [186] is a gene set containing genes up-regulated upon over-expression of E2F3 (OMIM ID: 600427) [187]; since in both cases (BNPTP and the experimental conditions tested for defining this gene set) we are in pro-cell growth conditions, we deem or that E2F3 is upstream of PTCH1, since its mRNA is also upregulated in BNPTP, or that E2F3 has the potential to worsen the phenotype of these patients.
3.2.13. PTPN11
Tyrosine-protein phosphatase non-receptor type 11 is an intracellular enzyme that is widely expressed in human tissues and is particularly abundant in heart, brain, and skeletal muscle. It is involved in mitogenic activation, metabolic control, transcription regulation, and cell migration. Dominant mutations of this gene can cause Noonan syndrome [188], LEOPARD syndrome [189], juvenile myelomonocytic leukemia [190], and metachondromatosis [191]. PTPN11 mutations, although at low frequency, are also found in several other human cancers [192]. These data suggest that PTPN11 is a proto-oncogene; however, a recent report shows that it may also act as a tumor suppressor, at least in hepatocellular carcinoma [193].
We found a match between a gene set, ATM_ DN.V1_DN [181], generated in pro-growth conditions (silencing of the tumor suppressor ATM (OMIM ID: 607585)), and PTPN1, which is included in the list because of an activating mutation, with a conflict DOWN/UP between gene set and gene. An analogous situation happens for the gene set P53_DN.V2_DN [181], where the silencing of TP53 down-regulates a number of genes, and among them PTPN11. Considering that ATM phosphorylates and activates TP53 [194], a general pathway based on these genes is the following: ATM ↓ TP53 ↓ PTPN11 ↓. If the pediatric/teen BC data (PTPN1 UP) were confirmed, this might suggest that PTPN11 activation in BNPTP is independent of this tumor suppressor signaling pathway. The possibility to regulate the upstream levels of either or both these tumor suppressors for counteracting the activation of PTPN11 looks hardly applicable in medicine, since it would involve “tampering” with tumor suppressors.
3.2.14. SMARCB1
SWI/SNF-related matrix-associated actin-dependent regulator of chromatin subfamily B member 1 (SMARCB1) is a chromatin remodeling factor. It is a subunit of the SWI/SNF ATP-dependent chromatin-remodeling complex whose function is relieving repressed chromatin state and promote gene expression. It is a tumor suppressor that is frequently deleted in pediatric/teen malignant rhabdoid tumors (MRT) [195]. Mutations in this gene were also identified in i) choroid plexus carcinomas, ii) a subset of central primitive neuroectodermal tumors and medulloblastomas [196], iii) schwannomatosis 1 and iv) meningiomas [197]. Its loss of function in MRT-derived cells causes polyploidy and chromosomal instability, a condition that can be reverted upon its re-expression [198]. Interestingly, it has been also demonstrated that SMARCB1 is able to drive the expression of Gli proteins, by acting as a negative regulator; thus, it influences the Gli-Hh signaling pathway (see above) [199].
In the presence of inactivation of the Snf5 tumor suppressor (OMIM ID: 601607), i.e., of the experimental conditions that allowed defining the gene set SNF5_DN.V1_DN [126], SMARCB1 is down-regulated; however, since SMARCB1 and Snf5 are just synonymous, it is expected that the mRNA levels of a knocked out gene drop. On the side of BNPTP, SMARCB1 is DOWN, at the level of gene deletions, and this gene alteration is quite important (5 cases are reported in Table 2). Notably, out of 189 gene sets tested, only one, which is defined by experimentally targeting this gene, is able to lower the expression of SMARCB1 mRNA; this suggests that the oncogenicity of SMARCB1 does not depend on nor is modulated from cancer-related upstream events that are collected in the OSMSD.
3.2.15. TP53
Tumor protein p53 (TP53) is a tumor suppressor gene and the most frequently mutated gene (up to 50%) in human cancer [200]. Despite its name, derived by its molecular weight, it is now known that the TP53 gene may encode at least 12 different protein isoforms, ranging from 28 to 53 kDa [201]. TP53 encodes proteins that bind to DNA and regulate gene expression to prevent mutations of the genome [202]. It has been defined “guardian of the genome”, as it plays important roles in apoptosis, angiogenesis, genomic stability, miRNA processing, cell cycle control, aging, induced pluripotent stem cell generation; its protein isoforms are regulated by phosphorylation, ubiquitination, acetylation, methylation, through the miRNA targeting of its transcripts, and by the interaction with other proteins.
This gene is only hit by the gene set P53_DN.V2_UP [181], where the silencing of TP53 induces the upregulation of the TP53 mRNA, possibly because the cells used try to compensate for this knockdown. However, the not fully understood reason for this gene set outcome, the fact that it is hard to make this type of “circular” inferences (the targeted gene in the gene set is also one of the differentially expressed genes), and the observation that the behavior of TP53 in BNPTP is somehow ambiguous (Table 4), make this case, in our opinion, completely undefined.
3.2.16. VIM
Vimentin (VIM) is a type III intermediate filament whose main function is the localization and anchoring of the organelles in fixed positions inside the cytosol [203]; in the form of a secreted phosphorilated homodimer, it plays a role also in the immune response [204]. Typically, VIM is expressed in mesenchimal tissues, and for this reason it is frequently used as a specific marker for mesenchimally-derived tissues and for their transformed counterparts, i.e., sarcomas.
VIM belongs to PTEN_DN.V1_DN [205], which means that when the tumor suppressor PTEN (OMIM ID: 601728) is silenced (pro-growth condition) VIM is downregulated. However, the VIM protein is actually upregulated in BNPTP, thus providing evidence for an upstream event that might reduce its level of activation, but in pro-growth conditions. Such data allow making several hypotheses: i) this upregulation might not be a key event in pediatric/teen BC, ii) there is a specificity in BNPTP with respect to this gene, iii) the upstream event (silencing of PTEN) is a possible control mechanism for the upregulation of VIM, but would require to be very finely tuned. Also WNT_UP.V1_DN [134], generated in pro-growth conditions (upregulation of WNT1) is hit by VIM. The discrepancy between the gene set (DOWN) and gene (UP) polarity allows making some hypotheses, ranging from the possibility to evaluate the use of this event as an upstream regulator of VIM, which is made complicated by the nature of the possible action (upregulation of an oncogene) to simply assuming that VIM has an independent behavior with respect to this tumor progression pathway. Finally, VIM hits P53_DN.V1_DN (a gene set based on mutant p53 and, as such, identified in samples that are in pro-proliferative conditions) [21]. However, in this gene set VIM is DOWN at the mRNA level, so we have another case of DOWN/UP conflict between gene set and gene; this outcome suggests that in pediatric/teen bladder cancers VIM is regulated in a p53-independent way.
3.2.17. WT1
Wilms tumor protein 1 (WT1) is a transcription factor and plays a central role in the normal development of the urogenital system. WT1 acts both as a tumor suppressor and an oncogene, according to the splice form involved. It causes an embryonic kidney malignancy, namely the Wilms’ tumor; some Authors proposed that this neoplastic transformation is mediated by abnormally persistent renal stem cells (nephrogenic rests), which retain embryonic differentiation potential [206].
This gene is only hit by gene sets (namely, ATF2_ S_UP.V1_DN, ESC_V6.5_UP_EARLY.V1_UP and LEF1_ UP.V1_UP) that we have decided not to include in this analysis, since they do not meet the quality standards defined for the gene set selection. Readers interested in learning more about possible upstream events for this gene, whose protein is upregulated in BNPTP, can especially refer to the last two, since they share the same polarity (i.e., UP) of WT1 in BNPTP.
4. DISCUSSION
There is no particular reason to hypothesize that rare diseases in general and, more specifically, rare types or subtypes of cancer, have a different level of complexity when compared with more common diseases [207, 208]. Intriguingly, personalized medicine is rather showing that even common pathologies (e.g. cancers with the highest morbidity) are a collection of rare genomic diseases [209]. However, there is a clear and remarkable difference between common and rare diseases: the former are usually the subjects of strong research efforts, which generate abundant data and useful knowledge, while investigations performed and financial resources invested for the latter are much less, sometimes negligible. Data available for infrequent pathologies are sparse and often based on single cases, which are treated by physicians living in different countries and, as such, are hardly seen as a whole [210, 211]. Additionally, the level of knowledge transmission is generally insufficient [212] and many physicians and researchers that directly treat or investigate these cases lack the training for properly performing multi-step data analyses similar to those presented in this paper or deal with “knowledge barriers”, which may have many causes [213]. These facts make much more challenging to find effective strategies for fighting rare diseases, in particular when it comes to the contextualization (i.e., the enhancement of our understanding of a biological object X, taking into consideration known biological factors, conditions, and mechanisms that are in some relationship with X) of the gene alterations found in individual patients. Therefore, every computational or methodological approach that rigorously connects and leverages on the existing information is a welcome addition to the literature.
The goal of this paper is dual: on the one side to understand the aggregate properties of genes that have been described as altered in BNPTP, using GO-based methods, and on the other side i) to suggest a possible etiology for the gene alterations found or ii) to determine oncological mechanisms that regulate/deregulate/act upstream of the same genes. The shortage of data available made this goal hard to achieve for several reasons. First of all, in most cases only one patient is linked to a specific gene deregulation, thus the data collected so far would greatly benefit of additional reports, possibly obtained using similar methods, in order to confirm these gene roles. Moreover, the classification of these tumor samples is not always straightforward; for example, the gene SMARCB1 was described both in pure and malignant rhabdoid tumors, but the Authors of these papers (see Table 2) do not specify if these two tumors should be regarded as two different subtypes or not. In general, classification issues may help to explain why i) the same tumor is or is not positive for the same gene, and ii) different research groups characterized the same tumor based on different markers (see, for example, [15] and [45]). The identified genes are heterogeneous not only because there are biological differences among distinct tumor types/subtypes, but also because the techniques used by different research groups are different and methods have been dramatically improving (for example, the research of Stratton et al. [38] was published when DNA microarrays did not exist).
We decided to pursue a GO approach for the following reasons: 1) GO-based methods rely on categorical data analysis and this allows statistically assessing which biological themes are relevant despite the level of gene heterogeneity; 2) we were looking for biological processes that could be identified without any bias due to the analyst’s knowledge about this subject; 3) the article published by Hoadley et al. about the Pan-Cancer-12 collection [214] shows that the organ involved in a malignancy often determines a distinct genomics signature, and we were interested in understanding which biological factors join the tumors listed in Table 1. Notably, looking at the 21 genes of BNPTP independently shows a strong predominance of proliferative genes; however, this approach fails to detect a number of biological processes, which are associated with statistically significant GO-BP p-values and may be involved as well in this cancer onset. Since we are aware that some of these p-values are overly optimistic and may be driven by the limited number (i.e., 21) of genes available, we used a semantic selection process, which reduced the most important GO-BPs to 26. Looking at the semantic network of these 26 GO categories, we found that the interplay between genes involved in differentiation/development and regulatory pathways may be crucial: in particular, the role of Rac signal transduction, of the cytoskeleton and of response mechanisms to abiotic stimuli deserve to be investigated further. The fact that the analyzed genes are ontologically grouped into two relatively coherent subgraphs suggests that each of them may represent a main route of cancer development in these young patients. Focusing on the left subgraph of Fig. 1, there are no clear clues about why most of its GO terms showed up. However, the specific nature and behavior of pediatric/teen BC [2] might partially explain this outcome. In particular, it is tempting to envisage that alterations during the urogenital development may influence the normal homeostasis of bladder cells in young patients, ultimately leading to the neoplastic transformation. Indeed, there seems to be a specific age threshold dividing pediatric/teenage and adult bladder patients, set at around 19 years of age [2, 17]. Therefore, a reasonable hypothesis is that the transformation relies on the left subgraph of GO-BP terms, while the GO categories of the right subgraph are more related to abnormal cell growth and cancer development. As in every similar analysis, the GO categories found in this network can be better understood looking at the biological features of the genes that belong to each GO term (see Tables 3 and S1). Indeed, in an extremely simplified way, the 21 genes found in BNPTP can be grouped into four classes, based on their potential activity: i) CD34, WT1, ACTA2, and VIM may play heterogeneous roles with respect to cellular differentiation; ii) Gli1, Gli3, PTCH1, SMARCB1, MYF5, and MyoD1 may specifically affect muscle (one of the two main tissues of the bladder) cell differentiation; iii) KRT20, Muc1, and NCAM1 may specifically affect the epithelial (the other main tissue of this organ) differentiation; iv) ALK, CDKN2A, RAS proteins, NF1, PTPN11, and TP53 may drive and/or contribute to this carcinogenesis with complex and multifaceted modalities. To better understand the divide between pre-adults and adults, genes involved in adult bladder cancer should be analyzed with GO algorithms identical or equivalent to those used in this paper, looking for differences and similarities in the GO terms retrieved.
As for the gene set analysis, we have been exploiting the knowledge produced by GSEA and related methods and the information stored in the Molecular Signatures Database because: a) GSEA, PAGE, GLAPA, ASSESS and similar methods show that it is statistically beneficial aggregating tens or hundreds of genes and analyzing them as a whole, for robustness [21-24]; b) results previously obtained applying gene set-based methods prove that it is effective and useful making inferences on biomedical samples through statistical tests where the hypotheses that sets of genes act as biological “cliques” are based on experiments performed on heterogeneous biological models, both in vitro and in vivo; c) gene set information has a precise directionality and polarity (an experimental stimulus induces a set of genes and represses another set of genes) and all the genes belonging to a gene set are “weighted” in the same way; d) the presence of a gene in a gene set is associated with a probability (calculated as (# genes in the gene set) / (# genes in the genome)) that, even in the most unfavorable case (for NFE2L2.V2, which is the largest gene set of OSMSD), is well below 5% (i.e., p-value < 0.05) and usually is (much) lower; e) the Molecular Signatures Database collects and annotates gene sets of oncological relevance and makes these data publicly available for analyses and meta-analyses [21]. The hit matrix of BNPTP has many types of information, some of good and some of insufficient biological quality (evaluated in terms of compatibility between type of gene set experiment and biological status of these patients), as it is expected by a broad-spectrum analysis like this. However, the well-defined 34 cases that we comment in this paper as hits supported by some type of biological evidence (either concordant or discordant, in terms of compatibility between pro- and anti- growth background, with what found in altered genes of BNPTP), allowed us to formulate novel hypotheses about the involvement of some (proto)oncogenes and (putative) tumor suppressors; hopefully, this list of candidate genes will stimulate more biological and clinical research on bladder cancer in pre-adult patients. The case of ACTA2 is quite compelling, since its status in BNPTP is in disagreement with all the indications provided by our gene set analysis; therefore, this is the case of a meta-analysis that hypothesizes the redefinition of a gene role. Redefinitions and reassessments are not uncommon outcomes of meta-analyses; for instance, the aforementioned paper by Hoadley et al. allowed reevaluating the subtype definition of breast cancer samples, showing that luminal and HER2 (i.e., ERBB2/HER2) subtypes can effectively be joined into a unique group, from a genomics standpoint [214].
CONCLUSION
In adults, more than 50% of muscle invasive BC (MIBC) samples harbor mutations in the gene TP53, which is the major gene player of BC [28]. Instead, our PubMed searches found only one patient out of 25 examined (i.e., 4%) with an involvement of TP53 (Table 2) and the results concerning this gene obtained through our computational analyses are inconclusive/undefined. The case of this 18 year old male is also quite ambiguous, since he had two alterations with apparently opposite effects (namely, an early stop codon with, likely, a loss of function, and an overexpression, probably dependent on the other allele (see the Results section)). Remarkably, TP53 may be either inactivated or upregulated in adult BC samples [28], yet this usually does not happen in the same patient [28]. Additionally, the oncogene FGFR3 (OMIM ID: 134934), which is the second most mutated gene in adult BC (found upregulated in up to 80% of non-MIBC and 40% of MIBC [28]) to the best of our knowledge has never been found mutated in BNPTP, even when mutations of this gene were specifically looked for [17]. Consequently, the two main genes involved in BC formation in adults seem to be less important in BNPTP. Notably, our results allowed identifying two genes potentially involved in BC of pediatric and teen patients, namely CTIP and WNT1, which are not established BC markers in adults. More specifically, a PubMed search using “CTIP bladder” does not find any relevant paper (as to mid-June, 2015), while a search based on the same phrase with common web search engines allows retrieving only three articles: i) one analyzing CTIP variants in MIBC, mostly in the framework of DNA damage signaling and repair, which did not find any significant association between carriage of the called variants and overall survival [215], ii) one showing the cell cycle-specific expression of CTIP and its interaction with BRCA1 in a BC cell line [216], which is consistent with our analyses about CD34 (see the paragraph about this gene in the Results), and iii) one false-positive result due to the fact that the Authors (working on NIH 3T3 cells) were using as a reference the previous paper [217]. A similar PubMed search was performed for WNT1. In this second case we were able to retrieve two papers: a) one investigating the relationship between WNT1 and BC, but in an indirect and purely associative way (involving the gene TERE1, whose locus is indeed related to BC) [218], and b) one even more indirect discussing Wnt and Fgf genes and reporting the association between a cluster of Fgf genes and BC [219]. Based on these query outcomes, the involvement of CTIP and WNT1 in the signaling pathways of BNPTP, if confirmed experimentally, would be a novelty in the genetic landscape of urothelium transformation.
Our analyses allowed identifying seven other genes potentially involved in BNPTP and whose presence was somehow more expected, since their role in adult BC is supported by the literature. These genes are: 1) ERBB2 [220, 221], 2) CCND1 [222], 3) YAP1 [223, 224], 4) BRCA1 [225, 226], 5) RB1 [227, 228], 6) RBL2/p130 [229, 230], and 7) E2F3 [231]. An analysis of the expression patterns and mechanisms of these seven genes in adults compared (as much as possible) with BNPTP is omitted, because it is beyond the scope of this article. Altogether, our results and the literature suggest that some BC genes are likely active in an age-dependent fashion while others are shared between pre-adults and adults; this would explain the observed differences in the formation, development and behavior of BC in these two broad age groups [2]. Some of our results may be especially divergent from the outcomes of adults also because children have BC types/subtypes that are extremely rare in adults (for example, RMS or rhabdoid tumors) [232].
It is our belief that contextualization methods are among the most powerful tools for making gene therapy, personalized medicine and advanced medical approaches [233-235] available also to BNPTP and, more in general, to patients with rare diseases. We anticipate that some hypotheses described in this article may not be confirmed experimentally; however, several mechanisms and genes that are listed in the Results section are novel and warrant future research for precisely defining their role in BNPTP. Additionally, the set of supplementary data and the key steps for using them (see the Materials and Methods section) allow anyone who is interested in this subject to formulate more hypotheses, possibly expanding the grid of analyzed cases beyond what we have already done. In the light of the recent production of genomics data about BC in adults [236] and of the differential BC responsiveness to therapy based on genomics subtypes [237], it would be very valuable to connect and compare as much as possible pediatric/teen and adult cases extensively and at a molecular level. It is our intention to continue investigating these bladder malignancies using ad hoc computational methods, which aim to fill the gap of knowledge between pre-adults and adults and to propose computationally-derived therapeutic strategies.
SUPPLEMENTARY MATERIAL
Supplementary material is available on the publishers Web site along with the published article.
ACKNOWLEDGEMENTS
AP is grateful to the Lineberger Comprehensive Cancer Center (LCCC) of UNC-Chapel Hill and to the laboratory of Dr. Chad Pecot for the continuous support received during the final stages of preparation of this manuscript.
LIST OF ABBREVIATIONS
- BC
Bladder cancer
- BNPTP
Bladder neoplasms in pediatric and teen patients
- GO
Gene ontology
- OMIM
Online mendelian inheritance in man
CONFLICT OF INTEREST
The authors confirm that this article content has no conflicts of interest.
REFERENCES
- 1.National Cancer Institute (NCI) http://www.cancer.gov . [(Accessed February 19,2015)].
- 2.Vallasciani S., Marrocco G., Gulia C., Zangari A., Piergentili R. 2015. Bladder Cancer in Pediatric Patients. [DOI] [PubMed] [Google Scholar]
- 3.Lott S., Lopez-Beltran A., Montironi R., MacLennan G.T., Cheng L. Soft tissue tumors of the urinary bladder Part II: malignant neoplasms. Hum. Pathol. 2007;38(7):963–977. doi: 10.1016/j.humpath.2007.03.016. [DOI] [PubMed] [Google Scholar]
- 4.Merguerian P.A., Cartwright L., Khoury A.E. Genitourinary rhabdomyosarcoma and other bladder tumors. In: Docimo SG, Canning DA, Khoury A.E., editors. The Kelalis–King–Belman Textbook of clinical pediatric urology. 2007. pp. 969–998. [Google Scholar]
- 5.Javadpour N., Mostofi F.K. Primary epithelial tumors of the bladder in the first two decades of life. J. Urol. 1969;101(5):706–710. doi: 10.1016/s0022-5347(17)62407-8. [DOI] [PubMed] [Google Scholar]
- 6.Lerena J., Krauel L., García-Aparicio L., Vallasciani S., Suñol M., Rodó J. Transitional cell carcinoma of the bladder in children and adolescents: six-case series and review of the literature. J. Pediatr. Urol. 2010;6(5):481–485. doi: 10.1016/j.jpurol.2009.11.006. [DOI] [PubMed] [Google Scholar]
- 7.Dénes F.T., Duarte R.J., Cristófani L.M., Lopes R.I. Pediatric Genitourinary Oncology. Front. Pediatr. 2013;1(48) doi: 10.3389/fped.2013.00048. eCollection 2013. [DOI] [PMC free article] [PubMed] [Google Scholar]
- 8.Pedersen-Bjergaard J., Jønsson V., Pedersen M., Hou-Jensen K. Leiomyosarcoma of the urinary bladder after cyclophosphamide. J. Clin. Oncol. 1995;13(2):532–533. doi: 10.1200/JCO.1995.13.2.532. [DOI] [PubMed] [Google Scholar]
- 9.Siefker-Radtke A. Urachal adenocarcinoma: a clinician’s guide for treatment. Semin. Oncol. 2012;39(5):619–624. doi: 10.1053/j.seminoncol.2012.08.011. [DOI] [PubMed] [Google Scholar]
- 10.Nielsen K., Nielsen K.K. Adenocarcinoma in exstrophy of the bladder--the last case in Scandinavia? A case report and review of literature. J. Urol. 1983;130(6):1180–1182. doi: 10.1016/s0022-5347(17)51744-9. [DOI] [PubMed] [Google Scholar]
- 11.Houben C.H., Chan A., Lee K.H., Tam Y.H., To K.F., Cheng W., Yeung C.K. Inflammatory myofibroblastic tumor of the bladder in children: what can be expected? Pediatr. Surg. Int. 2007;23(8):815–819. doi: 10.1007/s00383-007-1885-y. [DOI] [PubMed] [Google Scholar]
- 12.Young R.H., Scully R.E. Nephrogenic adenoma. A report of 15 cases, review of the literature, and comparison with clear cell adenocarcinoma of the urinary tract. Am. J. Surg. Pathol. 1986;10(4):268–275. doi: 10.1097/00000478-198604000-00005. [DOI] [PubMed] [Google Scholar]
- 13.Yin L., Bu H., Chen M., Yu J., Zhuang H., Chen J., Zhang H. Perivascular epithelioid cell neoplasm of the urinary bladder in an adolescent: a case report and review of the literature. Diagn. Pathol. 2012;7:183. doi: 10.1186/1746-1596-7-183. [DOI] [PMC free article] [PubMed] [Google Scholar]
- 14.Ciftci A.O., Tanyel F.C., Senocak M.E., Büyükpamukçu N. Pheochromocytoma in children. J. Pediatr. Surg. 2001;36(3):447–452. doi: 10.1053/jpsu.2001.21612. [DOI] [PubMed] [Google Scholar]
- 15.Warren K.S., Oxley J., Koupparis A. Pure malignant rhabdoid tumour of the bladder. Can. Urol. Assoc. J. 2014;8(3-4):E260–E262. doi: 10.5489/cuaj.1633. [DOI] [PMC free article] [PubMed] [Google Scholar]
- 16.Paner G.P., Zehnder P., Amin A.M., Husain A.N., Desai M.M. Urothelial neoplasms of the urinary bladder occurring in young adult and pediatric patients: a comprehensive review of literature with implications for patient management. Adv. Anat. Pathol. 2011;18(1):79–89. doi: 10.1097/PAP.0b013e318204c0cf. [DOI] [PubMed] [Google Scholar]
- 17.Wild P.J., Giedl J., Stoehr R., Junker K., Boehm S., van Oers J.M., Zwarthoff E.C., Blaszyk H., Fine S.W., Humphrey P.A., Dehner L.P., Amin M.B., Epstein J.I., Hartmann A. Genomic aberrations are rare in urothelial neoplasms of patients 19 years or younger. J. Pathol. 2007;211(1):18–25. doi: 10.1002/path.2075. [DOI] [PubMed] [Google Scholar]
- 18.Gene Ontology Consortium Gene Ontology Consortium: going forward. Nucleic Acids Res. 2015;43(Database issue):D1049–D1056. doi: 10.1093/nar/gku1179. [DOI] [PMC free article] [PubMed] [Google Scholar]
- 19.Harris M.A. Developing an ontology. Methods Mol. Biol. 2008;452:111–124. doi: 10.1007/978-1-60327-159-2_5. [DOI] [PubMed] [Google Scholar]
- 20.Ashburner M., Ball C.A., Blake J.A., Botstein D., Butler H., Cherry J.M., Davis A.P., Dolinski K., Dwight S.S., Eppig J.T., Harris M.A., Hill D.P., Issel-Tarver L., Kasarskis A., Lewis S., Matese J.C., Richardson J.E., Ringwald M., Rubin G.M., Sherlock G., The Gene Ontology Consortium Gene ontology: tool for the unification of biology. Nat. Genet. 2000;25(1):25–29. doi: 10.1038/75556. [DOI] [PMC free article] [PubMed] [Google Scholar]
- 21.Subramanian A., Tamayo P., Mootha V.K., Mukherjee S., Ebert B.L., Gillette M.A., Paulovich A., Pomeroy S.L., Golub T.R., Lander E.S., Mesirov J.P. Gene set enrichment analysis: a knowledge-based approach for interpreting genome-wide expression profiles. Proc. Natl. Acad. Sci. USA. 2005;102(43):15545–15550. doi: 10.1073/pnas.0506580102. [DOI] [PMC free article] [PubMed] [Google Scholar]
- 22.Kim S.Y., Volsky D.J. PAGE: parametric analysis of gene set enrichment. BMC Bioinformatics. 2005;6:144. doi: 10.1186/1471-2105-6-144. [DOI] [PMC free article] [PubMed] [Google Scholar]
- 23.Edelman E., Porrello A., Guinney J., Balakumaran B., Bild A., Febbo P.G., Mukherjee S. Analysis of sample set enrichment scores: assaying the enrichment of sets of genes for individual samples in genome-wide expression profiles. Bioinformatics. 2006;22(14):e108–e116. doi: 10.1093/bioinformatics/btl231. [DOI] [PubMed] [Google Scholar]
- 24.Maglietta R., Piepoli A., Catalano D., Licciulli F., Carella M., Liuni S., Pesole G., Perri F., Ancona N. Statistical assessment of functional categories of genes deregulated in pathological conditions by using microarray data. Bioinformatics. 2007;23(16):2063–2072. doi: 10.1093/bioinformatics/btm289. [DOI] [PubMed] [Google Scholar]
- 25.Nucera C., Porrello A., Antonello Z.A., Mekel M., Nehs M.A., Giordano T.J., Gerald D., Benjamin L.E., Priolo C., Puxeddu E., Finn S., Jarzab B., Hodin R.A., Pontecorvi A., Nose V., Lawler J., Parangi S. B-Raf(V600E) and thrombospondin-1 promote thyroid cancer progression. Proc. Natl. Acad. Sci. USA. 2010;107(23):10649–10654. doi: 10.1073/pnas.1004934107. [DOI] [PMC free article] [PubMed] [Google Scholar]
- 26.Cai B., Jiang X. Revealing Biological Pathways Implicated in Lung Cancer from TCGA Gene Expression Data Using Gene Set Enrichment Analysis. Cancer Inform. 2014;13(Suppl. 1):113–121. doi: 10.4137/CIN.S13882. [DOI] [PMC free article] [PubMed] [Google Scholar]
- 27.Barbieri E., De Preter K., Capasso M., Johansson P., Man T.K., Chen Z., Stowers P., Tonini G.P., Speleman F., Shohet J.M. A p53 drug response signature identifies prognostic genes in high-risk neuroblastoma. PLoS One. 2013;8(11):e79843. doi: 10.1371/journal.pone.0079843. [DOI] [PMC free article] [PubMed] [Google Scholar]
- 28.Knowles M.A., Hurst C.D. Molecular biology of bladder cancer: new insights into pathogenesis and clinical diversity. Nat. Rev. Cancer. 2015;15(1):25–41. doi: 10.1038/nrc3817. [DOI] [PubMed] [Google Scholar]
- 29.Scott A.A., Stanley W., Worsham G.F., Kirkland T.A., Jr, Gansler T., Garvin A.J. Aggressive bladder carcinoma in an adolescent. Report of a case with immunohistochemical, cytogenetic, and flow cytometric characterization. Am. J. Surg. Pathol. 1989;13(12):1057–1063. doi: 10.1097/00000478-198912000-00008. [DOI] [PubMed] [Google Scholar]
- 30.Dako Company web site product information. http://www.dako.com/it/ar38/p103710/prod_products.htm . [(Accessed February 12, 2015)].
- 31.Williamson D., Missiaglia E., de Reyniès A., Pierron G., Thuille B., Palenzuela G., Thway K., Orbach D., Laé M., Fréneaux P., Pritchard-Jones K., Oberlin O., Shipley J., Delattre O. Fusion gene-negative alveolar rhabdomyosarcoma is clinically and molecularly indistinguishable from embryonal rhabdomyosarcoma. J. Clin. Oncol. 2010;28(13):2151–2158. doi: 10.1200/JCO.2009.26.3814. [DOI] [PubMed] [Google Scholar]
- 32.Zibat A., Missiaglia E., Rosenberger A., Pritchard-Jones K., Shipley J., Hahn H., Fulda S. Activation of the hedgehog pathway confers a poor prognosis in embryonal and fusion gene-negative alveolar rhabdomyosarcoma. Oncogene. 2010;29(48):6323–6330. doi: 10.1038/onc.2010.368. [DOI] [PubMed] [Google Scholar]
- 33.Skapek S.X., Anderson J., Barr F.G., Bridge J.A., Gastier-Foster J.M., Parham D.M., Rudzinski E.R., Triche T., Hawkins D.S. PAX-FOXO1 fusion status drives unfavorable outcome for children with rhabdomyosarcoma: a children’s oncology group report. Pediatr. Blood Cancer. 2013;60(9):1411–1417. doi: 10.1002/pbc.24532. [DOI] [PMC free article] [PubMed] [Google Scholar]
- 34.Oguzkan S., Terzi Y.K., Güler E., Derbent M., Agras P.I., Saatci U., Ayter S. Two neurofibromatosis type 1 cases associated with rhabdomyosarcoma of bladder, one with a large deletion in the NF1 gene. Cancer Genet. Cytogenet. 2006;164(2):159–163. doi: 10.1016/j.cancergencyto.2005.08.004. [DOI] [PubMed] [Google Scholar]
- 35.Agras P.I., Baskin E., Sakallioglu A.E., Arda I.S., Ayter S., Oguzkan S., Derbent M., Alehan F., Hicsonmez A., Saatci U. Neurofibromatosis--Noonan’s syndrome with associated rhabdomyosarcoma of the urinary bladder in an infant: case report. J. Child Neurol. 2003;18(1):68–72. doi: 10.1177/08830738030180011601. [DOI] [PubMed] [Google Scholar]
- 36.Montgomery E.A., Shuster D.D., Burkart A.L., Esteban J.M., Sgrignoli A., Elwood L., Vaughn D.J., Griffin C.A., Epstein J.I. Inflammatory myofibroblastic tumors of the urinary tract: a clinicopathologic study of 46 cases, including a malignant example inflammatory fibrosarcoma and a subset associated with high-grade urothelial carcinoma. Am. J. Surg. Pathol. 2006;30(12):1502–1512. doi: 10.1097/01.pas.0000213280.35413.1b. [DOI] [PubMed] [Google Scholar]
- 37.Franceschini P., Licata D., Di Cara G., Guala A., Bianchi M., Ingrosso G., Franceschini D. Bladder carcinoma in Costello syndrome: report on a patient born to consanguineous parents and review. Am. J. Med. Genet. 1999;86(2):174–179. doi: 10.1002/(SICI)1096-8628(19990910)86:2<174::AID-AJMG17>3.0.CO;2-Y. [DOI] [PubMed] [Google Scholar]
- 38.Stratton M.R., Fisher C., Gusterson B.A., Cooper C.S. Detection of point mutations in N-ras and K-ras genes of human embryonal rhabdomyosarcomas using oligonucleotide probes and the polymerase chain reaction. Cancer Res. 1989;49(22):6324–6327. [PubMed] [Google Scholar]
- 39.Urakami S., Igawa M., Shiina H., Shigeno K., Kikuno N., Yoshino T. Recurrent transitional cell carcinoma in a child with the Costello syndrome. J. Urol. 2002;168(3):1133–1134. doi: 10.1016/S0022-5347(05)64609-5. [DOI] [PubMed] [Google Scholar]
- 40.Martinelli S., McDowell H.P., Vigne S.D., Kokai G., Uccini S., Tartaglia M., Dominici C. RAS signaling dysregulation in human embryonal Rhabdomyosarcoma. Genes Chromosomes Cancer. 2009;48(11):975–982. doi: 10.1002/gcc.20702. [DOI] [PubMed] [Google Scholar]
- 41.Sirintrapun S.J., Ward M., Woo J., Cimic A. High-stage urachal adenocarcinoma can be associated with microsatellite instability and KRAS mutations. Hum. Pathol. 2014;45(2):327–330. doi: 10.1016/j.humpath.2013.09.008. [DOI] [PubMed] [Google Scholar]
- 42.Savage N., Linn D., McDonough C., Donohoe J.M., Franco A., Reuter V., Biddinger P.W., Eaton K.W., Biegel J.A., Sharma S. Molecularly confirmed primary malignant rhabdoid tumor of the urinary bladder: implications of accurate diagnosis. Ann. Diagn. Pathol. 2012;16(6):504–507. doi: 10.1016/j.anndiagpath.2011.04.008. [DOI] [PMC free article] [PubMed] [Google Scholar]
- 43.Bourdeaut F., Fréneaux P., Thuille B., Bergeron C., Laurence V., Brugières L., Vérité C., Michon J., Delattre O., Orbach D. Extra-renal non-cerebral rhabdoid tumours. Pediatr. Blood Cancer. 2008;51(3):363–368. doi: 10.1002/pbc.21632. [DOI] [PubMed] [Google Scholar]
- 44.Eaton K.W., Tooke L.S., Wainwright L.M., Judkins A.R., Biegel J.A. Spectrum of SMARCB1/INI1 mutations in familial and sporadic rhabdoid tumors. Pediatr. Blood Cancer. 2011;56(1):7–15. doi: 10.1002/pbc.22831. [DOI] [PMC free article] [PubMed] [Google Scholar]
- 45.Duvdevani M., Nass D., Neumann Y., Leibovitch I., Ramon J., Mor Y. Pure rhabdoid tumor of the bladder. J. Urol. 2001;166(6):2337. doi: 10.1016/S0022-5347(05)65582-6. [DOI] [PubMed] [Google Scholar]
- 46.Klauschen F., Andreeff M., Keilholz U., Dietel M., Stenzinger A. The combinatorial complexity of cancer precision medicine. Oncoscience. 2014;1(7):504–509. doi: 10.18632/oncoscience.66. [DOI] [PMC free article] [PubMed] [Google Scholar]
- 47.The OncoTherapy Network. http://www.oncotherapynetwork.com/conference-report/basket-design-novel-approach-cancer-clinical-trials . [(Accessed April 30, 2015)].
- 48.Hosack D.A., Dennis G., Jr, Sherman B.T., Lane H.C., Lempicki R.A. Identifying biological themes within lists of genes with EASE. Genome Biol. 2003;4(10):R70. doi: 10.1186/gb-2003-4-10-r70. [DOI] [PMC free article] [PubMed] [Google Scholar]
- 49.Huang W., Sherman B.T., Lempicki R.A. Systematic and integrative analysis of large gene lists using DAVID bioinformatics resources. Nat. Protoc. 2009;4(1):44–57. doi: 10.1038/nprot.2008.211. [DOI] [PubMed] [Google Scholar]
- 50.Supek F., Bošnjak M., Škunca N., Šmuc T. REVIGO summarizes and visualizes long lists of gene ontology terms. PLoS One. 2011;6(7):e21800. doi: 10.1371/journal.pone.0021800. [DOI] [PMC free article] [PubMed] [Google Scholar]
- 51.Smoot M.E., Ono K., Ruscheinski J., Wang P.L., Ideker T. Cytoscape 2.8: new features for data integration and network visualization. Bioinformatics. 2011;27(3):431–432. doi: 10.1093/bioinformatics/btq675. [DOI] [PMC free article] [PubMed] [Google Scholar]
- 52.Pesquita C., Faria D., Falcão A.O., Lord P., Couto F.M. Semantic similarity in biomedical ontologies. PLOS Comput. Biol. 2009;5(7):e1000443. doi: 10.1371/journal.pcbi.1000443. [DOI] [PMC free article] [PubMed] [Google Scholar]
- 53.Barrell D., Dimmer E., Huntley R.P., Binns D., O’Donovan C., Apweiler R. The GOA database in 2009--an integrated Gene Ontology Annotation resource. Nucleic Acids Res. 2009;37(Database issue):D396–D403. doi: 10.1093/nar/gkn803. [DOI] [PMC free article] [PubMed] [Google Scholar]
- 54.Huntley R.P., Sawford T., Mutowo-Meullenet P., Shypitsyna A., Bonilla C., Martin M.J., O’Donovan C. The GOA database: gene Ontology annotation updates for 2015. Nucleic Acids Res. 2015;43(Database issue):D1057–D1063. doi: 10.1093/nar/gku1113. [DOI] [PMC free article] [PubMed] [Google Scholar]
- 55.The MathWorks Company. http://www.mathworks.com .
- 56.Barbacid M. ras genes. Annu. Rev. Biochem. 1987;56:779–827. doi: 10.1146/annurev.bi.56.070187.004023. [DOI] [PubMed] [Google Scholar]
- 57.Prior I.A., Lewis P.D., Mattos C. A comprehensive survey of Ras mutations in cancer. Cancer Res. 2012;72(10):2457–2467. doi: 10.1158/0008-5472.CAN-11-2612. [DOI] [PMC free article] [PubMed] [Google Scholar]
- 58.Cohen A.S., Tuysuz B., Shen Y., Bhalla S.K., Jones S.J., Gibson W.T. A novel mutation in EED associated with overgrowth. J. Hum. Genet. 2015;60(6):339–342. doi: 10.1038/jhg.2015.26. [DOI] [PubMed] [Google Scholar]
- 59.van Oijen M.G., Slootweg P.J. Gain-of-function mutations in the tumor suppressor gene p53. Clin. Cancer Res. 2000;6(6):2138–2145. [PubMed] [Google Scholar]
- 60.Oren M., Rotter V. Mutant p53 gain-of-function in cancer. Cold Spring Harb. Perspect. Biol. 2010;2(2):a001107. doi: 10.1101/cshperspect.a001107. [DOI] [PMC free article] [PubMed] [Google Scholar]
- 61.Ochs M.F., Peterson A.J., Kossenkov A., Bidaut G. Incorporation of gene ontology annotations to enhance microarray data analysis. Methods Mol. Biol. 2007;377:243–254. doi: 10.1007/978-1-59745-390-5_15. [DOI] [PubMed] [Google Scholar]
- 62.Chen M., Wang K., Zhang L., Li C., Yang Y. The discovery of putative urine markers for the specific detection of prostate tumor by integrative mining of public genomic profiles. PLoS One. 2011;6(12):e28552. doi: 10.1371/journal.pone.0028552. [DOI] [PMC free article] [PubMed] [Google Scholar]
- 63.Tukey J.W. Exploratory data analysis, Pearson. 1st ed. Addison-Wesley; 1977. [Google Scholar]
- 64.Forbes S.A., Bindal N., Bamford S., Cole C., Kok C.Y., Beare D., Jia M., Shepherd R., Leung K., Menzies A., Teague J.W., Campbell P.J., Stratton M.R., Futreal P.A. COSMIC: mining complete cancer genomes in the Catalogue of Somatic Mutations in Cancer. Nucleic Acids Res. 2011;39(Database issue):D945–D950. doi: 10.1093/nar/gkq929. [DOI] [PMC free article] [PubMed] [Google Scholar]
- 65.Di Pierro G.B., Gulia C., Cristini C., Fraietta G., Marini L., Grande P., Gentile V., Piergentili R. Bladder cancer: a simple model becomes complex. Curr. Genomics. 2012;13(5):395–415. doi: 10.2174/138920212801619232. [DOI] [PMC free article] [PubMed] [Google Scholar]
- 66.Pollard C., Smith S.C., Theodorescu D. Molecular genesis of non-muscle-invasive urothelial carcinoma (NMIUC). Expert Rev. Mol. Med. 2010;12:e10. doi: 10.1017/S1462399410001407. [DOI] [PMC free article] [PubMed] [Google Scholar]
- 67.Wheeler M.A., Ayyagari R.R., Wheeler G.L., Weiss R.M. Regulation of cyclic nucleotides in the urinary tract. J. Smooth Muscle Res. 2005;41(1):1–21. doi: 10.1540/jsmr.41.1. [DOI] [PubMed] [Google Scholar]
- 68.The ATCC biological resource center. http://www.atcc.org/Products/All/CRL-1472.aspx . [(Accessed February 25, 2015)].
- 69.Piazza G.A., Thompson W.J., Pamukcu R., Alila H.W., Whitehead C.M., Liu L., Fetter J.R., Gresh W.E., Jr, Klein-Szanto A.J., Farnell D.R., Eto I., Grubbs C.J. Exisulind, a novel proapoptotic drug, inhibits rat urinary bladder tumorigenesis. Cancer Res. 2001;61(10):3961–3968. [PubMed] [Google Scholar]
- 70.Mountzios G., Dimopoulos M.A., Bamias A., Papadopoulos G., Kastritis E., Syrigos K., Pavlakis G., Terpos E. Abnormal bone remodeling process is due to an imbalance in the receptor activator of nuclear factor-kappaB ligand (RANKL)/osteoprotegerin (OPG) axis in patients with solid tumors metastatic to the skeleton. Acta Oncol. 2007;46(2):221–229. doi: 10.1080/02841860600635870. [DOI] [PubMed] [Google Scholar]
- 71.Sinha S., Mondal G., Hwang E.J., Han W., Dutta S.K., Iyer S., Karumanchi S.A., Kim K.I., Couch F.J., Mukhopadhyay D. Von Hippel-Lindau gene product directs cytokinesis: a new tumor suppressor function. J. Cell Sci. 2011;124(Pt 13):2132–2142. doi: 10.1242/jcs.087122. [DOI] [PMC free article] [PubMed] [Google Scholar]
- 72.Lind G.E., Raiborg C., Danielsen S.A., Rognum T.O., Thiis-Evensen E., Hoff G., Nesbakken A., Stenmark H., Lothe R.A. SPG20, a novel biomarker for early detection of colorectal cancer, encodes a regulator of cytokinesis. Oncogene. 2011;30(37):3967–3978. doi: 10.1038/onc.2011.109. [DOI] [PMC free article] [PubMed] [Google Scholar]
- 73.Roversi G., Pfundt R., Moroni R.F., Magnani I., van Reijmersdal S., Pollo B., Straatman H., Larizza L., Schoenmakers E.F. Identification of novel genomic markers related to progression to glioblastoma through genomic profiling of 25 primary glioma cell lines. Oncogene. 2006;25(10):1571–1583. doi: 10.1038/sj.onc.1209177. [DOI] [PubMed] [Google Scholar]
- 74.Lacroix B., Maddox A.S. Cytokinesis, ploidy and aneuploidy. J. Pathol. 2012;226(2):338–351. doi: 10.1002/path.3013. [DOI] [PubMed] [Google Scholar]
- 75.Normand G., King R.W. Understanding cytokinesis failure. Adv. Exp. Med. Biol. 2010;676:27–55. doi: 10.1007/978-1-4419-6199-0_3. [DOI] [PMC free article] [PubMed] [Google Scholar]
- 76.Krause S., Feil G., Beiter T., Pressler H., Schrott K.M., Bichler K.H. Examination of tumorigenesis of precursor lesions in bladder cancer by in situ hybridization. Urol. Int. 2004;72(2):118–122. doi: 10.1159/000075964. [DOI] [PubMed] [Google Scholar]
- 77.Li J.J., Li S.A. Mitotic kinases: the key to duplication, segregation, and cytokinesis errors, chromosomal instability, and oncogenesis. Pharmacol. Ther. 2006;111(3):974–984. doi: 10.1016/j.pharmthera.2006.02.006. [DOI] [PubMed] [Google Scholar]
- 78.Jiang F., Caraway N.P., Sabichi A.L., Zhang H.Z., Ruitrok A., Grossman H.B., Gu J., Lerner S.P., Lippman S., Katz R.L. Centrosomal abnormality is common in and a potential biomarker for bladder cancer. Int. J. Cancer. 2003;106(5):661–665. doi: 10.1002/ijc.11251. [DOI] [PubMed] [Google Scholar]
- 79.Yamamoto Y., Eguchi S., Junpei A., Nagao K., Sakano S., Furuya T., Oga A., Kawauchi S., Sasaki K., Matsuyama H. Intercellular centrosome number is correlated with the copy number of chromosomes in bladder cancer. Cancer Genet. Cytogenet. 2009;191(1):38–42. doi: 10.1016/j.cancergencyto.2009.01.012. [DOI] [PubMed] [Google Scholar]
- 80.Giansanti M.G., Sechi S., Frappaolo A., Belloni G., Piergentili R. Cytokinesis in Drosophila male meiosis. Spermatogenesis. 2012;2(3):185–196. doi: 10.4161/spmg.21711. [DOI] [PMC free article] [PubMed] [Google Scholar]
- 81.Lapasset L., Milhavet O., Prieur A., Besnard E., Babled A., Aït-Hamou N., Leschik J., Pellestor F., Ramirez J.M., De Vos J., Lehmann S., Lemaitre J.M. Rejuvenating senescent and centenarian human cells by reprogramming through the pluripotent state. Genes Dev. 2011;25(21):2248–2253. doi: 10.1101/gad.173922.111. [DOI] [PMC free article] [PubMed] [Google Scholar]
- 82.Kim Y., Jeong J., Kang H., Lim J., Heo J., Ratajczak J., Ratajczak M.Z., Shin D.M. The molecular nature of very small embryonic-like stem cells in adult tissues. Int. J. Stem Cells. 2014;7(2):55–62. doi: 10.15283/ijsc.2014.7.2.55. [DOI] [PMC free article] [PubMed] [Google Scholar]
- 83.The European Bioinformatics Institute. http://www.ebi.ac.uk/QuickGO/ [(Accessed January 12, 2015)].
- 84.Clairambault J. In: Mathematical Oncology. New York: Springer ; 2014. Deterministic Mathematical Modelling for Cancer Chronotherapeutics: Cell Population Dynamics and Treatment Optimization. pp. 265–294. [Google Scholar]
- 85.Liu Z., Chu G. Chronobiology in mammalian health. Mol. Biol. Rep. 2013;40(3):2491–2501. doi: 10.1007/s11033-012-2330-4. [DOI] [PubMed] [Google Scholar]
- 86.Joseph D., Chong N.W., Shanks M.E., Rosato E., Taub N.A., Petersen S.A., Symonds M.E., Whitehouse W.P., Wailoo M. Getting rhythm: how do babies do it? Arch. Dis. Child. Fetal Neonatal Ed. 2015;100(1):F50–F54. doi: 10.1136/archdischild-2014-306104. [DOI] [PubMed] [Google Scholar]
- 87.Horiguchi M., Koyanagi S., Hamdan A.M., Kakimoto K., Matsunaga N., Yamashita C., Ohdo S. Rhythmic control of the ARF-MDM2 pathway by ATF4 underlies circadian accumulation of p53 in malignant cells. Cancer Res. 2013;73(8):2639–2649. doi: 10.1158/0008-5472.CAN-12-2492. [DOI] [PubMed] [Google Scholar]
- 88.Jung-Hynes B., Ahmad N. SIRT1 controls circadian clock circuitry and promotes cell survival: a connection with age-related neoplasms. FASEB J. 2009;23(9):2803–2809. doi: 10.1096/fj.09-129148. [DOI] [PMC free article] [PubMed] [Google Scholar]
- 89.Wiechmann A.F., Sherry D.M. Role of melatonin and its receptors in the vertebrate retina. Int. Rev. Cell Mol. Biol. 2013;300:211–242. doi: 10.1016/B978-0-12-405210-9.00006-0. [DOI] [PubMed] [Google Scholar]
- 90.Xin Z., Jiang S., Jiang P., Yan X., Fan C., Di S., Wu G., Yang Y., Reiter R.J., Ji G. Melatonin as a treatment for gastrointestinal cancer: a review. J. Pineal Res. 2015;58(4):375–387. doi: 10.1111/jpi.12227. [DOI] [PubMed] [Google Scholar]
- 91.Hill S.M., Belancio V.P., Dauchy R.T., Xiang S., Brimer S., Mao L., Hauch A., Lundberg P.W., Summers W., Yuan L., Frasch T., Blask D.E. Melatonin: an inhibitor of breast cancer. Endocr. Relat. Cancer. 2015;22(3):R183–R204. doi: 10.1530/ERC-15-0030. [DOI] [PMC free article] [PubMed] [Google Scholar]
- 92.Pandi-Perumal S.R., Trakht I., Srinivasan V., Spence D.W., Maestroni G.J., Zisapel N., Cardinali D.P. Physiological effects of melatonin: role of melatonin receptors and signal transduction pathways. Prog. Neurobiol. 2008;85(3):335–353. doi: 10.1016/j.pneurobio.2008.04.001. [DOI] [PubMed] [Google Scholar]
- 93.Belancio V.P., Blask D.E., Deininger P., Hill S.M., Jazwinski S.M. The aging clock and circadian control of metabolism and genome stability. Front. Genet. 2014;5:455. doi: 10.3389/fgene.2014.00455. [DOI] [PMC free article] [PubMed] [Google Scholar]
- 94.Sánchez-Hidalgo M., Guerrero J.M., Villegas I., Packham G., de la Lastra C.A. Melatonin, a natural programmed cell death inducer in cancer. Curr. Med. Chem. 2012;19(22):3805–3821. doi: 10.2174/092986712801661013. [DOI] [PubMed] [Google Scholar]
- 95.Parent M.É., El-Zein M., Rousseau M.C., Pintos J., Siemiatycki J. Night work and the risk of cancer among men. Am. J. Epidemiol. 2012;176(9):751–759. doi: 10.1093/aje/kws318. [DOI] [PubMed] [Google Scholar]
- 96.Letašiová S., Medve’ová A., Šovčíková A., Dušinská M., Volkovová K., Mosoiu C., Bartonová A. Bladder cancer, a review of the environmental risk factors. Environ. Health. 2012;11(Suppl. 1):S11. doi: 10.1186/1476-069X-11-S1-S11. [DOI] [PMC free article] [PubMed] [Google Scholar]
- 97.Shariat S.F., Milowsky M., Droller M.J. Bladder cancer in the elderly. Urol. Oncol. 2009;27(6):653–667. doi: 10.1016/j.urolonc.2009.07.020. [DOI] [PMC free article] [PubMed] [Google Scholar]
- 98.Guo D.-C., Pannu H., Tran-Fadulu V., Papke C.L., Yu R.K., Avidan N., Bourgeois S., Estrera A.L., Safi H.J., Sparks E., Amor D., Ades L., McConnell V., Willoughby C.E., Abuelo D., Willing M., Lewis R.A., Kim D.H., Scherer S., Tung P.P., Ahn C., Buja L.M., Raman C.S., Shete S.S., Milewicz D.M. Mutations in smooth muscle alpha-actin (ACTA2) lead to tho-racic aortic aneurysms and dissections. Nature Genet. 2007;39:1488–1493. doi: 10.1038/ng.2007.6. [DOI] [PubMed] [Google Scholar]; Erratum. Nature Genet. 2007;40:255. only. [Google Scholar]
- 99.Lee H.W., Park Y.M., Lee S.J., Cho H.J., Kim D.H., Lee J.I., Kang M.S., Seol H.J., Shim Y.M., Nam D.H., Kim H.H., Joo K.M. Alpha-smooth muscle actin (ACTA2) is required for metastatic potential of human lung adenocarcinoma. Clin. Cancer Res. 2013;19(21):5879–5889. doi: 10.1158/1078-0432.CCR-13-1181. [DOI] [PubMed] [Google Scholar]
- 100.Tomaskovic-Crook E., Thompson E.W., Thiery J.P. Epithelial to mesenchymal transition and breast cancer. Breast Cancer Res. 2009;11(6):213. doi: 10.1186/bcr2416. [DOI] [PMC free article] [PubMed] [Google Scholar]
- 101.Okamoto-Inoue M., Nakayama J., Hori Y., Taniguchi S. Human malignant melanoma cells release a factor that inhibits the expression of smooth muscle alpha-actin. J. Dermatol. Sci. 2000;23(3):170–177. doi: 10.1016/S0923-1811(00)00072-4. [DOI] [PubMed] [Google Scholar]
- 102.Wiederschain D., Chen L., Johnson B., Bettano K., Jackson D., Taraszka J., Wang Y.K., Jones M.D., Morrissey M., Deeds J., Mosher R., Fordjour P., Lengauer C., Benson J.D. Contribution of polycomb homologues Bmi-1 and Mel-18 to medulloblastoma pathogenesis. Mol. Cell. Biol. 2007;27(13):4968–4979. doi: 10.1128/MCB.02244-06. [DOI] [PMC free article] [PubMed] [Google Scholar]
- 103.Faber J., Krivtsov A.V., Stubbs M.C., Wright R., Davis T.N., van den Heuvel-Eibrink M., Zwaan C.M., Kung A.L., Armstrong S.A. HOXA9 is required for survival in human MLL-rearranged acute leukemias. Blood. 2009;113(11):2375–2385. doi: 10.1182/blood-2007-09-113597. [DOI] [PMC free article] [PubMed] [Google Scholar]
- 104.Lawrence H.J., Christensen J., Fong S., Hu Y.L., Weissman I., Sauvageau G., Humphries R.K., Largman C. Loss of expression of the Hoxa-9 homeobox gene impairs the proliferation and repopulating ability of hematopoietic stem cells. Blood. 2005;106(12):3988–3994. doi: 10.1182/blood-2005-05-2003. [DOI] [PMC free article] [PubMed] [Google Scholar]
- 105.Bhatlekar S., Fields J.Z., Boman B.M. HOX genes and their role in the development of human cancers. J. Mol. Med. 2014;92(8):811–823. doi: 10.1007/s00109-014-1181-y. [DOI] [PubMed] [Google Scholar]
- 106.Scholl C., Fröhling S., Dunn I.F., Schinzel A.C., Barbie D.A., Kim S.Y., Silver S.J., Tamayo P., Wadlow R.C., Ramaswamy S., Döhner K., Bullinger L., Sandy P., Boehm J.S., Root D.E., Jacks T., Hahn W.C., Gilliland D.G. Synthetic lethal interaction between oncogenic KRAS dependency and STK33 suppression in human cancer cells. Cell. 2009;137(5):821–834. doi: 10.1016/j.cell.2009.03.017. [DOI] [PubMed] [Google Scholar]
- 107.Babij C., Zhang Y., Kurzeja R.J., Munzli A., Shehabeldin A., Fernando M., Quon K., Kassner P.D., Ruefli-Brasse A.A., Watson V.J., Fajardo F., Jackson A., Zondlo J., Sun Y., Ellison A.R., Plewa C.A., San M.T., Robinson J., McCarter J., Schwandner R., Judd T., Carnahan J., Dussault I. STK33 kinase activity is nonessential in KRAS-dependent cancer cells. Cancer Res. 2011;71(17):5818–5826. doi: 10.1158/0008-5472.CAN-11-0778. [DOI] [PubMed] [Google Scholar]
- 108.Luo T., Masson K., Jaffe J.D., Silkworth W., Ross N.T., Scherer C.A., Scholl C., Fröhling S., Carr S.A., Stern A.M., Schreiber S.L., Golub T.R. STK33 kinase inhibitor BRD-8899 has no effect on KRAS-dependent cancer cell viability. Proc. Natl. Acad. Sci. USA. 2012;109(8):2860–2865. doi: 10.1073/pnas.1120589109. [DOI] [PMC free article] [PubMed] [Google Scholar]
- 109.Azoitei N., Hoffmann C.M., Ellegast J.M., Ball C.R., Obermayer K., Gößele U., Koch B., Faber K., Genze F., Schrader M., Kestler H.A., Döhner H., Chiosis G., Glimm H., Fröhling S., Scholl C. Targeting of KRAS mutant tumors by HSP90 inhibitors involves degradation of STK33. J. Exp. Med. 2012;209(4):697–711. doi: 10.1084/jem.20111910. [DOI] [PMC free article] [PubMed] [Google Scholar]
- 110.Roskoski R., Jr Anaplastic lymphoma kinase (ALK): structure, oncogenic activation, and pharmacological inhibition. Pharmacol. Res. 2013;68(1):68–94. doi: 10.1016/j.phrs.2012.11.007. [DOI] [PubMed] [Google Scholar]
- 111.Lara M.F., García-Escudero R., Ruiz S., Santos M., Moral M., Martínez-Cruz A.B., Segrelles C., Lorz C., Paramio J.M. Gene profiling approaches help to define the specific functions of retinoblastoma family in epidermis. Mol. Carcinog. 2008;47(3):209–221. doi: 10.1002/mc.20376. [DOI] [PubMed] [Google Scholar]
- 112.Goodrich D.W. The retinoblastoma tumor-suppressor gene, the exception that proves the rule. Oncogene. 2006;25(38):5233–5243. doi: 10.1038/sj.onc.1209616. [DOI] [PMC free article] [PubMed] [Google Scholar]
- 113.Mayol X., Graña X., Baldi A., Sang N., Hu Q., Giordano A. Cloning of a new member of the retinoblastoma gene family (pRb2) which binds to the E1A transforming domain. Oncogene. 1993;8(9):2561–2566. [PubMed] [Google Scholar]
- 114.Atlas of Genetics and Cytogenetics in Oncology and Haema-tology. . http://atlasgeneticsoncology.org/Genes/RBL2ID443.html . [(Accessed April 4, 2015)].
- 115.Di Fiore R., D’Anneo A., Tesoriere G., Vento R. RB1 in cancer: different mechanisms of RB1 inactivation and alterations of pRb pathway in tumorigenesis. J. Cell. Physiol. 2013;228(8):1676–1687. doi: 10.1002/jcp.24329. [DOI] [PubMed] [Google Scholar]
- 116.Lamb J., Ramaswamy S., Ford H.L., Contreras B., Martinez R.V., Kittrell F.S., Zahnow C.A., Patterson N., Golub T.R., Ewen M.E. A mechanism of cyclin D1 action encoded in the patterns of gene expression in human cancer. Cell. 2003;114(3):323–334. doi: 10.1016/S0092-8674(03)00570-1. [DOI] [PubMed] [Google Scholar]
- 117.Nielsen J.S., McNagny K.M. Novel functions of the CD34 family. J. Cell Sci. 2008;121(Pt 22):3683–3692. doi: 10.1242/jcs.037507. [DOI] [PubMed] [Google Scholar]
- 118.Furuta S., Wang J.M., Wei S., Jeng Y.M., Jiang X., Gu B., Chen P.L., Lee E.Y., Lee W.H. Removal of BRCA1/CtIP/ZBRK1 repressor complex on ANG1 promoter leads to accelerated mammary tumor growth contributed by prominent vasculature. Cancer Cell. 2006;10(1):13–24. doi: 10.1016/j.ccr.2006.05.022. [DOI] [PubMed] [Google Scholar]
- 119.Yu X., Baer R. Nuclear localization and cell cycle-specific expression of CtIP, a protein that associates with the BRCA1 tumor suppressor. J. Biol. Chem. 2000;275(24):18541–18549. doi: 10.1074/jbc.M909494199. [DOI] [PubMed] [Google Scholar]
- 120.Barbie D.A., Tamayo P., Boehm J.S., Kim S.Y., Moody S.E., Dunn I.F., Schinzel A.C., Sandy P., Meylan E., Scholl C., Fröhling S., Chan E.M., Sos M.L., Michel K., Mermel C., Silver S.J., Weir B.A., Reiling J.H., Sheng Q., Gupta P.B., Wadlow R.C., Le H., Hoersch S., Wittner B.S., Ramaswamy S., Livingston D.M., Sabatini D.M., Meyerson M., Thomas R.K., Lander E.S., Mesirov J.P., Root D.E., Gilliland D.G., Jacks T., Hahn W.C. Systematic RNA interference reveals that oncogenic KRAS-driven cancers require TBK1. Nature. 2009;462(7269):108–112. doi: 10.1038/nature08460. [DOI] [PMC free article] [PubMed] [Google Scholar]
- 121.Robertson K.D., Jones P.A. Tissue-specific alternative splicing in the human INK4a/ARF cell cycle regulatory locus. Oncogene. 1999;18(26):3810–3820. doi: 10.1038/sj.onc.1202737. [DOI] [PubMed] [Google Scholar]
- 122.Lin Y-C., Diccianni M.B., Kim Y., Lin H-H., Lee C-H., Lin R-J., Joo S.H., Li J., Chuang T-J., Yang A-S., Kuo H-H., Tsai M-D., Yu A.L. Human p16gamma, a novel transcriptional variant of p16(INK4A), coexpresses with p16(INK4A) in cancer cells and inhibits cell-cycle progression. Oncogene. 2007;26(49):7017–7027. doi: 10.1038/sj.onc.1210507. [DOI] [PubMed] [Google Scholar]
- 123.Stott F.J., Bates S., James M.C., McConnell B.B., Starborg M., Brookes S., Palmero I., Ryan K., Hara E., Vousden K.H., Peters G. The alternative product from the human CDKN2A locus, p14(ARF), participates in a regulatory feedback loop with p53 and MDM2. EMBO J. 1998;17(17):5001–5014. doi: 10.1093/emboj/17.17.5001. [DOI] [PMC free article] [PubMed] [Google Scholar]
- 124.Jabłonowski Z., Reszka E., Gromadzińska J., Wąsowicz W., Sosnowski M. Hypermethylation of p16 and DAPK promoter gene regions in patients with non-invasive urinary bladder cancer. Arch. Med. Sci. 2011;7(3):512–516. doi: 10.5114/aoms.2011.23421. [DOI] [PMC free article] [PubMed] [Google Scholar]
- 125.Chen D., Shan J., Zhu W-G., Qin J., Gu W. Transcription-independent ARF regulation in oncogenic stress-mediated p53 responses. Nature. 2010;464(7288):624–627. doi: 10.1038/nature08820. [DOI] [PMC free article] [PubMed] [Google Scholar]
- 126.Isakoff M.S., Sansam C.G., Tamayo P., Subramanian A., Evans J.A., Fillmore C.M., Wang X., Biegel J.A., Pomeroy S.L., Mesirov J.P., Roberts C.W. Inactivation of the Snf5 tumor suppressor stimulates cell cycle progression and cooperates with p53 loss in oncogenic transformation. Proc. Natl. Acad. Sci. USA. 2005;102(49):17745–17750. doi: 10.1073/pnas.0509014102. [DOI] [PMC free article] [PubMed] [Google Scholar]
- 127.Ruiz i Altaba A. Gli proteins encode context-dependent positive and negative functions: implications for development and disease. Development. 1999;126(14):3205–3216. doi: 10.1242/dev.126.14.3205. [DOI] [PubMed] [Google Scholar]
- 128.Kinzler K.W., Bigner S.H., Bigner D.D., Trent J.M., Law M.L., O’Brien S.J., Wong A.J., Vogelstein B. Identification of an amplified, highly expressed gene in a human glioma. Science. 1987;236(4797):70–73. doi: 10.1126/science.3563490. [DOI] [PubMed] [Google Scholar]
- 129.Liu C.Z., Yang J.T., Yoon J.W., Villavicencio E., Pfendler K., Walterhouse D., Iannaccone P. Characterization of the promoter region and genomic organization of GLI, a member of the Sonic hedgehog-Patched signaling pathway. Gene. 1998;209(1-2):1–11. doi: 10.1016/S0378-1119(97)00668-9. [DOI] [PubMed] [Google Scholar]
- 130.Dahmane N., Lee J., Robins P., Heller P., Ruiz i Altaba A. Activation of the transcription factor Gli1 and the Sonic hedgehog signalling pathway in skin tumours. Nature. 1997;389(6653):876–881. doi: 10.1038/39918. [DOI] [PubMed] [Google Scholar]
- 131.McDermott A., Gustafsson M., Elsam T., Hui C.C., Emerson C.P., Jr, Borycki A.G. Gli2 and Gli3 have redundant and context-dependent function in skeletal muscle formation. Development. 2005;132(2):345–357. doi: 10.1242/dev.01537. [DOI] [PubMed] [Google Scholar]
- 132.National Center for Biotechnology Information. GLI3, GLI family zinc finger 3 [Homo sapiens (human)]. . http://www.ncbi.nlm.nih.gov/gene?Db=gene&Cmd=ShowDetailView&TermToSearch=2737 . [Accessed April 24, 2015].
- 133.Jacob J., Briscoe J. Gli proteins and the control of spinal-cord patterning. EMBO Rep. 2003;4(8):761–765. doi: 10.1038/sj.embor.embor896. [DOI] [PMC free article] [PubMed] [Google Scholar]
- 134.Ziegler S., Röhrs S., Tickenbrock L., Möröy T., Klein-Hitpass L., Vetter I.R., Müller O. Novel target genes of the Wnt pathway and statistical insights into Wnt target promoter regulation. FEBS J. 2005;272(7):1600–1615. doi: 10.1111/j.1742-4658.2005.04581.x. [DOI] [PubMed] [Google Scholar]
- 135.Röhrs S., Kutzner N., Vlad A., Grunwald T., Ziegler S., Müller O. Chronological expression of Wnt target genes Ccnd1, Myc, Cdkn1a, Tfrc, Plf1 and Ramp3. Cell Biol. Int. 2009;33(4):501–508. doi: 10.1016/j.cellbi.2009.01.016. [DOI] [PubMed] [Google Scholar]
- 136.Lei Y.Y., Wang W.J., Mei J.H., Wang C.L. Mitogen-activated protein kinase signal transduction in solid tumors. Asian Pac. J. Cancer Prev. 2014;15(20):8539–8548. doi: 10.7314/APJCP.2014.15.20.8539. [DOI] [PubMed] [Google Scholar]
- 137.Sever R., Brugge J.S. Signal transduction in cancer. Cold Spring Harb. Perspect. Med. 2015;5(4):a006098. doi: 10.1101/cshperspect.a006098. [DOI] [PMC free article] [PubMed] [Google Scholar]
- 138.Downward J. Targeting RAS signalling pathways in cancer therapy. Nat. Rev. Cancer. 2003;3(1):11–22. doi: 10.1038/nrc969. [DOI] [PubMed] [Google Scholar]
- 139.Goyette M., Petropoulos C.J., Shank P.R., Fausto N. Expression of a cellular oncogene during liver regeneration. Science. 1983;219(4584):510–512. doi: 10.1126/science.6297003. [DOI] [PubMed] [Google Scholar]
- 140.Aoki Y., Niihori T., Kawame H., Kurosawa K., Ohashi H., Tanaka Y., Filocamo M., Kato K., Suzuki Y., Kure S., Matsubara Y. Germline mutations in HRAS proto-oncogene cause Costello syndrome. Nat. Genet. 2005;37(10):1038–1040. doi: 10.1038/ng1641. [DOI] [PubMed] [Google Scholar]
- 141.Carta C., Pantaleoni F., Bocchinfuso G., Stella L., Vasta I., Sarkozy A., Digilio C., Palleschi A., Pizzuti A., Grammatico P., Zampino G., Dallapiccola B., Gelb B.D., Tartaglia M. Germline missense mutations affecting KRAS Isoform B are associated with a severe Noonan syndrome phenotype. Am. J. Hum. Genet. 2006;79(1):129–135. doi: 10.1086/504394. [DOI] [PMC free article] [PubMed] [Google Scholar]
- 142.Kranenburg O. The KRAS oncogene: past, present, and future. Biochim. Biophys. Acta. 2005;(1756):81–82. doi: 10.1016/j.bbcan.2005.10.001. [DOI] [PubMed] [Google Scholar]
- 143.Matallanas D., Arozarena I., Berciano M.T., Aaronson D.S., Pellicer A., Lafarga M., Crespo P. Differences on the inhibitory specificities of H-Ras, K-Ras, and N-Ras (N17) dominant negative mutants are related to their membrane microlocalization. J. Biol. Chem. 2003;278(7):4572–4581. doi: 10.1074/jbc.M209807200. [DOI] [PubMed] [Google Scholar]
- 144.Cirstea I.C., Kutsche K., Dvorsky R., Gremer L., Carta C., Horn D., Roberts A.E., Lepri F., Merbitz-Zahradnik T., Konig R., Kratz C.P., Pantaleoni F., Dentici M.L., Joshi V.A., Kucherlapati R.S., Mazzanti L., Mundlos S., Patton M.A., Silengo M.C., Rossi C., Zampino G., Digilio C., Stuppia L., Seemanova E., Pennacchio L.A., Gelb B.D., Dallapiccola B., Wittinghofer A., Ahmadian M.R., Tartaglia M., Zenker M. A restricted spectrum of NRAS mutations cause Noonan syndrome. Nat. Genet. 2010;42:27–29. doi: 10.1038/ng.497. [DOI] [PMC free article] [PubMed] [Google Scholar]
- 145.Dessars B., De Raeve L.E., Morandini R., Lefort A., El Housni H., Ghanem G.E., Van den Eynde B.J., Ma W., Roseeuw D., Vassart G., Libert F., Heimann P. Genotypic and gene expression studies in congenital melanocytic nevi: insight into initial steps of melanotumorigenesis. J. Invest. Dermatol. 2009;129(1):139–147. doi: 10.1038/jid.2008.203. [DOI] [PubMed] [Google Scholar]
- 146.Creighton C.J., Hilger A.M., Murthy S., Rae J.M., Chinnaiyan A.M., El-Ashry D. Activation of mitogen-activated protein kinase in estrogen receptor alpha-positive breast cancer cells in vitro induces an in vivo molecular phenotype of estrogen receptor alpha-negative human breast tumors. Cancer Res. 2006;66(7):3903–3911. doi: 10.1158/0008-5472.CAN-05-4363. [DOI] [PubMed] [Google Scholar]
- 147.Zhang J., Smolen G.A., Haber D.A. Negative regulation of YAP by LATS1 underscores evolutionary conservation of the Drosophila Hippo pathway. Cancer Res. 2008;68(8):2789–2794. doi: 10.1158/0008-5472.CAN-07-6205. [DOI] [PubMed] [Google Scholar]
- 148.Overholtzer M., Zhang J., Smolen G.A., Muir B., Li W., Sgroi D.C., Deng C.X., Brugge J.S., Haber D.A. Transforming properties of YAP, a candidate oncogene on the chromosome 11q22 amplicon. Proc. Natl. Acad. Sci. USA. 2006;103(33):12405–12410. doi: 10.1073/pnas.0605579103. [DOI] [PMC free article] [PubMed] [Google Scholar]
- 149.Moll R., Schiller D.L., Franke W.W. Identification of protein IT of the intestinal cytoskeleton as a novel type I cytokeratin with unusual properties and expression patterns. J. Cell Biol. 1990;111(2):567–580. doi: 10.1083/jcb.111.2.567. [DOI] [PMC free article] [PubMed] [Google Scholar]
- 150.Jiang J., Ulbright T.M., Younger C., Sanchez K., Bostwick D.G., Koch M.O., Eble J.N., Cheng L. Cytokeratin 7 and cytokeratin 20 in primary urinary bladder carcinoma and matched lymph node metastasis. Arch. Pathol. Lab. Med. 2001;125(7):921–923. doi: 10.5858/2001-125-0921-CACIPU. [DOI] [PubMed] [Google Scholar]
- 151.Gene Set Enrichment Analysis (GSEA), Broad Institute: Gene Set KRAS.600.LUNG.BREAST_UP.V1_UP. http://www.broadinstitute.org/gsea/msigdb/geneset_page.jsp?geneSetName=KRAS.600.LUNG.BREAST_UP.V1_UP . [(Accessed February 15, 2015)].
- 152.Singh P.K., Hollingsworth M.A. Cell surface-associated mucins in signal transduction. Trends Cell Biol. 2006;16(9):467–476. doi: 10.1016/j.tcb.2006.07.006. [DOI] [PubMed] [Google Scholar]
- 153.Gendler S.J. MUC1, the renaissance molecule. J. Mammary Gland Biol. Neoplasia. 2001;6(3):339–353. doi: 10.1023/A:1011379725811. [DOI] [PubMed] [Google Scholar]
- 154.Hollingsworth M.A., Swanson B.J. Mucins in cancer: protection and control of the cell surface. Nat. Rev. Cancer. 2004;4(1):45–60. doi: 10.1038/nrc1251. [DOI] [PubMed] [Google Scholar]
- 155.Wei X., Xu H., Kufe D. Human MUC1 oncoprotein regulates p53-responsive gene transcription in the genotoxic stress response. Cancer Cell. 2005;7(2):167–178. doi: 10.1016/j.ccr.2005.01.008. [DOI] [PubMed] [Google Scholar]
- 156.Raina D., Kharbanda S., Kufe D. The MUC1 oncoprotein activates the anti-apoptotic phosphoinositide 3-kinase/Akt and Bcl-xL pathways in rat 3Y1 fibroblasts. J. Biol. Chem. 2004;279(20):20607–20612. doi: 10.1074/jbc.M310538200. [DOI] [PubMed] [Google Scholar]
- 157.Roy L.D., Sahraei M., Subramani D.B., Besmer D., Nath S., Tinder T.L., Bajaj E., Shanmugam K., Lee Y.Y., Hwang S.I., Gendler S.J., Mukherjee P. MUC1 enhances invasiveness of pancreatic cancer cells by inducing epithelial to mesenchymal transition. Oncogene. 2011;30(12):1449–1459. doi: 10.1038/onc.2010.526. [DOI] [PMC free article] [PubMed] [Google Scholar]
- 158.Ma Y., Croxton R., Moorer R.L., Jr, Cress W.D. Identification of novel E2F1-regulated genes by microarray. Arch. Biochem. Biophys. 2002;399(2):212–224. doi: 10.1006/abbi.2002.2761. [DOI] [PubMed] [Google Scholar]
- 159.Sabourin L.A., Rudnicki M.A. The molecular regulation of myogenesis. Clin. Genet. 2000;57(1):16–25. doi: 10.1034/j.1399-0004.2000.570103.x. [DOI] [PubMed] [Google Scholar]
- 160.Porrello A., Cerone M.A., Coen S., Gurtner A., Fontemaggi G., Cimino L., Piaggio G., Sacchi A., Soddu S. p53 regulates myogenesis by triggering the differentiation activity of pRb. J. Cell Biol. 2000;151(6):1295–1304. doi: 10.1083/jcb.151.6.1295. [DOI] [PMC free article] [PubMed] [Google Scholar]
- 161.Rajabi H.N., Takahashi C., Ewen M.E. Retinoblastoma protein and MyoD function together to effect the repression of Fra-1 and in turn cyclin D1 during terminal cell cycle arrest associated with myogenesis. J. Biol. Chem. 2014;289(34):23417–23427. doi: 10.1074/jbc.M113.532572. [DOI] [PMC free article] [PubMed] [Google Scholar]
- 162.Dohda T., Maljukova A., Liu L., Heyman M., Grandér D., Brodin D., Sangfelt O., Lendahl U. Notch signaling induces SKP2 expression and promotes reduction of p27Kip1 in T-cell acute lymphoblastic leukemia cell lines. Exp. Cell Res. 2007;313(14):3141–3152. doi: 10.1016/j.yexcr.2007.04.027. [DOI] [PubMed] [Google Scholar]
- 163.Lobry C., Oh P., Aifantis I. Oncogenic and tumor suppressor functions of Notch in cancer: it’s NOTCH what you think. J. Exp. Med. 2011;208(10):1931–1935. doi: 10.1084/jem.20111855. [DOI] [PMC free article] [PubMed] [Google Scholar]
- 164.Maraver A., Fernandez-Marcos P.J., Cash T.P., Mendez-Pertuz M., Dueñas M., Maietta P., Martinelli P., Muñoz-Martin M., Martínez-Fernández M., Cañamero M., Roncador G., Martinez-Torrecuadrada J.L., Grivas D., de la Pompa J.L., Valencia A., Paramio J.M., Real F.X., Serrano M. NOTCH pathway inactivation promotes bladder cancer progression. J. Clin. Invest. 2015;125(2):824–830. doi: 10.1172/JCI78185. [DOI] [PMC free article] [PubMed] [Google Scholar]
- 165.Rutishauser U., Acheson A., Hall A.K., Mann D.M., Sunshine J. The neural cell adhesion molecule (NCAM) as a regulator of cell-cell interactions. Science. 1988;240(4848):53–57. doi: 10.1126/science.3281256. [DOI] [PubMed] [Google Scholar]
- 166.Rønn L.C., Hartz B.P., Bock E. The neural cell adhesion molecule (NCAM) in development and plasticity of the nervous system. Exp. Gerontol. 1998;33(7-8):853–864. doi: 10.1016/S0531-5565(98)00040-0. [DOI] [PubMed] [Google Scholar]
- 167.Cunningham B.A., Hemperly J.J., Murray B.A., Prediger E.A., Brackenbury R., Edelman G.M. Neural cell adhesion molecule: structure, immunoglobulin-like domains, cell surface modulation, and alternative RNA splicing. Science. 1987;236(4803):799–806. doi: 10.1126/science.3576199. [DOI] [PubMed] [Google Scholar]
- 168.Zeromski J., Nyczak E., Dyszkiewicz W. Significance of cell adhesion molecules, CD56/NCAM in particular, in human tumor growth and spreading. Folia Histochem. Cytobiol. 2001;39(Suppl. 2):36–37. [PubMed] [Google Scholar]
- 169.Jensen M., Berthold F. Targeting the neural cell adhesion molecule in cancer. Cancer Lett. 2007;258(1):9–21. doi: 10.1016/j.canlet.2007.09.004. [DOI] [PubMed] [Google Scholar]
- 170.Stacchini A., Barreca A., Demurtas A., Aliberti S., di Celle P.F., Novero D. Flow cytometric detection and quantification of CD56 (neural cell adhesion molecule, NCAM) expression in diffuse large B cell lymphomas and review of the literature. Histopathology. 2012;60(3):452–459. doi: 10.1111/j.1365-2559.2011.04098.x. [DOI] [PubMed] [Google Scholar]
- 171.Gu M.J., Ha J.O. CD56 positive diffuse large B-cell lymphoma: a case report and literature review. Int. J. Clin. Exp. Pathol. 2013;6(12):3023–3025. [PMC free article] [PubMed] [Google Scholar]
- 172.Majumder P.K., Febbo P.G., Bikoff R., Berger R., Xue Q., McMahon L.M., Manola J., Brugarolas J., McDonnell T.J., Golub T.R., Loda M., Lane H.A., Sellers W.R. mTOR inhibition reverses Akt-dependent prostate intraepithelial neoplasia through regulation of apoptotic and HIF-1-dependent pathways. Nat. Med. 2004;10(6):594–601. doi: 10.1038/nm1052. [DOI] [PubMed] [Google Scholar]
- 173.Weledji E.P., Assob J.C. The ubiquitous neural cell adhesion molecule (N-CAM). Ann. Med. Surg. (Lond.) 2014;3(3):77–81. doi: 10.1016/j.amsu.2014.06.014. [DOI] [PMC free article] [PubMed] [Google Scholar]
- 174.Beevers C.S., Li F., Liu L., Huang S. Curcumin inhibits the mammalian target of rapamycin-mediated signaling pathways in cancer cells. Int. J. Cancer. 2006;119(4):757–764. doi: 10.1002/ijc.21932. [DOI] [PubMed] [Google Scholar]
- 175.Trovó-Marqui A.B., Tajara E.H. Neurofibromin: a general outlook. Clin. Genet. 2006;70(1):1–13. doi: 10.1111/j.1399-0004.2006.00639.x. [DOI] [PubMed] [Google Scholar]
- 176.Side L.E., Emanuel P.D., Taylor B., Franklin J., Thompson P., Castleberry R.P., Shannon K.M. Mutations of the NF1 gene in children with juvenile myelomonocytic leukemia without clinical evidence of neurofibromatosis, type 1. Blood. 1998;92(1):267–272. [PubMed] [Google Scholar]
- 177.Tassabehji M., Strachan T., Sharland M., Colley A., Donnai D., Harris R., Thakker N. Tandem duplication within a neurofibromatosis type 1 (NF1) gene exon in a family with features of Watson syndrome and Noonan syndrome. Am. J. Hum. Genet. 1993;53(1):90–95. [PMC free article] [PubMed] [Google Scholar]
- 178.Gutzmer R., Herbst R.A., Mommert S., Kiehl P., Matiaske F., Rütten A., Kapp A., Weiss J. Allelic loss at the neurofibromatosis type 1 (NF1) gene locus is frequent in desmoplastic neurotropic melanoma. Hum. Genet. 2000;107(4):357–361. doi: 10.1007/s004390000374. [DOI] [PubMed] [Google Scholar]
- 179.Cancer Genome Atlas Research Network. Comprehensive genomic characterization defines human glioblastoma genes and core pathways. Nature. 2013;455:1061–1068. doi: 10.1038/nature07385. [DOI] [PMC free article] [PubMed] [Google Scholar]; Erratum. Nature. 2013;494:506. only. [Google Scholar]
- 180.Cancer Genome Atlas Network Comprehensive molecular portraits of human breast tumours. Nature. 2012;490(7418):61–70. doi: 10.1038/nature11412. [DOI] [PMC free article] [PubMed] [Google Scholar]
- 181.Elkon R., Rashi-Elkeles S., Lerenthal Y., Linhart C., Tenne T., Amariglio N., Rechavi G., Shamir R., Shiloh Y. Dissection of a DNA-damage-induced transcriptional network using a combination of microarrays, RNA interference and computational promoter analysis. Genome Biol. 2005;6(5):R43. doi: 10.1186/gb-2005-6-5-r43. [DOI] [PMC free article] [PubMed] [Google Scholar]
- 182.Ruiz-Gómez A., Molnar C., Holguín H., Mayor F., Jr, de Celis J.F. The cell biology of Smo signalling and its relationships with GPCRs. Biochim. Biophys. Acta. 2007;1768(4):901–912. doi: 10.1016/j.bbamem.2006.09.020. [DOI] [PubMed] [Google Scholar]
- 183.Taipale J., Cooper M.K., Maiti T., Beachy P.A. Patched acts catalytically to suppress the activity of Smoothened. Nature. 2002;418:892–897. doi: 10.1038/nature00989. [DOI] [PubMed] [Google Scholar]; Erratum. Nature. 2002;420:455. only. [Google Scholar]
- 184.Nagao K., Toyoda M., Takeuchi-Inoue K., Fujii K., Yamada M., Miyashita T. Identification and characterization of multiple isoforms of a murine and human tumor suppressor, patched, having distinct first exons. Genomics. 2005;85(4):462–471. doi: 10.1016/j.ygeno.2004.11.014. [DOI] [PubMed] [Google Scholar]
- 185.Xie J., Bartels C.M., Barton S.W., Gu D. Targeting hedgehog signaling in cancer: research and clinical developments. Onco Targets Ther. 2013;6:1425–1435. doi: 10.2147/OTT.S34678. [DOI] [PMC free article] [PubMed] [Google Scholar]
- 186.Bild A.H., Yao G., Chang J.T., Wang Q., Potti A., Chasse D., Joshi M.B., Harpole D., Lancaster J.M., Berchuck A., Olson J.A., Jr, Marks J.R., Dressman H.K., West M., Nevins J.R. Oncogenic pathway signatures in human cancers as a guide to targeted therapies. Nature. 2006;439(7074):353–357. doi: 10.1038/nature04296. [DOI] [PubMed] [Google Scholar]
- 187.Atlas of Genetics and Cytogenetics in Oncology and Haema-tology: E2F3 (E2F transcription factor 3). . http://atlasgeneticsoncology.org/Genes/E2F3ID40384ch6p22.html . [(Accessed March 2, 2015)].
- 188.Tartaglia M., Mehler E.L., Goldberg R., Zampino G., Brunner H.G., Kremer H., van der Burgt I., Crosby A.H., Ion A., Jeffery S., Kalidas K., Patton M.A., Kucherlapati R.S., Gelb B.D. Mutations in PTPN11, encoding the protein tyrosine phosphatase SHP-2, cause Noonan syndrome. Nature Genet. 2001;29:465–468. doi: 10.1038/ng772. Erratum: Nature Genet., 2001, 29, 491 only; Nature Genet., 2002, 30, [DOI] [PubMed] [Google Scholar]
- 189.Digilio M.C., Conti E., Sarkozy A., Mingarelli R., Dottorini T., Marino B., Pizzuti A., Dallapiccola B. Grouping of multiple-lentigines/LEOPARD and Noonan syndromes on the PTPN11 gene. Am. J. Hum. Genet. 2002;71(2):389–394. doi: 10.1086/341528. [DOI] [PMC free article] [PubMed] [Google Scholar]
- 190.Tartaglia M., Niemeyer C.M., Fragale A., Song X., Buechner J., Jung A., Hählen K., Hasle H., Licht J.D., Gelb B.D. Somatic mutations in PTPN11 in juvenile myelomonocytic leukemia, myelodysplastic syndromes and acute myeloid leukemia. Nat. Genet. 2003;34(2):148–150. doi: 10.1038/ng1156. [DOI] [PubMed] [Google Scholar]
- 191.Sobreira N.L., Cirulli E.T., Avramopoulos D., Wohler E., Oswald G.L., Stevens E.L., Ge D., Shianna K.V., Smith J.P., Maia J.M., Gumbs C.E., Pevsner J., Thomas G., Valle D., Hoover-Fong J.E., Goldstein D.B. Whole-genome sequencing of a single proband together with linkage analysis identifies a Mendelian disease gene. PLoS Genet. 2010;6(6):e1000991. doi: 10.1371/journal.pgen.1000991. [DOI] [PMC free article] [PubMed] [Google Scholar]
- 192.Bentires-Alj M., Paez J.G., David F.S., Keilhack H., Halmos B., Naoki K., Maris J.M., Richardson A., Bardelli A., Sugarbaker D.J., Richards W.G., Du J., Girard L., Minna J.D., Loh M.L., Fisher D.E., Velculescu V.E., Vogelstein B., Meyerson M., Sellers W.R., Neel B.G. Activating mutations of the noonan syndrome-associated SHP2/PTPN11 gene in human solid tumors and adult acute myelogenous leukemia. Cancer Res. 2004;64(24):8816–8820. doi: 10.1158/0008-5472.CAN-04-1923. [DOI] [PubMed] [Google Scholar]
- 193.Bard-Chapeau E.A., Li S., Ding J., Zhang S.S., Zhu H.H., Princen F., Fang D.D., Han T., Bailly-Maitre B., Poli V., Varki N.M., Wang H., Feng G.S. Ptpn11/Shp2 acts as a tumor suppressor in hepatocellular carcinogenesis. Cancer Cell. 2011;19(5):629–639. doi: 10.1016/j.ccr.2011.03.023. [DOI] [PMC free article] [PubMed] [Google Scholar]
- 194.Dong H., Shi Q., Song X., Fu J., Hu L., Xu D., Su C., Xia X., Song E., Song Y. Polychlorinated biphenyl quinone induces oxidative DNA damage and repair responses: The activations of NHEJ, BER and NER via ATM-p53 signaling axis. . Toxicol. Appl. Pharmacol. 2015;286(1):10–6. doi: 10.1016/j.taap.2015.03.017. [DOI] [PubMed] [Google Scholar]
- 195.Versteege I., Sévenet N., Lange J., Rousseau-Merck M-F., Ambros P., Handgretinger R., Aurias A., Delattre O. Truncating mutations of hSNF5/INI1 in aggressive paediatric cancer. Nature. 1998;394(6689):203–206. doi: 10.1038/28212. [DOI] [PubMed] [Google Scholar]
- 196.Sévenet N., Lellouch-Tubiana A., Schofield D., Hoang-Xuan K., Gessler M., Birnbaum D., Jeanpierre C., Jouvet A., Delattre O. Spectrum of hSNF5/INI1 somatic mutations in human cancer and genotype-phenotype correlations. Hum. Mol. Genet. 1999;8(13):2359–2368. doi: 10.1093/hmg/8.13.2359. [DOI] [PubMed] [Google Scholar]
- 197.Christiaans I., Kenter S.B., Brink H.C., van Os T.A., Baas F., van den Munckhof P., Kidd A.M., Hulsebos T.J. Germline SMARCB1 mutation and somatic NF2 mutations in familial multiple meningiomas. J. Med. Genet. 2011;48(2):93–97. doi: 10.1136/jmg.2010.082420. [DOI] [PubMed] [Google Scholar]
- 198.Vries R.G., Bezrookove V., Zuijderduijn L.M., Kia S.K., Houweling A., Oruetxebarria I., Raap A.K., Verrijzer C.P. Cancer-associated mutations in chromatin remodeler hSNF5 promote chromosomal instability by compromising the mitotic checkpoint. Genes Dev. 2005;19(6):665–670. doi: 10.1101/gad.335805. [DOI] [PMC free article] [PubMed] [Google Scholar]
- 199.Jagani Z., Mora-Blanco E.L., Sansam C.G., McKenna E.S., Wilson B., Chen D., Klekota J., Tamayo P., Nguyen P.T., Tolstorukov M., Park P.J., Cho Y-J., Hsiao K., Buonamici S., Pomeroy S.L., Mesirov J.P., Ruffner H., Bouwmeester T., Luchansky S.J., Murtie J., Kelleher J.F., Warmuth M., Sellers W.R., Roberts C.W., Dorsch M. Loss of the tumor suppressor Snf5 leads to aberrant activation of the Hedgehog-Gli pathway. Nat. Med. 2010;16(12):1429–1433. doi: 10.1038/nm.2251. [DOI] [PMC free article] [PubMed] [Google Scholar]
- 200.Olivier M., Hollstein M., Hainaut P. TP53 mutations in human cancers: origins, consequences, and clinical use. Cold Spring Harb. Perspect. Biol. 2010;2(1):a001008. doi: 10.1101/cshperspect.a001008. [DOI] [PMC free article] [PubMed] [Google Scholar]
- 201.Surget S., Khoury M.P., Bourdon J.C. Uncovering the role of p53 splice variants in human malignancy: a clinical perspective. Onco Targets Ther. 2013;7:57–68. doi: 10.2147/OTT.S53876. [DOI] [PMC free article] [PubMed] [Google Scholar]
- 202.Levine A.J., Lane D.P. 2010. The p53 family: a subject collection from Cold Spring Harbor Perspectives in biology. [Google Scholar]
- 203.Katsumoto T., Mitsushima A., Kurimura T. The role of the vimentin intermediate filaments in rat 3Y1 cells elucidated by immunoelectron microscopy and computer-graphic reconstruction. Biol. Cell. 1990;68(2):139–146. doi: 10.1016/0248-4900(90)90299-I. [DOI] [PubMed] [Google Scholar]
- 204.Mor-Vaknin N., Punturieri A., Sitwala K., Markovitz D.M. Vimentin is secreted by activated macrophages. Nat. Cell Biol. 2003;5(1):59–63. doi: 10.1038/ncb898. [DOI] [PubMed] [Google Scholar]
- 205.Vivanco I., Palaskas N., Tran C., Finn S.P., Getz G., Kennedy N.J., Jiao J., Rose J., Xie W., Loda M., Golub T., Mellinghoff I.K., Davis R.J., Wu H., Sawyers C.L. Identification of the JNK signaling pathway as a functional target of the tumor suppressor PTEN. Cancer Cell. 2007;11(6):555–569. doi: 10.1016/j.ccr.2007.04.021. [DOI] [PubMed] [Google Scholar]
- 206.Rahman N., Arbour L., Tonin P., Renshaw J., Pelletier J., Baruchel S., Pritchard-Jones K., Stratton M.R., Narod S.A. Evidence for a familial Wilms’ tumour gene (FWT1) on chromosome 17q12-q21. Nat. Genet. 1996;13(4):461–463. doi: 10.1038/ng0896-461. [DOI] [PubMed] [Google Scholar]
- 207.Schwab E.D., Pienta K.J. Cancer as a complex adaptive system. Med. Hypotheses. 1996;47(3):235–241. doi: 10.1016/S0306-9877(96)90086-9. [DOI] [PubMed] [Google Scholar]
- 208.Gerlinger M., McGranahan N., Dewhurst S.M., Burrell R.A., Tomlinson I., Swanton C. Cancer: evolution within a lifetime. Annu. Rev. Genet. 2014;48:215–236. doi: 10.1146/annurev-genet-120213-092314. [DOI] [PubMed] [Google Scholar]
- 209.Arnedos M., Vielh P., Soria J.C., Andre F. The genetic complexity of common cancers and the promise of personalized medicine: is there any hope? J. Pathol. 2014;232(2):274–282. doi: 10.1002/path.4276. [DOI] [PubMed] [Google Scholar]
- 210.Silva E.N., Sousa T.R. Economic evaluation in the context of rare diseases: is it possible? Cad. Saude Publica. 2015;31(3):496–506. doi: 10.1590/0102-311X00213813. [DOI] [PubMed] [Google Scholar]
- 211.Potter B.K., Khangura S.D., Tingley K., Chakraborty P., Little J. Translating rare-disease therapies into improved care for patients and families: what are the right outcomes, designs, and engagement approaches in health-systems research? Genet. Med. 2015 doi: 10.1038/gim.2015.42. [Epub ahead of print]. [DOI] [PubMed] [Google Scholar]
- 212.Rodwell C., Aymé S. Rare disease policies to improve care for patients in Europe. 2015. [DOI] [PubMed]
- 213.Indrayan A. Medical biostatistics. 2012. [Google Scholar]
- 214.Hoadley K.A., Yau C., Wolf D.M., Cherniack A.D., Tamborero D., Ng S., Leiserson M.D., Niu B., McLellan M.D., Uzunangelov V., Zhang J., Kandoth C., Akbani R., Shen H., Omberg L., Chu A., Margolin A.A., Van’t Veer L.J., Lopez-Bigas N., Laird P.W., Raphael B.J., Ding L., Robertson A.G., Byers L.A., Mills G.B., Weinstein J.N., Van Waes C., Chen Z., Collisson E.A., Benz C.C., Perou C.M., Stuart J.M., Cancer Genome Atlas Research Network Multiplatform analysis of 12 cancer types reveals molecular classification within and across tissues of origin. Cell. 2014;158(4):929–944. doi: 10.1016/j.cell.2014.06.049. [DOI] [PMC free article] [PubMed] [Google Scholar]
- 215.Jevons S.J., Green A., Lunter G., Kartsonaki C., Buck D., Piazza P., Kiltie A.E. High-throughput DNA sequencing identifies novel CtIP (RBBP8) variants in muscle-invasive bladder cancer patients. Bladder Cancer. 2015;1(1):31–44. doi: 10.3233/BLC-150007. [DOI] [PMC free article] [PubMed] [Google Scholar]
- 216.Yu X., Baer R. Nuclear localization and cell cycle-specific expression of CtIP, a protein that associates with the BRCA1 tumor suppressor. J. Biol. Chem. 2000;275(24):18541–18549. doi: 10.1074/jbc.M909494199. [DOI] [PubMed] [Google Scholar]
- 217.Liu F., Lee W.H. CtIP activates its own and cyclin D1 promoters via the E2F/RB pathway during G1/S progression. Mol. Cell. Biol. 2006;26(8):3124–3134. doi: 10.1128/MCB.26.8.3124-3134.2006. [DOI] [PMC free article] [PubMed] [Google Scholar]
- 218.Katoh Y., Katoh M. Identification and characterization of DISP3 gene in silico. Int. J. Oncol. 2005;26(2):551–556. [PubMed] [Google Scholar]
- 219.Katoh M. WNT and FGF gene clusters (review). Int. J. Oncol. 2002;21(6):1269–1273. [review]. [PubMed] [Google Scholar]
- 220.Latif Z., Watters A.D., Dunn I., Grigor K.M., Underwood M.A., Bartlett J.M. HER2/neu overexpression in the development of muscle-invasive transitional cell carcinoma of the bladder. Br. J. Cancer. 2003;89(7):1305–1309. doi: 10.1038/sj.bjc.6601245. [DOI] [PMC free article] [PubMed] [Google Scholar]
- 221.Coogan C.L., Estrada C.R., Kapur S., Bloom K.J. HER-2/neu protein overexpression and gene amplification in human transitional cell carcinoma of the bladder. Urology. 2004;63(4):786–790. doi: 10.1016/j.urology.2003.10.040. [DOI] [PubMed] [Google Scholar]
- 222.Ren B., Li W., Yang Y., Wu S. The impact of cyclin D1 overexpression on the prognosis of bladder cancer: a meta-analysis. World J. Surg. Oncol. 2014;12:55. doi: 10.1186/1477-7819-12-55. [DOI] [PMC free article] [PubMed] [Google Scholar]
- 223.Liu J.Y., Li Y.H., Lin H.X., Liao Y.J., Mai S.J., Liu Z.W., Zhang Z.L., Jiang L.J., Zhang J.X., Kung H.F., Zeng Y.X., Zhou F.J., Xie D. Overexpression of YAP 1 contributes to progressive features and poor prognosis of human urothelial carcinoma of the bladder. BMC Cancer. 2013;13:349. doi: 10.1186/1471-2407-13-349. [DOI] [PMC free article] [PubMed] [Google Scholar]
- 224.Gao Y., Shi Q., Xu S., Du C., Liang L., Wu K., Wang K., Wang X., Chang L.S., He D., Guo P. Curcumin promotes KLF5 proteasome degradation through downregulating YAP/TAZ in bladder cancer cells. Int. J. Mol. Sci. 2014;15(9):15173–15187. doi: 10.3390/ijms150915173. [DOI] [PMC free article] [PubMed] [Google Scholar]
- 225.Sacristan R., Gonzalez C., Fernández-Gómez J.M., Fresno F., Escaf S., Sánchez-Carbayo M. Molecular classification of non-muscle-invasive bladder cancer (pTa low-grade, pT1 low-grade, and pT1 high-grade subgroups) using methylation of tumor-suppressor genes. J. Mol. Diagn. 2014;16(5):564–572. doi: 10.1016/j.jmoldx.2014.04.007. [DOI] [PubMed] [Google Scholar]
- 226.Nickerson M.L., Dancik G.M., Im K.M., Edwards M.G., Turan S., Brown J., Ruiz-Rodriguez C., Owens C., Costello J.C., Guo G., Tsang S.X., Li Y., Zhou Q., Cai Z., Moore L.E., Lucia M.S., Dean M., Theodorescu D. Concurrent alterations in TERT, KDM6A, and the BRCA pathway in bladder cancer. Clin. Cancer Res. 2014;20(18):4935–4948. doi: 10.1158/1078-0432.CCR-14-0330. [DOI] [PMC free article] [PubMed] [Google Scholar]
- 227.Pinto-Leite R., Carreira I., Melo J., Ferreira S.I., Ribeiro I., Ferreira J., Filipe M., Bernardo C., Arantes-Rodrigues R., Oliveira P., Santos L. Genomic characterization of three urinary bladder cancer cell lines: understanding genomic types of urinary bladder cancer. Tumour Biol. 2014;35(5):4599–4617. doi: 10.1007/s13277-013-1604-3. [DOI] [PubMed] [Google Scholar]
- 228.Iyer G., Al-Ahmadie H., Schultz N., Hanrahan A.J., Ostrovnaya I., Balar A.V., Kim P.H., Lin O., Weinhold N., Sander C., Zabor E.C., Janakiraman M., Garcia-Grossman I.R., Heguy A., Viale A., Bochner B.H., Reuter V.E., Bajorin D.F., Milowsky M.I., Taylor B.S., Solit D.B. Prevalence and co-occurrence of actionable genomic alterations in high-grade bladder cancer. J. Clin. Oncol. 2013;31(25):3133–3140. doi: 10.1200/JCO.2012.46.5740. [DOI] [PMC free article] [PubMed] [Google Scholar]
- 229.Mudryj M., Reay E., Beckett L., Dandekar S., deVere White R., Gandour-Edwards R. Novel p53/p130 axis in bladder tumors. Urology. 2007;70(3):608–612. doi: 10.1016/j.urology.2007.05.002. [DOI] [PubMed] [Google Scholar]
- 230.He F., Mo L., Zheng X.Y., Hu C., Lepor H., Lee E.Y., Sun T.T., Wu X.R. Deficiency of pRb family proteins and p53 in invasive urothelial tumorigenesis. Cancer Res. 2009;69(24):9413–9421. doi: 10.1158/0008-5472.CAN-09-2158. [DOI] [PMC free article] [PubMed] [Google Scholar]
- 231.Feber A., Clark J., Goodwin G., Dodson A.R., Smith P.H., Fletcher A., Edwards S., Flohr P., Falconer A., Roe T., Kovacs G., Dennis N., Fisher C., Wooster R., Huddart R., Foster C.S., Cooper C.S. Amplification and overexpression of E2F3 in human bladder cancer. Oncogene. 2004;23(8):1627–1630. doi: 10.1038/sj.onc.1207274. [DOI] [PubMed] [Google Scholar]
- 232.Human pathology website. RMS: www.humpath.com/spip.php? article1956; MRT: www.humpath.com/spip.php?article1956. (Accessed June 26, 2015). 1956.
- 233.de Bono J.S., Ashworth A. Translating cancer research into targeted therapeutics. Nature. 2010;467(7315):543–549. doi: 10.1038/nature09339. [DOI] [PubMed] [Google Scholar]
- 234.Jekunen A. Clinicians’ expectations for gene-driven cancer therapy. Clin. Med. Insights Oncol. 2014;8:159–164. doi: 10.4137/CMO.S20737. [DOI] [PMC free article] [PubMed] [Google Scholar]
- 235.Du W., Elemento O. Cancer systems biology: embracing complexity to develop better anticancer therapeutic strategies. Oncogene. 2015;34(25):3215–3225. doi: 10.1038/onc.2014.291. [DOI] [PubMed] [Google Scholar]
- 236.Cancer Genome Atlas Research Network Comprehensive molecular characterization of urothelial bladder carcinoma. Nature. 2014;507(7492):315–322. doi: 10.1038/nature12965. [DOI] [PMC free article] [PubMed] [Google Scholar]
- 237.Choi W., Porten S., Kim S., Willis D., Plimack E.R., Hoffman-Censits J., Roth B., Cheng T., Tran M., Lee I.L., Melquist J., Bondaruk J., Majewski T., Zhang S., Pretzsch S., Baggerly K., Siefker-Radtke A., Czerniak B., Dinney C.P., McConkey D.J. Identification of distinct basal and luminal subtypes of muscle-invasive bladder cancer with different sensitivities to frontline chemotherapy. Cancer Cell. 2014;25(2):152–165. doi: 10.1016/j.ccr.2014.01.009. [DOI] [PMC free article] [PubMed] [Google Scholar]
Associated Data
This section collects any data citations, data availability statements, or supplementary materials included in this article.
Supplementary Materials
Supplementary material is available on the publishers Web site along with the published article.